Basics of Economic Data
|
|
|
- Christian Cannon
- 5 years ago
- Views:
Transcription
1 Basics of Economic Data Between the Decennial Census Years Community and Regional Planning 511: Mar Kevin Kargacin University of New Mexico Bureau of Business and Economic Research
2 Basics of Economic Data Background Industry Codes Geographic Areas Key Topics Work Force Personal Income Business Data Establishments, employment, payroll, production
3 Background Industry Coding Schemes Standard Industrial Classification (SIC) System Old scheme used for more than 60 years Goods-producing sectors emphasized Total of 11 broad categories Four-digit coding scheme North American Industry Classification System NAICS New scheme Nine new, broad service sectors More than 350 new individual industries Total of 20 broad categories Six-digit coding scheme
4 Background Industry Coding Schemes SIC Terminology Division Major Group Industry Group Industry 1-Digit Code 2-Digit Code 3-Digit Code 4-Digit Code
5 Background Industry Coding Schemes SIC Example Code Description Term I Services Division 80 Health Services Major Group 809 Miscellaneous Health and Allied Industry Group Services, Not Elsewhere Classified 8093 Specialty Outpatient Facilities, Industry Not Elsewhere Classified
6 Background Industry Coding Schemes SIC Divisions Code A B C D E F G H I J K Description Agriculture, Forestry & Fishing Mining Construction Manufacturing Transportation, Communications, Electric, Gas & Sanitary Services Wholesale Trade Retail Trade Finance, Insurance & Real Estate Services Public Administration Nonclassifiable Establishments
7 Background Industry Coding Schemes NAICS Terminology Sector Subsector Industry Group NAICS Industry US Industry 2-Digit Code 3-Digit Code 4-Digit Code 5-Digit Code 6-Digit Code
8 Background Industry Coding Schemes NAICS Example Code Description Term 62 Health Care & Social Assistance Sector 621 Ambulatory Health Care Services Subsector 6214 Outpatient Care Centers Industry Group Mental Health & Substance Abuse NAICS Industry Mental Health & Substance Abuse US Industry
9 Background NAICS Sectors Industry Coding Schemes Code Description 11 Agriculture, Forestry, Fishing & Hunting 21 Mining 22 Utilities 23 Construction Manufacturing 42 Wholesale Trade Retail Trade Transportation & Warehousing 51 Information 52 Finance & Insurance 53 Real Estate & Rental & Leasing
10 Background Industry Coding Schemes NAICS Sectors (continued) Code Description 54 Professional, Scientific & Technical Services 55 Management of Companies & Enterprises 56 Administrative & Support, Waste Management & Remediation Services 61 Educational Services 62 Health Care and Social Assistance 71 Arts, Entertainment & Recreation 72 Accommodation & Food Services 81 Other Services 92 Public Administration
11 Background Geography Legal areas U.S. States Counties Cities Unincorporated County Balances Statistical areas Metro Areas ZIP Codes
12 Work Force Selected Key Sources NM Dept. of Labor (NMDOL) US Bureau of Economic Analysis (BEA)
13 Work Force Databases Employment (jobs): Broad sectors and subsectors Detailed industries Class of worker Civilian or military Wage & salary workers or self-employed Government or private Labor force status Employed, unemployed, not in labor force
14 Work Force NMDOL Jobs Current Employment Statistics (CES) Persons on employer payrolls wage/salary workers Note: Double job holders are counted twice Broad sectors and some subsectors and industries Place of work basis Monthly State and metro areas Excludes Self-employed Unpaid family workers or volunteers Agricultural workers Domestic household workers Military
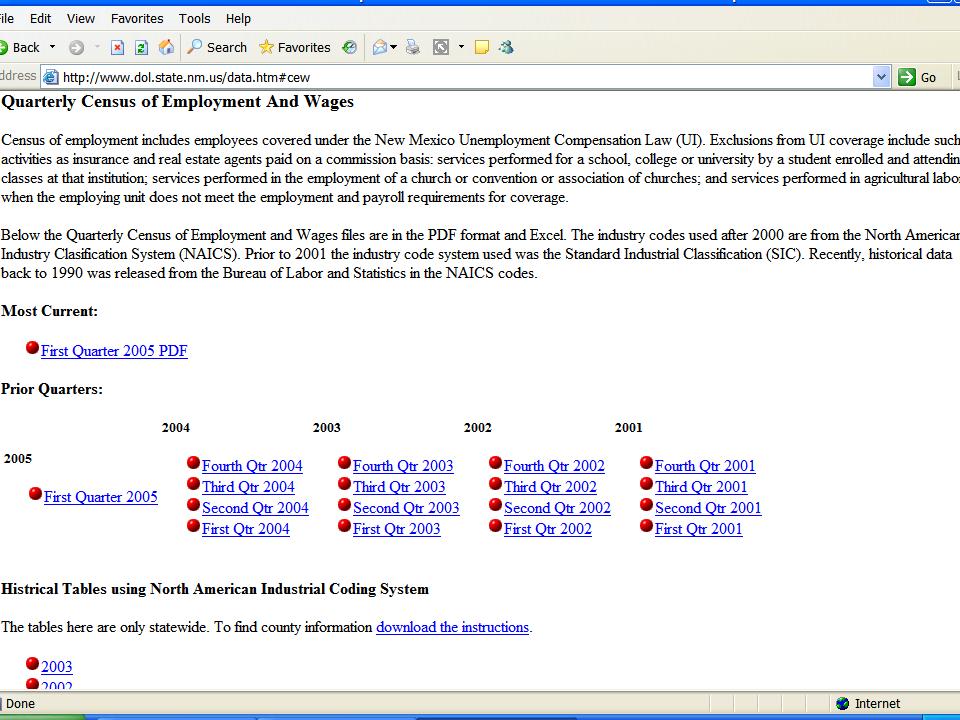
15 Work Force NMDOL Jobs Quarterly Census of Employment & Wages (QCEW) Persons on covered employer payrolls wage/salary workers Note: Double job holders are counted twice Subsectors (industries in some tabulations) Place of work basis Quarterly State and counties Includes Private sector employees covered under NM Unemployment Compensation Law (UI). Workers in households, non-profits, most local, state and federal govt. workers, and parts of the agricultural sector.
16 Work Force NMDOL Jobs QCEW (continued) Excludes Self-employed Unpaid volunteers or family workers Some agricultural workers Military Insurance and real estate agents on commission Services performed for an educational institution by a student enrolled and attending classes at that institution Services performed in the employment of a church Employees of Los Alamos National Laboratory Most railroad workers
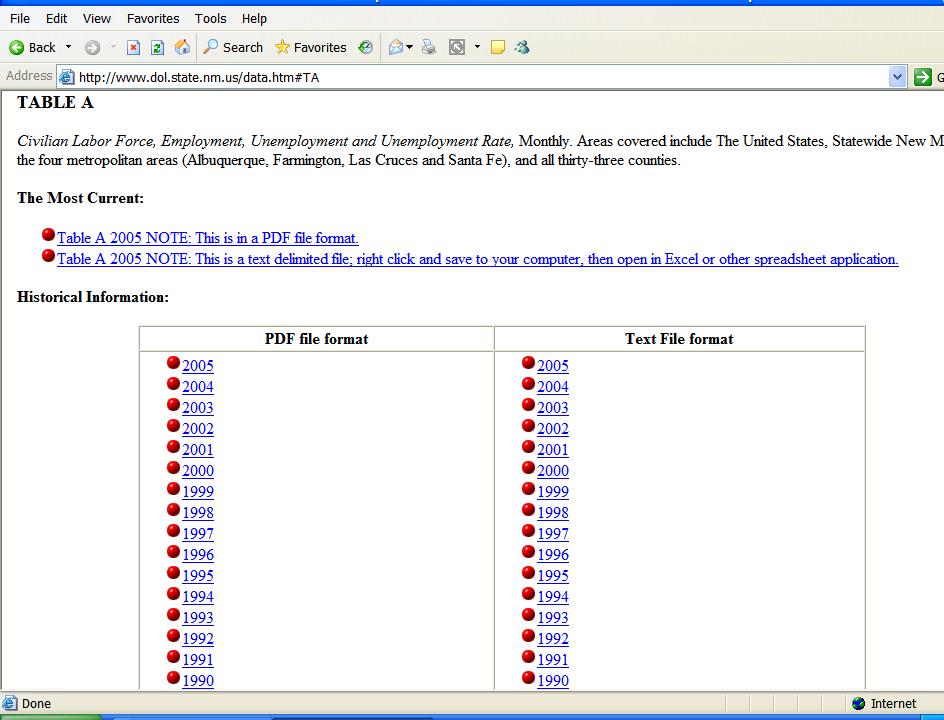
17 Work Force NMDOL Labor Force Status Local Area Unemployment Statistics (LAUS/Table A) Persons that are employed Includes Wage and salary workers Self employed Agricultural workers Unpaid workers (worked 15 hrs. or more) in a family business Excludes military No sector breakdown Persons that are unemployed not working, but looking for work within the last four weeks Place of residence basis Monthly State, county and metro areas
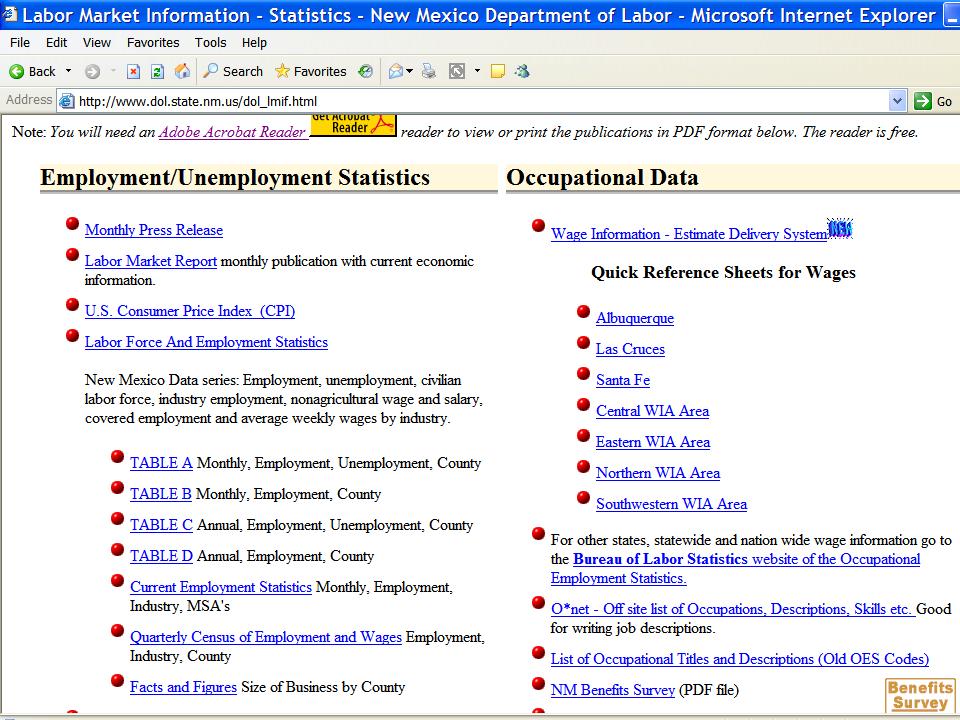
18 Work Force NMDOL Data Access NMDOL data at:
19

20

21
22
23
24
25 Work Force BEA Jobs Full- and part-time employment Persons on employer payrolls Note: Double job holders are counted twice Broad sectors (counties) and subsectors (state) Place of work basis Annual State, counties and metro areas Two series Total full- and part-time employment includes self-employed along with wage and salary workers Full- and part-time wage and salary employment Includes covered, non-covered and military
26 Work Force BEA Jobs Access BEA data at:
27
28
29
30 Personal Income BEA Database Types of Income Earnings by subsector Wage & salary disbursements Supplements to wages & salaries Proprietors income Dividends, interest & rent Transfer receipts Social security TANF (welfare) Food stamps Medicaid and Medicare Etc.
31 Personal Income BEA Database Geography and time periods U.S. & states annually and quarterly Counties annually Metro areas annually
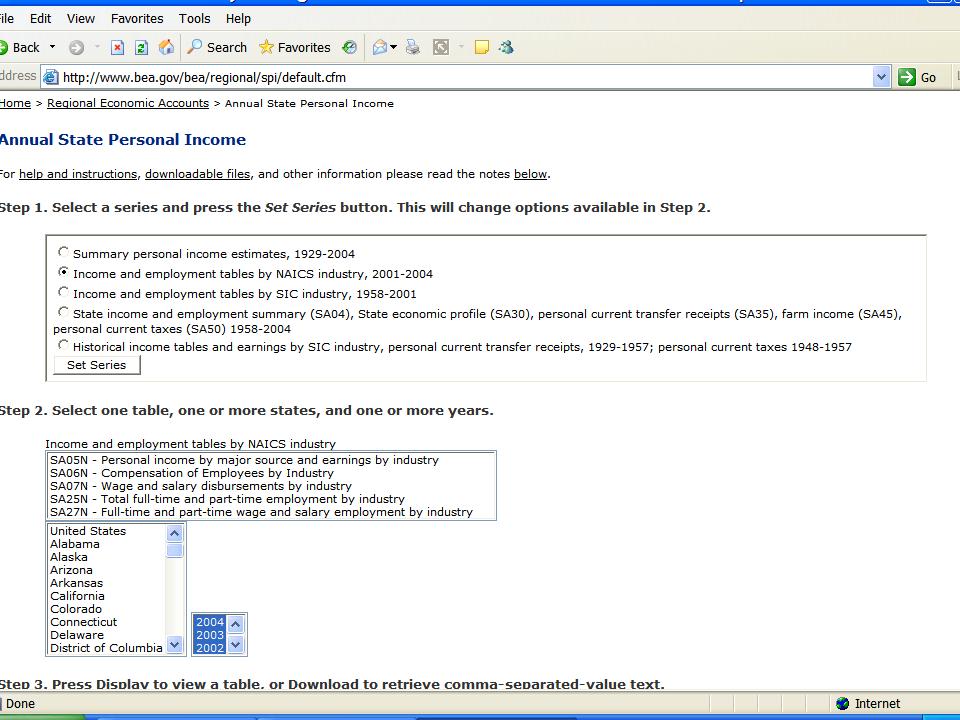
32 Personal Income BEA Income Tables U.S. and States Summary personal income estimates Income & employment summary (SA04 & SQ04) Income by major source and earnings by industry (SA05 & SQ05) Compensation of employees by industry (SA06 & SQ06) Wage & salary disbursements by industry (SA07 & SQ07) Economic profiles (SA30) Transfer receipts by type (SA35) Farm income and expenses (SA45) Personal current taxes (SA50)
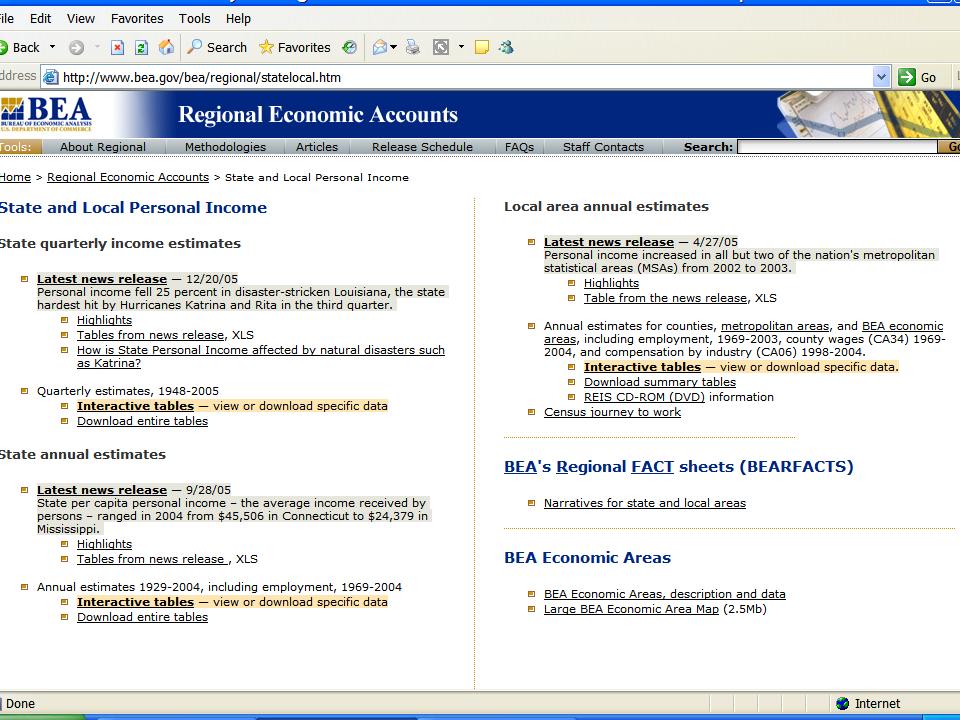
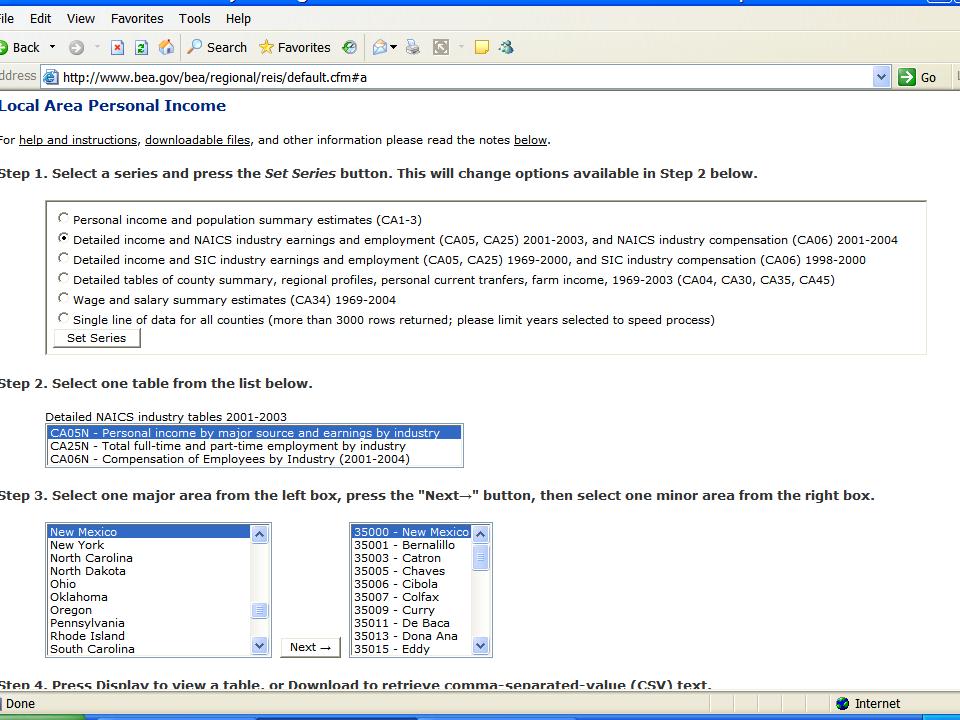
33 Personal Income BEA Income Tables Counties and Metro Areas Population and summary estimates (CA1-3) Income and employment summary (CA04) Income by major source & earnings by industry (CA05) Compensation of employees by industry (CA06) Economic profile (CA30) Wage & salary summary estimates (CA34) Transfer receipts by type (CA35) Farm income and expenses (CA45)
34
35
36
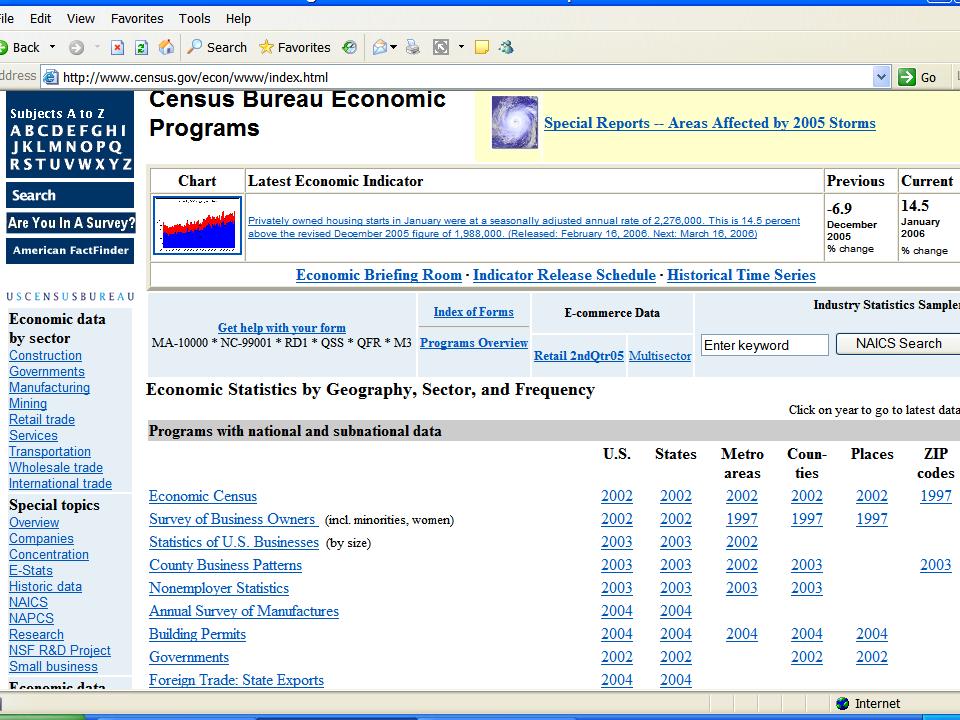
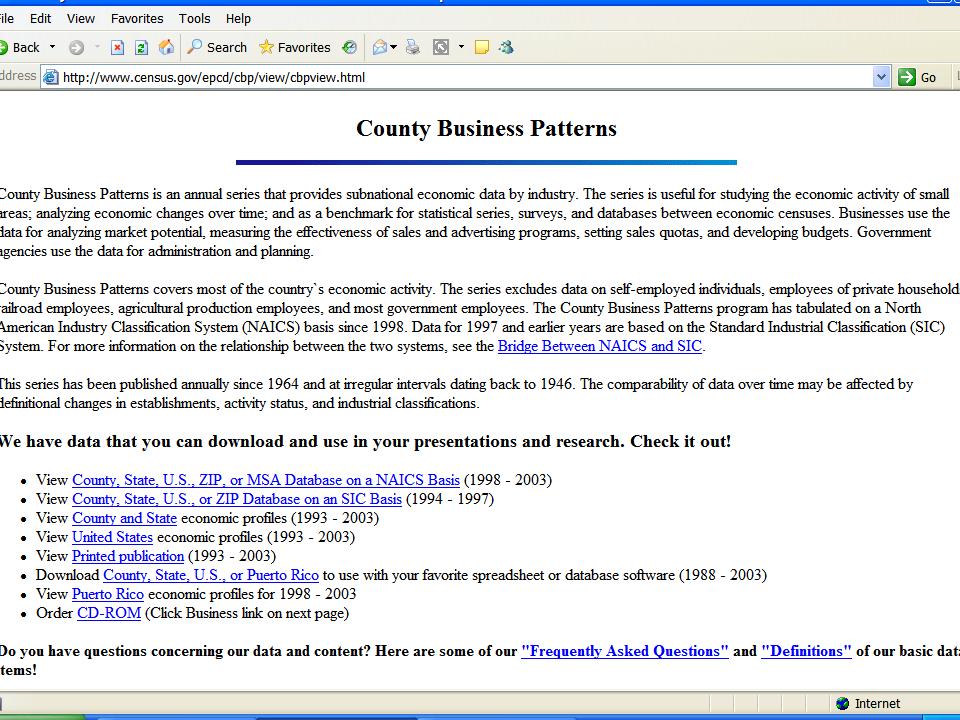
37 Business Data Census Bureau Business Patterns Establishments Physical locations With a payroll at some time during the year Excludes Establishments consisting only of self-employed (i.e., no paid employees) Most government establishments, except hospitals, governmentoperated liquor stores, Federal Reserve Bank branches Railroads Businesses devoted to agricultural production Certain businesses in the funds, trusts, and other financial vehicles sector. Establishments tabulated by employment-size classes
38 Business Data Census Bureau Business Patterns Employment Employees on the payroll as of mid-march. Excludes Employees is establishments listed in previous slide Domestic servants
39 Business Data Census Bureau Business Patterns Payroll First quarter Annual
40 Business Data Census Bureau Business Patterns Access Census Bureau Business Data at

41
42
43
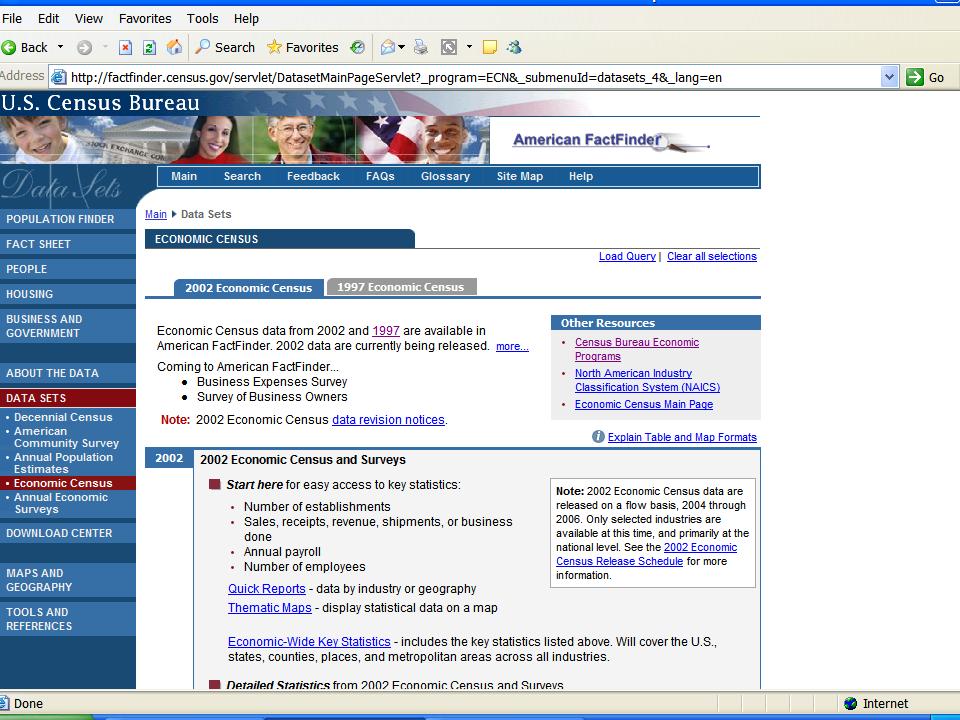
44 Business Data Census Bureau Economic Census Establishments Employees Mid-March and other periods for some sectors Nonemployers Payroll Production measures Sales, receipts, or value of shipments Special subjects
45

46
47
48
49 Business Data Census Bureau Geography Business patterns States, metro areas, counties, ZIP Codes Economic Census (varies by NAICS sector) State, metro areas, counties, cities, unincorporated areas, ZIP Codes
50 Business Data Census Bureau Time Periods Business Patterns annually Economic Census every five years Nonemployer at time of economic census and annually
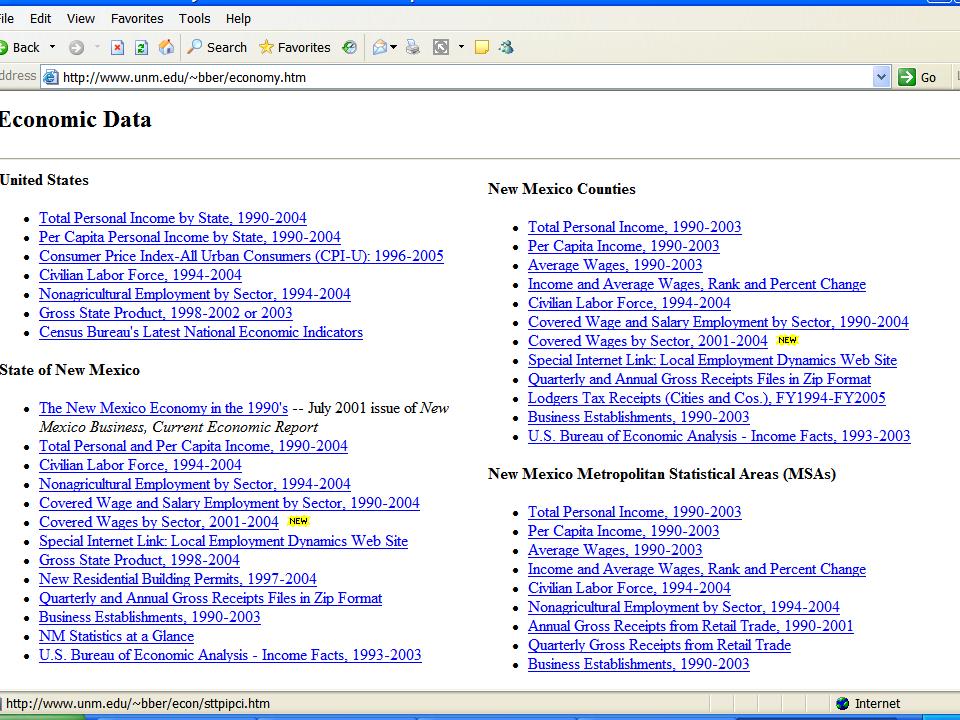
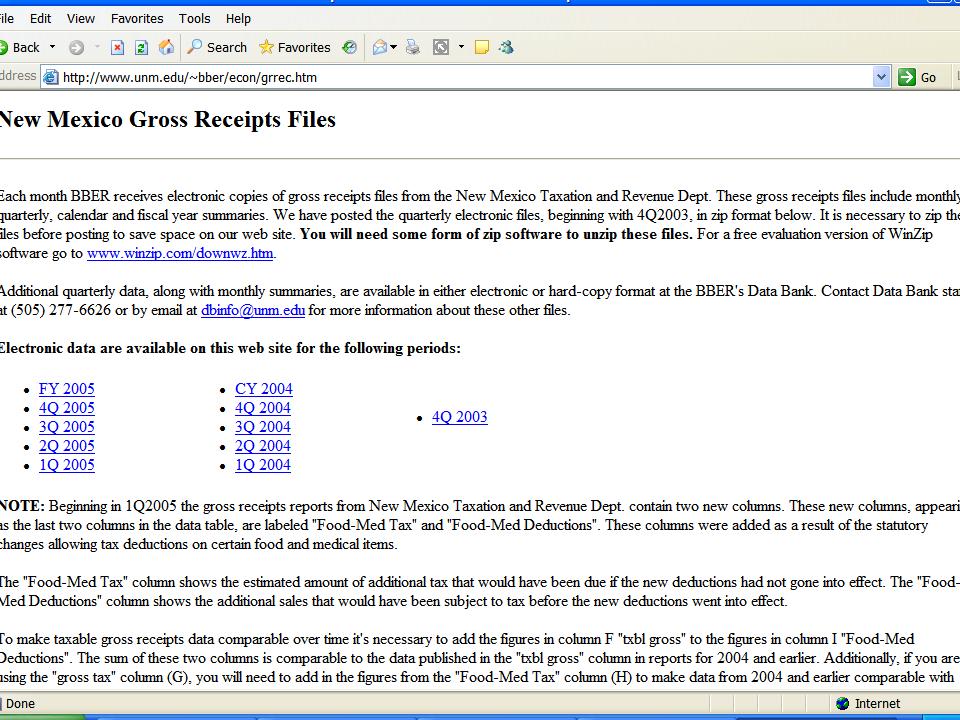
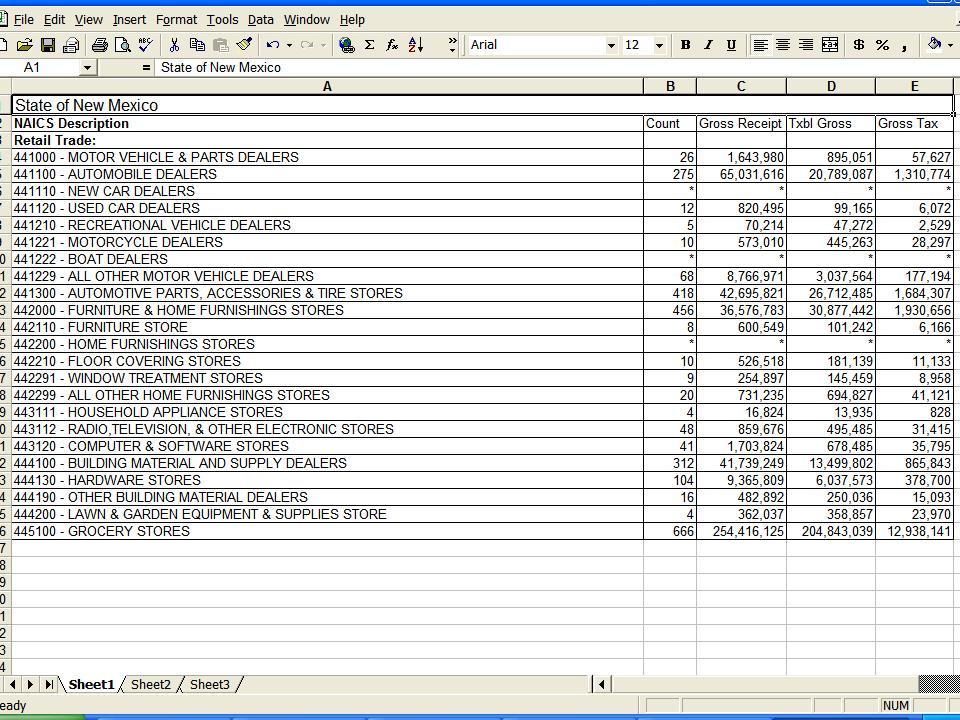
51 Business Data NM Taxation & Revenue Dept. Gross Receipts: RP-80 A measure of production Defined as the total amount of money or value of other consideration received from: Selling property in NM Leasing property employed in NM Performing services in NM
52 Business Data NM Taxation & Revenue Dept. Gross Receipts: RP-80 Data by industry: Total reported gross receipts Taxable gross receipts Gross tax due Data subject to gross receipts tax law Time periods: monthly, quarterly, annually Geography: state, whole counties, incorporated cities, unincorporated county balances
53 Business Data NM Taxation & Revenue Dept. Gross Receipts: RP-80 Access NMTRD gross receipts data at:

54
55
56
57
58 Basics of Economic Data Revisions and Consistency Many sources revise time series data Incorporate all revisions into your data set If you use variables that are from different databases, be aware of differences in concepts among databases. NAICS often not consistent with SIC. Some government agencies are revising time series data in terms of NAICS
American Community Survey 5-Year Estimates
 DP03 SELECTED ECONOMIC CHARACTERISTICS 2013-2017 American Community Survey 5-Year Estimates Supporting documentation on code lists, subject definitions, data accuracy, and statistical testing can be found
Tell us what you think. Provide feedback to help make American Community Survey data more useful for you.
 DP03 SELECTED ECONOMIC CHARACTERISTICS 2016 American Community Survey 1-Year Estimates Supporting documentation on code lists, subject definitions, data accuracy, and statistical testing can be found on
American Community Survey 5-Year Estimates
 DP03 SELECTED ECONOMIC CHARACTERISTICS 2012-2016 American Community Survey 5-Year Estimates Supporting documentation on code lists, subject definitions, data accuracy, and statistical testing can be found
American Community Survey 5-Year Estimates
 DP03 SELECTED ECONOMIC CHARACTERISTICS 2012-2016 American Community Survey 5-Year Estimates Supporting documentation on code lists, subject definitions, data accuracy, and statistical testing can be found
American Community Survey 5-Year Estimates
 DP03 SELECTED ECONOMIC CHARACTERISTICS 2012-2016 American Community Survey 5-Year Estimates Supporting documentation on code lists, subject definitions, data accuracy, and statistical testing can be found
American Community Survey 5-Year Estimates
 DP03 SELECTED ECONOMIC CHARACTERISTICS 2012-2016 American Community Survey 5-Year Estimates Supporting documentation on code lists, subject definitions, data accuracy, and statistical testing can be found
American Community Survey 5-Year Estimates
 DP03 SELECTED ECONOMIC CHARACTERISTICS 2012-2016 American Community Survey 5-Year Estimates Supporting documentation on code lists, subject definitions, data accuracy, and statistical testing can be found
American Community Survey 5-Year Estimates
 DP03 SELECTED ECONOMIC CHARACTERISTICS 2012-2016 American Community Survey 5-Year Estimates Supporting documentation on code lists, subject definitions, data accuracy, and statistical testing can be found
American Community Survey 5-Year Estimates
 DP03 SELECTED ECONOMIC CHARACTERISTICS 2012-2016 American Community Survey 5-Year Estimates Supporting documentation on code lists, subject definitions, data accuracy, and statistical testing can be found
American Community Survey 5-Year Estimates
 DP03 SELECTED ECONOMIC CHARACTERISTICS 2012-2016 American Community Survey 5-Year Estimates Supporting documentation on code lists, subject definitions, data accuracy, and statistical testing can be found
American Community Survey 5-Year Estimates
 DP03 SELECTED ECONOMIC CHARACTERISTICS 2012-2016 American Community Survey 5-Year Estimates Supporting documentation on code lists, subject definitions, data accuracy, and statistical testing can be found
American Community Survey 5-Year Estimates
 DP03 SELECTED ECONOMIC CHARACTERISTICS 2012-2016 American Community Survey 5-Year Estimates Supporting documentation on code lists, subject definitions, data accuracy, and statistical testing can be found
American Community Survey 5-Year Estimates
 DP03 SELECTED ECONOMIC CHARACTERISTICS 2012-2016 American Community Survey 5-Year Estimates Supporting documentation on code lists, subject definitions, data accuracy, and statistical testing can be found
American Community Survey 5-Year Estimates
 DP03 SELECTED ECONOMIC CHARACTERISTICS 2012-2016 American Community Survey 5-Year Estimates Supporting documentation on code lists, subject definitions, data accuracy, and statistical testing can be found
American Community Survey 5-Year Estimates
 DP03 SELECTED ECONOMIC CHARACTERISTICS 2012-2016 American Community Survey 5-Year Estimates Supporting documentation on code lists, subject definitions, data accuracy, and statistical testing can be found
American Community Survey 5-Year Estimates
 DP03 SELECTED ECONOMIC CHARACTERISTICS 2012-2016 American Community Survey 5-Year Estimates Supporting documentation on code lists, subject definitions, data accuracy, and statistical testing can be found
American Community Survey 5-Year Estimates
 DP03 SELECTED ECONOMIC CHARACTERISTICS 2012-2016 American Community Survey 5-Year Estimates Supporting documentation on code lists, subject definitions, data accuracy, and statistical testing can be found
American Community Survey 5-Year Estimates
 DP03 SELECTED ECONOMIC CHARACTERISTICS 2012-2016 American Community Survey 5-Year Estimates Supporting documentation on code lists, subject definitions, data accuracy, and statistical testing can be found
American Community Survey 5-Year Estimates
 DP03 SELECTED ECONOMIC CHARACTERISTICS 2012-2016 American Community Survey 5-Year Estimates Supporting documentation on code lists, subject definitions, data accuracy, and statistical testing can be found
American Community Survey 5-Year Estimates
 DP03 SELECTED ECONOMIC CHARACTERISTICS 2012-2016 American Community Survey 5-Year Estimates Supporting documentation on code lists, subject definitions, data accuracy, and statistical testing can be found
American Community Survey 5-Year Estimates
 DP03 SELECTED ECONOMIC CHARACTERISTICS 2012-2016 American Community Survey 5-Year Estimates Supporting documentation on code lists, subject definitions, data accuracy, and statistical testing can be found
American Community Survey 5-Year Estimates
 DP03 SELECTED ECONOMIC CHARACTERISTICS 2012-2016 American Community Survey 5-Year Estimates Supporting documentation on code lists, subject definitions, data accuracy, and statistical testing can be found
American Community Survey 5-Year Estimates
 DP03 SELECTED ECONOMIC CHARACTERISTICS 2012-2016 American Community Survey 5-Year Estimates Supporting documentation on code lists, subject definitions, data accuracy, and statistical testing can be found
American Community Survey 5-Year Estimates
 DP03 SELECTED ECONOMIC CHARACTERISTICS 2012-2016 American Community Survey 5-Year Estimates Supporting documentation on code lists, subject definitions, data accuracy, and statistical testing can be found
American Community Survey 5-Year Estimates
 DP03 SELECTED ECONOMIC CHARACTERISTICS 2012-2016 American Community Survey 5-Year Estimates Supporting documentation on code lists, subject definitions, data accuracy, and statistical testing can be found
American Community Survey 5-Year Estimates
 DP03 SELECTED ECONOMIC CHARACTERISTICS 2012-2016 American Community Survey 5-Year Estimates Supporting documentation on code lists, subject definitions, data accuracy, and statistical testing can be found
American Community Survey 5-Year Estimates
 DP03 SELECTED ECONOMIC CHARACTERISTICS 2012-2016 American Community Survey 5-Year Estimates Supporting documentation on code lists, subject definitions, data accuracy, and statistical testing can be found
American Community Survey 5-Year Estimates
 DP03 SELECTED ECONOMIC CHARACTERISTICS 2012-2016 American Community Survey 5-Year Estimates Supporting documentation on code lists, subject definitions, data accuracy, and statistical testing can be found
The Economic Base of Valencia County, NM. PREPARED BY: The Office of Policy Analysis at Arrowhead Center, New Mexico State University.
 The Economic Base of Valencia County, NM PREPARED BY: The Office of Policy Analysis at Arrowhead Center, New Mexico State University DATE: July 2017 DATE: September 2013 The Economic Base of Valencia County,
The Economic Base of San Miguel County, NM. PREPARED BY: The Office of Policy Analysis at Arrowhead Center, New Mexico State University
 The Economic Base of San Miguel County, NM PREPARED BY: The Office of Policy Analysis at Arrowhead Center, New Mexico State University DATE: July 2015 The Economic Base of San Miguel County, New Mexico
The Economic Base of Rio Arriba County, NM. PREPARED BY: The Office of Policy Analysis at Arrowhead Center, New Mexico State University
 The Economic Base of Rio Arriba County, NM PREPARED BY: The Office of Policy Analysis at Arrowhead Center, New Mexico State University DATE: July 2015 The Economic Base of Rio Arriba County, New Mexico
The Economic Base of Sandoval County, NM. PREPARED BY: The Office of Policy Analysis at Arrowhead Center, New Mexico State University.
 The Economic Base of Sandoval County, NM PREPARED BY: The Office of Policy Analysis at Arrowhead Center, New Mexico State University DATE: July 2015 The Economic Base of Sandoval County, New Mexico Introduction
The Economic Base of Rio Arriba County, NM. PREPARED BY: The Office of Policy Analysis at Arrowhead Center, New Mexico State University
 The Economic Base of Rio Arriba County, NM PREPARED BY: The Office of Policy Analysis at Arrowhead Center, New Mexico State University DATE: July 2017 The Economic Base of Rio Arriba County, New Mexico
Industry Overview. Austin Community College. Emsi Q Data Set. June Emsi Q Data Set
 Industry Overview Emsi Q2 2017 Data Set June 2017 Austin Community College 5930 Middle Fiskville Road Austin, Texas 78752 (512) 223.5100 Emsi Q2 2017 Data Set www.economicmodeling.com Page 1/8 Parameters
The Economic. Impact of Veteran-Owned. Franchise. August 30, 2011
 www.pwc.com/us/nes The Economic Impact of Veteran-Owned Franchisess The Economic Impact of Veteran-Owned Franchises August 30, 2011 Prepared for The International Franchise Association Educational Foundation
The Economic Base of Sandoval County, NM. PREPARED BY: The Office of Policy Analysis at Arrowhead Center, New Mexico State University.
 The Economic Base of Sandoval County, NM PREPARED BY: The Office of Policy Analysis at Arrowhead Center, New Mexico State University DATE: July 2016 The Economic Base of Sandoval County, New Mexico Introduction
The Economic Base of Doña Ana County, NM. PREPARED BY: The Office of Policy Analysis at Arrowhead Center, New Mexico State University.
 The Economic Base of Doña Ana County, NM PREPARED BY: The Office of Policy Analysis at Arrowhead Center, New Mexico State University DATE: July 2015 The Economic Base of Doña Ana County, New Mexico Introduction
The Economic Base of Rio Arriba County, NM. PREPARED BY: The Office of Policy Analysis at Arrowhead Center, New Mexico State University
 The Economic Base of Rio Arriba County, NM PREPARED BY: The Office of Policy Analysis at Arrowhead Center, New Mexico State University DATE: July 2016 The Economic Base of Rio Arriba County, New Mexico
The Economic Base of Doña Ana County, NM. PREPARED BY: The Office of Policy Analysis at Arrowhead Center, New Mexico State University.
 The Economic Base of Doña Ana County, NM PREPARED BY: The Office of Policy Analysis at Arrowhead Center, New Mexico State University DATE: July 2017 The Economic Base of Doña Ana County, New Mexico Introduction
The Economic Base of Curry County, NM. PREPARED BY: The Office of Policy Analysis at Arrowhead Center, New Mexico State University.
 The Economic Base of Curry County, NM PREPARED BY: The Office of Policy Analysis at Arrowhead Center, New Mexico State University DATE: July 2016 The Economic Base of Curry County, New Mexico Introduction
The Economic Base of Curry County, NM. PREPARED BY: The Office of Policy Analysis at Arrowhead Center, New Mexico State University.
 The Economic Base of Curry County, NM PREPARED BY: The Office of Policy Analysis at Arrowhead Center, New Mexico State University DATE: July 2015 The Economic Base of Curry County, New Mexico Introduction
The Economic Base of Bernalillo County, NM. PREPARED BY: The Office of Policy Analysis at Arrowhead Center, New Mexico State University
 The Economic Base of Bernalillo County, NM PREPARED BY: The Office of Policy Analysis at Arrowhead Center, New Mexico State University DATE: July 2017 The Economic Base of Bernalillo County, New Mexico
Economy Overview. Colorado Workforce Centers. 6 Colorado ZIPs. Emsi Q Data Set. April th Street Denver, Colorado
 Economy Overview 6 Colorado ZIPs Emsi Q1 2017 Data Set April 2017 Colorado Workforce Centers 633 17th Street Denver, Colorado 80202 303.503.2739 Emsi Q1 2017 Data Set www.economicmodeling.com 1 Parameters
The Economic Base of Quay County, NM. PREPARED BY: The Office of Policy Analysis at Arrowhead Center, New Mexico State University.
 The Economic Base of Quay County, NM PREPARED BY: The Office of Policy Analysis at Arrowhead Center, New Mexico State University DATE: July 2015 The Economic Base of Quay County, New Mexico Introduction
The Economic Base of San Juan County, NM. PREPARED BY: The Office of Policy Analysis at Arrowhead Center, New Mexico State University.
 The Economic Base of San Juan County, NM PREPARED BY: The Office of Policy Analysis at Arrowhead Center, New Mexico State University DATE: July 2015 The Economic Base of San Juan County, New Mexico Introduction
The Economic Base of Eddy County, NM. PREPARED BY: The Office of Policy Analysis at Arrowhead Center, New Mexico State University.
 The Economic Base of Eddy County, NM PREPARED BY: The Office of Policy Analysis at Arrowhead Center, New Mexico State University DATE: July 2013 The Economic Base of Eddy County, New Mexico Introduction
The Economic Base of the Albuquerque, NM, Metropolitan Statistical Area
 The Economic Base of the Albuquerque, NM, Metropolitan Statistical Area PREPARED BY: The Office of Policy Analysis at Arrowhead Center, New Mexico State University DATE: July 2015 The Economic Base of
The Economic Base of Bernalillo County, NM. PREPARED BY: The Office of Policy Analysis at Arrowhead Center, New Mexico State University
 The Economic Base of Bernalillo County, NM PREPARED BY: The Office of Policy Analysis at Arrowhead Center, New Mexico State University DATE: July 2016 The Economic Base of Bernalillo County, New Mexico
Reference Point May 2015
 T. Rowe Price Defined Contribution Plan Data As of December 31, Insights It s evident participants are taking advantage of the loan feature in 401(k) plans. Currently, one-fourth of participants who can
The Economic Base of the Albuquerque, NM, Metropolitan Statistical Area
 The Economic Base of the Albuquerque, NM, Metropolitan Statistical Area PREPARED BY: The Office of Policy Analysis at Arrowhead Center, New Mexico State University DATE: July 2016 The Economic Base of
Economic Profile. Capital Crossroads. a vision forward
 Economic Profile Capital a vision forward This profile was prepared by: Liesl Eathington Department of Economics State University phone: (515) 294 2954 email: leathing@iastate.edu 5/23/2012 Distribution
Small Businesses in Broward There are 33,400 small businesses in Broward County, which provide 135,000 jobs and have a combined payroll of $4 billion.
 Planning Services Division February 2006 Number 43 Small Businesses in Broward There are 33,400 small businesses in Broward County, which provide 135,000 jobs and have a combined payroll of $4 billion.
SOUTH DAKOTA KIDS COUNT BEACOM SCHOOL OF BUSINESS UNIVERSITY OF SOUTH DAKOTA 414 E. CLARK STREET VERMILLION, SD
 Brookings County Compared to o SDSD Undergrad Enrollment approximately 11,225 o USD Undergrad Enrollment approximately 7,600 o Brookings County 1 year population estimate for 2013 is 32,968 o 1 year population
White Pine County Economic Overview
 Economic Overview Population (2016) 10,105 Jobs (2016) 4,597 Average Earnings (2016) $65,033 Unemployed (2/2016) 229 GRP (2014) $996,944,330 Exports (2014) $1,789,478,088 Imports (2014) $1,181,738,119
Regional Economics 6-1. Northwest Regional Comprehensive Plan Regional Economics
 Regional Economics Northwest Regional Economy Economic information specifically for the Northwest Region of Wisconsin is provided in this chapter. The following data and related analysis addresses population,
The Value of the Local Healthcare System on the Jefferson County Economy
 The Value of the Local Healthcare System on the Jefferson County Economy Executive Summary The healthcare industry is often one of the largest employers in a rural community and serves as a significant
Nonemployer Statistics An Indicator of Virginia s Gig Economy
 Nonemployer Statistics An Indicator of Virginia s Gig Economy By Ann Lang, Senior Economist Ann.Lang@vec.virginia.gov Author s Note: This article attempts to provide an indication of Virginia s gig economy
County Economic Profile Jefferson Davis County, MS extension.msstate.edu/economic-profiles
 County Economic Profile Jefferson Davis County, MS extension.msstate.edu/economic-profiles Demographics Jefferson Davis Mississippi United States Total Population, 2016 (Census) 11,385 2,988,726 323,127,513
South Baldwin County, Alabama (Gulf Shores, Orange Beach, Bon Secour, Elberta, and Foley) Are You Diversified?
 Are You Diversified?") South Baldwin County, Alabama (Gulf Shores, Orange Beach, Bon Secour, Elberta, and Foley) Are You Diversified? By: Henry B. Burdg Director, Auburn Technical Assistance Center (ATAC), Auburn University
South Baldwin County, Alabama (Gulf Shores, Orange Beach, Bon Secour, Elberta, and Foley) Are You Diversified? By: Henry B. Burdg Director, Auburn Technical Assistance Center (ATAC), Auburn University
Economic Overview Fairfax / Falls Church. October 23, 2017
 Economic Overview Fairfax / Falls Church October 23, 2017 DEMOGRAPHIC PROFILE... 3 EMPLOYMENT TRENDS... 5 UNEMPLOYMENT RATE... 5 WAGE TRENDS... 6 COST OF LIVING INDEX... 6 INDUSTRY SNAPSHOT... 7 OCCUPATION
Measuring Iowa s Economy: Income. By Michael A. Lipsman
 Measuring Iowa s Economy: Income By Michael A. Lipsman Strategic Economics Group October 2012 Introduction After going through the deepest recession since the 1930s, the United States economy continues
County Economic Profile Warren County, MS extension.msstate.edu/economic-profiles
 County Economic Profile Warren County, MS extension.msstate.edu/economic-profiles Demographics Warren Mississippi United States Total Population, 2016 (Census) 47,140 2,988,726 323,127,513 Percent Change
Economic Overview City of Tyler, TX. January 8, 2018
 Economic Overview City of Tyler, TX January 8, 2018 DEMOGRAPHIC PROFILE...3 EMPLOYMENT TRENDS...5 WAGE TRENDS...5 COST OF LIVING INDEX...6 INDUSTRY SNAPSHOT...7 OCCUPATION SNAPSHOT...9 INDUSTRY CLUSTERS...
SELECTED ECONOMIC CHARACTERISTICS American Community Survey 5-Year Estimates
 DP03 SELECTED ECONOMIC CHARACTERISTICS 2008-2012 American Community Survey 5-Year Estimates Supporting documentation on code lists, subject definitions, data accuracy, and statistical testing can be found
The Value of the Local Healthcare System on the Harrison County Economy
 The Value of the Local Healthcare System on the Harrison County Economy Executive Summary The healthcare industry is often one of the largest employers in a rural community and serves as a significant
Economy Overview Champaign-Urbana, IL
 Economy Overview Champaign-Urbana, IL Emsi Q4 Data Set November Illinois Emsi Q4 Data Set www.economicmodeling.com Page 1/15 Economy Overview Population () 240,355 Jobs () 100,288 Average Earnings () $53,770
The Value of the Local Healthcare System on the Lyon County Economy
 The Value of the Local Healthcare System on the Lyon County Economy Executive Summary The healthcare industry is often one of the largest employers in a rural community and serves as a significant driver
Economic Overview York County, South Carolina. February 14, 2018
 Economic Overview York County, February 14, 2018 DEMOGRAPHIC PROFILE... 3 EMPLOYMENT TRENDS... 5 UNEMPLOYMENT RATE... 5 WAGE TRENDS... 6 COST OF LIVING INDEX... 6 INDUSTRY SNAPSHOT... 7 OCCUPATION SNAPSHOT...
Economic Overview Monterey County, California. July 22, 2016
 Economic Overview Monterey July 22, 2016 DEMOGRAPHIC PROFILE... 3 EMPLOYMENT TRENDS... 5 UNEMPLOYMENT RATE... 5 WAGE TRENDS... 6 COST OF LIVING INDEX... 6 INDUSTRY SNAPSHOT... 7 OCCUPATION SNAPSHOT...
Highest Ranked Industries
 Highest Ranked Industries Top 10 Industries (2-Digit) in 7 Counties EMSI Q1 2015 Data Set Centralina WDB 525 N. Tryon St., 12th Floor Charlotte, NC, North Carolina 28202 704.372.2416 EMSI Q1 2015 Data
ECONOMIC OVERVIEW DuPage County, Illinois
 ECONOMIC OVERVIEW DuPage County, Illinois DEMOGRAPHIC PROFILE... 3 EMPLOYMENT TRENDS... 5 UNEMPLOYMENT RATE... 5 WAGE TRENDS... 6 COST OF LIVING INDEX... 7 INDUSTRY SNAPSHOT... 8 OCCUPATION SNAPSHOT...
Economy Overview Champaign County, IL
 Economy Overview Champaign County, IL Emsi Q4 2016 Data Set November 2016 Illinois Emsi Q4 2016 Data Set www.economicmodeling.com Page 1/17 Parameters Regions Code Description 17019 Champaign County, IL
October Mid-Del Technology Center. Economy Overview
 October 2017 Mid-Del Technology Center Economy Overview Parameters Regions Code Description 40109 Oklahoma County, OK Timeframe 2001-2016 Datarun 2017.3 QCEW Employees, Non-QCEW Employees, and Self-Employed
County Economic Profile Oktibbeha County, MS extension.msstate.edu/economic-profiles
 County Economic Profile Oktibbeha County, MS extension.msstate.edu/economic-profiles Demographics Oktibbeha Mississippi United States Total Population, 2016 (Census) 49,833 2,988,726 323,127,513 Percent
Economic Overview. Lawrence, KS MSA
 Economic Overview Lawrence, KS MSA March 5, 2019 DEMOGRAPHIC PROFILE... 3 EMPLOYMENT TRENDS... 5 UNEMPLOYMENT RATE... 5 WAGE TRENDS... 6 COST OF LIVING INDEX... 7 INDUSTRY SNAPSHOT... 8 OCCUPATION SNAPSHOT...
Economic Overview Loudoun County, Virginia. October 23, 2017
 Economic Overview October 23, 2017 DEMOGRAPHIC PROFILE... 3 EMPLOYMENT TRENDS... 5 UNEMPLOYMENT RATE... 5 WAGE TRENDS... 6 COST OF LIVING INDEX... 6 INDUSTRY SNAPSHOT... 7 OCCUPATION SNAPSHOT... 9 INDUSTRY
Economic Overview Long Island
 Report created on August 29, 2017 Economic Overview Long Island Contact: Lisa.Montiel@suny.edu DEMOGRAPHIC PROFILE... 3 EMPLOYMENT TRENDS... 5 UNEMPLOYMENT RATE... 5 WAGE TRENDS... 6 COST OF LIVING INDEX...
DEMOGRAPHIC PROFILE...3 EMPLOYMENT TRENDS...5 UNEMPLOYMENT RATE...5 WAGE TRENDS...6 COST OF LIVING INDEX...6 INDUSTRY SNAPSHOT...7
 March 14, 2017 DEMOGRAPHIC PROFILE...3 EMPLOYMENT TRENDS...5 UNEMPLOYMENT RATE...5 WAGE TRENDS...6 COST OF LIVING INDEX...6 INDUSTRY SNAPSHOT...7 OCCUPATION SNAPSHOT...9 INDUSTRY CLUSTERS... 12 EDUCATION
Economic Overview 45-Minute Commute From Airport Park. June 6, 2017
 Economic Overview 45-Minute Commute From Airport Park June 6, 2017 DEMOGRAPHIC PROFILE... 3 EMPLOYMENT TRENDS... 5 WAGE TRENDS... 5 COST OF LIVING INDEX... 6 INDUSTRY SNAPSHOT... 7 OCCUPATION SNAPSHOT...
Economic Overview Western New York
 Report created on August 29, 2017 Economic Overview Western New Contact: Lisa.Montiel@suny.edu DEMOGRAPHIC PROFILE... 3 EMPLOYMENT TRENDS... 5 UNEMPLOYMENT RATE... 5 WAGE TRENDS... 6 COST OF LIVING INDEX...
A SocioEconomic Profile
 www.headwaterseconomics.org A SocioEconomic Profile Otero County, New Mexico Produced by the Economic Profile System (EPS) April 2, 2009 About EPS About The Economic Profile System (EPS) This profile was
October 28, Economic Overview Yellowstone County, Montana
 October 28, 2016 Economic Overview Yellowstone DEMOGRAPHIC PROFILE...3 EMPLOYMENT TRENDS...5 UNEMPLOYMENT RATE...5 WAGE TRENDS...6 COST OF LIVING INDEX...6 INDUSTRY SNAPSHOT...7 OCCUPATION SNAPSHOT...9
Economic Overview Plant City Region. April 5, 2017
 Economic Overview Plant City Region April 5, 2017 DEMOGRAPHIC PROFILE... 3 EMPLOYMENT TRENDS... 5 WAGE TRENDS... 5 COST OF LIVING INDEX... 6 INDUSTRY SNAPSHOT... 7 OCCUPATION SNAPSHOT... 9 INDUSTRY CLUSTERS...
The Economic Impact of the Local Healthcare System on the Woodford County Economy
 The Economic Impact of the Local Healthcare System on the Woodford County Economy Executive Summary The healthcare industry is often one of the largest employers in a rural community and serves as a significant
ECONOMY OF TUCSON AND SOUTH TUCSON
 ECONOMY OF TUCSON AND SOUTH TUCSON Prepared by January 2008 Center for Competitiveness and Prosperity Research L. William Seidman Research Institute W. P. Carey School of Business Arizona State University
County Health Economics Profile Marshall County, Mississippi extension.msstate.edu/economic-profiles
 County Health Economics Profile Marshall County, extension.msstate.edu/economic-profiles Demographics Marshall County, United States Total Population, 2015 (Census) 35,916 2,992,333 321,418,820 Percent
The Economic Impact of the Local Healthcare System on the Owsley County Economy
 The Economic Impact of the Local Healthcare System on the Owsley County Economy Executive Summary The healthcare industry is often one of the largest employers in a rural community and serves as a significant
Economic Overview Capital District
 August 29, 2017 Economic Overview Capital District Contact: Lisa.Montiel@suny.edu DEMOGRAPHIC PROFILE... 3 EMPLOYMENT TRENDS... 5 UNEMPLOYMENT RATE... 5 WAGE TRENDS... 6 COST OF LIVING INDEX... 6 INDUSTRY
September Caddo Kiowa Technology Center. Economy Overview
 September 2017 Caddo Kiowa Technology Center Economy Overview Parameters Regions Code Description 40015 Caddo County, OK 40051 Grady County, OK 40075 Kiowa County, OK Timeframe 2001-2016 Datarun 2017.3
Economic Overview Mohawk Valley
 Report created on August 29, 2017 Economic Overview Mohawk Valley Contact: Lisa.Montiel@suny.edu DEMOGRAPHIC PROFILE... 3 EMPLOYMENT TRENDS... 5 UNEMPLOYMENT RATE... 5 WAGE TRENDS... 6 COST OF LIVING INDEX...
A SocioEconomic Profile
 www.headwaterseconomics.org A SocioEconomic Profile Bernalillo County, New Mexico Produced by the Economic Profile System (EPS) April 6, 2007 About EPS About The Economic Profile System (EPS) This profile
Businesses in Kentucky
 Black-Owned Businesses in Kentucky Old Capitol Annex 3 West Broadway Frankfort, KY 6-975 Phone 52.56.7 Fax 52.56.3256 www.thinkkentucky.com TABLE OF CONTENTS Summary of Findings.................................................
County Economic Profile Sharkey County, Mississippi extension.msstate.edu/economic-profiles
 County Economic Profile Sharkey County, Mississippi extension.msstate.edu/economic-profiles Demographics Sharkey County, Mississippi Mississippi United States Total Population, 2015 (Census) 4,585 2,992,333
Economic Overview Prince William/Manassas. October 23, 2017
 Economic Overview Prince William/Manassas October 23, 2017 DEMOGRAPHIC PROFILE... 3 EMPLOYMENT TRENDS... 5 UNEMPLOYMENT RATE... 5 WAGE TRENDS... 6 COST OF LIVING INDEX... 6 INDUSTRY SNAPSHOT... 7 OCCUPATION
County Health Economics Profile Oktibbeha County, Mississippi extension.msstate.edu/economic-profiles
 County Health Economics Profile Oktibbeha County, extension.msstate.edu/economic-profiles Demographics Oktibbeha County, United States Total Population, 2015 (Census) 49,800 2,992,333 321,418,820 Percent
Demographic and Economic Data for Guadalupe County, New Mexico
 R H W Community Health Needs Assessment Template National Center for Rural Health Works Demographic and Economic Data for Guadalupe County, New Mexico Facilitated by: National Center for Rural Health Works
County Economic Profile Oktibbeha County, Mississippi extension.msstate.edu/economic-profiles
 County Economic Profile Oktibbeha County, Mississippi extension.msstate.edu/economic-profiles Demographics Oktibbeha County, Mississippi Mississippi United States Total Population, 2015 (Census) 49,800
A Labor Market Information Publication FOURTH QUARTER 2002
 A Labor Market Information Publication FOURTH QUARTER THE IOWA LABOR MARKET IN : AN ELUSIVE RECOVERY IN GENERAL, ECONOMIC CONDITIONS SHOWED SOME IMPROVEMENT IN, but the recovery that was expected to take
June 9, Economic Overview Billings, MT MSA
 June 9, 2016 Economic Overview Billings, MT MSA DEMOGRAPHIC PROFILE... 3 EMPLOYMENT TRENDS... 5 UNEMPLOYMENT RATE... 5 WAGE TRENDS... 6 COST OF LIVING INDEX... 6 INDUSTRY SNAPSHOT... 7 OCCUPATION SNAPSHOT...
A SocioEconomic Profile
 www.headwaterseconomics.org A SocioEconomic Profile Kern County, California Produced by the Economic Profile System (EPS) October 9, 2008 About EPS About The Economic Profile System (EPS) This profile