Highlights and key messages for business and public policy
|
|
|
- Blake Little
- 6 years ago
- Views:
Transcription
1
2
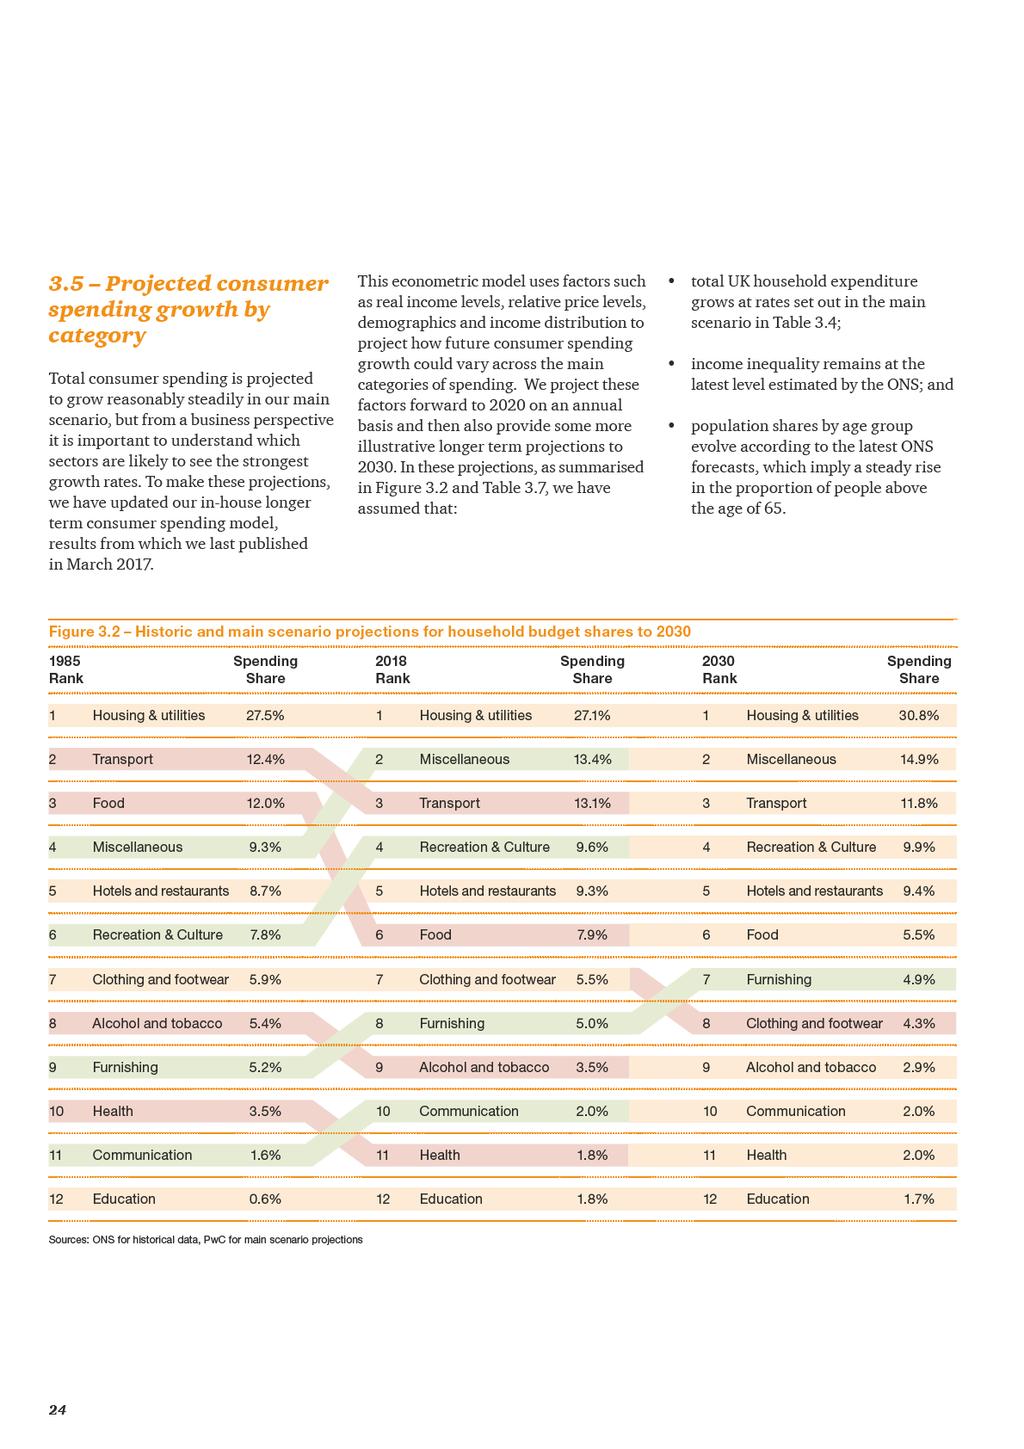
3 Highlights and key messages for business and public policy Key projections Real GDP growth 1.5% 1.6% Consumer spending growth 1.1% 1.3% Inflation (CPI) 2.7% 2.3% Source: PwC main scenario projections Regional trends and prospects London has grown significantly faster than other UK regions for most of the past two decades, but recently there have been signs from both the labour and housing markets that London s relative performance has been less strong. Recent UK developments and prospects UK economic growth slowed in 2017 as inflation rose sharply, squeezing household spending power. In our main scenario, we project UK growth to remain modest at around 1.5% in 2018 and 1.6% in This is due to continued subdued real consumer spending growth and the drag on business investment from ongoing economic and political uncertainty relating to the outcome of the Brexit negotiations. The stronger global and Eurozone economies, and the competitive value of the pound particularly against the euro, should also boost exports, however, which will offer some support for overall UK GDP growth. Service sector growth should remain modest but positive in , while manufacturing retains momentum after ending 2017 strongly. But the construction sector has fallen back due to the weakness of commercial property investment and this looks set to continue this year. The Bank of England could raise interest rates once or twice this year, though the pace of increase will remain limited and gradual. What are the longer term prospects for consumer spending? We project households will spend over 30% of their budget on housing and utilities by 2030, up from around 27% in Spending on financial services and personal care will also tend to increase relatively rapidly over time, while the share of total spending on food and clothing will tend to decline in the long run. Automation could have a major impact on retail jobs in the long run, but will also bring benefits to consumers in lower prices. This will allow consumers to increase their real spending levels, potentially creating new jobs in less automatable services sectors such as health and personal care. Emerging technologies like artificial intelligence (AI) could also bring great competitive advantage to businesses that deploy them effectively. We expect this to continue in , with London growing at close to the UK average rate. As manufacturing has bounced back recently on the back of a stronger global economy and a more competitive value of the pound, this has helped parts of the UK with stronger industrial bases in the North and the Midlands. UK Economic Outlook March
4 1 Summary Recent developments The UK economy held up well in the six months after the EU referendum, but growth slowed markedly from early 2017 as consumer spending growth moderated. A key factor behind that moderation was the increase in the rate of consumer price inflation (CPI) from around zero on average in 2015 to 3% in the year to January 2018, as global commodity prices have picked up from lows in early 2016, and the effects of the weak pound after the Brexit vote have fed through supply chains. Higher inflation has squeezed real household incomes and this has taken the edge off consumer-led growth. Brexit-related uncertainty has also dampened business investment growth. On the more positive side, UK exports have been boosted by the upturn in global growth over the past year, notably in the Eurozone. The weaker pound, although bad for UK consumers, has been helpful to exporters and inbound tourism. Table 1.1: Summary of UK economic growth and inflation prospects Indicator (% change on previous year) OBR forecasts (March 2018) Independent forecasts (February 2018) PwC Main scenario (March 2018) GDP Consumer spending Inflation (CPI) Source: Office for Budget Responsibility (March 2018), HM Treasury survey of independent forecasters (average value of new forecasts made in February 2018 survey) and latest PwC main scenario. Future prospects As shown in Table 1.1, our main scenario is for UK GDP growth to remain moderate at around 1.5% in 2018 and 1.6% in Our views on growth and inflation are broadly similar to the latest consensus and OBR forecasts (see Table 1.1). Consumer spending growth is expected to moderate to only around 1% in 2018 but may pick up slightly next year as real wages recover. Longer term trends and prospects for consumer spending are discussed further below. On the positive side, the stronger global economy should continue to have some offsetting benefits for net exports (though there are downside risks here if recent US tariff policy changes were to lead to a wider trade war). Brexit-related uncertainty may continue to hold back business investment, but this should be partly offset by planned increases in public investment and some easing of austerity over the next two years as announced in the November 2017 Budget. There are always uncertainties surrounding our growth projections, as illustrated by the alternative scenarios in Figure 1.1. There are still considerable downside risks relating to possible pitfalls on the road to Brexit, but there are also upside possibilities if these problems can be contained and global growth continues to pick up. In our main scenario, we expect the UK to continue with moderate but steady growth in , but businesses need to monitor and make contingency plans for potential alternative scenarios related to Brexit and other factors. Inflation should fall back gradually over the course of 2018 and 2019 assuming no major shifts in exchange rates or global commodity prices. Given continued uncertainties around Brexit, we expect the Monetary Policy Committee to be cautious about the pace of future interest rate rises, but one or two increases seem possible this year. 4
5 Longer term outlook for consumer spending and the impact of automation As shown in Table 1.1, we expect consumer spending growth to slow to only around 1% this year and pick up only modestly to around 1.3% in 2019, but in the longer term it should return to an estimated trend rate of around 2% per annum on average in the 2020s. As discussed in detail in Section 3 of this report, we project that households will spend over 30% of their budget on housing and utilities by 2030, up from around 27% in 2017 (see Table 1.2). Spending on financial services and personal care (classified under miscellaneous services in Table 1.2) will also tend to increase relatively rapidly over time, while the share of total spending on food and clothing will tend to decline in the long run. Automation could have a major impact on retail jobs in the long run, but will also bring benefits to consumers through lower prices. This will allow consumers to increase their real spending levels, potentially creating new jobs in less automatable services sectors such as health and personal care. Technologies like artificial intelligence (AI) could also bring great competitive advantage to businesses that deploy them effectively. Figure 1.1 Alternative UK GDP growth scenarios % change on a year earlier Main scenario Slow growth Strong growth Sources: ONS, PwC scenarios Projections Table 1.2: Household budget share projections to 2030 and implied average annual real growth rates by household spending category in main scenario Shares of total spending 2019 Implied average real growth rates 2018p 2020p 2030p p p Alcohol and tobacco 3.5% 3.4% 2.9% 0.6% 0.3% Clothing and footwear 5.5% 5.3% 4.3% -0.4% -0.2% Communications 2.0% 2.0% 2.0% 1.3% 2.3% Education 1.8% 1.8% 1.7% 1.5% 2.0% Food 7.9% 7.5% 5.5% -1.2% -1.1% Furnishings 5.0% 5.0% 4.9% 1.8% 1.7% Health 1.8% 1.8% 2.0% 1.6% 2.6% Housing and utilities 27.1% 27.5% 30.8% 2.5% 3.1% Miscellaneous services 13.4% 13.7% 14.9% 2.7% 2.8% Recreation and culture 9.6% 9.7% 9.9% 2.0% 2.3% Hotels and restaurants 9.3% 9.3% 9.4% 1.4% 2.1% Transport 13.1% 13.0% 11.8% 0.6% 1.1% Total spending 100% 100% 100% 1.5% 2.0% Sources: ONS data for -Q and PwC estimates and main scenario projections for later periods UK Economic Outlook March
6 Regional growth trends and prospects As analysed in detail in Section 4 of this report, London has consistently outperformed other UK regions for most of the past two decades in terms of economic growth, both before and after the global financial crisis. Outside London, there is less of a clear North-South divide in historical regional growth patterns. Some Northern regions and Northern Ireland did better than some Southern regions in the decade before the financial crisis, though they have performed less well since the crisis (see Figure 1.2). The Midlands struggled before the crisis but has performed relatively better since 2010 when compared to other regions except London. Figure 1.2 London led the way on real GVA growth both before and after crisis Average annual real GVA growth (% p.a.) UK The North The Midlands The East and South Sources: PwC analysis of ONS data London Wales Scotland Northern Ireland More recently, there have been signs that London s relative performance has been less strong and we expect this to continue in , with London growing at close to the UK average rate. As manufacturing has bounced back recently on the back of a stronger global economy and a more competitive value of the pound, this has helped parts of the UK with stronger industrial bases such as the North and the Midlands. 6
7 2 UK economic prospects Key points In our main scenario, we project UK growth to continue at moderate rates of around 1.5% in 2018 and 1.6% in Europe and the world economy have strengthened, but the UK will lag behind in due to the drag on domestic demand from higher inflation and Brexit-related uncertainty. A key factor behind the UK slowdown is subdued consumer spending growth as real incomes have been squeezed by higher inflation and further rises in borrowing become hard to sustain. Government investment has picked up recently, but business investment will remain constrained by uncertainties related to Brexit despite the stronger global economy. We expect growth to become more balanced across the UK regions in , with London no longer growing ahead of the UK average and all regions growing at 1% or above. Wage growth is projected to pick up during the course of this year, with positive real wage growth resuming in 2019 as consumer price inflation slowly moderates The Bank of England is expected to continue with gradual interest rates rises over the next two years, with the next increase possibly coming as soon as May. Introduction In this section of the report we describe recent developments in the UK economy and review future prospects. The discussion covers: Section 2.1 Section 2.2 Section 2.3 Section 2.4 Section 2.5 Recent developments in the UK economy Economic growth prospects: national, sectoral and regional Outlook for inflation and real earnings growth Monetary and fiscal policy options Summary and conclusions. UK Economic Outlook March
8 2.1 Recent developments in the UK economy The UK economy initially remained resilient in the second half of 2016 followed the Brexit vote, but growth slowed markedly during the first half of 2017 as inflation bit into consumer spending power and Brexit-related uncertainty dampened business investment. The UK economy has benefitted from an upturn in the global and Eurozone economies, which helped to boost UK growth somewhat in the second half of the year, although it remained below trend in 2017 as a whole. Figure 2.1 Sectoral output and GDP trends Index ( 2007 = 100) Q3 Services 2008 Q3 GDP 2009 Q Q3 Manufacturing 2011 Q Q3 Construction 2013 Q Q Q Q3 Services GDP Construction Manufacturing 2017 Q3 Manufacturing sector output is still slightly below pre-crisis peak levels, but has generally been on a rising trend since Most recently, manufacturing output bounced back strongly in the second half of Higher demand for UK goods exports because of stronger global and European demand, as well as the competitive value of sterling, could help to explain this recent upward trend. The construction sector has been volatile over time, but had generally been growing relatively strongly in before dipping again over the past three quarters. Commercial construction activity was particularly weak in 2017, perhaps reflecting the impact of Brexit-related uncertainty. But public infrastructure investment has been stronger, following a boost to spending on this in the 2016 Autumn Statement, and private housebuilding has also held up reasonably well. The dominant influence on UK growth comes from the services sector, however, which now accounts for almost 80% of UK GDP (compared to just 10% for manufacturing and 6% for construction). Source: ONS Figure 2.2 Trends in GDP, consumer spending and the services sector % change on previous quarter Source: ONS GDP Q2 Q3 Q4 Q Consumer expenditure Services sector output has shown relatively steady growth ever since the recession bottomed out in mid-2009, although there have been some fluctuations in the pace of services growth more recently as Figure 2.2 shows. The fourth quarter of 2017 saw stronger services growth, however, led by financial and business services and communications and transport. Services Figure 2.2 also shows the influence of slower consumer spending growth on overall GDP growth in recent quarters. This reflects the dampening effect of higher inflation on real household spending power. Past trends and future prospects for consumer spending are discussed in much more detail in Section 3 below. Q3 Q4 8
9 While official data are more comprehensive, business surveys can provide a more timely indication of short term economic trends. In particular, it is worth keeping an eye on the Markit/CIPS purchasing managers indices (PMIs) for services and manufacturing, as shown in Figure 2.3. Despite some volatility, the manufacturing PMI has been reasonably strong in recent months, while services has shown positive but relatively modest growth in early A key factor underpinning recent trends has been the relative weakness of the pound since the Brexit vote, as shown in Figure 2.4. Sterling has regained some ground against the dollar since mid-2017, but remains weak against the euro (reflecting the relatively robust economic recovery in the euro area over the past year). A weak currency makes UK exports relatively cheaper to overseas customers, promoting the sale of British goods and services while also improving tourist inflows. But depreciation also raises the prices of imports and this has pushed inflation up to 3%, so squeezing consumer spending power. Figure 2.3 Purchasing Managers Indices of business activity Jan Figure 2.4 US dollar and euro exchange rates against the pound Above 50 indicates rising activity levels 2008 Jan Services Source: Markit/CIPS 2009 Jan 2010 Jan Manufacturing 2011 Jan 2012 Jan 2013 Jan 2014 Jan 2015 Jan 2016 Jan Manufacturing 2017 Jan Services USD/ 2018 Jan 1.1 EUR/ 1.0 Jan 2016 Mar 2016 May 2016 Jul 2016 Sep 2016 Nov 2016 Jan 2017 Mar 2017 May 2017 Jul 2017 Sep 2017 Nov 2017 Jan 2018 Mar 2018 US Dollar Euro Source: Bank of England UK Economic Outlook March
10 Figure 2.5 Trends in productivity and employment Source: ONS Index 2008 = Productivity (per worker) Employment UK creates record numbers of jobs, but productivity growth subdued since the crisis In the July 2017 edition of UK Economic Outlook, we discussed how the recent combination of low wage growth and low unemployment indicated a flattening of the traditional Phillips Curve (which describes the historical negative relationship between wage inflation and unemployment). One of the key reasons for subdued real wage growth has been relatively weak UK productivity growth since the financial crisis as illustrated in Figure 2.5 for output per worker. The positive side of this has been strong jobs growth, particularly since As discussed in an article by Andrew Sentance in the previous edition of this report 1, weaker post-crisis productivity growth rates in financial services and property-related sectors have played a significant part in this slowdown Employment Productivity In the second half of 2017 there were some signs of productivity bouncing back, though this was more due to weaker jobs growth (and falling average hours worked affecting productivity measured on a per hour basis) than particularly strong output growth. The ideal combination of strong jobs growth and robust productivity growth, as seen before the crisis, has generally proved elusive over the past decade. Why has productivity been weak since the crisis? Many possible explanations have been put forward for recent weak productivity growth, including measurement error (in particular, not capturing the full benefit of digital innovations like smart phones). Soon after the recession, some put it down to labour hoarding by firms or credit constraints by banks, but both these explanations are less convincing now after eight years of recovery since mid Reduced competition in some sectors might be a possible explanation, but against that some other sectors have seen their markets disrupted by technologysavvy new entrants, which would usually be associated with increased innovation and productivity growth. The most convincing explanation from our perspective is that business investment, while picking up since the recession, has not done so to the extent seen in most past recovery cycles. Many businesses have been reluctant to invest in new labour-saving automation technologies that are relatively risky when compared to the alternative of using more low cost labour, including migrant workers from the EU (although this inflow is now dropping back). Uncertainty around Brexit has been a further dampener on business investment over the past 18 months, which has been broadly flat at a time when global economic conditions and very low interest rates might normally have been expected to lead to much stronger UK business investment growth. Looking years ahead, emerging technologies like robotics and artificial intelligence could hold the potential for faster productivity growth 2, albeit at the cost of some existing job losses as we have argued in past reports 3. But, at least for the next few years, productivity growth may remain relatively subdued, with any recovery being at the expense of slower growth in jobs and hours worked. 1 pdf 2 See, for example, our report on the potential impact of AI on the UK economy here, which suggests gains of up to 10% of GDP by 2030: 3 See, for example, this article on whether robots will steal our jobs from our March 2017 UK Economic Outlook: 10
11 2.2 Economic growth prospects: national, sectoral and regional Our main scenario is for real GDP growth of around 1.5% in 2018 and 1.6% in 2019, somewhat below the estimated longer term trend growth of around 2%. Further details of this main scenario projection are set out in Table 2.1. We expect UK growth to remain moderate in , but we think it unlikely that the economy will fall into recession unless there are major new adverse shocks. We assume here that the Brexit negotiations will proceed reasonably smoothly, and therefore that the UK will avoid an extreme hard Brexit where it falls out of the EU in 2019 without any trade deal or transitional arrangement, so reverting immediately to WTO rules. But clearly this is a key downside risk. The projected deceleration in growth as compared to 2016 has been driven primarily by slower consumer spending growth due to the squeeze on real household incomes from higher inflation. So far consumers have increased borrowing to keep spending growth going at a reasonable pace but, as discussed in detail in Section 3 below, there are limits to how much further this can go. We therefore expect consumer spending growth to slow to only around 1% this year before picking up modestly in 2019 as real wages start to recover. Table 2.1 Main scenario projections for UK growth and inflation % real annual growth unless otherwise stated Total fixed investment growth was reasonably strong in 2017, buoyed by increased public sector infrastructure investment, but is expected to slow in 2018 as Brexit-related uncertainty drags on business investment. Overall, UK domestic demand growth is expected to average only around 1.3% per annum in , down from 2.1% in Weaker domestic demand growth is expected to be offset to a degree by a positive contribution from net exports, reversing the strongly negative contribution in This reflects a boost to exports from the recovery in growth in the Eurozone in particular, as well as the relatively competitive level of the pound against the euro GDP Consumer spending Government consumption Fixed investment Domestic demand Net exports (% of GDP) CPI inflation (%: annual average) Sources: Latest ONS estimates for , PwC main scenario for UK Economic Outlook March
12 Alternative growth scenarios businesses need to make contingency plans Figure 2.6 Alternative UK GDP growth scenarios 4 Projections To reflect the uncertainties associated with any such projections, particularly in light of Brexit, we have also considered two alternative UK growth scenarios, as shown in Figure 2.6. Our strong growth scenario projects that the economy will rebound to around 2.2% on average in 2018 and around 2.7% in This is a relatively optimistic scenario, which assumes that good early progress is made in UK-EU negotiations and that there are strong favourable trends in the global economy, pushing world growth even higher in and boosting UK exports. Our mild recession scenario, by contrast, would see UK growth stall later this year as the global outlook worsens and there is little or no progress in negotiations with the EU over the next year, suggesting that the UK may have to fall back on WTO rules with a consequent imposition of tariffs on trade with the EU. The associated uncertainty would be likely to reduce investment, jobs and growth. Even in this downside case, however, we do not expect the UK to fall into a serious recession over this period, barring some very major new adverse shock. % change on a year earlier Main scenario Slow growth Strong growth Sources: ONS, PwC scenarios We do not believe that either of these two alternative scenarios is the most likely outcome, but they are certainly possible. At present, risks to growth appear to be weighted somewhat to the downside given the political and economic uncertainties around Brexit. Businesses would therefore be well advised to make appropriate contingency plans for such less favourable outcomes, but without losing sight of the more positive possibilities for the UK economy should these downside risks not materialise and the global economy continues to accelerate
13 More generally, companies should consider making detailed contingency plans for the potential impact of Brexit 4 on all aspects of their businesses, covering the kind of questions listed in Table 2.2. Table 2.2: Key issues and questions for businesses preparing for Brexit Issues Implications Questions Trade Tax Regulation Sectoral effects Foreign direct investment (FDI) Labour market Uncertainty The EU is the UK s largest export partner, accounting for around 44% of total UK exports leaving the EU is likely to make trade with EU more difficult, but the extent of this will depend on the type of deal, if any, agreed with the EU27. The UK would gain more control over VAT and some other taxes. But Brexit could also open the door to new tax initiatives within the EU that the UK might currently have sought to block. The UK is subject to EU regulation. Brexit could mean less red tape in some areas. But it could also mean that UK businesses need to adapt to a different set of regulations, which could be costly. The UK is the leading European financial services hub, which is a sector that could be significantly affected by Brexit. Other sectors which rely on the EU single market could also feel a strong impact. FDI from the EU makes up around 45% of the total stock of FDI in the UK. Brexit could put some of this inbound investment at risk. The UK may change its migration policies. Currently EU citizens can live and work in the UK without restrictions. Businesses will need to adjust to any change in this regime. We discuss possible economic impacts of EU migration changes after Brexit in Section 3. Uncertainty has increased since the referendum and this seems likely to continue through the Brexit negotiation period. How much do you rely on EU countries for revenue growth? Have you reviewed your supply chain to identify the potential impact of tariffs and additional customs procedures on your procurement and logistics? Have you identified which third party contracts would require renegotiation in different Brexit scenarios (EEA/FTA/WTO)? Have you thought about the impact of potential changes to the UK and EU tax regimes after Brexit? Have you upgraded your systems to deal with a significant volume of tax changes? Have you quantified the potential regulatory impact of Brexit to keep your stakeholders up-to-date? How flexible is your IT infrastructure to deal with potential changes to Data Protection laws? Is your compliance function ready to deal with any new reporting requirements arising from Brexit? Have you briefed potential investors on the impact of Brexit for your sector and organisation? How up-to-date are your contingency plans in place to deal with Brexit? Are you aware of the impact of potential volatility in financial markets on your capital raising plans? How much do your rely on FDI for growth? How does Brexit affect your location decisions? How are your competitors responding to the risk of Brexit? Are they relocating any key functions? How reliant is your value chain on EU labour? Have you communicated with your UK-based employees who are nationals of other EU countries? What advice should you give them on registering for UK residency? Have you considered the additional cost of hiring EU labour after Brexit? Could changes in access to EU labour increase the case for automation? How well prepared are you to manage future volatility in the Sterling exchange rate as Brexit negotiations proceed? Have you communicated your approach to Brexit to your key stakeholders, customers and suppliers? Is your organisation ready for a worst-case scenario where there is a prolonged period of uncertainty and/or a hard Brexit? Source: PwC 4 For more material on the potential impact of Brexit on your business, please see our EU Referendum hub here: uk/the-eu-referendum.html UK Economic Outlook March
14 Manufacturing growth projected to be relatively strong in 2018 but retail sales slow The sector dashboard in Table 2.3 shows latest ONS estimates of growth rates for 2017 along with our projected growth rates for 2018 and 2019 for five of the largest sectors within the UK economy. The table also includes a summary of the key trends and issues affecting each sector. The most marked downward trend in growth is in the distribution, hotels and restaurants sector, which recorded output growth of almost 5% in 2016, but this slowed to just 1.7% in 2017 and we expect only around 1% growth in 2018 as real consumer spending power is squeezed. Manufacturing should see a continued revival this year due to stronger exports, but may see growth moderate again in 2019 as earlier competitiveness gains from a weak pound fade. Construction was strong going into 2017, which boosted average growth for that year, but this disguises declining output for the past three quarters. Even if this decline bottoms out, average growth seems likely to be close to zero in 2018 that it could revive in 2019 as public investment and housing remain relatively strong. Business services and finance growth should remain relatively steady at around 2% per annum, although there are downside risks if Brexit negotiations go less smoothly than we assume in our main scenario. UK financial services companies could be particularly badly affected by any loss of access to EU markets, notably through the possible loss of passporting rights for UK-based firms, although there is also positive longer term potential for the sector beyond Brexit 5. Table 2.3: UK sector dashboard Growth Sector and GVA share Key issues/trends Manufacturing (10%) 2.8% 2.7% 1.7% Manufacturing PMI has been relatively robust in recent months. Exporters have gained from a weaker pound and a stronger Eurozone recovery. Construction (6%) 5.1% 0.1% 1.6% Construction PMI has been relatively weak in recent months. The construction sector saw relatively strong growth in the first quarter of 2017, but has declined since then. The government has boosted infrastructure investment to try to offset weakness in commercial construction due to Brexit. Distribution, hotels & restaurants (14%) 1.7% 1.0% 1.4% A weaker pound since 2016 has boosted tourism, both from overseas and domestically, leading to increased expenditure in the hospitality sector. But its broader effect has been to push up import prices and inflation, slowing down real spending growth. Business services and finance (31%) 1.8% 2.2% 2.0% The financial sector remains particularly concerned about the possible implications of Brexit, especially if this involves the loss of EU passporting rights. Some banks are preparing to relocate certain functions and staff overseas, though we have not seen large moves yet. The Bank of England has increased the counter-cyclical capital buffer to constrain consumer debt levels, which may impact lending by retail banks. Government and other services (23%) 0.2% 0.9% 1.2% Public services continue to face tight budgets, but austerity has been eased for at least the next two years. Total GDP 1.7% 1.5% 1.6% Sources: ONS for 2017 estimates, PwC for 2018 and 2019 main scenario projections and key issues. These are five of the largest sectors but they do not cover the whole economy their GVA shares only sum to around 85% rather than 100% 5 For more on the future of UK financial services after Brexit, see our report with TheCityUK here: 14
15 Figure 2.7 PwC main scenario for output growth by region in 2018 and % growth by region London South East East Midlands UK South West North West East Anglia West Midlands Wales Yorks & Humberside North East Northern Ireland Scotland Source: PwC analysis Regional prospects: all parts of the UK likely to see moderate growth in with London no longer clearly leading the pack In contrast to previous years where London has generally had one of the strongest growth rates of any UK region, as discussed in detail in Section 4 below our latest projections suggest London s growth rate may fall to close to the UK average in (see Figure 2.7). This is partly due to the greater exposure of some London activities (e.g. the City) to adverse effects from Brexit-related uncertainty, as well as growing constraints on the capital in terms of housing affordability and transport capacity 6. Most English regions, as well as Wales, are projected to expand at close to the UK average of around 1.5% in 2018, although Northern Ireland and Scotland are predicted to lag behind somewhat with growth of around 1% this year. Longer term regional trends and prospects are discussed in much greater detail in Section 4 of this report. It is important to note that, since regional output data are published on less timely basis than national data, the margins of error around these regional output projections are even larger than for national growth projections. Therefore, they can only be taken as illustrative of broad directional trends. 2.3 Outlook for inflation and real earnings growth As mentioned earlier, consumer price inflation (CPI 7 ) picked up from just 0.7% on average in 2016 to 3% in the year to January 2018 due in large part to the feedthrough from a weaker pound into import prices. The rise in global oil prices from their low point in early 2016 to over $60 a barrel at the time of writing has also played a part here. Over the next two years, we expect CPI inflation to decline gradually, eventually returning to close to target by the end of 2019 (see Figure 2.8), as earlier effects from the weak pound fade. Annual average rates of inflation in our main scenario would be around 2.7% this year and around 2.3% in For more on local economic trends see our latest Good Growth for Cities report: 7 The ONS switched to CPIH as its main inflation indicator in March 2017, despite some continuing methodological concerns about the reliability of the way that CPIH captures owner occupied housing costs through estimates of equivalent market rents rather than actual outlays on mortgage payments. For the moment, we have stuck to CPI as our key inflation indicator, but we may consider switching to CPIH in the future if this becomes more widely used (in particular if it becomes the MPC s target measure of inflation). In the long run, however, we would not expect significant differences between average inflation on these two measures (based on long-term historical averages). UK Economic Outlook March
16 Alternative inflation scenarios There is always considerable uncertainty over inflation projections as they are particularly sensitive to movements in exchange rates and global commodity prices, both of which are very hard to predict with any confidence. As such, we also present two alternative scenarios for UK inflation in Figure 2.8: In our high inflation scenario we project UK inflation to rise to over 4% by early 2019 as a result of renewed falls in the pound and a pick-up in global commodity prices if other economies grow more strongly and/or oil supply is constrained by producers. Wage growth could also pick up faster than expected in this case. In our low inflation scenario, by contrast, the UK and global economies weaken by more than expected in our main scenario leading global commodity prices to fall back sharply over the next year. In this case, UK inflation could fall back to well below the Bank of England s 2% target rate by Real earnings squeeze projected to ease gradually As Figure 2.9 shows, real earnings growth was squeezed from but then regained some ground in as low global commodity prices pushed down UK inflation to close to zero. But the real earnings squeeze resumed in 2017 as wage inflation failed to pick up in response to higher consumer price inflation. Figure 2.8 Alternative UK inflation (CPI) scenarios % change on a year earlier Inflation target = 2% High inflation Sources: ONS, PwC scenarios Main scenario 2014 Low inflation We expect negative real earnings growth to continue in early 2018 but to ease over the course of the year and be reversed in 2019 (see Figure 2.9), although this will be a gradual process. It is difficult for earnings to pick up significantly on a longer term basis, however, unless productivity growth picks up on a sustained basis, which is not guaranteed as we discussed in Section 2.1 above Inflation target Projections 2019 As with our GDP growth scenarios, neither of these two alternative variants is as likely as our main scenario. But given recent volatility and uncertainty, businesses should plan for a broad range of outcomes. Figure 2.9 CPI inflation vs average earnings growth 5.0 CPI 4.0 Projections % change p.a Real squeeze Earnings CPI Average weekly earnings (excl bonus) Sources: ONS, PwC analysis 16
17 2.4 Monetary and fiscal policy options The Monetary Policy Committee (MPC) voted by a majority of 7-2 at its meeting in November to increase interest rates by 0.25%, the first increase in a decade, but has kept rates on hold since then. However, the latest MPC minutes suggest that the next rate rise will come later this year, possibly as soon as May. There could then be a second quarter point rise later in 2018 if growth and inflation evolve as the Bank expect, which is similar to what is envisaged in our own main scenario. There is still a long way to go to full monetary policy normalisation, however, which may now mean base rates ending up at around 2-2.5% as opposed to the 5% pre-crisis norm. As regards fiscal policy, the Chancellor made no significant tax or spending changes in his Spring Statement, despite the shortfall in public borrowing in the 2017/18 financial year. We can expect more substantial changes in the Budget in November. 2.5 Summary and conclusions UK economic growth has slowed over the past year to around 1.5% as inflation has squeezed consumers and Brexit-related uncertainty has dampened business investment growth. There has been some offset from a stronger global economy, but not enough to keep UK growth from falling below its long term trend rate of around 2%. In our main scenario, we expect this period of modest, sub-trend growth to continue in , with GDP growth of around % and real consumer spending growth of just over 1%. The impact of slower growth will be felt across most major industry sectors, although manufacturing exports have received a short-term boost from the depreciation of the pound since 2016 and recent stronger Eurozone growth. Construction has faced the most marked slowdown although this follows a period of considerable strength up to early We expect one or two further interest rate rises this year as the MPC seeks to bring inflation back down to target but any such increases will be limited and gradual. It is important to note that there are considerable uncertainties around any such projections at present. So organisations should stress test their business and investment plans against alternative economic scenarios and also review the potential wider implications of Brexit for all aspects of their operations. UK Economic Outlook March
18 3 The outlook for consumer spending and the impact of automation 1 Key points Consumer spending slowed during 2017, but has nonetheless grown by an average of 2.3 percentage points per annum faster than inflation over the past five years, supporting the UK recovery over that period. This has reflected rising employment levels, continued historically low interest rates, and a declining household savings ratio driven by higher borrowing and rising house prices. Looking ahead, we expect real household income growth to pick up gradually in real terms from about 0.8% per annum in 2018 to 1.4% per annum by 2020, while the household savings ratio continues to decline. As a result, in our main scenario we expect real consumer spending growth to rise gradually from an estimated 1.1% per annum in 2018 to around 1.7% in We project households will spend over 30% of their budget on housing and utilities by 2030, up from around 27% in Spending on financial services, personal care, recreation and culture will also tend to increase relatively rapidly over time, while the share of total spending on food, clothing, alcohol and tobacco, and transport will tend to decline in the long run. Automation could have a major impact on retail jobs in the long run, but will also bring benefits to consumers in lower prices. This will allow consumers to increase their real spending levels, potentially creating new jobs in less automatable services sectors such as health and personal care. Technologies like artificial intelligence (AI) could also bring great competitive advantage to businesses that deploy them effectively. Introduction Consumer spending accounts for more than two thirds of UK GDP and is therefore the most important driver of UK economic growth. Strong consumer spending growth has played a central role in the recovery of the UK economy since 2012, but it slowed in 2017 as real incomes were squeezed. Will this slowdown continue in 2018 and 2019? And, looking further ahead, which areas of consumer spending might grow the fastest in the next decade? To answer these questions, we have looked at past trends and future prospects for the two key determinants of household spending growth: real household disposable income (RHDI) growth, which in turn is driven by trends in real income from employment, state benefits and pensions and other private income; and changes in the household savings ratio, which are particularly influenced by the relative indebtedness of households and wealth effects (e.g. from house price changes). We also consider the longer term potential impact of automation on retailing and related sectors. The discussion is structured as follows: Section 3.1 provides an overview of recent trends in each of the key determinants of real household disposable income growth; Section 3.2 looks at potential future trends in household disposable income growth; Section 3.3 looks at past trends and future prospects for the household savings ratio; Section 3.4 brings these analyses together to set out our main scenario for future consumer spending growth and assess risks around this as captured in alternative scenarios; Section 3.5 examines how consumer spending growth might vary by expenditure category over the period to 2030; Section 3.6 considers the potential longer term impact of automation on jobs in retailing and related sectors; and Section 3.7 summarises our key findings and concludes. 1 This article was written by Barret Kupelian, John Hawksworth and George Mason of PwC s economics practice. 18
19 3.1 Recent trends in household disposable income The ONS defines household disposable income as the sum of earnings, state transfers (e.g. social security benefits) less direct taxes (mainly income tax and national insurance), and other net income accruing to households (e.g. from interest, dividends, rent and other transfers). Table 3.1 shows how the key elements of household disposable income have changed over the five years to Q This is the period which saw the UK economy start to recover on a more sustained basis. Real growth rates in the final column of the table have been calculated by deflating the nominal growth rates using the household expenditure deflator (which over this five year period averaged 1.7% per annum). The most notable feature of this analysis is that household disposable income grew on average by around 1.6% per annum in real terms, while household expenditure grew 0.7 percentage points faster on average at 2.3% per annum. This was associated with a decrease in the household savings ratio (adjusted to exclude changes in pension entitlements) from 5.4% to around 2.5% over this period. Table 3.1: Key drivers of real household disposable income billion Average growth rates per annum 2012 Q Q3 Nominal Deflator Real Wages and salaries % 1.7% 1.8% Household share of gross operating profits % 1.7% 2.8% Pre-tax earnings % 1.7% 2.1% Income tax paid % 1.7% 1.9% National insurance contribution by workers % 1.7% 1.2% Post-tax earnings % 1.7% 2.3% Social security benefits % 1.7% 0.0% Post-tax earnings and benefits % 1.7% 1.6% Net property income received (interest, dividends, rent etc.) % 1.7% 2.5% Net current transfers % 1.7% -0.3% Household disposable income % 1.7% 1.6% Adjustment for change in pensions entitlements % 1.7% -8.2% Available household resources % 1.7% 1.2% Memo: Household expenditure % 1.7% 2.3% Sources: PwC analysis of ONS data Note*: Totals may not correspond exactly to the sum of sub-categories due to rounding Table 3.1 shows that wages and salaries saw a real increase of 1.8% per annum over the five years, supported by a 3.9 percentage point increase in the employment rate during the period. However, this was outstripped by the profits earned by the self-employed and business owners, which grew at an average rate of 2.8% per annum over the four years. 2 This is the last period for which detailed household income data were available at the time of writing. UK Economic Outlook March
20 This divergence reflects an increasing shift towards self-employment and small business start-ups since around 2010, encouraged by a wide range of factors including the greater ability of small businesses to compete through the internet and mobile technology, the rise of the gig economy, generally lower national insurance rates paid by those who are self-employed and a broader push towards entrepreneurialism driven by successive governments. The effect of the rise of the self-employed can also be seen in the national insurance contributions by households, which grew at a relatively slow rate of around 1.2% per annum as compared to wages and salaries. Income tax payments, by contrast, grew at a similar average rate to wages and salaries (1.9% compared with 1.8%). Table 3.1 also shows two areas that have dampened growth in real household disposable income over the period: Social security benefits: this category has shown no growth in real terms over the period. Whilst benefits paid to those who have retired have seen an increase in recent years, with total state pension expenditure growing at a real annual average rate of 2.7% during the period 3, there has been a squeeze on working age benefits. Net current transfers: this income category includes transfers to and from UK households in the form of financial gifts (e.g. to and from overseas family members), and some insurance claims, but excludes government transfers. These net transfers have decreased sharply since Q2 2013, largely as a result of falling insurance claims over the period. However, this is a comparatively small element of household income (around 4% of the total) so the effect on overall household income growth is not that great. The final row in Table 3.1 shows that total real household resources grew by 1.2% per annum after taking into account the change in pension fund entitlements (referred to as net equity in pension funds in the national accounts). However, such changes in pension values are unlikely to be perceived by most households as usable income, so we prefer to exclude this from the analysis by focusing on an adjusted household savings ratio defined as the difference between household disposable income and household expenditure, expressed as a percentage of disposable income. This is lower than the standard ONS definition based on household resources rather than disposable income, but provides a more intuitive indication of the difference between household income and spending (see Figure 3.1). 3 Department for Work & Pensions Expenditure Caseload forecasts (2017). 20
21 3.2 Future trends in household disposable income So how will household disposable incomes fare in the future? There are many uncertainties here, but Table 3.2 sets out what we consider to be a plausible main scenario for real growth to 2020 for each of the key elements of household disposable income growth. In particular we assume that: Total income from wages and salaries will grow at a modest real rate of 0.5% in 2018 and around 0.8% in 2019 due to higher inflation and softer employment growth, before gradually picking up to around 1.4% per annum in 2020 as real wage growth returns to positive territory. Income of households from gross operating profits will continue to grow more strongly than wages and salaries from 2018 onwards as the trend towards increased self-employment continues. Income tax receipts will grow broadly in line with wages and salaries in the medium term. Social security benefits will rise by only 0.4% in real terms in 2018 due to higher inflation and the government s continued welfare cap for working age benefits. Beyond 2018, the average rate of benefits growth is projected to be a little stronger, driven by state pensions, but still relatively modest in real terms as welfare reform programmes continue. Table 3.2: Main scenario projections of real gross household disposable income growth Net property income will increase by 2.1% in 2018 following a relatively strong decline in 2017, but real growth in the longer term will be more modest as the Bank of England gradually increases its policy rate and this feeds through to mortgage rates. Based on these assumptions, we project that real household disposable income growth will be only around 0.8% in real terms in 2018 (up from an estimated 0.2% in 2017) before rising gradually to 1.4% in To see how this translates to consumer spending growth we also need to consider how the household savings ratio might change over this period. 2017e 2018p 2019p 2020p Wages and salaries 1.2% 0.5% 0.8% 1.4% Household share of gross operating profits -0.1% 1.0% 1.8% 2.2% Pre-tax earnings 0.9% 0.6% 1.1% 1.6% Income tax paid 2.5% 0.4% 0.8% 1.2% National insurance contribution by workers 0.3% -0.3% 1.0% 1.5% Post-tax earnings 0.5% 0.9% 1.1% 1.8% Social security benefits -0.6% 0.4% 0.5% 0.9% Post-tax earnings and benefits 0.2% 0.7% 0.9% 1.5% Net property income received (interest, dividends, rent etc.) -5.3% 1.3% 0.8% 1.2% Net current transfers 26.3% -0.2% 1.6% 1.6% Household disposable income 0.2% 0.8% 1.0% 1.4% Sources: PwC main scenario projections UK Economic Outlook March
22 3.3 Household saving ratio: trends and projections The official household savings ratio is defined by the ONS as the difference between available household resources (household disposable income plus an adjustment for the change in pension entitlements) and household expenditure, expressed as a proportion of household resources. As discussed above, we prefer to focus on an adjusted savings ratio excluding changes in net equity in pension funds. Figure 3.1 shows how this adjusted ratio compares to the standard ONS headline measure. Both saving ratios show broadly similar trends over time, but at significantly lower levels for the adjusted savings ratio. We can see that the latter dropped gradually from around 4.3% in 2001 to around 1.5% on average in 2007 just before the recession began. This took place in a prolonged period of economic stability and easy credit conditions, allowing house prices and household debt levels to increase. Following the shock of the recession, household confidence and borrowing slumped and the adjusted savings ratio jumped sharply to 6.2% on average in Since the end of the recession in mid-2009, however, the adjusted savings ratio has fallen back again as confidence and consumer borrowing have revived, although it has been volatile from quarter to quarter. The latest adjusted savings ratio for Q is estimated to be around 2.5%, which is still some way above pre-crisis lows but also well below post-crisis highs. So how much further, if at all, might the household savings ratio fall in the future? Figure 3.1 Historical trends in headline and adjusted UK household savings ratios % Source: PwC analysis of ONS data Headline savings ratio (with net equity) Adjusted savings ratio (without net equity) EU referendum Table 3.3: Projections of the adjusted household savings ratio in alternative PwC scenarios (% of household disposable income) e 2018p 2019p 2020p Lower savings ratio 1.9% 1.0% 0.2% -0.4% Main scenario 1.9% 1.6% 1.3% 1.1% Higher savings ratio 1.9% 2.2% 2.4% 2.5% Sources: PwC analysis based on ONS data for -Q Projecting the adjusted household savings ratio Projecting forward the savings ratio is subject to considerable uncertainties, reflecting the fact that it reflects the difference between two much large numbers: gross disposable income and consumer spending. To address this issue we generated two additional scenarios in addition to our main scenario projections. All but one of the scenarios assume some further decline in the adjusted savings ratio between 2018 and 2020 driven by increased household borrowing, but the medium term level of the ratio could range from around -0.4% to around 2.5% in the alternative scenarios for In summary, the adjusted household savings ratio has been on a downward path since 2010 and has continued this trend even after the EU referendum. This helps explain why consumption has not fallen further in the aftermath of the referendum vote despite the squeeze on real incomes from higher inflation. In our main scenario, we expect some further falls in the adjusted saving ratio in 2018, but the extent of any further decline beyond that is subject to considerable uncertainty. On the one hand, households may keep borrowing more on the basis of collateral and confidence effects from the expected continued but modest rises in house prices; on the other hand, the expected gradual rise in UK interest rates in the medium to long run could dampen this confidence and deter borrowing. 22
23 3.4 Alternative scenarios for consumer spending growth to 2030 We now combine our household disposable income projections from Table 3.2 with our alternative savings ratio scenarios from Table 3.3 to derive scenarios for real consumer spending growth to We also make illustrative further assumptions on longer term growth of spending to Specifically, as set out in Tables : Our main scenario projects real household consumer spending growth will slow down from around 1.8% in 2017 to around 1.1% in 2018 followed by a slight uptick to 1.3% the following year. The main factor behind this slowdown is higher inflation, which has squeezed real disposable income growth and living standards as the pound has depreciated in value following the EU referendum. Real disposable income growth is projected to be somewhat stronger after this year, supported by a gradual fall in the savings ratio. In the longer term, consumer spending growth is assumed to average 2% per annum in the 2020s in line with our estimate of longer term UK economic growth 4. Our optimistic scenario is stronger in the short-term due primarily to a sharper further rise in household borrowing in that pushes down the savings ratio to -0.4% by This type of scenario could be associated with better than expected progress being made in the UK-EU Brexit negotiations together with generally strong global growth conditions. In the long-run, we assume that real disposable income grows faster than the main scenario due to higher UK productivity growth and so supports average real household expenditure growth of around 2.5% per annum in the 2020s. Table 3.4: Main scenario projections of growth in real household expenditure (% per annum) 2017e 2018p 2019p 2020p Average p Real household expenditure 1.8% 1.1% 1.3% 1.7% 2.0% Real household disposable income 0.2% 0.8% 1.0% 1.4% Adjusted saving ratio 1.9% 1.6% 1.3% 1.1% Sources: ONS data for -Q3 2017, PwC estimates and projections for later periods. The figures for are illustrative assumptions for consumer spending only based on alternative views of long-term trend UK GDP growth. Table 3.5: Optimistic scenario projections of growth in real household expenditure (% per annum) 2017e 2018p 2019p 2020p Average p Real household expenditure 1.8% 2.0% 2.1% 2.3% 2.5% Real household disposable income 0.2% 1.0% 1.3% 1.7% Adjusted saving ratio 1.9% 1.0% 0.2% -0.4% Sources: ONS data for -Q3 2017, PwC estimates and projections for later periods. The figures for are illustrative assumptions for consumer spending only based on alternative views of long-term trend UK GDP growth. Table 3.6: Downside scenario projections of growth in real household expenditure (% per annum) 2017e 2018p 2019p 2020p Average p Real household expenditure 1.8% 0.4% 0.6% 1.0% 1.5% Real household disposable income 0.2% 0.7% 0.8% 1.1% Adjusted saving ratio 1.9% 2.2% 2.4% 2.5% Sources: ONS data for -Q3 2017, PwC estimates and projections for later periods. The figures for are illustrative assumptions for consumer spending only based on alternative views of long-term trend UK GDP growth. Our downside scenario assumes that the savings ratio reaches 2.2% in 2018 and then edges up again while real disposable income growth is relatively sluggish. This type of scenario could be associated with less confident UK consumers due to problems in both the global economy and the Brexit negotiations in the medium term, together with disappointing UK productivity growth in the longer term beyond While we consider our main scenario to be the most plausible, the other two alternatives are well within the bounds of possibility given current political and economic uncertainties. Consumerfocused businesses would do well to make contingency plans for the downside scenario in particular given the uncertainties associated with the Brexit process over the next few years. 4 This is calibrated to match the long-term trend GDP growth rate of around 2% per annum for the UK in the 2020s as estimated in our latest World in 2050 report here: We do not try to break down longer term consumer spending growth between household income and savings ratio changes since this is not needed for the analysis and it is hard to anticipate that far ahead how consumer borrowing behaviour in particular will evolve. UK Economic Outlook March
24
Figure 2.3 Purchasing Managers Indices of business activity. Figure 2.4 US dollar and euro exchange rates against the pound.
 Prior to 20, consumer spending was a key driver of GDP growth, but this was achieved in part by running up ever higher debts. We explore this further in our latest Precious Plastic report 2, which highlighted
Highlights and key messages for business and public policy
 Highlights and key messages for business and public policy Key projections 2018 2019 Real GDP growth 1.3% 1.6% Consumer spending growth 1.1% 1.3% Inflation (CPI) 2.5% 2.3% House prices 2.9% 2.8% Source:
Highlights and key messages for business and public policy
 Highlights and key messages for business and public policy Key projections 2018 2019 Real GDP growth 1.5% 1.6% Consumer spending growth 1.1% 1.3% Inflation (CPI) 2.7% 2.3% Source: PwC main scenario projections
Highlights and key messages for business and public policy
 Highlights and key messages for business and public policy Key projections 2019 2020 Real GDP growth 1.1% 1.6% Consumer spending growth 1.4% 1.7% Fixed investment growth -1.0% 2.1% Inflation (CPI) 1.8%
Highlights and key messages for business and public policy
 Highlights and key messages for business and public policy Key projections 2017 2018 Real GDP growth 1.5% 1.4% Consumer spending growth 1.6% 1.1% Inflation (CPI) 2.7% 2.7% Source: PwC main scenario projections
3 The outlook for consumer spending and the impact of automation 1
 3 The outlook for consumer spending and the impact of automation 1 Key points Consumer spending slowed during 2017, but has nonetheless grown by an average of 2.3 percentage points per annum faster than
3. The outlook for consumer spending and online retail 1
 3. The outlook for consumer spending and online retail 1 Key points Consumer spending growth is estimated to have slowed for a second consecutive year in 2018, but is still expected to have grown at an
UK Economic Outlook March 2017
 www.pwc.co.uk/economics Contents 1 2 3 4 Global outlook UK economic trends and prospects Consumer spending prospects after Brexit Will robots steal our jobs? 2 Global growth in 2017 should be slightly
UK Economic Outlook July 2017
 www.pwc.co.uk/economics Contents 1 2 3 4 Global outlook UK economic trends and prospects UK housing market outlook Nowcasting current GDP growth PwC 2 Global growth in 2017 should be slightly stronger
November UK Economic Outlook. How robust is the UK consumer recovery? Getting the balance right in the UK regions.
 November 2014 UK Economic Outlook How robust is the UK consumer recovery? Getting the balance right in the UK regions www.pwc.co.uk/economics Contents Highlights and key messages 3 1. Summary 4 2. UK economic
UK Economic Outlook July 2013
 www.pwc.co.uk UK Economic Outlook July 213 Feature articles: Is the UK housing market on the road to recovery? The trillion pound question are gilts the next bubble to burst? PwC firms help organisations
UK Economic Outlook. March The impact of lower oil prices on the UK economy
 March 2015 UK Economic Outlook The impact of lower oil prices on the UK economy New job creation in the UK: which regions will benefit most from the digital revolution? www.pwc.co.uk/economics Contents
4 Regional growth trends and prospects 1
 4 Regional growth trends and prospects 1 Key points has consistently outperformed other UK regions for most of the past two decades in terms of economic growth, both before and after the global financial
UK Economic Outlook July 2018
 www.pwc.co.uk/economics UK Economic Outlook July 2018 Contents 1 2 3 4 Global outlook UK economic prospects UK housing market outlook Impact of AI and related technologies on jobs in the UK UK Economic
Highlights and key messages for business and public policy
 Highlights and key messages for business and public policy Key projections 2018 2019 Real GDP growth 1.3% 1.6% Consumer spending growth 1.7% 1.5% Fixed investment growth -0.5% 0.8% Inflation (CPI) 2.5%
Economic Projections for
 Economic Projections for 2015-2017 Article published in the Quarterly Review 2015:3, pp. 86-91 7. ECONOMIC PROJECTIONS FOR 2015-2017 Outlook for the Maltese economy 1 The Bank s latest macroeconomic projections
Economic ProjEctions for
 Economic Projections for 2016-2018 ECONOMIC PROJECTIONS FOR 2016-2018 Outlook for the Maltese economy 1 Economic growth is expected to ease Following three years of strong expansion, the Bank s latest
Economic Projections :2
 Economic Projections 2018-2020 2018:2 Outlook for the Maltese economy Economic projections 2018-2020 The Central Bank s latest economic projections foresee economic growth over the coming three years to
Economic Projections :1
 Economic Projections 2017-2020 2018:1 Outlook for the Maltese economy Economic projections 2017-2020 The Central Bank s latest economic projections foresee economic growth over the coming three years to
Economic projections
 Economic projections 2017-2020 December 2017 Outlook for the Maltese economy Economic projections 2017-2020 The pace of economic activity in Malta has picked up in 2017. The Central Bank s latest economic
Highlights and key messages for business and public policy
 Highlights and key messages for business and public policy Key projections 2017 2018 Real GDP growth 1.5% 1.4% Consumer spending growth 1.6% 1.1% Inflation (CPI) 2.7% 2.7% Source: PwC main scenario projections
BCC UK Economic Forecast Q4 2015
 BCC UK Economic Forecast Q4 2015 David Kern, Chief Economist at the BCC The main purpose of the BCC Economic Forecast is to articulate a BCC view on economic topics that are relevant to our members, and
Economic Projections For 2014 And 2015
 Economic Projections For 2014 And 2015 Article published in the Quarterly Review 2014:3, pp. 77-81 7. ECONOMIC PROJECTIONS FOR 2014 AND 2015 Outlook for the Maltese economy 1 The Bank s latest macroeconomic
The UK economic and fiscal outlook
 The UK economic and fiscal outlook Report for StepChange Debt Charity Centre for Economics and Business Research ltd Contents Executive summary 3 Global economic outlook 4 UK economic outlook 8 UK regional
Svein Gjedrem: The outlook for the Norwegian economy
 Svein Gjedrem: The outlook for the Norwegian economy Address by Mr Svein Gjedrem, Governor of Norges Bank (Central Bank of Norway), at the Bergen Chamber of Commerce and Industry, Bergen, 11 April 2007.
July UK Economic Outlook. UK house prices bubble or no bubble? The UK s standing in the world.
 July 2014 UK Economic Outlook UK house prices bubble or no bubble? The UK s standing in the world www.pwc.co.uk/economics Contents Highlights and key messages 03 1 Summary 04 2 UK economic prospects 07
Monetary Policy Summary and minutes of the Monetary Policy Committee meeting ending on 15 March 2017
 Monetary Policy Summary and minutes of the Monetary Policy Committee meeting ending on 15 March 2017 Publication date: 16 March 2017 These are the minutes of the Monetary Policy Committee meeting ending
Legal services sector forecasts
 www.lawsociety.org.uk Legal services sector forecasts 2017-2025 August 2018 Legal services sector forecasts 2017-2025 2 The Law Society of England and Wales August 2018 CONTENTS SUMMARY OF FORECASTS 4
Northern Ireland Quarterly Sectoral Forecasts
 2017 Quarter 1 Northern Ireland Quarterly Sectoral Forecasts Forecast summary The Northern Ireland economy enjoyed a solid performance in 2016 with overall growth of 1.5%, the strongest rate of growth
Economic Projections :3
 Economic Projections 2018-2020 2018:3 Outlook for the Maltese economy Economic projections 2018-2020 The Central Bank s latest projections foresee economic growth over the coming three years to remain
MINUTES OF THE MONETARY POLICY COMMITTEE MEETING 4 AND 5 NOVEMBER 2009
 Publication date: 18 November 2009 MINUTES OF THE MONETARY POLICY COMMITTEE MEETING 4 AND 5 NOVEMBER 2009 These are the minutes of the Monetary Policy Committee meeting held on 4 and 5 November 2009. They
Finland falling further behind euro area growth
 BANK OF FINLAND FORECAST Finland falling further behind euro area growth 30 JUN 2015 2:00 PM BANK OF FINLAND BULLETIN 3/2015 ECONOMIC OUTLOOK Economic growth in Finland has been slow for a prolonged period,
Regional Forecast and Analysis Greater London (example) Sample from June 2015 forecast
 Sample from June 2015 forecast") Regional Forecast and Analysis Greater London (example) from June 2015 forecast Greater South London East Economic Outlook CONTENTS 1. Executive Summary 2. UK Economy Prospects & key risks Recent trends
Regional Forecast and Analysis Greater London (example) from June 2015 forecast Greater South London East Economic Outlook CONTENTS 1. Executive Summary 2. UK Economy Prospects & key risks Recent trends
BANK OF FINLAND ARTICLES ON THE ECONOMY
 BANK OF FINLAND ARTICLES ON THE ECONOMY Table of Contents Global economy to grow steadily 3 FORECAST FOR THE GLOBAL ECONOMY Global economy to grow steadily TODAY 1:00 PM BANK OF FINLAND BULLETIN 1/2017
ECONOMIC OUTLOOK UNIVERSITY OF CYPRUS ECONOMICS RESEARCH CENTRE. January 2017 SUMMARY. Issue 17/1
 SUMMARY UNIVERSITY OF CYPRUS The expansion of real economic activity in Cyprus is expected to continue in 2017 at rates similar to those registered in 2016. Real GDP is forecasted to have increased by
Projections for the Portuguese Economy:
 Projections for the Portuguese Economy: 2018-2020 March 2018 BANCO DE PORTUGAL E U R O S Y S T E M BANCO DE EUROSYSTEM PORTUGAL Projections for the portuguese economy: 2018-20 Continued expansion of economic
Monetary Policy Summary and minutes of the Monetary Policy Committee meeting ending on 13 December 2017
 Monetary Policy Summary and minutes of the Monetary Policy Committee meeting ending on 13 December 2017 Publication date: 14 December 2017 These are the minutes of the Monetary Policy Committee meeting
Asda Income Tracker. Report: December 2015 Released: January Centre for Economics and Business Research ltd
 Asda Income Tracker Report: December 2015 Released: January 2016 M a k i n g B u s i n e s s S e n s e Centre for Economics and Business Research ltd Unit 1, 4 Bath Street, London EC1V 9DX t 020 7324 2850
Svein Gjedrem: Interest rates, the exchange rate and the outlook for the Norwegian economy
 Svein Gjedrem: Interest rates, the exchange rate and the outlook for the Norwegian economy Speech by Mr Svein Gjedrem, Governor of Norges Bank (Central Bank of Norway), to the Mid-Norway Chamber of Commerce
MINUTES OF THE MONETARY POLICY COMMITTEE MEETING 7 AND 8 OCTOBER 2009
 Publication date: 21 October 2009 MINUTES OF THE MONETARY POLICY COMMITTEE MEETING 7 AND 8 OCTOBER 2009 These are the minutes of the Monetary Policy Committee meeting held on 7 and 8 October 2009. They
Ireland. Eurozone rebalancing. EY Eurozone Forecast June Portugal Slovakia Slovenia Spain. Latvia Lithuania Luxembourg Malta Netherlands
 EY Forecast June 2015 rebalancing recovery Outlook for Rising domestic demand improves prospects for 2015 Published in collaboration with Highlights The Irish economy grew by 4.8% last year, which was
Global PMI. Global economy buoyed by rising US strength. June 12 th IHS Markit. All Rights Reserved.
 Global PMI Global economy buoyed by rising US strength June 12 th 2018 2 Global PMI rises but also brings signs of slower future growth At 54.0 in May, the headline JPMorgan Global Composite PMI, compiled
Construction Industry Focus Survey. Volume 27 Issue 2 November 2017
 Construction Industry Focus Survey Volume 27 Issue 2 1 CONTENTS Executive Summary 1 1. Leading Activity Indicator 1 2. Activity by sector and constraints Residential, Nonresidential, Civil Engineering
Growth to accelerate. A quarterly analysis of trends in the Irish economy
 Produced by the Economic Research Unit July 2014 A quarterly analysis of trends in the Irish economy Growth to accelerate Strong start to 2014 Recovery becoming more broad-based GDP growth revised up for
Jan F Qvigstad: Outlook for the Norwegian economy
 Jan F Qvigstad: Outlook for the Norwegian economy Address by Mr Jan F Qvigstad, Deputy Governor of Norges Bank (Central Bank of Norway), at Sparebank 1 Fredrikstad, 4 November 2009. The text below may
Asda Income Tracker. Report: September 2015 Released: October Centre for Economics and Business Research ltd
 Asda Income Tracker Report: September 2015 Released: October 2015 M a k i n g B u s i n e s s S e n s e Centre for Economics and Business Research ltd Unit 1, 4 Bath Street, London EC1V 9DX t 020 7324
Asda Income Tracker. Report: June 2012 Released: July Centre for Economics and Business Research ltd
 Asda Income Tracker Report: June 2012 Released: July 2012 M a k i n g B u s i n e s s S e n s e Centre for Economics and Business Research ltd Unit 1, 4 Bath Street, London EC1V 9DX t 020 7324 2850 w www.cebr.com
Asda Income Tracker. Report: December 2012 Released: January Centre for Economics and Business Research ltd
 Asda Income Tracker Report: December 2012 Released: January 2013 M a k i n g B u s i n e s s S e n s e Centre for Economics and Business Research ltd Unit 1, 4 Bath Street, London EC1V 9DX t 020 7324 2850
The reasons why inflation has moved away from the target and the outlook for inflation.
 BANK OF ENGLAND Mark Carney Governor The Rt Hon George Osborne Chancellor of the Exchequer HM Treasury 1 Horse Guards Road London SW1A2HQ 12 May 2016 On 12 April, the Office for National Statistics (ONS)
Eurozone Economic Watch. July 2018
 Eurozone Economic Watch July 2018 Eurozone: A shift to more moderate growth with increased downward risks BBVA Research - Eurozone Economic Watch July 2018 / 2 Hard data improved in May but failed to recover
Minutes of the Monetary Policy Council decision-making meeting held on 6 July 2016
 Minutes of the Monetary Policy Council decision-making meeting held on 6 July 2016 At the meeting, members of the Monetary Policy Council discussed monetary policy against the background of macroeconomic
a labour market that has continued to exhibit strong growth in employment, but weak growth in earnings and productivity; and
 1 Executive summary 1.1 Twice a year at the OBR, we provide a detailed central forecast for the economy and the public finances. These forecasts provide a transparent benchmark against which to judge the
MACROECONOMIC FORECAST
 MACROECONOMIC FORECAST Autumn 2017 Ministry of Finance of the Republic of Bulgaria The Autumn macroeconomic forecast of the Ministry of Finance takes into account better performance of the Bulgarian economy
Global PMI. Solid Q2 growth masks widening growth differentials. July 7 th IHS Markit. All Rights Reserved.
 Global PMI Solid Q2 growth masks widening growth differentials July 7 th 2017 2 Widening developed and emerging world growth trends The global economy enjoyed further steady growth in June, according to
Eurozone. EY Eurozone Forecast September 2014
 Eurozone EY Eurozone Forecast September 2014 Austria Belgium Cyprus Estonia Finland France Germany Greece Ireland Italy Latvia Luxembourg Malta Netherlands Portugal Slovakia Slovenia Spain Outlook for
EUROPEAN EXPORT INDEX Q4 2017
 EUROPEAN EXPORT INDEX Q4 2017 BDO EXPORT INDEX KEY FIGURES The BDO Export Indices are composite indicators which provide snapshots of the export markets in Europe s five largest economies Germany, UK,
Outlook for Economic Activity and Prices
 Not to be released until : p.m. Japan Standard Time on Saturday, October 31, 15. October 31, 15 Bank of Japan Outlook for Economic Activity and Prices October 15 (English translation prepared by the Bank's
September Economics Update. Economic and housing market. Bradford Property Forum. Created by:
 September 2014 Economics Update Economic and housing market Bradford Property Forum Created by: Bank Rate timing of first increase Q4 2014 or Q1 2015? The debate over the timing of the first increase to
Asda Income Tracker. Report: December 2011 Released: January Centre for Economics and Business Research ltd
 Asda Income Tracker Report: December 2011 Released: January 2012 M a k i n g B u s i n e s s S e n s e Centre for Economics and Business Research ltd Unit 1, 4 Bath Street, London EC1V 9DX t 020 7324 2850
Outlook for Economic Activity and Prices (July 2018)
") Outlook for Economic Activity and Prices (July 2018) July 31, 2018 Bank of Japan The Bank's View 1 Summary Japan's economy is likely to continue growing at a pace above its potential in fiscal 2018, mainly
Outlook for Economic Activity and Prices (July 2018) July 31, 2018 Bank of Japan The Bank's View 1 Summary Japan's economy is likely to continue growing at a pace above its potential in fiscal 2018, mainly
Eurozone Economic Watch Higher growth forecasts for January 2018
 Eurozone Economic Watch Higher growth forecasts for 2018-19 January 2018 Eurozone Economic Watch January 2018 Eurozone: Higher growth forecasts for 2018-19 Our MICA-BBVA model estimates a broadly stable
remain the same until the end of 2018.
 We predict that the European interest rate will remain the same until the end of 2018. Throughout the past three years the interest rate has remained low. In 2017 and 2016 it has been 0.00% and in 2015
FISCAL COUNCIL OPINION ON THE SUMMER FORECAST 2018 OF THE MINISTRY OF FINANCE
 FISCAL COUNCIL OPINION ON THE SUMMER FORECAST 2018 OF THE MINISTRY OF FINANCE September 2018 Contents Opinion... 3 Explanatory Report... 4 Opinion on the summer forecast 2018 of the Ministry of Finance...
MEDIUM-TERM FORECAST
 MEDIUM-TERM FORECAST Q2 2010 Published by: Národná banka Slovenska Address: Národná banka Slovenska Imricha Karvaša 1 813 25 Bratislava Slovakia Contact: Monetary Policy Department +421 2 5787 2611 +421
The ECB Survey of Professional Forecasters. First quarter of 2017
 The ECB Survey of Professional Forecasters First quarter of 217 January 217 Contents 1 Near-term inflation expectations a little higher, due to oil price rises 3 2 Longer-term inflation expectations unchanged
JUNE 2015 EUROSYSTEM STAFF MACROECONOMIC PROJECTIONS FOR THE EURO AREA 1
 JUNE 2015 EUROSYSTEM STAFF MACROECONOMIC PROJECTIONS FOR THE EURO AREA 1 1. EURO AREA OUTLOOK: OVERVIEW AND KEY FEATURES The June projections confirm the outlook for a recovery in the euro area. According
RICS Economic Research
 RICS Economic Research / February 7 th 2014 Michael Hanley Economist www.rics.org/economics The Outlook for the Construction Sector Growth of 4% expected over 2014 Private housing and infrastructure to
The Outlook for the UK Consumer Sector A Note. Gavyn Davies. 9 May Overview
 The Outlook for the UK Consumer Sector A Note Gavyn Davies 9 May 2018 Overview Consumers expenditure accounts for 66 per cent of GDP in the UK. There is therefore a huge variety of investment opportunities
UK Outlook. Economy in holding pattern amid Brexit uncertainty. July Economic Research Unit
 UK Outlook July Economy in holding pattern amid Brexit uncertainty While it has been a game of two halves for the UK economy over the first six months of - poor weather dampening activity in the first
Asda Income Tracker. Report: July 2016 Released: August Centre for Economics and Business Research ltd
 Asda Income Tracker Report: July 2016 Released: August 2016 M a k i n g B u s i n e s s S e n s e Centre for Economics and Business Research ltd Unit 1, 4 Bath Street, London EC1V 9DX t 020 7324 2850 w
LESS DYNAMIC GROWTH AMID HIGH UNCERTAINTY
 OVERVIEW: The European economy has moved into lower gear amid still robust domestic fundamentals. GDP growth is set to continue at a slower pace. LESS DYNAMIC GROWTH AMID HIGH UNCERTAINTY Interrelated
FSB VOICE OF SMALL BUSINESS fsb.org.uk
 Q4 FSB VOICE OF SMALL BUSINESS INDEX QUARTER 4, 2016 @fsb_policy fsb.org.uk SBI Q4 2016 Small business confidence rebounded in the last quarter, but cost pressures are at their highest since early 2014
Interest Rate Forecast
 Interest Rate Forecast Economics January Highlights Global growth firms Waiting for Trumponomics Bank of Canada on hold Recent growth momentum in the global economy continued in December and looks to extend
Monetary Policy Summary and minutes of the Monetary Policy Committee meeting ending on 10 May 2017
 Monetary Policy Summary and minutes of the Monetary Policy Committee meeting ending on 10 May 2017 Publication date: 11 May 2017 These are the minutes of the Monetary Policy Committee meeting ending on
FSB VOICE OF SMALL BUSINESS fsb.org.uk
 Q1 FSB VOICE OF SMALL BUSINESS INDEX QUARTER 1, 2017 @fsb_policy fsb.org.uk Q1 2017 FSB Small Business Index 2 SBI Q1 2017 fsb.org.uk Small business confidence at highest in over a year, but firms are
1 Executive summary. Overview
 1 Executive summary Overview 1.1 Relatively little time has passed since our November forecast and the outlook for the economy and public finances looks broadly the same. The economy has slightly more
Editor: Thomas Nilsson. The Week Ahead Key Events Jul, 2017
 Editor: Thomas Nilsson The Week Ahead Key Events 10 16 Jul, 2017 European Sovereign Rating Reviews Recent rating reviews Upcoming rating reviews Source: Bloomberg Monday 10, 08.00 NOR: CPI (Jun) SEB Cons.
Minutes of the Monetary Policy Council decision-making meeting held on 2 September 2015
 Minutes of the Monetary Policy Council decision-making meeting held on 2 September 2015 Members of the Monetary Policy Council discussed monetary policy against the background of the current and expected
Release Date : 26 April Economic update - March Key data highlights:
 Release Date : 26 April Economic update - ch Key data highlights:. The headline figures in ch showed positive developments across key economic fundamentals, pointing to normalising economic conditions.
Macroeconomic and financial market developments. March 2014
 Macroeconomic and financial market developments March 2014 Background material to the abridged minutes of the Monetary Council meeting 25 March 2014 Article 3 (1) of the MNB Act (Act CXXXIX of 2013 on
Global Travel Service
 15 Nov 2018 Global Travel Service Global Highlights, November 2018 Economists Adam Sacks President of Tourism Economics asacks@oxfordeconomics. com David Goodger Director of Tourism Economics dgoodger@oxfordeconomi
South African Reserve Bank STATEMENT OF THE MONETARY POLICY COMMITTEE. Issued by Lesetja Kganyago, Governor of the South African Reserve Bank
 South African Reserve Bank PRESS STATEMENT EMBARGO DELIVERY 30 March 2017 STATEMENT OF THE MONETARY POLICY COMMITTEE Issued by Lesetja Kganyago, Governor of the South African Reserve Bank Since the previous
DECEMBER 2017 BREXIT: BDO S MONTHLY ECONOMIC UPDATE
 DECEMBER 2017 BREXIT: BDO S MONTHLY ECONOMIC UPDATE Welcome to the 18th edition of BDO s monthly economic outlook a temperature check of how UK businesses are feeling in the post-referendum world. Our
RECOVERY CONTINUES FOR LOGISTICS REAL ESTATE
 RECOVERY CONTINUES FOR LOGISTICS REAL ESTATE World events trigger soft patch The global economic soft patch in the first half of 2011 was primarily caused by the cost of oil reaching $114 per barrel, rising
Insolvency forecasts. Economic Research August 2017
 Insolvency forecasts Economic Research August 2017 Summary We present our new insolvency forecasting model which offers a broader scope of macroeconomic developments to better predict insolvency developments.
INFLATION REPORT PRESS CONFERENCE. Thursday 10 th May Opening Remarks by the Governor
 INFLATION REPORT PRESS CONFERENCE Thursday 10 th May 2018 Opening Remarks by the Governor Three months ago, the MPC said that an ongoing tightening of monetary policy over the next few years would be appropriate
South African Reserve Bank STATEMENT OF THE MONETARY POLICY COMMITTEE. Issued by Lesetja Kganyago, Governor of the South African Reserve Bank
 South African Reserve Bank PRESS STATEMENT 24 January 2017 STATEMENT OF THE MONETARY POLICY COMMITTEE Issued by Lesetja Kganyago, Governor of the South African Reserve Bank Since the previous meeting of
The Peterborough Census Metropolitan Area (CMA) spans the city of Peterborough and six other jurisdictions. The area is
 spans the city of Peterborough and six other jurisdictions. The area is") PETERBOROUGH CENSUS METROPOLITAN AREA Presented by the Credit Unions of Ontario and the Ontario Chamber of Commerce 1 Peterborough s housing market saw a banner year in 2015. The Peterborough Census Metropolitan
PETERBOROUGH CENSUS METROPOLITAN AREA Presented by the Credit Unions of Ontario and the Ontario Chamber of Commerce 1 Peterborough s housing market saw a banner year in 2015. The Peterborough Census Metropolitan
UK Business Confidence Monitor Q4 2016
 UK Business Confidence Monitor 2016 BUSINESS WITH CONFIDENCE icaew.com/bcm 2016 Overall confidence -9.8 Export sales growth Input price growth remains negative to outpace domestic sales rising faster than
Northern Ireland Quarterly Sectoral Forecasts
 Economic Analysis Northern Ireland Quarterly Sectoral Forecasts 2018 Quarter 1 Northern Ireland Quarterly Sectoral Forecasts Forecast summary For the Northern Ireland economy, the first part of 2018 has
International Monetary and Financial Committee
 International Monetary and Financial Committee Thirty-Third Meeting April 16, 2016 IMFC Statement by Angel Gurría Secretary-General The Organisation for Economic Co-operation and Development (OECD) IMF
Release Date : 26 June Economic update - May Key data highlights:
 Release Date : 26 June Economic update - Key data highlights:. The UK economy is growing at its slowest pace in more than five years, marked by weaker manufacturing and construction growth. Consumer-facing
MACROECONOMIC FORECAST
 MACROECONOMIC FORECAST Spring 17 Ministry of Finance of the Republic of Bulgaria Bulgarian economy is expected to expand by 3% in 17 driven by domestic demand. As compared to 16, the external sector will
 2012 6 http://www.bochk.com 2 3 4 ECONOMIC REVIEW(A Monthly Issue) June, 2012 Economics & Strategic Planning Department http://www.bochk.com An Analysis on the Plunge in Hong Kong s GDP Growth and Prospects
Explore the themes and thinking behind our decisions.
 ASSET ALLOCATION COMMITTEE VIEWPOINTS Fourth Quarter 2016 These views are informed by a subjective assessment of the relative attractiveness of asset classes and subclasses over a 6- to 18-month horizon.
Jarle Bergo: Monetary policy and the cyclical situation
 Jarle Bergo: Monetary policy and the cyclical situation Speech by Mr Jarle Bergo, Deputy Governor of Norges Bank (Central Bank of Norway), at a meeting with local authorities and the business community,
The ECB Survey of Professional Forecasters. Fourth quarter of 2016
 The ECB Survey of Professional Forecasters Fourth quarter of 16 October 16 Contents 1 Inflation expectations for 16-18 broadly unchanged 3 2 Longer-term inflation expectations unchanged at 1.8% 4 3 Real
Irish Economic Update AIB Treasury Economic Research Unit
 Irish Economic Update AIB Treasury Economic Research Unit 9th October 2018 Budget 2019 Public Finances in Balance The Irish economy has performed strongly in recent years, boosting tax revenues. Corporation
1 Executive summary. Overview
 1 Executive summary Overview 1.1 In headline terms, the UK economy has outperformed our March forecast, with GDP expected to grow by 3.0 per cent this year and unemployment already down to 6.0 per cent.
In this report we discuss three important areas of the economy that have received a great deal of attention recently, namely:
 March 26, 218 Executive Summary George Mokrzan, PH.D., Director of Economics In this report we discuss three important areas of the economy that have received a great deal of attention recently, namely: