Highlights and key messages for business and public policy
|
|
|
- Rodney Brown
- 5 years ago
- Views:
Transcription

1
2
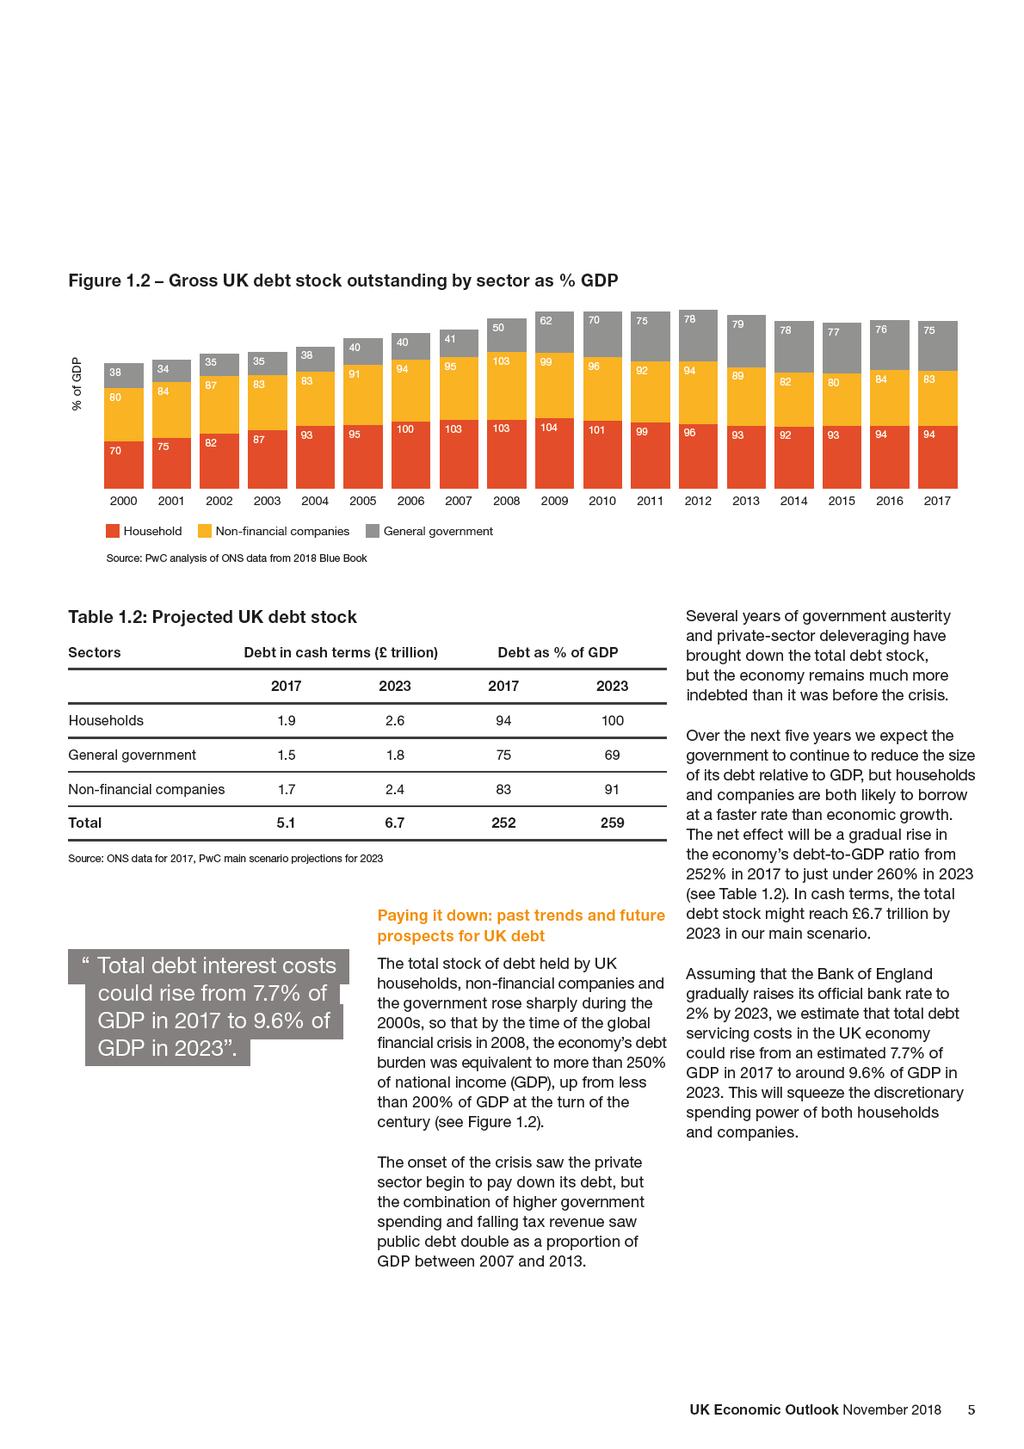
3 Highlights and key messages for business and public policy Key projections Real GDP growth 1.3% 1.6% Consumer spending growth 1.7% 1.5% Fixed investment growth -0.5% 0.8% Inflation (CPI) 2.5% 2.2% Source: PwC main scenario projections Rising private sector debt likely to outweigh declining public debt over next five years Over the next five years we expect the government to reduce gradually the size of its debt relative to GDP, but households and companies are both likely to borrow at a faster rate than economic growth. The net effect will be a gradual rise in the UK economy s overall debt-to-gdp ratio from 252% in 2017 to around 260% in Recent UK developments and prospects In our main scenario, we project UK growth to remain modest at around 1.3% in 2018 and 1.6% in This reflects the drag on business investment from ongoing economic and political uncertainty relating to the outcome of the Brexit negotiations, which remain a major source of downside risk to our main scenario at the time of writing. But the higher government spending and short-term tax cuts announced in the Budget will provide some support for growth in The stronger global economy, and the competitive value of the pound, have boosted UK exports and inbound tourism, offering some support to the economy over the past two years. But the Eurozone economy has slowed recently and any escalation of international trade tensions could dampen global growth in 2019 and beyond. Service sector growth should remain modest but positive in 2019, but manufacturing growth has slowed markedly recently from the relatively high rates seen in Construction sector output has fallen back since early 2017 due to the weakness of commercial property investment in particular and looks set to remain relatively weak in the short term, given the uncertainty around Brexit. London has grown significantly faster than other UK regions for most of the past three decades, but recently there have been signs from both the labour and housing markets that London s relative performance has been less strong. We therefore expect London to grow at only slightly above the UK average rate in , with limited variations in growth across regions over this period. In our main scenario with a smooth Brexit, we assume that the Bank of England raises interest rates by a quarter of a percent to 1% in mid But the precise timing of this will be data-dependent and the pace of any subsequent rate increases are likely to remain limited and gradual. Assuming that the Bank of England gradually raises interest rates to 2% by 2023, we project that total debt servicing costs in the UK economy could rise from an estimated 7.7% of GDP in 2017 to around 9.6% of GDP in This will squeeze the discretionary spending power of both households and companies. UK growth could average 1.75% in 2020s UK economic growth has averaged below 2% in each of the first two decades of this century, the weakest performance in any decade since the Second World War. Our central estimate is that average UK growth may remain relatively subdued at around 1.75% per annum in the 2020s, allowing for the effects of an ageing population. But there is scope for government, working with business, to boost UK growth to 2% or more by promoting artificial intelligence and other new technologies, reforming tax and regulation to support productivity growth, encouraging greater participation in the labour force by older workers, and retaining an open approach to EU and global trade after Brexit. UK Economic Outlook November
4
5
6
7
8
9
10 Figure 2.5 Trends in productivity and employment Index (Q = 100) Q Q1 Productivity (per worker) Source: ONS 2002 Q Q Q Q Q Q Q1 Employment 2009 Q Q Q Q Q Q Q Q Q Q1 The most convincing explanation from our perspective is that business investment, while picking up since the recession, has not done so to the extent seen in most past recovery cycles. Many businesses have been reluctant to invest in new labour-saving automation technologies that are relatively risky when compared to the alternative of using more low-cost labour, including migrant workers from the EU. Uncertainty around Brexit has been a further dampener on business investment over the past two years, which has been relatively subdued at a time when global economic conditions and very low interest rates might normally have been expected to lead to a much stronger performance. UK creates record numbers of jobs, but productivity growth subdued since the crisis In the July 2017 edition of UK Economic Outlook, we discussed how the recent combination of low wage growth and low unemployment indicated a flattening of the traditional Phillips Curve (which describes the historical negative relationship between wage inflation and unemployment). One of the key reasons for subdued real wage growth has been relatively weak UK productivity growth since the financial crisis as illustrated in Figure 2.5 for output per worker. The positive side of this has been strong jobs growth, particularly since Recent trends have been less clear cut, with jobs growth slowing down in the three months to August 2018 but productivity growth and real earnings growth picking up a little. But the ideal combination of both strong jobs growth and robust productivity and real earnings growth, as seen before the crisis, has generally proved elusive. Why has productivity been weak since the crisis? Many possible explanations have been put forward for recent weak productivity growth, including measurement error (in particular, not capturing the full benefit of digital innovations like smartphones). Soon after the recession, some put it down to labour hoarding by firms or credit constraints by banks, but both these explanations are less convincing now after eight years of recovery since mid Reduced competition in some sectors might be a possible explanation, but against that some other sectors have seen their markets disrupted by technologysavvy new entrants, which would usually be associated with increased innovation and productivity growth. Another possible explanation is that zombie firms could have been kept alive by low interest rates despite low productivity, impeding the reallocation of capital and labour to higher productivity activities within the economy. Looking years ahead, emerging technologies like robotics and artificial intelligence could hold the potential for faster productivity growth 3, with a net impact on UK employment that we think could be broadly neutral in the long run as we discuss in detail in the July 2018 edition of this report 4. But, at least for the next few years, productivity growth may remain relatively subdued, with any recovery being at the expense of slower growth in jobs and hours worked. 3 See, for example, our report on the potential impact of AI on the UK economy here, which suggests gains of up to 10% of GDP by 2030: 4 Available here: 10
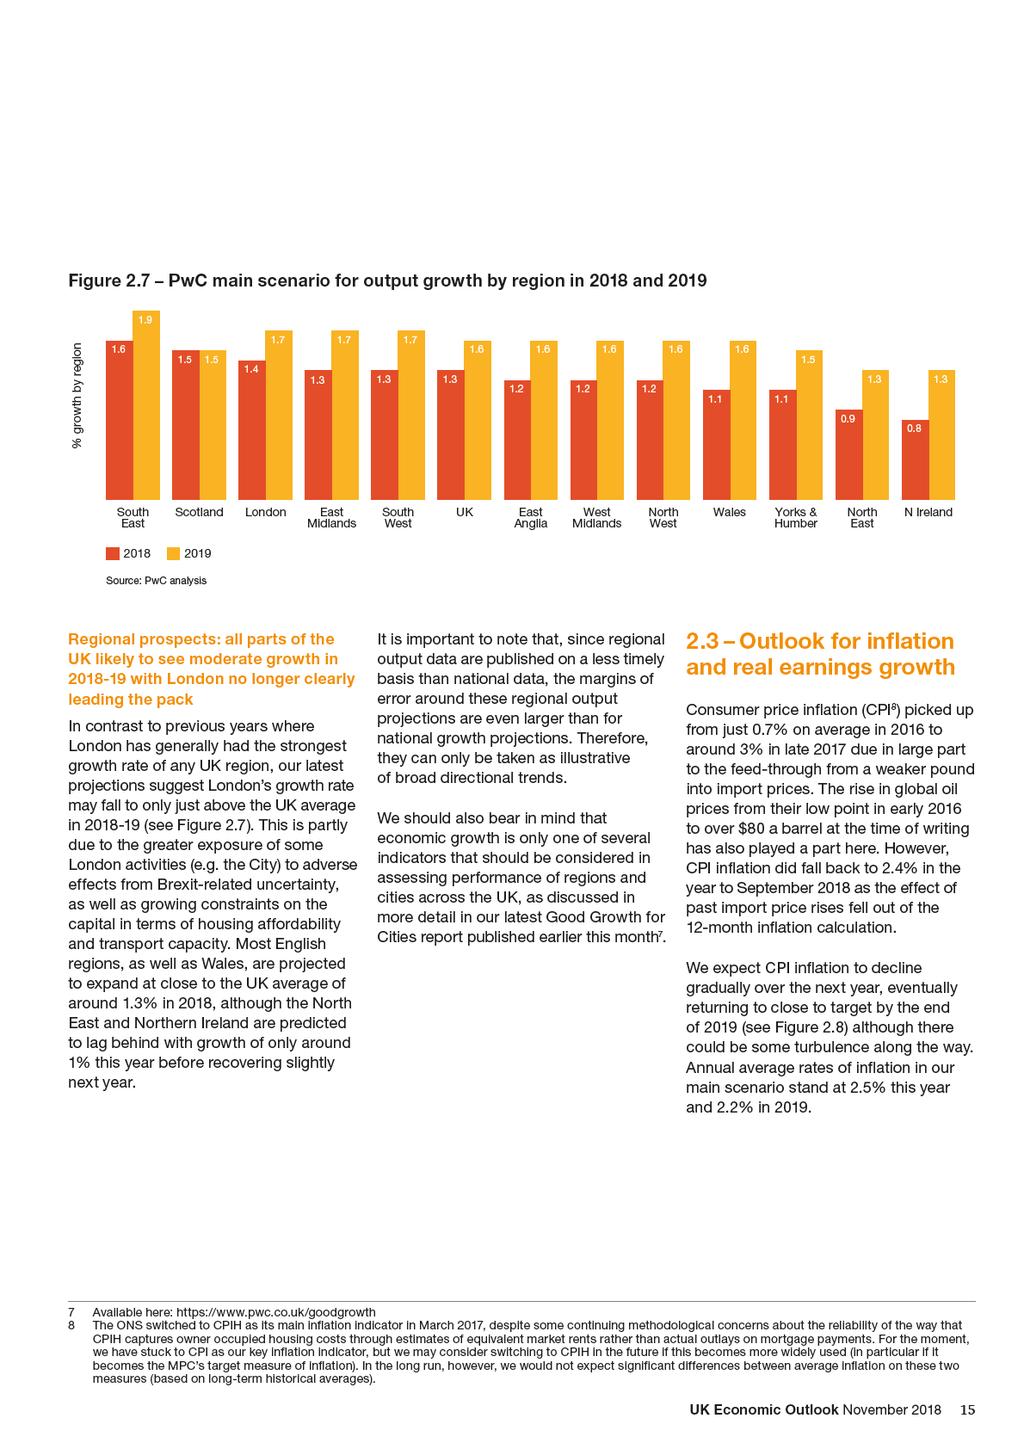
11 2.2 Economic growth prospects: national, sectoral and regional Our main scenario is for real GDP growth of around 1.3% in 2018 and 1.6% in 2019, somewhat below the UK s estimated longer term trend growth rate of just under 2% (as discussed further in Section 4 of this report). Further details of this main scenario projection are set out in Table 2.1. We assume in this main scenario that the Brexit negotiations will proceed reasonably smoothly, and therefore that the UK will avoid an extreme hard Brexit, where it falls out of the EU in March 2019 without any trade deal or transitional arrangement, which would be highly disruptive. But clearly this is a key downside risk as discussed further below. Slower year-on-year growth in 2017 was driven primarily by the squeeze on real household incomes from higher inflation. But this effect has faded and, as noted above, consumer spending growth now looks set to average around 1.7% in 2018, a little faster than we expected at the time of the last edition of this report in July. But we do expect some moderation in this indicator in 2019, to 1.5%, in part due to limits on the scope for further rises in household debt, which has risen in recent years as discussed further in Section 3 of this report. Real earnings growth should be stronger in 2019, and income tax cuts in the Budget will provide some further support for household spending power, but jobs growth is likely to weaken. Table 2.1: Main scenario projections for UK growth and inflation % real annual growth unless otherwise stated Total fixed investment growth lost momentum during the course of 2017 and the first half of 2018 and is expected to remain relatively weak in late 2018 and early 2019 as Brexit-related uncertainty drags on business investment. However, it is possible that it could pick up later in 2019 once the transition period is in place and assuming (as we do in this main scenario) reasonable progress on agreeing a future UK-EU trading relationship. The Budget announced a significant rise in government consumption spending in 2019/20, particularly on the NHS, which will provide some support for the economy in that year and beyond. Higher public spending could also feed through into somewhat higher inflation and interest rates in the medium term, which would tend to dampen the impact on economic growth, but this is likely to be a lagged response that would not have a significant effect until 2020 or later GDP Consumer spending Government consumption Fixed investment Domestic demand Net exports (% of GDP) CPI inflation (%: annual average) Source: Latest ONS estimates for , PwC main scenario for Overall, UK domestic demand growth is expected to average around % per annum in , down from an average rate of around 2.7% in Net exports are projected to have a broadly neutral impact on growth over this period, so it is domestic demand that is likely to be the main driver of the economy. Or main scenario for UK GDP growth in has not changed materially since our last report in July, although this reflects the offsetting effects of somewhat stronger than expected consumer spending and government consumption growth and slightly weaker business investment and net trade. UK Economic Outlook November
12
13 Table 2.2: Key issues and questions for businesses preparing for Brexit Issues Implications Questions Trade Tax Regulation Sectoral effects Foreign direct investment (FDI) Labour market Uncertainty The EU is the UK s largest export partner, accounting for around 44% of total UK exports leaving the EU is likely to make trade with EU more difficult, but the extent of this will depend on the type of deal, if any, agreed with the EU27. The UK would gain more control over VAT and some other taxes. But Brexit could also open the door to new tax initiatives within the EU that the UK might currently have sought to block. The UK is subject to EU regulation. Brexit could mean less red tape in some areas. But it could also mean that UK businesses need to adapt to a different set of regulations, which could be costly. The UK is the leading European financial services hub, which is a sector that could be significantly affected by Brexit. Other sectors which rely on the EU single market could also feel a strong impact. FDI from the EU makes up around 45% of the total stock of FDI in the UK. Brexit could put some of this investment at risk. The UK may change its migration policies. Currently EU citizens can live and work in the UK without restrictions. Businesses will need to adjust to any change in this regime or in work preferences for EU nationals Uncertainty has increased since the referendum and this seems likely to continue through the Brexit negotiation period. How much do you rely on EU countries for revenue growth? Have you reviewed your supply chain to identify the potential impact of tariffs and additional customs procedures on your procurement and logistics? Have you identified which third party contracts would require renegotiation in different Brexit scenarios (EEA/FTA/WTO)? What contingency plans have you made for a no deal Brexit in March 2019 without a transition period? Have you thought about the impact of potential changes to the UK and EU tax regimes after Brexit? Have you upgraded your systems to deal with a significant volume of tax changes? Have you quantified the potential regulatory impact of Brexit to keep your stakeholders up-to-date? How flexible is your IT infrastructure to deal with potential changes to Data Protection laws? Is your compliance function ready to deal with any new reporting requirements arising from Brexit? Have you briefed potential investors on the impact of Brexit for your sector and organisation? How up-to-date are your contingency plans in place to deal with different Brexit scenarios, including no deal variants? Are you aware of the impact of potential volatility in financial markets on your capital raising plans? How much do your rely on FDI for growth? How does Brexit affect your location decisions? How are your competitors responding to the risk of Brexit? Are they relocating any key functions? How reliant is your value chain on EU labour? Have you communicated with your UK-based employees who are nationals of other EU countries? What advice should you give them? Have you considered the additional cost of hiring EU labour after Brexit? Could changes in access to EU labour increase the case for automation? How well prepared are you to manage future volatility in the exchange rate (and other asset prices) related to Brexit? Is your organisation ready for a worst-case scenario where there is a prolonged period of uncertainty and/or a no deal Brexit? Source: PwC UK Economic Outlook November
14 Most industry sectors projected to see relatively modest growth in The sector dashboard in Table 2.3 shows latest ONS estimates of growth rates for 2017 along with our projected main scenario growth rates for 2018 and 2019 for five of the largest sectors within the UK economy. The table also includes a summary of the key trends and issues affecting each sector. There has been a particular downward trend in growth in the distribution, hotels and restaurants sector, which recorded output growth of almost 4% in 2016, but this slowed to just 2.1% in We expect this to pick up a little, to around 2.5% in 2018, given strong summer sales, but to moderate again to just under 2% in Manufacturing was relatively stronger with 2.6% growth in 2017, but this has slowed more recently to an estimated 1.2% this year and we expect similar growth of 1.4% next year in our main scenario. Construction, as ever, has been volatile, with growth dropping dramatically to just 0.6% in 2018 according to our latest estimates. We expect some recovery in 2019, though this is partly just due to a statistical bounce-back from the lows seen in early 2018, rather than strong underlying growth in the sector. This is also a sector where confidence is critical, and which is therefore exposed to any loss of this related to a lessfavourable Brexit outcome. Business services and finance growth should remain relatively steady at around % per annum, although there are significant downside risks if Brexit negotiations go less smoothly than we assume in our main scenario. UK financial services companies could be particularly badly affected by any loss of access to EU markets, notably through the possible loss of passporting rights for UK-based firms, although there is also positive longer term potential for the sector beyond Brexit 6. Table 2.3: UK sector dashboard Growth Issues Key issues/trends Manufacturing (10%) 2.6% 1.2% 1.4% Manufacturing PMI has moderated somewhat in recent months Exporters gained in 2017 and early 2018 from a weaker pound and a stronger global economy, though there are concerns about trade wars going forward Construction (6%) 7.2% 0.6% 2.0% Construction PMI was relatively weak in recent months, although remaining volatile The construction sector fell back sharply from early 2017, despite a modest recovery in activity the summer of 2018 The government has boosted infrastructure investment to try to offset weakness in commercial construction due to Brexit Distribution, hotels & restaurants (13%) 2.1% 2.5% 2.0% A weaker pound since 2016 has boosted tourism, both from overseas and domestically, leading to increased expenditure in the hospitality sector But its broader effect has been to push up import prices and inflation, slowing down real spending growth (though retail sales picked up this summer as these effects started to fade) Business services and finance (34%) 2.1% 1.5% 1.8% The financial sector remains particularly concerned about the possible implications of Brexit, especially if this involves the loss of EU passporting rights The Bank of England has increased the counter-cyclical capital buffer to constrain consumer debt levels, which may impact lending by retail banks Business services have, however, continued to see relatively strong growth in general Government and other services (22%) 0.4% 0.4% 1.2% Public services continue to face tight budgets, but austerity was eased in the Budget and NHS spending is planned to increase significantly Total GDP 1.7% 1.3% 1.6% Sources: ONS for 2017 estimates, PwC for 2018 and 2019 main scenario projections and key issues. These are five of the largest sectors but they do not cover the whole economy - their GVA shares only sum to around 85% rather than 100% 6 For more on the future of UK financial services after Brexit, see our report with TheCityUK here: 14
15
16
17 2.4 Monetary and fiscal policy The Monetary Policy Committee (MPC) raised interest rates from 0.5% to 0.75% in August in response to indications that the sharp dip in growth in the first quarter of the year was a blip and that wages had started to grow at a faster rate again. They also signalled the intention to raise interest rates at an average rate of around 25 basis points per year for the next few years, but the timing of this will depend on how both the economic data and the Brexit negotiations evolve and, at present, a further rate rise seems unlikely before mid In the medium term, we assume further small and gradual rate rises, but interest rates will remain very low by historical standards for the foreseeable future. UK base rates may end up at around 2-3% as opposed to the 5% pre-crisis norm. In his Budget on 29 October, the Chancellor benefited from a significant and persistent improvement in official public finance projections by the OBR. This reflected what the OBR judged to be a structural increase in the tax-to-gdp ratio and well as a lower sustainable unemployment rate of around 4% going forward. This could have allowed the Chancellor to balance the budget by 2023/24 based on unchanged tax and spending policies. Instead, he used almost all of this fiscal windfall to fund the increase in NHS spending over the next five years announced by the Prime Minister back in June. There were also modest net tax cuts in the short term, but these will be offset by other tax rises in the medium term. The net effect of the Budget measures will be to give a boost to economic growth in the short term, which has caused us to revise up our projected GDP growth rate in 2019 slightly, as discussed above. But, in the medium term, looser fiscal policy could also feed through into higher inflation and interest rates, which would dampen any boost to real economic growth. The OBR forecasts also rely on assuming, as we do, a relatively smooth Brexit. A disorderly no deal Brexit could lead the Chancellor to relax spend more and/or cut taxes further in the short term to cushion the impact on the economy in , but could require renewed austerity in the longer term given the damage that a disorderly Brexit would potentially do to the economy and the public finances. 2.5 Summary and conclusions UK economic growth has slowed over the past two years as above target inflation has squeezed consumers, the housing market has cooled and Brexit-related uncertainty has led to a decline in business investment this year. There has been some offset from a relatively strong global economy, and consumer spending picked up this summer, helped by the warm weather and stronger real earnings growth. But overall UK GDP growth is estimated to remain some way below trend at around 1.3% in 2018, down from 1.7% in In our main scenario, we expect this period of modest, sub-trend growth to continue in 2019, with GDP growth of around 1.6% and real consumer spending growth of around 1.5%. This assumes a relatively smooth Brexit with a transition period lasting at least until the end of It also takes into account the boost to short-term growth from the tax and spending measures announced in the Budget. Most industry sectors are projected to see relatively modest growth in 2019, though short-term trends remain volatile and highly dependent on how the Brexit negotiations evolve. Manufacturing and other export-intensive sectors also face downside risks from any further escalation of international trade tensions in In our main scenario we assume a single one-quarter-point interest rate rise in mid-2019, although the exact timing of this remains uncertain. Given the delicate state of the Brexit negotiations, there are particularly large uncertainties around any such projections at present. Organisations should stress test their business and investment plans against alternative economic and political scenarios and also review the potential wider implications of different Brexit outcomes for all aspects of their operations. UK Economic Outlook November
18
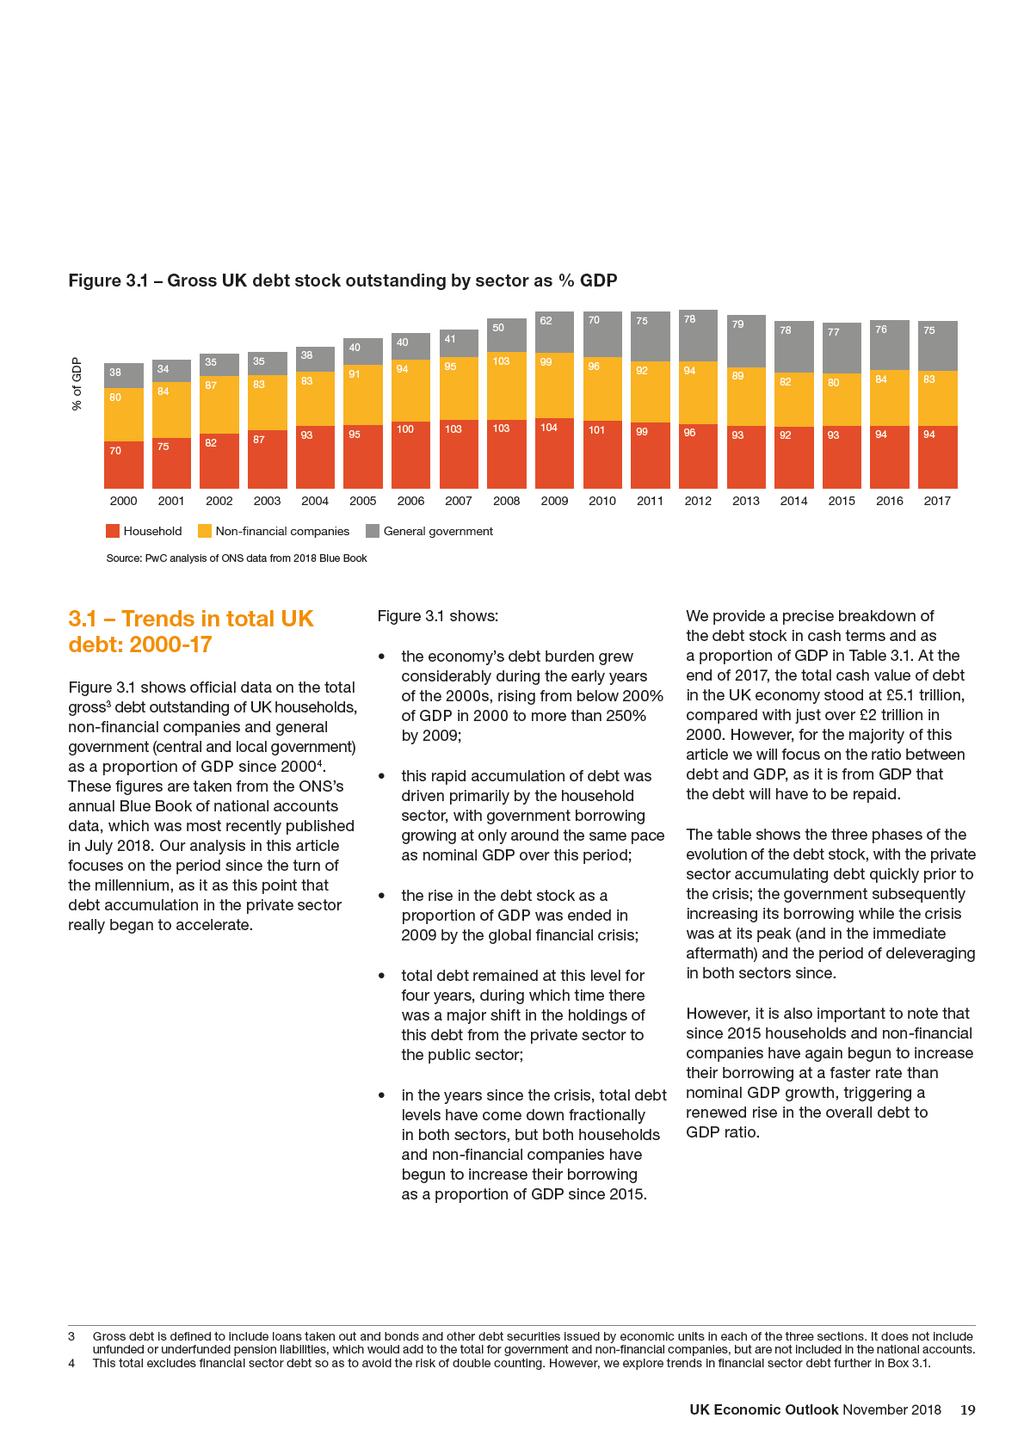
19
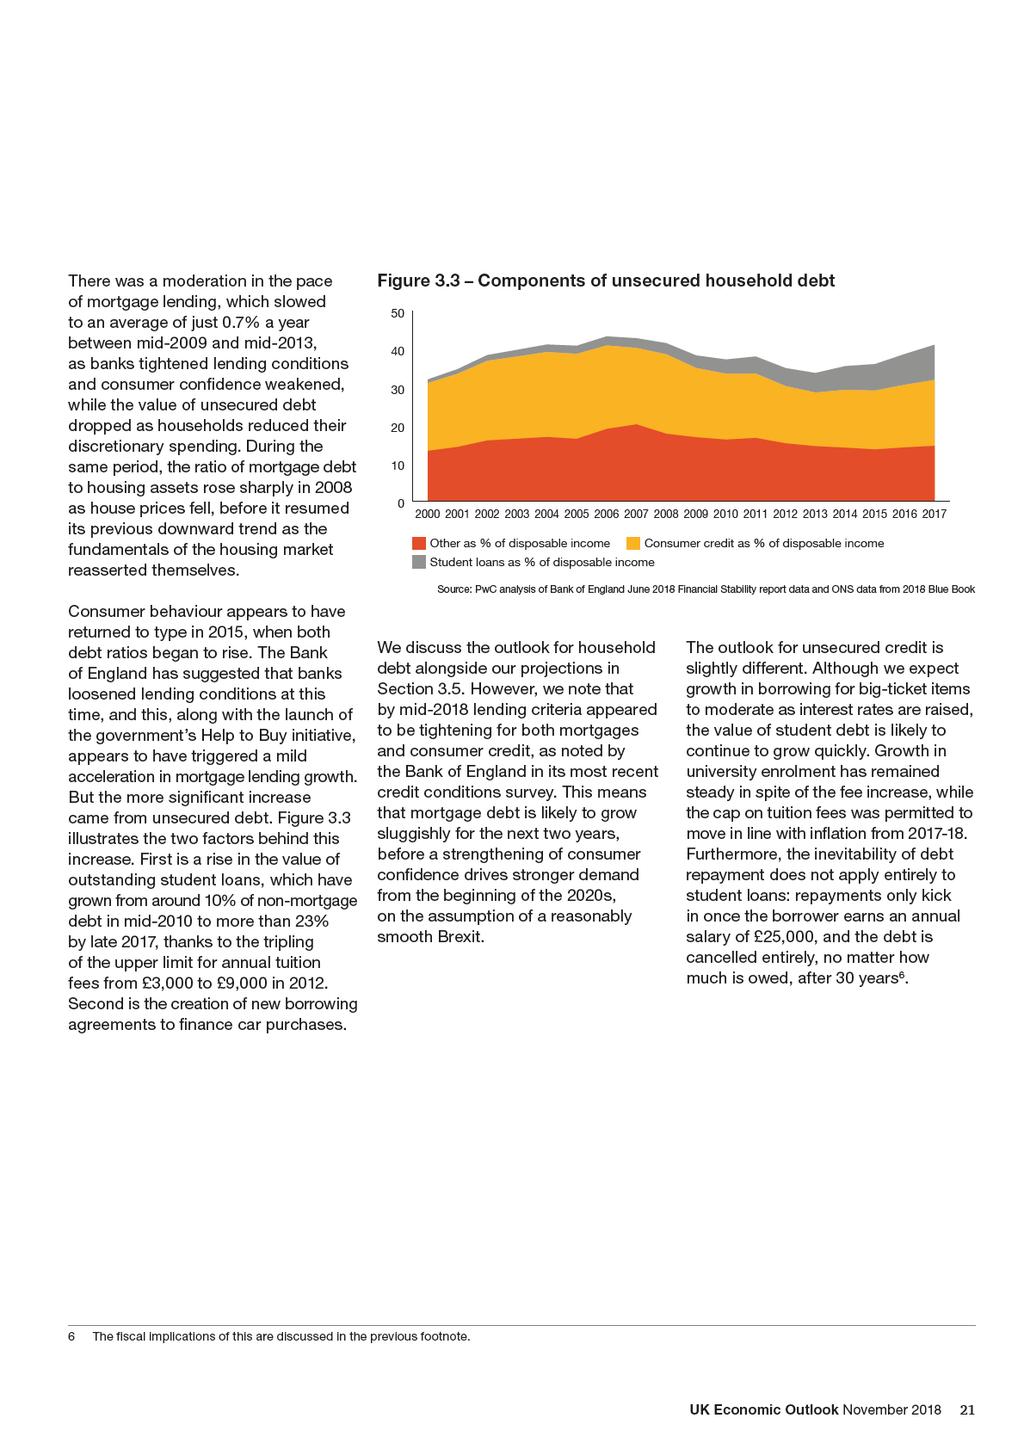
20 We consider this change in behaviour has its origins in both demand and supply factors. On the demand side, several years of improvement in the labour market boosted consumer confidence, while the introduction of higher university tuition fees drove a significant increase in the value of student loans 5. On the supply side, banks became more willing to lend, thanks partly to a nudge from government initiatives such as Help to Buy. Table 3.1: Trends in gross UK debt stock by sector % of GDP (except last column) Value of debt stock ( trillion at end of 2017) Households Non-financial corporations General government Total debt Source: PwC analysis of ONS data from 2018 Blue Book Figure 3.2 Key household debt ratios To explore these issues further, the following sub-sections look in detail at each of the sectors comprising the UK debt stock and consider different metrics where necessary Household debt Although GDP is a useful denominator for debt ratios across the economy, for households it is more meaningful to look at ratios of debt to disposable income (i.e. after taxes and other net transfers). Figure 3.2 shows this ratio for both mortgage debt and total debt. The difference between the two lines represents unsecured credit, or debts such as credit cards and car loans that are not backed by housing collateral. Both mortgage debt and gross household debt rose sharply relative to disposable income in , fuelled by booming house prices, low unemployment and general economic stability. These conditions boosted households appetite to take on debt and lenders willingness to provide it, particularly mortgage debt, which grew at an annual average of 11.3% in this period. As the bottom line in Figure 3.2 shows, the ratio of mortgage debt to housing assets fell a little in the early 2000s, as the supercharged growth in property prices exceeded even the increase in borrowing for mortgages. The global financial crisis caused these trends to go into reverse. Between 2008 and 2015, the ratios of both mortgage debt and total household debt to disposable income fell from their peaks in Gross household debt as % of disposable income Mortgage debt as % of disposable income Mortgage debt a % of housing assets Source: PwC analysis of ONS data from 2018 Blue Book 5 The rise in student loans is likely to have implications for the government and its debt stock. In late 2017 the government sold 3.6 billion of student loans to private investors for 1.8 billion. In a sense, it paid a significant premium to the private sector to transfer the risk of non-repayment. Technicalities in the rules of fiscal accounting mean that illiquid assets owned by the government do not contribute to public sector net debt but liquid assets do, giving the sale of student loans the appearance of reducing government debt. However, the IMF and the OBR have described government asset sales that reduce net debt as a fiscal illusion, as the losses will inevitably need to be paid for by increased government borrowing. Currently, the House of Commons Treasury Committee estimate that the inclusion of the estimated cost to government of borrowing to support the student finance system) in deficit calculations would increase the value of the deficit by 6-7 billion a year, or 15-17% of the current budget deficit. We note that the current treatment of student loans in the national accounts flatters the budget deficit figures but also makes the household debt projections appear worse than they are. We discuss student loans in more detail in Section
21
22
23 3.3 Non-financial company debt Figure 3.5 Gearing ratios of non-financial companies 50 Over the past 30 years, non-financial companies have accumulated a large debt stock, with much of the growth occurring in three short periods. At the end of the 1980s, their debt rose as a proportion of GDP from 39% in 1987 to 58% in 1990, while ten years later the ratio climbed from 62% in 1997 to 84% in Finally, another burst saw it reach 103% in 2008, from 83% in Each of these periods coincided with rapid growth in private equity and the use of debt to fund mergers and acquisitions (M&A). Debt as % of market value of equity + debt Gross gearing ratio Net gearing ratio Source: PwC analysis of ONS data from 2018 Blue Book However, our preferred method of measuring corporate debt levels is to use gearing ratios. These are defined as the ratio of debt to debt plus equity, where equity is expressed at market values. Our analysis includes both gross gearing and net gearing. In the latter case debt levels are adjusted down by the value of currency and bank deposits held. This means that net gearing ratios are lower, but as Figure 3.5 shows, the two measures follow a similar trend over time. Particularly noticeable are the sharp increase in the gearing ratios in the early 2000s. This increase owed more to falling equity prices during the bursting of the dot-com bubble rather than a boom in corporate borrowing. ONS data shows that the value of equity held by non-financial firms fell from almost 2 trillion in 2000 to 1.3 trillion in During the mid-2000s, the ratios held steady. Equity prices bounced back quickly, but these were matched by similar growth in corporate debt. Both ratios jumped up again in 2008, as the onset of the financial crisis triggered both another fall in equity prices and a surge in corporate borrowing, but this higher level was not sustained, as equity prices snapped back in In the years since the crisis, both ratios have fallen steadily and by 2017 were between 10 and 20 percentage points lower than in Again, it has been equity valuations that have driven the change. Borrowing has been largely flat, and in cash terms has yet to match the level reached in Meanwhile, the value of equity has risen steadily, at an annual average rate of 5.2% between 2010 and The net gearing ratio has also fallen considerably faster than the gross ratio. This is because non-financial firms have held onto more and more assets in currency and bank deposits. Research by the Bank of England in 2017 found that one-third of non-financial firms believed that they had under-invested in previous years 11. Respondents gave a range of explanations for their behaviour. Around 50% said that the availability (or lack) of external financing was an obstacle, while a slightly smaller proportion cited the cost of borrowing. There were real economic blockages too: uncertainty was cited by 85% of firms, while risk aversion was mentioned by around 70%, suggesting that the crisis may have had long-lasting effects on behaviour. Finally, the research found that many firms had not lowered their hurdle rates, or the rate of return required for an investment to proceed, despite a fall in the cost of borrowing. That the most common obstacles were related to sentiment rather than the availability of finance suggests that non-financial companies could increase their borrowing in the coming years as memories of the crisis fade. This may also explain why loan growth jumped in , growing by 6% a year, compared with a fall of 0.8% a year in But much now depends on how smoothly Brexit evolves, as well as movements in global financial markets, which can have a large impact on M&A activity and so on corporate borrowing requirements. 11 Bank of England, Are firms underinvesting and if so why?, February 2017, UK Economic Outlook November
24 Figure 3.6 General government debt as % GDP % of GDP Gross debt Net debt Source: PwC analysis of ONS data from 2018 Blue Book 3.4 General government debt For most of the last 40 years, general government debt 12 as a proportion of GDP has followed a countercyclical pattern in a range of between 30% and 50% of GDP. When the economy was growing strongly, such as at the end of the 1980s and the early 2000s, the stock fell relative to GDP, while during the recession of the early 1990s, it grew. However, Figure 3.6 shows that this trend ended abruptly in , when the debt stock shot up out of this range during the global financial crisis. Since then, governments have focused on slowing the growth of the debt stock, and recently it has fallen by several percentage points of GDP. During the crisis the economy endured a deep recession that weakened both sides of the government s finances. With the economy shrinking, its tax receipts declined, while initiatives to support the economy, like a temporary reduction in VAT in 2009 and a cut to stamp duty on property purchases, cost the Exchequer around 25 billion. Consequently, the general government deficit expanded from 41 billion in 2007 (equivalent to 2.6% of GDP) to 154 billion in 2009 (10.1% of GDP), while the debt stock grew in cash terms from 634bn in 2007 to 959 billion two years later. Since 2010, the government has run an austerity programme to repair its finances. The budget deficit has narrowed and the gross debt to GDP ratio has fallen from 79% in 2013 to 75% in These efforts have not resulted in a decline in the absolute value of public debt: the stock rose from just under 1.4 trillion to just over 1.5 trillion over these years. The government is aiming for the structural budget deficit to be brought down to less than 2% of GDP by 2020/21 and for the net debt to GDP ratio to be in decline by the same year. In fact, it is already achieving both targets in the current year, although its longer term goal of eliminating the deficit by the mid-2020s is much more challenging, given upward pressures on spending on the NHS and social care and the raising of the income tax threshold announced in the 2018 budget. In assessing whether this level of indebtedness is problematic, in the short term the answer depends more on debt interest payments, while in the long term it is more to do with the size of the stock relative to GDP. The value of debt interest payments is set by a combination of the maturity of the gilts that the government issues and the interest rate it sells them at. In this respect, the government s payments are considerable but manageable, largely because the big issuance of new debt in response to the financial crisis was made at a time when interest rates were very low. For example, public debt interest payments have risen sharply in cash terms since the financial crisis, from around 32 billion in 2007/08 to 42 billion in 2017/18. But as a proportion of GDP, payments were static, at 2%, thanks to economic growth over this period. Indeed, on this measure, debt interest repayments were greater two decades earlier, when they stood at 3.1%, even though the cash value was much lower, at 29 billion. 12 Note that we focus here on gross general government debt, whereas the government s fiscal targets focus on net public sector debt. The latter is higher because it includes the debt of public corporations, but lower because it is net of liquid financial assets of the public sector. At least since the turn of century, however, these two measures have followed broadly similar trends over time (in earlier decades they were more distinct due to a large public corporations sector prior to the privatisations of the 1980s and 1990s). 24
25 As for the stock itself, a famous study by Reinhart and Rogoff (2009) suggested that a public debt burden greater than 90% of GDP was associated with financial crises that were likely to disrupt economic growth. Later, however, the robustness of this 90% figure was questioned. Collard, Habib and Rochet (2015), for example, developed a measure of the maximum sustainable public debt, or the highest level at which investors would be willing to roll over maturing debt were an economy to stumble. For the UK, this was estimated at 126% of GDP 13. The current gross debt-to-gdp ratio of 75% well below these levels, suggesting that the debt burden is unlikely of itself to be a threat to the future health of the economy. That said, if the government is going to maintain a debt-to-gdp ratio that is significantly higher that it was prior to the global financial crisis, it may constrain its ability to respond to future recessions with similarly elevated spending. In the long term, there are also structural factors that will put upward pressure on the debt stock. The ageing of the population means that state spending on pensions and health and social care will rise, necessitating either greater borrowing or offsetting tax increases. There is also the more immediate challenge of managing the economy s performance during Brexit. To this end, the Chancellor, Philip Hammond, maintained the same contingency of around 15 billion in his 2018 budget which could be deployed to stimulate the economy in the event of a Brexit-related downturn. 13 Bank of England, It pays to be paranoid: the importance of fiscal space, November 2017, UK Economic Outlook November
26 Box 3.1 Financial sector debt In this box we briefly explore how the stock of financial sector debt has changed in the years since the financial crisis. It is much more difficult to interpret debt levels for financial services than for other sectors of the economy, as debt is used in a different manner in many transactions between financial companies. For simplicity, we will solely be looking at the liabilities on bank balance sheets: loans taken out and the bonds issued by financial corporations themselves, excluding any deposits held by these institutions. As a proportion of GDP, UK financial corporations gross debt has been in slow decline since 2009, falling from a peak of 239%, although this trend appears to have begun to reverse in However, it is more informative to examine gross debt through gearing ratios. Figure shows the ratio of gross debt to debt plus equity falling quickly since the onset of the crisis, suggesting a strengthening of balance sheets. It is important to note that the value of equity held by UK financial institutions has more than doubled from its 2008 low and that this increase has been instrumental in pulling down the gearing ratio. It also means that another collapse in equity prices, such as the one in 2008, would see balance sheets weaken quickly. Figure Financial sector debt ratios % Gross debt as a % of debt + equity (LH axis) Source: PwC analysis of ONS data from 2018 Blue Book Another way of assessing financial sector debt is by viewing it in relation to the income of financial institutions. As illustrated in Figure 3.1.1, the gross debt to income ratio of such firms increased sharply with the fall in incomes that occurred as the global financial crisis took hold. Importantly, this ratio has remained at this much higher level, as incomes were no greater in 2017 than they were in Ratio of gross debt to resources (RH axis) The main source of financial-sector revenue has historically been interest income, and a fall in mortgage and consumer lending, combined with years of record-low interest rates, led to interest income dropping dramatically, from 457 billion in 2008 to 139 billion in It is important to notice that interest expenditure also fell over this period, meaning that the impact on net interest income has been much less pronounced, and it is this measure that would be most important for the sector in the event of another economic downturn
27 Table 3.1.1: Breakdown of financial sector debts and financial derivatives by type of institution Banks and building societies Other financial intermediaries and auxiliaries Insurance companies and pension funds Total financial sector debt billion Bonds and other debt securities Loans Total debt Derivative assets Derivative liabilities Net derivatives Source: PwC analysis of ONS data Table presents a breakdown of financial sector debts by types of institution. We can observe several structural changes to the sector in the ten years following the financial crisis: the total debt of banks and building societies has fallen slightly since 2009, while other financial intermediaries and auxiliaries (such as hedge funds and fund managers) have increased their debt load, particularly through bonds and other debt securities; the debts of insurance companies and pension funds have almost doubled since 2009, but remain fairly immaterial relative to their other non-debt liabilities, such as pensions; the value of derivative assets and liabilities has declined by around 1.2 trillion from 2009, but remains high relative to other liabilities of financial institutions (though these tend to cancel out in net terms); and exposure has transferred from traditional banks to the shadow banking sector in the face of a stricter regulatory environment following the financial crisis 14. To summarise, at 179% in 2017, UK financial sector debt remains significantly higher as a proportion of national income than it did in the early 2000s. However, the same measure has fallen considerably since the financial crisis and the rise since 2015 has been mild. Furthermore, the Bank of England is currently satisfied by banks capital ratios. 14 Derivatives played a significant role in the evolution of global financial crisis from its roots in the US the sub-prime mortgage segment. However, they are very much a game between financial institutions and do not typically interact with the real economy. Although there is no guarantee that they will not play a part in any future financial crisis, it is beyond the scope of this article to consider any potential spill-over effects arising from holdings of derivatives. UK Economic Outlook November
28 3.5 Medium-term outlook for UK debt levels and debt interest payments Projecting the future path of the debt stock is complicated by high levels of uncertainty surrounding the UK economy, not least relating to Brexit. However, in this section we set out what we consider to be a plausible main scenario for the next five years and then offer a broader range of outcomes under high and low growth scenarios. We then look at what this may mean for debt interest payments as interest rates rise over the next five years. Our main scenario is based on the following assumptions: nominal GDP grows by an average of 4% a year in , a slightly higher rate than in owing to our expectations of inflation remaining above or very close to the Bank of England s 2% target in and economic growth accelerating from current levels to closer to 2% on average in ; growth in borrowing by non-financial companies accelerates gradually in as economic uncertainty diminishes and growth is faster and more consistent in ; gearing ratios rise as growth in equity prices slows amid tightening monetary policy, while the gross debt-to-gdp ratio rises steadily; Table 3.2: Main scenario projections for UK debt stock (and plausible ranges) Sectors Debt in cash terms ( trillion) growth in household debt slows relative to nominal GDP in reflecting further sluggish growth in mortgage demand and tighter lending criteria for unsecured borrowing; this trend reverses from 2020 as concerns about the economic outlook diminish after a relatively smooth Brexit and the stock of student loans continues to expand rapidly, triggering a renewed rise in the gross debt-to-gdp ratio; and general government borrowing progresses broadly in line with the expectations of the OBR, with higher tax receipts further reducing the debt-to-gdp ratio to less than 70% by Applying these assumptions gives us a central projection for the UK debt stock by 2023 in cash terms and as a proportion of GDP, as shown in Table 3.2. Debt as % of GDP Households General government Non-financial companies Total Plausible range Source: ONS data and PwC scenarios 28

29
30 The effect of higher interest rates on future debt repayments In addition to considering potential movements of the debt stock, we have also analysed potential paths for debt interest payments. These projections are illustrative and are intended to give an indication of the broad direction of repayments rather than being precise forecasts. In our main scenario, shown in Table 3.3, we use the same assumptions as in our debt stock projections, with the addition of the Bank of England raising its base rate to 2% by 2023, in line with the Bank s estimate for the long-run neutral interest rate. An additional 125 basis points on the rate over the next five years would increase debt servicing costs for all three sectors of the economy, so that total debt repayments could rise in cash terms from a little above 150 billion in 2017 to around 250 billion by As a proportion of GDP, this represents an increase from 7.7% to 9.6% as shown in Table 3.3. We carried out the same analysis for our high and low growth scenarios, also using the higher and lower denominators for GDP. We assumed that the base rate rose to 3% by 2023 in the high growth scenario, but also that lenders were unable to pass on all of the increase to borrowers. In the low growth scenario, the base rate reaches only 1% by 2023, but this small addition to rates is transmitted to consumers and businesses in full. These scenarios gave us an estimated range for debt repayments for the total economy of between 7.5% and 11.2% of GDP in Table 3.3: Illustrative projections for UK debt repayments Sectors Debt repayments in cash terms ( billion) (main scenario) 2023 (low growth scenario) 2023 (high growth scenario) Households General government Non-financial companies Total Total as % of GDP Source: ONS data and PwC scenarios These projections need to be accompanied with a couple of caveats. Those households with savings would benefit from higher interest rates, as would companies with interest-bearing bank deposits. This would make larger debt repayments easier to bear. There would be no effect on student loans, as interest rates on this borrowing are linked to movements in the retail price index, not the Bank rate, so these have been stripped out of our debt repayment calculations. Finally, mortgage holders may not be affected immediately, given that more than 60% of mortgages are now on fixed rates, but terms for new mortgages and remortgages would gradually rise along with the base rate. In sum, repaying the higher debt stock following the financial crisis is likely to become more expensive in the coming years, and this could exert a dampening effect on discretionary spending for both households and businesses. The cost of debt servicing is likely to be an important factor in the decision-making of the Bank of England, which must balance the sensitivity of households and businesses to tighter monetary policy against the need for higher rates to meet inflation targets (and also allow scope for future rate cuts to support the economy during any future economic downturn). 30
31 3.6 Summary and conclusions Our analysis has revealed that the total UK debt stock grew steadily from below 200% of GDP at the turn of the millennium in 2000 to around 270% in the aftermath of the global financial crisis. This expansion was driven by households and non-financial companies, who took advantage of a growing economy, rising equity prices and accommodative monetary policy to borrow more money, and by banks, who were keen to expand their lending levels. Government debt during this period was fairly stable at historically relatively low levels of around 40% of GDP or less up to The financial crisis put an end to these trends. Households and non-financial companies began to reduce their debt quickly, and economy-wide deleveraging would have been greater still were it not for a surge in borrowing by the government. The public sector then began its own deleveraging programme, which is still ongoing. We note a change in behaviour among households and non-financial companies since 2015, when they began to accumulate debt at a faster rate than nominal GDP growth. It is a little soon to say with confidence that the most recent movements in private sector debt represent the start of a longer term trend. The unusual amount of uncertainty facing the UK economy in as a result of Brexit, a stumbling housing market in London and the likelihood of further interest rate increases means that these years are likely to see a pause in debt accumulation relative to GDP. But, after that, on the assumption of a smooth Brexit transition being agreed with the EU and a subsequent gradual recovery in UK business and consumer confidence, the private sector is likely to resume faster rates of borrowing that cause the debt stock to rise further relative to GDP. The outlook for general government debt is subject to fewer uncertainties: the government has been reducing its debt stock as a proportion of GDP steadily for five years and this is likely to continue, even taking account of the easing of austerity announced in the October 2018 Budget. That said, we note the long-term structural challenges posed by the ageing of the population through a smaller tax base and higher demand for health and social care for the elderly, as well as increased state pension spending. Both the projected increase in the debt stock and the rise in debt repayments are relatively modest, but they will come on top of already high levels of debt, so that, by 2023, total debt could again be approaching the peak of around 260% of GDP seen during financial crisis. That interest rates are expected to rise only very gradually in this period, and only to around the level of the Bank of England s long-run neutral rate, may mean that the effect of higher debt repayments on household budgets is manageable and the squeeze on discretionary spending is limited. However, we also note the distributional differences in debt between households and the greater vulnerability of those more reliant on credit. This means that, for some, the UK economy s appetite for debt remains a risk. UK Economic Outlook November
32
33
34
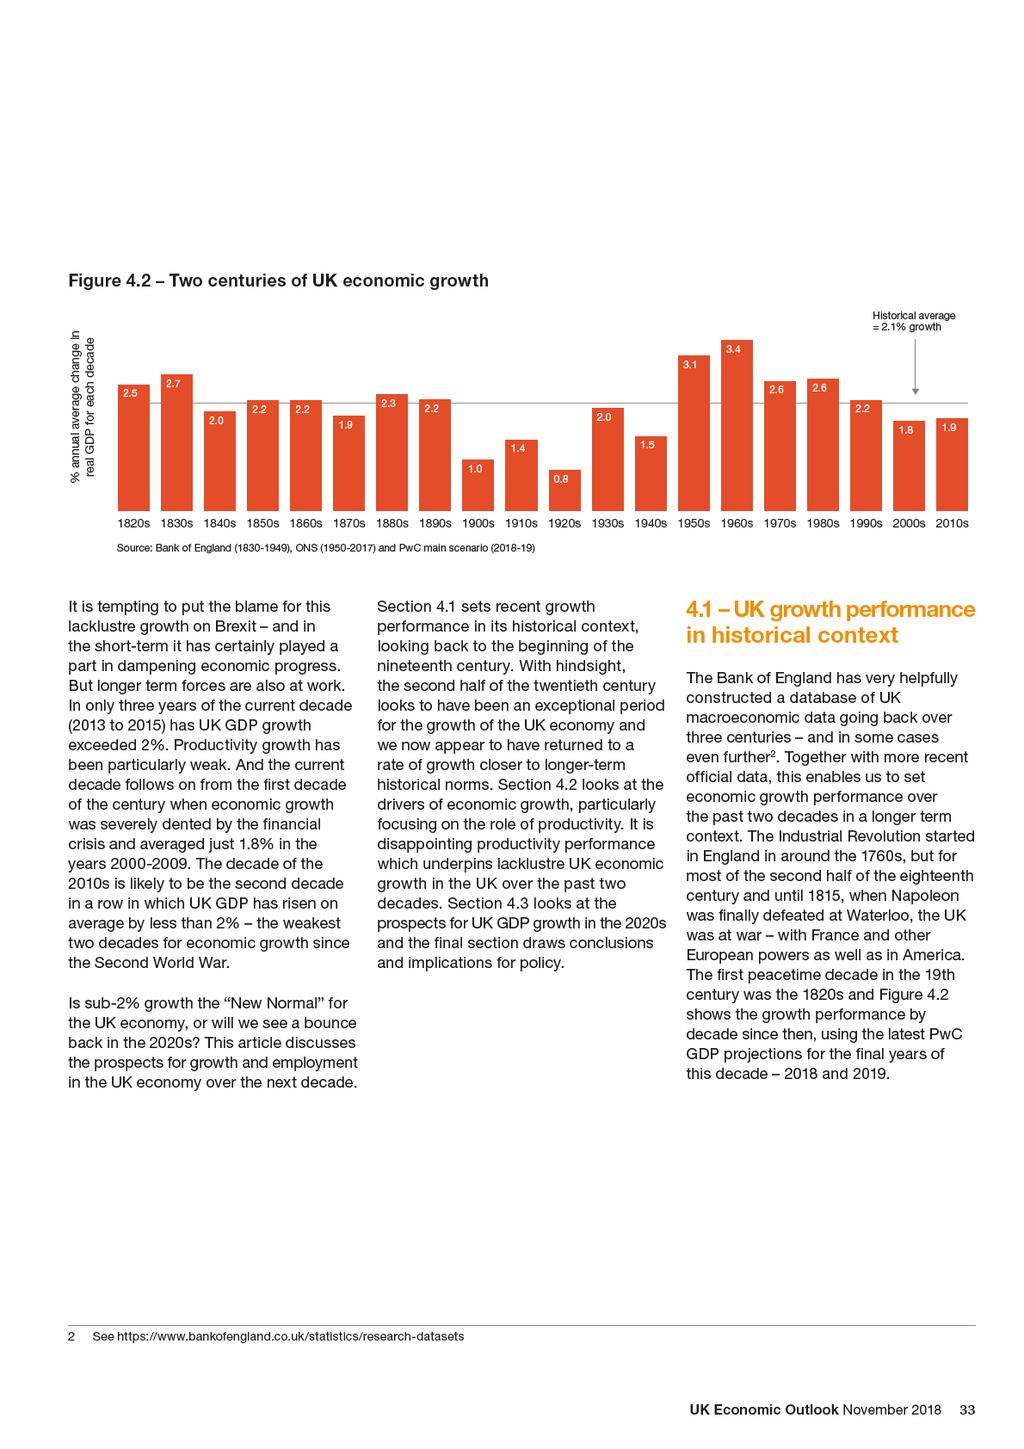
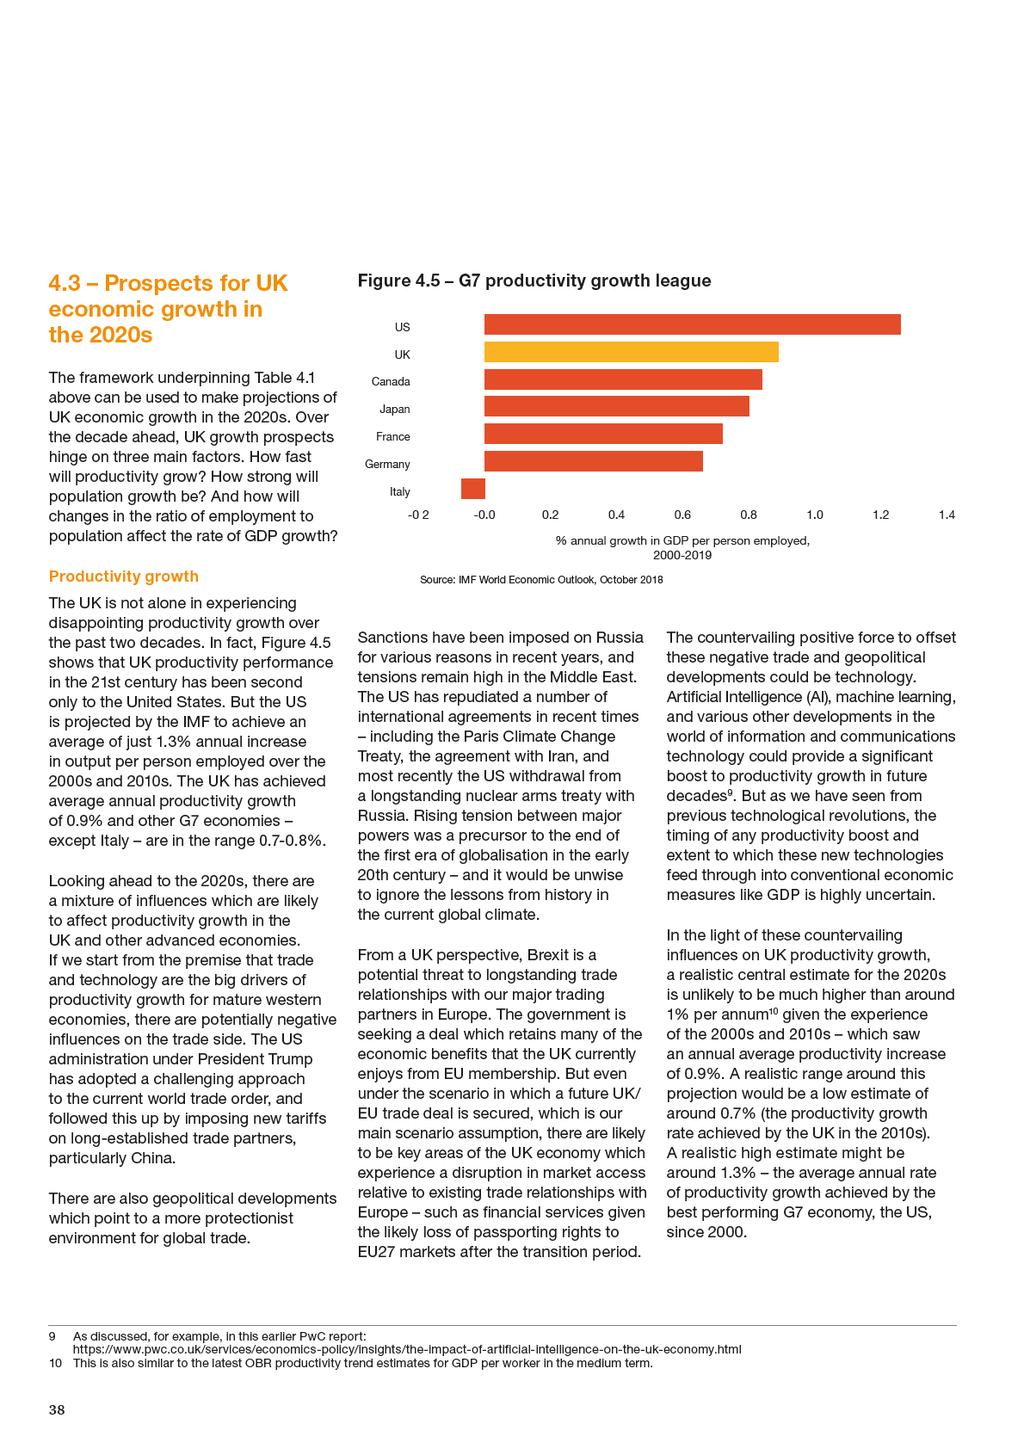
35 4.2 Drivers of long-term economic growth Over the longer-term, there are three key drivers of economic growth. The first is the growth of population particularly the number of people who are in the normal working age range conventionally defined as but more realistically in an economy like the UK. The second key driver is the flexibility and efficiency of the labour market, which determines how easy it is for people to find jobs and for employers to find the workers that they need, at all skill levels. The third and arguably the most important - factor is the productivity of the workforce. Rising productivity allows GDP to increase faster than employment, with technology, education and skills and capital investment playing important roles in the process of productivity growth. Table 4.1 analyses the key phases of UK economic growth since the mid-19th century 4. It is very clear how variations in economic growth have reflected swings in the rate of productivity increase. In the case of the UK, changes in population growth and other influences on employment have played a much smaller part in shaping variations in long-term economic growth trends. In Table 4.1, these population and employment influences are separated into two components the growth of total population (of all ages) and the impact on growth of changes in the ratio of employment to population. This last component captures both demographic influences and factors related to the efficiency of labour markets. Table 4.1: Analysis of UK GDP growth since 1855 (% pa contribution to growth) GDP Output per worker Population Employment ratio* Source: PwC analysis of data from Bank of England and ONS and PwC projections for *Contribution to GDP growth from a change in the ratio of employment to population In the words of Nobel Prize-winning economist Paul Krugman: Productivity isn t everything, but, in the long run, it is almost everything. A country s ability to improve its standard of living over time depends almost entirely on its ability to raise its output per worker 5. But what drives productivity? In developing and emerging market economies, very high productivity growth rates can be achieved by catching up with other more advanced economies. That has been the experience of many Asian economies most notably China in recent decades. They have implemented more growth-friendly economic policies, taken advantage of an expanding world trading system, and invested heavily in modern infrastructure and industrial plants. That has enabled a number of major Asian economies to raise productivity in key sectors of their economies much closer to the levels achieved in the West. This catch-up story is, however, not really relevant to the UK, which has been one of the richer and most advanced economies in the world since the 19th century. For the UK and other major western economies, four key factors appear to shape the rate of progress in productivity. The first is having a well-functioning market economy, in which resources can flow towards the sectors and businesses which can generate the largest economic returns. A market economy is not perfect, and a well-developed structure of regulation is needed to ensure markets work well. 4 Reliable employment estimates are only available from the Bank of England database since Krugman (1990) The Age of Diminished Expectations, MIT Press. UK Economic Outlook November
36 But if the state becomes too interventionist in business and economic affairs, that can stifle enterprise and innovation. So a well-functioning market economy needs to strike the balance between having a framework of rules and regulations which allows the market to work without holding back wealth creation. A second key driver of productivity is technology. As noted above, the UK economy is delivering more than fifteen times as much output per head of population as it was 200 years ago. The major enabler of this economic progress has been technological advances particularly in key sectors like manufacturing, transport and communications. However, the relationship between technology and economic growth is not deterministic. It takes years and decades sometimes for key technological innovations to be absorbed into the economic system and to generate substantial improvements in living standards. In 1987, Robert Solow, another Nobel prize-winning economist, coined the computer paradox. He wryly quipped: You can see the computer age everywhere but in the productivity statistics. One reason that it has become more difficult to identify technological progress in GDP and other measures of the economy is that official statisticians are struggling to keep up with changes in the structure of the economy. We live in an economy dominated by the services sector, and measuring the output of services is a more difficult and complex exercise than counting the number of widgets coming out of a factory. This also applies to accounting for improvements in service quality due to innovation, as well as entirely new products and services, although this has also been an issue in past technological revolutions so we should not overstate its significance in explaining the recent slowdown in productivity growth. Alongside technology, investment not just in physical capital, but also in skills and various other forms of intangible investment is crucial to the process of productivity growth. We have already noted how China and other Asian economies have demonstrated how quickly they can raise productivity levels with a large injection of investment. It is sometimes argued that the UK productivity growth rate would have been stronger if our investment rate had been higher. A recent analysis by the Office for National Statistics showed that the UK s average fixed capital investment share of GDP was 16.7% from between 1997 and 2017, compared to around 20% or more in other OECD countries 6. A fourth factor which is crucial for productivity growth is access to global markets. In his ground-breaking book The Wealth of Nations 7, Adam Smith observed that the division of labour is limited by the size of the market. He was referring to what economists have subsequently characterised as economies of scale, though there are also economies of scope (i.e. applying a similar approach across a range of different businesses and markets) and network economies which are very relevant in transport, communications and energy markets, as well as modern digital platforms covering an ever broader range of activities. In an expanding world economy, with increasing opportunities for world trade and investment, these economies of scale, scope and expanded networks create the potential for productivity growth. The establishment of the World Trade Organisation (WTO) in 1995, and other regional trade agreements which were forged around the same time such as NAFTA and the European Single Market gave this process added momentum during the 1990s. 6 published in November Adam Smith s The Wealth of Nations was first published in 1776 and set out many of the principles which have underpinned the development of economic thinking on markets and the benefits of trade 36
37 Figure 4.4 Process of globalisation has now faltered Index of world trade volumes relative to world GDP, 1985 = World trade/gdp ratio ave Source: IMF World Economic Outlook, October Trade and technology appear to tell the story of the big swings in UK productivity growth seen since the 19th century. In the 1800s, the UK benefited from many technological changes stemming from the Industrial Revolution including major innovations in transport technologies, such as the development of railways and steamships. At the same time, the world trading system opened up from the mid-19th century, led by the UK reducing various tariff and non-tariff barriers to trade from the 1820s onwards 8. Economic historians describe the second half of the 19th century as the first era of globalisation because of the growth of world trade and investment which followed in the wake of trade l beralisation and developments in transport and communications technologies. The first half of the 20th century saw a major reversal in this pattern of globalisation, with rivalry between the major western powers increasing, leading to the First World War. This was followed by two decades of economic volatility, recessions and rising protectionism in the 1920s and 1930s. Only after the Second War did the world economy start to open up again with a new wave of international trade and investment. At the same time, major technological innovations from motor cars, jet aircraft, washing machines and fridges to TVs and transistor radios found mass markets in the major western economies. This led to a surge in productivity growth not just in the UK but across Western Europe and in North America. This was followed in the 1980s and 1990s by the development of new information and communications technologies which led to the internet and mobile phones. These technologies have not gone away, but they tend to provide a one-off benefit to productivity growth which fades over time. In other words, the productivity level is boosted for a while but it does not rise indefinitely into the future. At the same time, the productivity growth boost which followed the opening up of markets since the 1980s and 1990s has also started to falter. A good indication of this is the fact trade intensity in the global economy as measured, for example, by the ratio of the volume of world trade to world GDP in real terms hit a plateau not long after the start of the 21st century, as Figure 4.4 shows. 8 The first major trade liberalising measure passed by Parliament was The Reciprocity of Duties Act in UK Economic Outlook November
38
Value of debt stock ( trillion at end of 2017)
") We consider this change in behaviour has its origins in both demand and supply factors. On the demand side, several years of improvement in the labour market boosted consumer confidence, while the introduction
We consider this change in behaviour has its origins in both demand and supply factors. On the demand side, several years of improvement in the labour market boosted consumer confidence, while the introduction
Highlights and key messages for business and public policy
 Highlights and key messages for business and public policy Key projections 2019 2020 Real GDP growth 1.1% 1.6% Consumer spending growth 1.4% 1.7% Fixed investment growth -1.0% 2.1% Inflation (CPI) 1.8%
Highlights and key messages for business and public policy
 Highlights and key messages for business and public policy Key projections 2018 2019 Real GDP growth 1.5% 1.6% Consumer spending growth 1.1% 1.3% Inflation (CPI) 2.7% 2.3% Source: PwC main scenario projections
Figure 2.3 Purchasing Managers Indices of business activity. Figure 2.4 US dollar and euro exchange rates against the pound.
 Prior to 20, consumer spending was a key driver of GDP growth, but this was achieved in part by running up ever higher debts. We explore this further in our latest Precious Plastic report 2, which highlighted
Highlights and key messages for business and public policy
 Highlights and key messages for business and public policy Key projections 2018 2019 Real GDP growth 1.3% 1.6% Consumer spending growth 1.1% 1.3% Inflation (CPI) 2.5% 2.3% House prices 2.9% 2.8% Source:
3. The outlook for consumer spending and online retail 1
 3. The outlook for consumer spending and online retail 1 Key points Consumer spending growth is estimated to have slowed for a second consecutive year in 2018, but is still expected to have grown at an
Highlights and key messages for business and public policy
 Highlights and key messages for business and public policy Key projections 2017 2018 Real GDP growth 1.5% 1.4% Consumer spending growth 1.6% 1.1% Inflation (CPI) 2.7% 2.7% Source: PwC main scenario projections
Finland falling further behind euro area growth
 BANK OF FINLAND FORECAST Finland falling further behind euro area growth 30 JUN 2015 2:00 PM BANK OF FINLAND BULLETIN 3/2015 ECONOMIC OUTLOOK Economic growth in Finland has been slow for a prolonged period,
Highlights and key messages for business and public policy
 Highlights and key messages for business and public policy Key projections 2018 2019 Real GDP growth 1.5% 1.6% Consumer spending growth 1.1% 1.3% Inflation (CPI) 2.7% 2.3% Source: PwC main scenario projections
MINUTES OF THE MONETARY POLICY COMMITTEE MEETING 4 AND 5 NOVEMBER 2009
 Publication date: 18 November 2009 MINUTES OF THE MONETARY POLICY COMMITTEE MEETING 4 AND 5 NOVEMBER 2009 These are the minutes of the Monetary Policy Committee meeting held on 4 and 5 November 2009. They
Table 1: Arithmetic contributions to June 2016 CPl inflation relative to the pre-crisis average
 BANK OF ENGLAND Mark Carney Governor The Rt Hon Philip Hammond Chancellor of the Exchequer HM Treasury 1 Horse Guards Road London SW1A2HQ 4 August 2016 On 19 July, the Office for National Statistics published
Structural Changes in the Maltese Economy
 Structural Changes in the Maltese Economy Dr. Aaron George Grech Modelling and Research Department, Central Bank of Malta, Castille Place, Valletta, Malta Email: grechga@centralbankmalta.org Doi:10.5901/mjss.2015.v6n5p423
Structural changes in the Maltese economy
 Structural changes in the Maltese economy Article published in the Annual Report 2014, pp. 72-76 BOX 4: STRUCTURAL CHANGES IN THE MALTESE ECONOMY 1 Since the global recession that took hold around the
BCC UK Economic Forecast Q4 2015
 BCC UK Economic Forecast Q4 2015 David Kern, Chief Economist at the BCC The main purpose of the BCC Economic Forecast is to articulate a BCC view on economic topics that are relevant to our members, and
BANK OF FINLAND ARTICLES ON THE ECONOMY
 BANK OF FINLAND ARTICLES ON THE ECONOMY Table of Contents Global economy to grow steadily 3 FORECAST FOR THE GLOBAL ECONOMY Global economy to grow steadily TODAY 1:00 PM BANK OF FINLAND BULLETIN 1/2017
Outlook for Economic Activity and Prices
 Not to be released until : p.m. Japan Standard Time on Saturday, October 31, 15. October 31, 15 Bank of Japan Outlook for Economic Activity and Prices October 15 (English translation prepared by the Bank's
November UK Economic Outlook. How robust is the UK consumer recovery? Getting the balance right in the UK regions.
 November 2014 UK Economic Outlook How robust is the UK consumer recovery? Getting the balance right in the UK regions www.pwc.co.uk/economics Contents Highlights and key messages 3 1. Summary 4 2. UK economic
The reasons why inflation has moved away from the target and the outlook for inflation.
 BANK OF ENGLAND Mark Carney Governor The Rt Hon George Osborne Chancellor of the Exchequer HM Treasury 1 Horse Guards Road London SW1A2HQ 12 May 2016 On 12 April, the Office for National Statistics (ONS)
MINUTES OF THE MONETARY POLICY COMMITTEE MEETING 7 AND 8 OCTOBER 2009
 Publication date: 21 October 2009 MINUTES OF THE MONETARY POLICY COMMITTEE MEETING 7 AND 8 OCTOBER 2009 These are the minutes of the Monetary Policy Committee meeting held on 7 and 8 October 2009. They
The UK economic and fiscal outlook
 The UK economic and fiscal outlook Report for StepChange Debt Charity Centre for Economics and Business Research ltd Contents Executive summary 3 Global economic outlook 4 UK economic outlook 8 UK regional
INFLATION REPORT PRESS CONFERENCE. Thursday 10 th May Opening Remarks by the Governor
 INFLATION REPORT PRESS CONFERENCE Thursday 10 th May 2018 Opening Remarks by the Governor Three months ago, the MPC said that an ongoing tightening of monetary policy over the next few years would be appropriate
Economic ProjEctions for
 Economic Projections for 2016-2018 ECONOMIC PROJECTIONS FOR 2016-2018 Outlook for the Maltese economy 1 Economic growth is expected to ease Following three years of strong expansion, the Bank s latest
LESS DYNAMIC GROWTH AMID HIGH UNCERTAINTY
 OVERVIEW: The European economy has moved into lower gear amid still robust domestic fundamentals. GDP growth is set to continue at a slower pace. LESS DYNAMIC GROWTH AMID HIGH UNCERTAINTY Interrelated
3 The outlook for consumer spending and the impact of automation 1
 3 The outlook for consumer spending and the impact of automation 1 Key points Consumer spending slowed during 2017, but has nonetheless grown by an average of 2.3 percentage points per annum faster than
Svein Gjedrem: Interest rates, the exchange rate and the outlook for the Norwegian economy
 Svein Gjedrem: Interest rates, the exchange rate and the outlook for the Norwegian economy Speech by Mr Svein Gjedrem, Governor of Norges Bank (Central Bank of Norway), to the Mid-Norway Chamber of Commerce
Monthly Economic Review
 Monthly Economic Review DECEMBER 2017 Based on November 2017 data releases Bedfordshire Chamber of Commerce Headlines UK GDP growth in Q3 unrevised as business investment and the UK s trade position weakens
Growth to accelerate. A quarterly analysis of trends in the Irish economy
 Produced by the Economic Research Unit July 2014 A quarterly analysis of trends in the Irish economy Growth to accelerate Strong start to 2014 Recovery becoming more broad-based GDP growth revised up for
Svein Gjedrem: The outlook for the Norwegian economy
 Svein Gjedrem: The outlook for the Norwegian economy Address by Mr Svein Gjedrem, Governor of Norges Bank (Central Bank of Norway), at the Bergen Chamber of Commerce and Industry, Bergen, 11 April 2007.
Monetary Policy Summary and minutes of the Monetary Policy Committee meeting ending on 13 December 2017
 Monetary Policy Summary and minutes of the Monetary Policy Committee meeting ending on 13 December 2017 Publication date: 14 December 2017 These are the minutes of the Monetary Policy Committee meeting
November minutes: key signaling language
 Trend Macrolytics, LLC Donald Luskin, Chief Investment Officer Thomas Demas, Managing Director Michael Warren, Energy Strategist Data Insights: FOMC Minutes Thursday, November 29, 2018 November minutes:
Grant Spencer: Trends in the New Zealand housing market
 Grant Spencer: Trends in the New Zealand housing market Speech by Mr Grant Spencer, Deputy Governor and Head of Financial Stability of the Reserve Bank of New Zealand, to the Property Council of New Zealand,
Canada s Economy and Household Debt: How Big Is the Problem?
 Remarks by Stephen S. Poloz Governor of the Bank of Canada Yellowknife Chamber of Commerce Yellowknife, Northwest Territories May 1, 2018 Canada s Economy and Household Debt: How Big Is the Problem? Introduction
1 Executive summary. Overview
 1 Executive summary Overview 1.1 Relatively little time has passed since our November forecast and the outlook for the economy and public finances looks broadly the same. The economy has slightly more
Minutes of the Monetary Policy Council decision-making meeting held on 6 July 2016
 Minutes of the Monetary Policy Council decision-making meeting held on 6 July 2016 At the meeting, members of the Monetary Policy Council discussed monetary policy against the background of macroeconomic
Consumer Debt and Money Report Q making business sense
 Consumer Debt and Money Report Q3 2012 3 making business sense Executive summary & commentary The StepChange Debt Charity Consumer Debt and Money Report Q3 2012 expands on previous reports to build a nuanced
Monetary Policy Summary and minutes of the Monetary Policy Committee meeting ending on 10 May 2017
 Monetary Policy Summary and minutes of the Monetary Policy Committee meeting ending on 10 May 2017 Publication date: 11 May 2017 These are the minutes of the Monetary Policy Committee meeting ending on
Ireland. Eurozone rebalancing. EY Eurozone Forecast June Portugal Slovakia Slovenia Spain. Latvia Lithuania Luxembourg Malta Netherlands
 EY Forecast June 2015 rebalancing recovery Outlook for Rising domestic demand improves prospects for 2015 Published in collaboration with Highlights The Irish economy grew by 4.8% last year, which was
Outlook for Economic Activity and Prices (April 2010)
") April 30, 2010 Bank of Japan Outlook for Economic Activity and Prices (April 2010) The Bank's View 1 The global economy has emerged from the sharp deterioration triggered by the financial crisis and has
April 30, 2010 Bank of Japan Outlook for Economic Activity and Prices (April 2010) The Bank's View 1 The global economy has emerged from the sharp deterioration triggered by the financial crisis and has
FSB VOICE OF SMALL BUSINESS fsb.org.uk
 Q1 FSB VOICE OF SMALL BUSINESS INDEX QUARTER 1, 2017 @fsb_policy fsb.org.uk Q1 2017 FSB Small Business Index 2 SBI Q1 2017 fsb.org.uk Small business confidence at highest in over a year, but firms are
THE NEW ECONOMY RECESSION: ECONOMIC SCORECARD 2001
 THE NEW ECONOMY RECESSION: ECONOMIC SCORECARD 2001 By Dean Baker December 20, 2001 Now that it is officially acknowledged that a recession has begun, most economists are predicting that it will soon be
Ric Battellino: Recent financial developments
 Ric Battellino: Recent financial developments Address by Mr Ric Battellino, Deputy Governor of the Reserve Bank of Australia, at the Annual Stockbrokers Conference, Sydney, 26 May 2011. * * * Introduction
Quarterly Economic Monitor
 Overview of Quarterly Economic Monitor December 214 Queenstown s economy boomed during 214, with ' provisional estimate of GDP showing that the Queenstown-Lakes District economy grew by 4.5% over the year
ECONOMY REPORT - CHINESE TAIPEI
 ECONOMY REPORT - CHINESE TAIPEI (Extracted from 2001 Economic Outlook) REAL GROSS DOMESTIC PRODUCT The Chinese Taipei economy grew strongly during the first three quarters of 2000, thanks largely to robust
Northern Ireland Quarterly Sectoral Forecasts
 2017 Quarter 1 Northern Ireland Quarterly Sectoral Forecasts Forecast summary The Northern Ireland economy enjoyed a solid performance in 2016 with overall growth of 1.5%, the strongest rate of growth
Outlook for Economic Activity and Prices (April 2014)
") April 30, 2014 Bank of Japan Outlook for Economic Activity and Prices (April 2014) The Bank's View 1 Summary From fiscal 2014 through fiscal 2016, Japan's economy is likely to continue growing at a pace
April 30, 2014 Bank of Japan Outlook for Economic Activity and Prices (April 2014) The Bank's View 1 Summary From fiscal 2014 through fiscal 2016, Japan's economy is likely to continue growing at a pace
Explore the themes and thinking behind our decisions.
 ASSET ALLOCATION COMMITTEE VIEWPOINTS First Quarter 2017 These views are informed by a subjective assessment of the relative attractiveness of asset classes and subclasses over a 6- to 18-month horizon.
Investment Bulletin. Brexit: positioning your portfolio
 Investment Bulletin 5 October 2018 Brexit: positioning your portfolio With just six months to go before the UK is due to leave the EU and the shape of the country s future relationship with the continent
RICS Economic Research
 RICS Economic Research / February 7 th 2014 Michael Hanley Economist www.rics.org/economics The Outlook for the Construction Sector Growth of 4% expected over 2014 Private housing and infrastructure to
Legal services sector forecasts
 www.lawsociety.org.uk Legal services sector forecasts 2017-2025 August 2018 Legal services sector forecasts 2017-2025 2 The Law Society of England and Wales August 2018 CONTENTS SUMMARY OF FORECASTS 4
2014 Annual Review & Outlook
 2014 Annual Review & Outlook As we enter 2014, the current economic expansion is 4.5 years in duration, roughly the average life of U.S. economic expansions. There is every reason to believe it will continue,
a labour market that has continued to exhibit strong growth in employment, but weak growth in earnings and productivity; and
 1 Executive summary 1.1 Twice a year at the OBR, we provide a detailed central forecast for the economy and the public finances. These forecasts provide a transparent benchmark against which to judge the
Consumer Instalment Credit Expansion
 Consumer Instalment Credit Expansion EXPANSION OF instalment credit reached a high in the summer of 1959, and then moderated in the fourth quarter. In early 1960 expansion increased, but at a slower rate
OVERVIEW. The EU recovery is firming. Table 1: Overview - the winter 2014 forecast Real GDP. Unemployment rate. Inflation. Winter 2014 Winter 2014
 OVERVIEW The EU recovery is firming Europe's economic recovery, which began in the second quarter of 2013, is expected to continue spreading across countries and gaining strength while at the same time
Grant Spencer: Update on the New Zealand housing market
 Grant Spencer: Update on the New Zealand housing market Speech by Mr Grant Spencer, Deputy Governor and Head of Financial Stability of the Reserve Bank of New Zealand, to Admirals Breakfast Club, Auckland,
Forecast evaluation report October 2017 Robert Chote, Chairman, Office for Budget Responsibility
 Forecast evaluation report October 2017 Robert Chote, Chairman, Office for Budget Responsibility Good afternoon everyone. My name is Robert Chote, chairman of the OBR, and I would like to welcome you to
2015: FINALLY, A STRONG YEAR
 2015: FINALLY, A STRONG YEAR A Cushman & Wakefield Research Publication U.S. GDP GROWTH IS ACCELERATING 4% 3.5% Percent Change Annual Rate 2% 0% -2% -4% -5.4% -0.5% 1.3% 3.9% 1.7% 3.9% 2.7% 2.5% -1.5%
Developments in inflation and its determinants
 INFLATION REPORT February 2018 Summary Developments in inflation and its determinants The annual CPI inflation rate strengthened its upward trend in the course of 2017 Q4, standing at 3.32 percent in December,
New Zealand Economic Outlook. Miles Workman June 2017
 New Zealand Economic Outlook Miles Workman June 17 1 Economic Outlook Overview The New Zealand economy is forecast to expand at a solid pace over the next five years With real GDP growth around 3% in 17:
UK Economic Outlook March 2017
 www.pwc.co.uk/economics Contents 1 2 3 4 Global outlook UK economic trends and prospects Consumer spending prospects after Brexit Will robots steal our jobs? 2 Global growth in 2017 should be slightly
Economic Projections For 2014 And 2015
 Economic Projections For 2014 And 2015 Article published in the Quarterly Review 2014:3, pp. 77-81 7. ECONOMIC PROJECTIONS FOR 2014 AND 2015 Outlook for the Maltese economy 1 The Bank s latest macroeconomic
MEDIUM-TERM FORECAST
 MEDIUM-TERM FORECAST Q2 2010 Published by: Národná banka Slovenska Address: Národná banka Slovenska Imricha Karvaša 1 813 25 Bratislava Slovakia Contact: Monetary Policy Department +421 2 5787 2611 +421
INFLATION REPORT PRESS CONFERENCE. Thursday 7 February Opening Remarks by the Governor
 INFLATION REPORT PRESS CONFERENCE Thursday 7 February 2019 Opening Remarks by the Governor The Fog of Brexit There s a story that, a century or so ago, The Times ran the headline, Fog in the channel, continent
Regulatory Announcement RNS Number: RNS to insert number here Québec 27 November, 2017
 ISSN 1718-836 Regulatory Announcement RNS Number: RNS to insert number here Québec 27 November, 2017 Re: Québec Excerpts from The Quebec Economic Plan November 2017 Update, Québec Public Accounts 2016-2017
Potential Output in Denmark
 43 Potential Output in Denmark Asger Lau Andersen and Morten Hedegaard Rasmussen, Economics 1 INTRODUCTION AND SUMMARY The concepts of potential output and output gap are among the most widely used concepts
DECEMBER 2017 BREXIT: BDO S MONTHLY ECONOMIC UPDATE
 DECEMBER 2017 BREXIT: BDO S MONTHLY ECONOMIC UPDATE Welcome to the 18th edition of BDO s monthly economic outlook a temperature check of how UK businesses are feeling in the post-referendum world. Our
Global Macroeconomic Monthly Review
 Global Macroeconomic Monthly Review August 14 th, 2018 Arie Tal, Research Economist Capital Markets Division, Economics Department 1 Please see disclaimer on the last page of this report Key Issues Global
THE CONSTRUCTION SECTOR IN 2015
 THE CONSTRUCTION SECTOR IN 215 Article published in the Quarterly Review 216:2, pp. 25-32 BOX 2: THE CONSTRUCTION SECTOR IN 215 1 This Box reviews developments in the construction and real estate sectors
UK Economic Outlook. March The impact of lower oil prices on the UK economy
 March 2015 UK Economic Outlook The impact of lower oil prices on the UK economy New job creation in the UK: which regions will benefit most from the digital revolution? www.pwc.co.uk/economics Contents
UK Economic Outlook July 2013
 www.pwc.co.uk UK Economic Outlook July 213 Feature articles: Is the UK housing market on the road to recovery? The trillion pound question are gilts the next bubble to burst? PwC firms help organisations
Eurozone. EY Eurozone Forecast March 2015
 Eurozone EY Eurozone Forecast March 2015 Austria Belgium Cyprus Estonia Finland France Germany Greece Ireland Italy Latvia Lithuania Luxembourg Malta Netherlands Portugal Slovakia Slovenia Spain Outlook
Irish Economic Update AIB Treasury Economic Research Unit
 Irish Economic Update AIB Treasury Economic Research Unit 9th October 2018 Budget 2019 Public Finances in Balance The Irish economy has performed strongly in recent years, boosting tax revenues. Corporation
UK ECONOMIC FORECAST Q3 2013
 UK ECONOMIC FORECAST 213 BUSINESS WITH confidence icaew.com/ukeconomicforecast 2 icaew.com/ukeconomicforecast Introduction Welcome to the fifth edition of the ICAEW Economic Forecast, based on the views
Corporate and Household Sectors in Austria: Subdued Growth of Indebtedness
 Corporate and Household Sectors in Austria: Subdued Growth of Indebtedness Stabilization of Corporate Sector Risk Indicators The Austrian Economy Slows Down Against the background of the renewed recession
Svante Öberg: Potential GDP, resource utilisation and monetary policy
 Svante Öberg: Potential GDP, resource utilisation and monetary policy Speech by Mr Svante Öberg, First Deputy Governor of the Sveriges Riksbank, at the Statistics Sweden s annual conference, Saltsjöbaden,
 2012 6 http://www.bochk.com 2 3 4 ECONOMIC REVIEW(A Monthly Issue) June, 2012 Economics & Strategic Planning Department http://www.bochk.com An Analysis on the Plunge in Hong Kong s GDP Growth and Prospects
Svein Gjedrem: Monetary policy and aspects of economic developments
 Svein Gjedrem: Monetary policy and aspects of economic developments Speech by Mr Svein Gjedrem, Governor of the Central Bank of Norway, Ålesund, 12 October 2005. Please note that the text below may differ
Outlook for Economic Activity and Prices (October 2017)
") Outlook for Economic Activity and Prices (October 2017) October 31, 2017 Bank of Japan The Bank's View 1 Summary Japan's economy is likely to continue expanding on the back of highly accommodative financial
Outlook for Economic Activity and Prices (October 2017) October 31, 2017 Bank of Japan The Bank's View 1 Summary Japan's economy is likely to continue expanding on the back of highly accommodative financial
OUTLOOK THE CHANGING STRUCTURE OF THE WA ECONOMY ABOUT OUTLOOK
 OUTLOOK July 2017 I Chamber of Commerce and Industry of Western Australia (Inc) THE CHANGING STRUCTURE OF THE WA ECONOMY ABOUT OUTLOOK Outlook is CCIWA s biannual analysis of the Western Australian economy.
Monetary Policy and Debt Sustainability
 1 Monetary Policy and Debt Sustainability Speech given by Kate Barker, Member of the Monetary Policy Committee, Bank of England Meeting of the West Cheshire and North Wales Chamber of Commerce 23 September
Minutes of the Monetary Policy Committee meeting, August 2018
 The Monetary Policy Committee of the Central Bank of Iceland Minutes of the Monetary Policy Committee meeting, August 2018 Published 12 September 2018 The Act on the Central Bank of Iceland stipulates
Economic Projections :1
 Economic Projections 2017-2020 2018:1 Outlook for the Maltese economy Economic projections 2017-2020 The Central Bank s latest economic projections foresee economic growth over the coming three years to
HOUSEHOLD SECTOR FINANCIAL VULNERABILITY
 September 213 JOHN LOOS: HOUSEHOLD AND PROPERTY SECTOR STRATEGIST: FNB HOME LOANS 11-12 John.loos@fnb.co.za The information in this publication is derived from sources which are regarded as accurate and
The Outlook for the UK Consumer Sector A Note. Gavyn Davies. 9 May Overview
 The Outlook for the UK Consumer Sector A Note Gavyn Davies 9 May 2018 Overview Consumers expenditure accounts for 66 per cent of GDP in the UK. There is therefore a huge variety of investment opportunities
Svein Gjedrem: The conduct of monetary policy
 Svein Gjedrem: The conduct of monetary policy Introductory statement by Mr Svein Gjedrem, Governor of Norges Bank (Central Bank of Norway), at the hearing before the Standing Committee on Finance and Economic
... Eye on the Economy August
 ............................................................................................. Eye on the Economy August 2015.............................................................................................
Monthly Economic Review
 Monthly Economic Review FEBRUARY 2018 Based on January 2018 data releases Bedfordshire Chamber of Commerce Headlines UK GDP growth picked up in Q4, driven by stronger output from the services sector The
Seven-year asset class forecast returns
 For professional investors and advisers only. Seven-year asset class forecast returns 2017 Update Seven-year asset class forecast returns 2017 update Introduction Our seven-year returns forecast largely
1 March 2015 Economic and fiscal outlook Executive summary
 1 March 2015 Economic and fiscal outlook Executive summary Overview 1.1 In the relatively short period since our last forecast in December, there have been a number of developments affecting prospects
The reasons why inflation has moved away from the target, and the outlook for inflation.
 BANK OF ENGLAND Mark Carney Governor The Rt Hon Philip Hammond Chancellor of the Exchequer HM Treasury 1 Horse Guards Road London SW1A2HQ 8 February 2018 On 12 December, the Office for National Statistics
Economic Projections :2
 Economic Projections 2018-2020 2018:2 Outlook for the Maltese economy Economic projections 2018-2020 The Central Bank s latest economic projections foresee economic growth over the coming three years to
Monetary Policy Summary and minutes of the Monetary Policy Committee meeting ending on 9 May 2018
 Monetary Policy Summary and minutes of the Monetary Policy Committee meeting ending on 9 May 2018 Publication date: 10 May 2018 These are the minutes of the Monetary Policy Committee meeting ending on
Indonesia: Changing patterns of financial intermediation and their implications for central bank policy
 Indonesia: Changing patterns of financial intermediation and their implications for central bank policy Perry Warjiyo 1 Abstract As a bank-based economy, global factors affect financial intermediation
International Monetary and Financial Committee
 International Monetary and Financial Committee Thirty-Third Meeting April 16, 2016 IMFC Statement by Angel Gurría Secretary-General The Organisation for Economic Co-operation and Development (OECD) IMF
ASSESSING THE RISK OF A DOUBLE-DIP RECESSION: KEY INDICATORS TO MONITOR
 Weekly Economic Perspective ASSESSING THE RISK OF A DOUBLE-DIP RECESSION: KEY INDICATORS TO MONITOR August 2, 2010 Robert F. DeLucia, CFA Consulting Economist Summary and Major Conclusions: Heightened
Economic Projections :3
 Economic Projections 2018-2020 2018:3 Outlook for the Maltese economy Economic projections 2018-2020 The Central Bank s latest projections foresee economic growth over the coming three years to remain
Monetary Policy Summary and minutes of the Monetary Policy Committee meeting ending on 15 March 2017
 Monetary Policy Summary and minutes of the Monetary Policy Committee meeting ending on 15 March 2017 Publication date: 16 March 2017 These are the minutes of the Monetary Policy Committee meeting ending
Jan F Qvigstad: Outlook for the Norwegian economy
 Jan F Qvigstad: Outlook for the Norwegian economy Address by Mr Jan F Qvigstad, Deputy Governor of Norges Bank (Central Bank of Norway), at Sparebank 1 Fredrikstad, 4 November 2009. The text below may
Minutes of the Monetary Policy Council decision-making meeting held on 2 September 2015
 Minutes of the Monetary Policy Council decision-making meeting held on 2 September 2015 Members of the Monetary Policy Council discussed monetary policy against the background of the current and expected
4 Regional growth trends and prospects 1
 4 Regional growth trends and prospects 1 Key points has consistently outperformed other UK regions for most of the past two decades in terms of economic growth, both before and after the global financial
ECONOMIC OUTLOOK UNIVERSITY OF CYPRUS ECONOMICS RESEARCH CENTRE. October Issue 15/4
 SUMMARY UNIVERSITY OF CYPRUS ISSN 1986-1001 The recovery of economic activity in Cyprus is forecasted to continue in the following quarters. Real GDP growth for 2015 is projected at 1.3%. Real output is