Highlights and key messages for business and public policy
|
|
|
- Shanon Snow
- 5 years ago
- Views:
Transcription

1
2
3 Highlights and key messages for business and public policy Key projections Real GDP growth 1.3% 1.6% Consumer spending growth 1.1% 1.3% Inflation (CPI) 2.5% 2.3% House prices 2.9% 2.8% Source: PwC main scenario projections AI and related technologies should create as many jobs as they displace AI and related technologies such as robotics, drones and driverless vehicles could displace many jobs formerly done by humans, but will also create many additional jobs as productivity and real incomes rise and new and better products are developed. Recent UK developments and prospects In our main scenario, we project UK growth to remain modest at around 1.3% in 2018 and 1.6% in This is due to continued subdued real consumer spending growth and the drag on business investment from ongoing economic and political uncertainty relating to the outcome of the Brexit negotiations. The stronger global economy, and the competitive value of the pound, have boosted UK exports and inbound tourism, offering some support for overall UK GDP growth that should continue through However, the Eurozone economy has slowed recently and any further escalation of international trade tensions could dampen global growth in 2019 and beyond. Service sector growth should remain modest but positive in , while manufacturing also retains some positive momentum despite a slowdown in early But the construction sector has fallen back due to the weakness of commercial property investment and this looks set to continue. London has grown significantly faster than other UK regions for most of the past three decades, but recently there have been signs from both the labour and housing markets that London s relative performance has been less strong. We therefore expect London to grow at only slightly above the UK average rate in In our main scenario, we assume that the Bank of England raises interest rates by 0.25% later this year, although the precise timing of this will be data-dependent and the pace of any subsequent rate increases will remain limited and gradual. House price growth to remain moderate across UK and negative in London this year In our main scenario, we project a further softening of UK house price growth to around 3% in 2018 and we expect this to continue at a similar average rate in the medium term to This implies that the average UK house price would rise from 221,000 in 2017 to around 285,000 by Price growth at this pace would mean that the ratio of house prices to earnings would remain broadly stable, but still at high levels by historical standards. We expect that most regions will experience moderate house price growth in 2018 broadly similar to the UK average. The exception is London, where we project that average house prices could drop by nearly 2% in 2018 compared to We estimate that these countervailing displacement and income effects on employment are likely to broadly balance each other out over the next 20 years in the UK, with the share of existing jobs displaced by AI (c.20%) likely to be approximately equal to the additional jobs that are created. Although the overall effect on UK employment is estimated to be broadly neutral in our central projections, there will inevitably be variations by industry sector. The sectors that we estimate will see the largest net increase in jobs due to AI over the next 20 years include health (+22%), professional, scientific and technical services (+16%) and education (+6%). The sectors estimated to see the largest net long-term decrease in jobs due to AI include manufacturing (-25%), transport and storage (-22%) and public administration (-18%). We identify a number of policy areas where action could help to maximise the benefits of AI (e.g. boosting research funding, ensuring competition is adequate to ensure productivity gains are passed on to consumers) and/or mitigate the costs (e.g. a national retraining programme for displaced workers). UK Economic Outlook July
4 1 Summary Recent developments The UK economy held up well in the six months after the EU referendum, but growth slowed from early This slowdown continued into early 2018, although early signs are that GDP growth was somewhat stronger in the second quarter of this year as the weather improved. Higher inflation has squeezed real household incomes and this has taken the edge off consumer-led growth, together with a slowdown in the housing market. Brexit-related uncertainty has also dampened business investment growth. On the positive side, UK exports have been boosted by the upturn in global growth over the past two years. The weaker pound, although bad for UK consumers, has been helpful to exporters and inbound tourism. Jobs growth has remained strong, with the employment rate at record levels. Fiscal policy has also been relaxed somewhat since the Brexit vote, particularly as regards public investment. Future prospects As shown in Table 1.1, our main scenario is for UK GDP growth to remain moderate at around 1.3% on average in 2018 and 1.6% in Our views on growth and inflation are broadly similar to the latest consensus and OBR forecasts (see Table 1.1). Consumer spending growth is expected to moderate to only around 1% in 2018, but may pick up slightly next year as real wages recover. The stronger global economy should continue to have some offsetting benefits for net exports this year, although there are downside risks in 2019 and beyond if recent US tariff policy changes were to escalate into a wider international trade war. Brexit-related uncertainty may also continue to hold back business investment in the UK. Table 1.1: Summary of UK economic growth and inflation prospects Indicator (% change on previous year) OBR forecasts (March 2018) Independent forecasts (June 2018) PwC Main scenario (July 2018) GDP Consumer spending Inflation (CPI) Source: Office for Budget Responsibility (March 2018), HM Treasury survey if independent forecasters (average value of new forecasts made in June 2018 survey) and latest PwC main scenario. The slowdown in UK growth should be offset in part by planned increases in public investment and some easing of austerity over the next two years as announced in the November 2017 Budget. Recently announced NHS spending plans could imply some further loosening of fiscal policy in the medium term if this is partly funded by higher borrowing rather than increased taxes. But we will not get details of this until the November 2018 Budget. There are always uncertainties surrounding our growth projections, as illustrated by the alternative scenarios in Figure 1.1. There are still considerable downside risks relating to possible pitfalls on the road to Brexit and a global trade war, but there are also upside possibilities if these problems can be contained and global growth continues to pick up. In our main scenario, we expect the UK to continue with moderate but steady growth in , but businesses need to monitor and make contingency plans for potential alternative scenarios related to Brexit and other factors such as global trade tensions. Inflation should fall back gradually to around its 2% target rate by the end of 2019, assuming no major shifts in exchange rates or global commodity prices. Given continued uncertainties around Brexit and the UK economy, we expect the Monetary Policy Committee to remain cautious about the pace of future interest rate rises, but in our main scenario we assume a one quarter point rate rise later this year (either in August or November) and one further increase in Housing market trends and prospects UK house price growth remained relatively resilient in 2017 despite a weakening economic backdrop, but has shown signs of moderating during the first half of 2018, particularly in London. As discussed in detail in Section 3 of this report, we project a further softening of UK house price growth to around 3% in 2018 and we expect this to continue at a similar average rate in the medium term to This implies that the average UK house price would rise from 221,000 in 2017 to around 285,000 by Price growth at this pace would mean that the ratio of house prices to earnings would remain broadly stable, but still at high levels by historical standards. 4
5 We expect that most regions will experience house price growth in 2018 broadly similar to that of the UK average (see Table 1.2). The exception is London, where we project that average house prices could drop by nearly 2% in 2018 compared to In the medium term, however, London house price growth should pick up again, and a large affordability gap will remain between the capital and other UK regions as illustrated by the projections for average regional house prices in 2022 in the final column of Table 1.2. Figure 1.1 Alternative UK GDP growth scenarios % change on a year earlier Projections 2019 We have also considered the effect of the recent marked trend towards fixed rate mortgages, which in 2017 accounted for 94% of new mortgages compared to only around 50% in At the same time, only around 28% of UK households now have a mortgage, as opposed to renting or owning their home outright. Combining these two factors, we estimate that only around 11% of all UK households would now be immediately affected if mortgage interest rates rose, compared to around 24% in This would be a reason for the MPC not to be overly concerned about small rate rises causing significant short-term economic damage. Past rises in UK house prices have been driven by a number of factors, but one of these has been a lack of new housing supply. To further investigate this we have carried out new analysis at the local authority level across England, which suggests a clear link between a lack of new housing supply, relative to population growth, and local house price growth since This has been particularly marked in London, where we estimate that around 110,000 more homes would need to have been built between 2011 and 2016 to keep up with population growth. Main scenario Slow growth Strong growth Sources: ONS, PwC scenarios Table 1.2: Projected regional house price growth and house price values ( 000 s) in our main scenario Average house price growth Region (average) Average house price values ( 000s in cash terms) East of England 4.0% 4.5% 3.4% East Midlands 4.4% 3.7% 3.4% South West 4.3% 3.7% 3.6% West Midlands 4.8% 4.3% 3.6% South East 2.3% 3.1% 3.3% North West 3.2% 2.7% 3.5% London -1.7% -0.2% 2.6% Wales 3.0% 2.1% 3.4% Scotland 4.8% 3.4% 3.6% Yorkshire & the Humber 3.5% 2.7% 3.4% Northern Ireland 3.4% 3.9% 4.0% North East 1.2% 0.7% 3.1% UK 2.9% 2.8% 3.4% Source: ONS, PwC analysis UK Economic Outlook July
6 Looking ahead, if the government can achieve its target of building 300,000 new homes a year in England by the mid-2020s, then this should exceed the increase in housing demand from projected population growth and therefore start to make up the backlog from past under-supply. But our local analysis suggests that many of these homes need to be built where demand is highest in London and the South East and the East of England to prevent a further worsening of affordability in those regions. Local targets need to be set and met for housebuilding, linked to supporting infrastructure development, as well as national targets. What will be the net long-term impact of AI and related technologies on UK jobs? AI and related technologies such as robots, drones and driverless vehicles could displace many jobs formerly done by humans over the coming decades. But, as we discuss in detail in Section 4 of this report, this will also create many additional jobs as productivity and real incomes rise and new and better products are developed. We estimate that these countervailing displacement and income effects on employment are likely to broadly balance each other out over the next 20 years in the UK, with the share of existing jobs displaced by AI (c.20%) likely to be approximately equal to the additional jobs that are created. However, there will inevitably be winners and losers by industry sector (see Table 1.3). The sectors that we estimate will see the largest net increase in jobs due to AI and related technologies in the long run include health (+22%), professional, scientific and technical services (+16%) and education (+6%). The sectors estimated to see the largest net long-term decrease in jobs due to AI include manufacturing (-25%), transport and storage (-22%) and public administration (-18%). Table 1.3: Estimated job displacement and creation from AI by industry sector ( ) Industry sector Health and social work Professional, scientific and technical Information and communication % of existing jobs (in 2017) Number of jobs (000s) Creation Displacement Net effect Creation Displacement Net effect 34% -12% 22% 1, % -18% 16% 1, % -18% 8% Education 12% -5% 6% Accommodation and food services Administrative and support services 22% -16% 6% % -24% -1% Other sectors 13% -15% -2% Wholesale and retail trade 26% -28% -3% 1,276-1, Construction 12% -15% -3% Financial and insurance activities Public administration and defence Transportation and storage 18% -25% -7% % -23% -18% % -38% -22% Manufacturing 5% -30% -25% Total 20% -20% 0% 7,176-7, Source: PwC analysis Based on differences in industry structure alone, our projections do not imply large variations by region, though our central estimates imply a small net job gain in London offset by small net losses in the North and Midlands. But other factors could lead to larger regional variations than captured by our analysis. Although our central estimate is that the net effect of AI on jobs will be broadly neutral, there are many uncertain factors that could tip the balance towards more optimistic or pessimistic scenarios. We identify some policy areas where action could help to maximise the benefits (e.g. boosting research funding for AI, ensuring competition is adequate to ensure productivity gains are passed on to consumers) and/or mitigate the costs in terms of impacts on jobs (e.g. a national retraining programme for older workers as well as renewed efforts by schools and universities to build STEAM skills). 6
7 2 UK economic prospects 1 Key points In our main scenario, we project UK growth to continue at moderate rates of around 1.3% in 2018 and 1.6% in We expect UK growth to become more balanced across regions in , with London no longer growing significantly faster than the UK average and all regions growing at 1% or above. Introduction In this section of the report we describe recent developments in the UK economy and review future prospects. The discussion covers: The world economy remains relatively strong, but the UK will lag behind in due to the drag on domestic demand from higher inflation and Brexit-related uncertainty. A key factor behind the UK slowdown is subdued consumer spending growth as real incomes have been squeezed by higher inflation, the housing market has cooled and further rises in borrowing become hard to sustain. Government investment has picked up recently, but business investment will remain constrained by uncertainties related to Brexit despite the stronger global economy. The latter could also be put at risk in 2019 and beyond if there is further escalation of the recent US-led trade war. Wage growth is projected to pick up gradually during the course of this year and next, with positive real wage growth resuming as consumer price inflation slowly moderates, but staying below pre-crisis levels as productivity growth remains subdued. The Bank of England is expected to continue with very gradual interest rates rises over the next few years, but the timing of these will depend on the evolution of both the economic data and the Brexit negotiations. Section 2.1 Section 2.2 Section 2.3 Section 2.4 Section 2.5 Recent developments in the UK economy Economic growth prospects: national, sectoral and regional Outlook for inflation and real earnings growth Monetary and fiscal policy options Summary and conclusions. 1 This section was written by John Hawksworth with additional material from Andrew Sentance in Box 2.1. UK Economic Outlook July
8 2.1 Recent developments in the UK economy Figure 2.1 Sectoral output and GDP trends 120 Services UK economic growth slowed in 2017 as inflation bit into consumer spending power and Brexit-related uncertainty dampened business investment, although this was offset in part by an upturn in the global and Eurozone economies. UK growth then fell further in the first quarter of 2018, although this decline was exaggerated somewhat by the negative effects of the snow in late February and March. Index ( 2007 = 100) Q Q Q Q Q Q Q Q Q Q Q3 GDP Construction Manufacturing Manufacturing sector output is still slightly below pre-crisis peak levels, but has generally been on a rising trend since 2015 (see Figure 2.1). Most recently, manufacturing output bounced back strongly in the second half of 2017 due to higher demand for UK goods exports because of stronger global and European demand, as well as the competitive value of sterling. But manufacturing growth moderated somewhat in early 2018 as both the domestic economy and key Eurozone markets saw some slowdown. The construction sector has been volatile over time, but had generally been growing relatively strongly in before declining again since early 2017 (with a significant snow-affected drop in 2018). Commercial construction activity has been particularly weak over the past year, perhaps reflecting the impact of Brexit-related uncertainty. Services GDP Manufacturing Construction Source: ONS Figure 2.2 Trends in GDP, consumer spending and the services sector % change on previous quarter Q2 Q3 Q4 Q2 Q3 Q GDP Consumer expenditure Services Source: ONS 2018 The dominant influence on UK growth comes from the services sector, however, which now accounts for almost 80% of UK GDP (compared to only around 10% for manufacturing and around 6% for construction). Services sector output has shown relatively steady growth ever since the recession bottomed out in mid-2009, although there have been some fluctuations in the pace of services growth more recently as Figure 2.2 shows. The fourth quarter of 2017 saw stronger services growth, but this then fell back markedly in the first quarter of Figure 2.2 also shows the influence of slower consumer spending growth on overall GDP growth in recent quarters. This reflects the dampening effect of higher inflation on real household spending power. 8
9 As discussed in more detail in Section 3, the housing market has also slowed, particularly in London. Retail sales growth was particularly weak in the first quarter of 2018, but has recovered in April and May with better weather and business surveys suggest continued stronger growth in June. While official data are more comprehensive, business surveys can provide a more timely indication of short term economic trends. In particular, it is worth keeping an eye on the Markit/CIPS purchasing managers indices (PMIs) for services and manufacturing, as shown in Figure 2.3. Despite some volatility, the manufacturing PMI had been relatively strong in the second half of 2017, but has moderated somewhat over the past six months. The services PMI showed positive but relatively modest growth during the first quarter of 2018, but has picked up during the second quarter. Figure 2.3 Purchasing Managers Indices of business activity Figure 2.4 US dollar and euro exchange rates against the pound 1.5 Above 50 indicates rising activity levels 2008 Services Source: Markit/CIPS Manufacturing Manufacturing 2017 Services 2018 A key factor underpinning recent UK economic trends has been the relative weakness of the pound since the Brexit vote, as shown in Figure 2.4. Sterling regained some ground against the dollar between mid-2017 and April 2018, but has fallen back again since then and remains weak against the euro. A weak currency makes UK exports relatively cheaper for overseas customers, promoting the sale of British goods and services while also improving tourist inflows. But depreciation also raises the prices of imports and this pushed up inflation, so squeezing consumer spending power as discussed above Mar 2016 US Dollar May 2016 Source: Bank of England Jul 2016 Euro Sep 2016 Nov Mar 2017 May 2017 Jul 2017 Sep 2017 Nov Mar 2018 May 2018 USD/ EUR/ UK Economic Outlook July
10 Figure 2.5 Trends in productivity and employment Source: ONS Index 2008 = Productivity (per worker) Employment UK creates record numbers of jobs, but productivity growth subdued since the crisis In the July 2017 edition of UK Economic Outlook, we discussed how the recent combination of low wage growth and low unemployment indicated a flattening of the traditional Phillips Curve (which describes the historical negative relationship between wage inflation and unemployment). One of the key reasons for subdued real wage growth has been relatively weak UK productivity growth since the financial crisis as illustrated in Figure 2.5 for output per worker. The positive side of this has been strong jobs growth, particularly since As discussed in an article by Andrew Sentance in the November 2017 edition of this report 2, weaker post-crisis productivity growth rates in financial services and property-related sectors have played a significant part in this slowdown Employment Productivity In the second half of 2017 there were some signs of productivity bouncing back, but this was more due to weaker jobs growth than particularly strong output growth. During the first quarter of 2018, jobs growth has picked up again, but productivity has fallen back again, leading to weak overall output growth. The ideal combination of strong jobs growth and robust productivity growth, as seen before the crisis, has generally proved elusive over the past decade and this continues to be the case. Why has productivity been weak since the crisis? Many possible explanations have been put forward for recent weak productivity growth, including measurement error (in particular, not capturing the full benefit of digital innovations like smart phones). Soon after the recession, some put it down to labour hoarding by firms or credit constraints by banks, but both these explanations are less convincing now after eight years of recovery since mid Reduced competition in some sectors might be a possible explanation, but against that some other sectors have seen their markets disrupted by technology-savvy new entrants, which would usually be associated with increased innovation and productivity growth. Another possible explanation is that zombie firms could have been kept alive by low interest rates despite low productivity, impeding the reallocation of capital and labour to higher productivity activities within the economy. The most convincing explanation from our perspective is that business investment, while picking up since the recession, has not done so to the extent seen in most past recovery cycles. Many businesses have been reluctant to invest in new labour-saving automation technologies that are relatively risky when compared to the alternative of using more low cost labour, including migrant workers from the EU (although this inflow is now dropping back). Uncertainty around Brexit has been a further dampener on business investment over the past 18 months, which has been broadly flat at a time when global economic conditions and very low interest rates might normally have been expected to lead to much stronger UK business investment growth. Looking years ahead, emerging technologies like robotics and artificial intelligence could hold the potential for faster productivity growth 3, with a net impact on employment that we think could be broadly neutral as we discuss in detail in Section 4 of this report. But, at least for the next few years, productivity growth may remain relatively subdued, with any recovery being at the expense of slower growth in jobs and hours worked. 2 pdf 3 See, for example, our report on the potential impact of AI on the UK economy here, which suggests gains of up to 10% of GDP by 2030: 10
11 2.2 Economic growth prospects: national, sectoral and regional Our main scenario is for real GDP growth of around 1.3% in 2018 and 1.6% in 2019, somewhat below the UK s estimated longer term trend growth rate of just over 2%. Further details of this main scenario projection are set out in Table 2.1. As discussed further in Box 2.1, UK growth in seems likely to be disappointing relative both to historical average UK performance and average growth in other G7 economies in This moderate growth outlook is despite our assumption here that the Brexit negotiations will proceed reasonably smoothly, and therefore that the UK will avoid an extreme hard Brexit where it falls out of the EU in March 2019 without any trade deal or transitional arrangement, so reverting immediately to WTO rules. But clearly this is a key downside risk as discussed further below. The projected deceleration in growth as compared to 2016 has been driven primarily by slower consumer spending growth due to the squeeze on real household incomes from higher inflation. So far consumers have increased borrowing to keep spending growth going at a reasonable pace but, as discussed in detail in the March 2018 edition of this report, there are limits to how much further this can go. We therefore expect consumer spending growth to slow to only around 1% this year before picking up modestly in 2019 as real wages recover. Table 2.1 Main scenario projections for UK growth and inflation % real annual growth unless otherwise stated GDP Consumer spending Government consumption Fixed investment Domestic demand Net exports (% of GDP) CPI inflation (%: annual average) Sources: Latest ONS estimates for , PwC main scenario for Total fixed investment growth lost momentum during the course of 2017 and is expected to remain relatively slow in as Brexit-related uncertainty drags on business investment. Overall, UK domestic demand growth is expected to average only just over 1% per annum in , down from an average rate of around 2.7% in Weaker domestic demand growth is expected to be offset to a degree by a positive contribution from net exports, reversing the strongly negative contribution in This reflects a boost to exports from recent strong global growth, as well as the relatively competitive level of the pound. But there are downside risks here too as discussed further below. UK Economic Outlook July
12 Box 2.1 Why has recent UK economic growth been so disappointing? 4 The UK economy has been accustomed to being one of the better performing major economies in the Western world. If we look back to the period since 1980, UK GDP growth from 1980 to 2015 averaged 2.3%. This was the third highest in the G7 - below the US and Canada but these economies benefited from stronger population growth. Among the G7 economies, the UK achieved the strongest growth in GDP per head between 1980 and the mid-2010s 5 1.9% per annum on average, compared with 1.7% for the US and Japan and 1.5% for Germany (see Figure 2.1.1). But the UK is no longer performing so strongly relative to its G7 counterparts. Economic growth over the past year in the UK has been the second lowest in the G7, with only Japan showing weaker economic growth over the past twelve months. As Figure shows, after outperforming the rest of the G7 from , we project UK GDP growth to be significantly slower than the average of other G7 economies over the period This might be seen as an issue of swings and roundabouts. A ranking of GDP growth covering the decade of the 2010s (using the latest PwC main scenario projections for ) indicates that our current projection of 1.9% average growth for the UK over the years is somewhat behind Germany, Canada and the US ( %), but well ahead of France and Japan (1.4%) and Italy (0.4%). Figure UK led the G7 on average GDP per head growth in UK Japan US Germany Canada France Italy % annual GDP per capita growth, Source: IMF World Economic Outlook Statistical Database (April 2018 edition) Figure UK growth now lagging behind the average of other G7 economies % pa change in UK GDP and weighted average of other G7 economies UK 2011 Rest of G Source: IMF World Economic Outlook ( ) and latest PwC projections ( ) This box was written by Andrew Sentance, senior economic adviser at PwC 5 Although the UK s relative growth performance over this period may be flattered somewhat by the catch-up from its relatively weak performance in the 1970s as well as the deep recession in the base year of
13 Box 2.1 Why has recent UK economic growth been so disappointing? (continued) However, it is unusual for the UK - which has strong trade and investment links with the rest of Europe and the broader global economy to slow down when our major trading partners are speeding up, as has been the case since The obvious explanation is the prospect of Brexit, which has squeezed economic growth in the UK in two main ways. First, the fall in the value of the pound has pushed up inflation and depressed consumer spending. This consumer squeeze has been more powerful than any boost to export performance from a more competitive pound. Second, uncertainty about Brexit has negatively affected business investment. From the end of 2009 until the last quarter of 2015, UK business investment grew at more than 5% per annum in volume terms. The rate of increase since then has been just below 2%, despite buoyant growth across the global economy, which might have been expected to encourage investment in the UK. Other factors have also played a part in this disappointing growth performance in the UK. Low productivity growth has been a feature across all the major industrialised economies since the financial crisis. But the UK appears to have been particularly badly affected by this productivity slowdown. As we have discussed in previous editions of this report, this partly reflects disappointing performance in a number of high productivity sectors, including financial services. We can see the impact of disappointing productivity growth in the most recent GDP and jobs data. In the past 12 months, GDP has risen by 1.2% while employment has increased by 1.4%. In other words, output per head has actually fallen back over the past 12 months, compared with the normal expectation that productivity should grow by 1-2% a year in advanced economies like the UK. Will UK growth performance recover after Brexit? Our medium-term projection for GDP growth in the early 2020s is for an average annual growth rate of around 1.8%, half a percentage point below the average. This is likely to put the UK in the middle of the G7 growth league, alongside France, ahead of Italy and Japan, but behind the US, Canada and Germany. The combination of slow productivity growth and the continuing dampening impact of Brexit are likely to mean that the UK will be only an average growth performer in the early 2020s relative to its peer group of major advanced economies. UK Economic Outlook July
14 Alternative growth scenarios businesses need to make contingency plans To reflect the uncertainties associated with any such projections, particularly in light of Brexit, we have also considered two alternative UK growth scenarios, as shown in Figure 2.6. Our strong growth scenario projects that the economy will rebound to around 2.7% growth in This is a relatively optimistic scenario, which assumes that good early progress is made in UK-EU negotiations and that there are strong favourable trends in the global economy, pushing world growth higher in and boosting UK exports. Our slow growth scenario, by contrast, would see UK growth stall later this year as the global outlook worsens in the face of an escalating US-led trade war and there is little or no progress in negotiations with the EU over the next year, suggesting that the UK may have to fall back on WTO rules with a consequent imposition of tariffs on trade with the EU. The associated uncertainty would be likely to reduce investment, jobs and growth. Even in this downside case, however, we do not expect the UK to fall into a serious recession over this period, barring some major new adverse shock. Figure 2.6 Alternative UK GDP growth scenarios % change on a year earlier Main scenario Slow growth Strong growth Sources: ONS, PwC scenarios We do not believe that either of these two alternative scenarios is the most likely outcome, but they are certainly possible. At present, risks to growth appear to be weighted somewhat to the downside given the political and economic uncertainties around Brexit as well as concerns about an escalating global trade war. Businesses would therefore be well advised to make appropriate contingency plans for such less favourable outcomes, but without losing sight of the more positive possibilities for the UK economy should these downside risks not materialise Projections
15 More generally, companies should consider making detailed contingency plans for the potential impact of Brexit 6 on all aspects of their businesses, covering the kind of questions listed in Table 2.2. Table 2.2: Key issues and questions for businesses preparing for Brexit Issues Implications Questions Trade Tax Regulation Sectoral effects Foreign direct investment (FDI) Labour market Uncertainty The EU is the UK s largest export partner, accounting for around 44% of total UK exports leaving the EU is likely to make trade with EU more difficult, but the extent of this will depend on the type of deal, if any, agreed with the EU27. The UK would gain more control over VAT and some other taxes. But Brexit could also open the door to new tax initiatives within the EU that the UK might currently have sought to block. The UK is subject to EU regulation. Brexit could mean less red tape in some areas. But it could also mean that UK businesses need to adapt to a different set of regulations, which could be costly. The UK is the leading European financial services hub, which is a sector that could be significantly affected by Brexit. Other sectors which rely on the EU single market could also feel a strong impact. FDI from the EU makes up around 45% of the total stock of FDI in the UK. Brexit could put some of this investment at risk. The UK may change its migration policies. Currently EU citizens can live and work in the UK without restrictions. Businesses will need to adjust to any change in this regime. Uncertainty has increased since the referendum and this seems likely to continue through the Brexit negotiation period. How much do you rely on EU countries for revenue growth? Have you reviewed your supply chain to identify the potential impact of tariffs and additional customs procedures on your procurement and logistics? Have you identified which third party contracts would require renegotiation in different Brexit scenarios (EEA/FTA/WTO)? Have you thought about the impact of potential changes to the UK and EU tax regimes after Brexit? Have you upgraded your systems to deal with a significant volume of tax changes? Have you quantified the potential regulatory impact of Brexit to keep your stakeholders up-to-date? How flexible is your IT infrastructure to deal with potential changes to Data Protection laws? Is your compliance function ready to deal with any new reporting requirements arising from Brexit? Have you briefed potential investors on the impact of Brexit for your sector and organisation? How up-to-date are your contingency plans in place to deal with Brexit? Are you aware of the impact of potential volatility in financial markets on your capital raising plans? How much do your rely on FDI for growth? How does Brexit affect your location decisions? How are your competitors responding to the risk of Brexit? Are they relocating any key functions? How reliant is your value chain on EU labour? Have you communicated with your UK-based employees who are nationals of other EU countries? What advice should you give them? Have you considered the additional cost of hiring EU labour after Brexit? Could changes in access to EU labour increase the case for automation? How well prepared are you to manage future volatility in the exchange rate related to Brexit? Is your organisation ready for a worst-case scenario where there is a prolonged period of uncertainty and/or a hard Brexit? Source: PwC 6 For more material on the potential impact of Brexit on your business, please see our EU Referendum hub here: uk/the-eu-referendum.html UK Economic Outlook July
16 Manufacturing growth projected to be relatively strong in 2018 but retail sales slow The sector dashboard in Table 2.3 shows latest ONS estimates of growth rates for 2017 along with our projected growth rates for 2018 and 2019 for five of the largest sectors within the UK economy. The table also includes a summary of the key trends and issues affecting each sector. The most marked downward trend in growth is in the distribution, hotels and restaurants sector, which recorded output growth of almost 5% in 2016, but this slowed to just 1.7% in 2017 and we expect only around 1% growth in 2018 as real consumer spending power is squeezed. Manufacturing should be boosted this year due to stronger exports, but may see growth moderate again in 2019 as earlier competitiveness gains from a weak pound fade and adverse impact of recent US-led tariff rises tend to slow world trade growth. Construction has been weak over the past year and, even if this decline bottoms out, average growth seems likely to be very modest in But it could revive in 2019 as public investment and housing remain relatively strong. Business services and finance growth should remain relatively steady at around 2% per annum, although there are downside risks if Brexit negotiations go less smoothly than we assume in our main scenario. UK financial services companies could be particularly badly affected by any loss of access to EU markets, notably through the possible loss of passporting rights for UK-based firms, although there is also positive longer term potential for the sector beyond Brexit 7. Table 2.3: UK sector dashboard Growth Sector and GVA share Key issues/trends Manufacturing (10%) 2.5% 2.0% 1.6% Manufacturing PMI has moderated somewhat in recent months and output was subdued in April but recovered slightly in May Exporters have gained from a weaker pound and a stronger global economy, though there are concerns about trade wars going forward Construction (6%) 7.1% 0.4% 1.6% Construction PMI was relatively weak in recent months, though it picked up a little in June The construction sector was weak during the first four months of 2018, but output bounced back in May The government has boosted infrastructure investment to try to offset weakness in commercial construction due to Brexit Distribution, hotels & restaurants (13%) 2.2% 0.9% 1.4% A weaker pound since 2016 has boosted tourism, both from overseas and domestically, leading to increased expenditure in the hospitality sector But its broader effect has been to push up import prices and inflation, slowing down real spending growth (though retail sales picked up in May) Business services and finance (34%) 2.6% 2.2% 2.0% The financial sector remains particularly concerned about the possible implications of Brexit, especially if this involves the loss of EU passporting rights The Bank of England has increased the counter-cyclical capital buffer to constrain consumer debt levels, which may impact lending by retail banks Business services have, however, continued to see relatively strong growth in general Government and other services (22%) 0.2% 0.4% 0.8% Public services continue to face tight budgets, but austerity has been eased for at least the next two years and NHS spending is planned to increase Total GDP 1.7% 1.3% 1.6% Sources: ONS for 2017 estimates, PwC for 2018 and 2019 main scenario projections and key issues. These are five of the largest sectors but they do not cover the whole economy - their GVA shares only sum to around 85% rather than 100% 7 For more on the future of UK financial services after Brexit, see our report with TheCityUK here: 16
17 Figure 2.7 PwC main scenario for output growth by region in 2018 and % growth by region South East London East Midlands South West UK East West Midlands North West Wales Yorks & Humberside North East Scotland Northern Ireland Source: PwC analysis Regional prospects: all parts of the UK likely to see moderate growth in with London no longer clearly leading the pack In contrast to previous years where London has generally had one of the strongest growth rates of any UK region, our latest projections suggest London s growth rate may fall to only just above the UK average in (see Figure 2.7). This is partly due to the greater exposure of some London activities (e.g. the City) to adverse effects from Brexit-related uncertainty, as well as growing constraints on the capital in terms of housing affordability and transport capacity. Most English regions, as well as Wales, are projected to expand at close to the UK average of around 1.3% in 2018, although the North East, Scotland and Northern Ireland are predicted to lag behind somewhat with growth of only around 1% this year before recovering somewhat next year. It is important to note that, since regional output data are published on a less timely basis than national data, the margins of error around these regional output projections are even larger than for national growth projections. Therefore, they can only be taken as illustrative of broad directional trends. 2.3 Outlook for inflation and real earnings growth Consumer price inflation (CPI 8 ) picked up from just 0.7% on average in 2016 to 3% in the year to uary 2018 due in large part to the feedthrough from a weaker pound into import prices. The rise in global oil prices from their low point in early 2016 to over $75 a barrel at the time of writing has also played a part here. However, CPI inflation did fall back to 2.4% in the year to May 2018 as the effect of past import price rises fell out of the 12 month inflation calculation. Over the next 18 months, we expect CPI inflation to decline gradually, eventually returning to close to target by the end of 2019 although there could be some turbulence along the way (see Figure 2.8). Annual average rates of inflation in our main scenario would be around 2.5% this year and around 2.2% in The ONS switched to CPIH as its main inflation indicator in March 2017, despite some continuing methodological concerns about the reliability of the way that CPIH captures owner occupied housing costs through estimates of equivalent market rents rather than actual outlays on mortgage payments. For the moment, we have stuck to CPI as our key inflation indicator, but we may consider switching to CPIH in the future if this becomes more widely used (in particular if it becomes the MPC s target measure of inflation). In the long run, however, we would not expect significant differences between average inflation on these two measures (based on long-term historical averages). UK Economic Outlook July
18 Alternative inflation scenarios There is always considerable uncertainty over inflation projections as they are particularly sensitive to movements in exchange rates and global commodity prices, both of which are very hard to predict with any confidence. As such, we also present two alternative scenarios for UK inflation in Figure 2.8: In our high inflation scenario we project UK inflation to rise to around 3.5% by early 2019 as a result of renewed falls in the pound and a pick-up in global commodity prices if other economies grow more strongly and/or oil supply is constrained by producers. Wage growth could also pick up faster than expected in this case. Figure 2.8 Alternative UK inflation (CPI) scenarios % change on a year earlier Inflation target = 2% High inflation Sources: ONS, PwC scenarios Main scenario 2014 Low inflation 2015 Figure 2.9 CPI inflation vs average earnings growth 2016 Inflation target Projections 2019 In our low inflation scenario, by contrast, the UK and global economies weaken by more than expected in our main scenario leading global commodity prices to fall back sharply over the next year. In this case, UK inflation could fall back to well below the Bank of England s 2% target rate next year. % change p.a CPI Real squeeze Earnings Projections As with our GDP growth scenarios, neither of these two alternative variants is as likely as our main scenario. But given recent volatility and uncertainty, businesses should plan for a broad range of outcomes. Real earnings projected to pick up gradually As Figure 2.9 shows, real earnings growth was squeezed from but then regained some ground in as low global commodity prices pushed down UK inflation to close to zero. But the real earnings squeeze resumed in 2017 as wage inflation failed to pick up in response to higher consumer price inflation CPI Sources: ONS, PwC analysis Average weekly earnings (excl bonus) Falling inflation means that real earnings growth (excluding bonuses, which tend to be erratic) has now edged back into positive territory and we expect this gradual upward trend to continue in the rest of 2018 and into 2019 (see Figure 2.9). It is difficult for earnings to pick up significantly on a longer term basis, however, unless productivity growth picks up on a sustained basis. 18
19 2.4 Monetary and fiscal policy The Monetary Policy Committee (MPC) kept interest rates on hold in May and June as it waited for more data on whether the sharp dip in growth in the first quarter of the year was a blip or the start of a more severe downward trend. Since we expect growth to recover in the rest of the year, we do expect a rate rise before the end of this year, possibly as early as August, but the timing of this will depend on how both the economic data and the Brexit negotiations evolve. In the medium term, we assume further small and gradual rate rises, but interest rates will remain very low by historical standards for the foreseeable future. Base rates may end up at around 2-3% as opposed to the 5% pre-crisis norm. As regards fiscal policy, the Chancellor made no significant tax or spending changes in his Spring Statement, despite public borrowing falling to just under 2% of GDP in the 2017/18 financial year, the lowest since 2001/2. We can expect more substantial changes in the Budget in November, including details of how the government will pay for the more generous NHS spending settlement announced recently, which will require some tax increases. We also expect the Budget to set high level spending totals for the next 4-5 years that will set the envelope for the more comprehensive 2019 Spending Review, which will set medium-term budgets for individual departments. We will review the government s fiscal policy options in more detail nearer the time of the November Budget. 2.5 Summary and conclusions UK economic growth has slowed over the past 18 months as inflation has squeezed consumers, the housing market has cooled and Brexit-related uncertainty has dampened business investment growth. There has been some offset from a stronger global economy, but not enough to keep UK growth from falling well below its long term trend rate of around 2%. In our main scenario, we expect this period of modest, sub-trend growth to continue in , with GDP growth of around 1.3% in 2018 and 1.6% in 2019 and real consumer spending growth of just over 1% in both years. The impact of slower growth will be felt across most major industry sectors, although manufacturing exports have received a short-term boost from the depreciation of the pound since 2016 and recent stronger global growth (although any further escalation of US-led trade wars could threaten this relatively rosy global picture in 2019 and beyond). Construction has faced the most marked slowdown over the past year, although this follows a period of considerable strength up to early In our main scenario we assume a one quarter point interest rate rise later this year, although the exact timing of this remains uncertain, and another in 2019 as the MPC seeks to bring inflation back down to target. But any such increases will be limited and very gradual, aimed at taking interest rates back to around 2-3% in the longer term. It is important to note that there are considerable uncertainties around any such projections at present. So organisations should stress test their business and investment plans against alternative economic scenarios and also review the potential wider implications of Brexit for all aspects of their operations. UK Economic Outlook July
20 3 UK housing market outlook 1 Key points UK house price growth remained relatively resilient in 2017 despite a weakening economic backdrop, but has shown signs of moderating during the first half of 2018, particularly in London. In our main scenario, we project a further softening of house price growth to around 3% in 2018 and we expect this to continue at a similar average rate in the medium term to This implies that the average UK house price would rise from 221,000 in 2017 to around 285,000 by Price growth at this pace would mean that the ratio of house prices to earnings would remain broadly stable, but still at high levels by historical standards. We expect that most regions will experience moderate house price growth in 2018 broadly similar to the UK average, except for London, where we project that house prices could drop by nearly 2% compared to Elsewhere in the UK, slightly above average price growth is projected in the East of England, the West Midlands and Northern Ireland, while the North East and Wales are expected to lag slightly behind the UK average price growth. We also consider the effect of the recent marked trend towards fixed rate mortgages, which in 2017 accounted for 94% of new mortgages compared to only around 50% in At the same time, only around 28% of UK households now have a mortgage. Combining these factors, we estimate that only 11% of all UK households would now be immediately affected if mortgage interest rates rose, compared to around 24% in Persistently rising house prices can be driven by a number of factors, but one of these has been a lack of new housing supply. To further investigate this we have carried out new analysis at the local authority level, which suggests a clear link between lack of new housing supply, relative to population growth, and local house price growth since This has been particularly marked in London, where we estimate that around 110,000 additional homes would need to have been built between 2011 and 2016 to keep up with population growth. Looking forward, if the government can achieve its target of building 300,000 new homes a year in England, then this should exceed the increase in housing demand from projected population growth and start to make up the backlog from past under-supply. But our local analysis suggests that these homes need to be built where demand is highest in London and the South East and East of England to prevent a further worsening of affordability in those regions. Local targets are therefore needed for housebuilding, as well as national targets. Introduction In this section, we explore how the UK housing market has been performing recently (Section 3.1) and also look at the implications of the rising share of fixed rate mortgages (Box 3.1). We then present our projections for national and regional house price inflation to 2025 (Section 3.2). To shine fresh light on the housing supply challenge we also present new analysis of supply and demand trends at the local authority level across England (Section 3.3). Section 3.4 then summarises and concludes. Technical details of our house price modelling methodology are presented in an annex. 1 This article was written by Richard Snook, Tom Fisher and Jamie Durham of the PwC economics practice. 20
21 3.1 Recent housing market developments UK house price inflation softened from mid-2016 through to early The introduction of the Stamp Duty surcharge on second homes in April 2016 equivalent to an additional 3% tax on the purchase price and uncertainty following the EU referendum are both likely to have contributed to this trend. During 2017, average UK house price inflation remained fairly steady, hovering between 4.5% and 5%. More recently, however, a further weakening in price growth has occurred, with annual house price inflation dropping to 3.9% in the year to April There are signals that house price growth will continue to soften in the short term. The recent weakening in house price growth is in line with broader market data on transactions and mortgage lending. At the UK level, the most recent data shows that total transactions have fallen from around 75,000 in February last year to around 64,000 in February this year. As shown in Table 3.1, sales volume declines were experienced across all UK regions in the year to February. The falls in sales from the year before are most stark in London and the South East. Looking ahead to the remainder of 2018, we anticipate that this lacklustre housing market activity could begin to weigh further on house price growth. Figure 3.1 UK house price inflation since 2005 Year-on-year price change % Source: ONS, Land Registry Regionally, London house prices have experienced the largest downturn to date. London house price growth is now the weakest of any region. The capital consistently had the fastest growing house prices over the period from May 2012 to April 2015 but, since then, London house price growth has fallen sharply. For example, annual price growth to March 2016 was around 15% in London, but for March 2018 the equivalent figure was -0.5%. Elsewhere, however, regional house price growth has been more resilient. Our regional house price projections for 2018 onwards are set out in detail in Section 3.2 below Table 3.1: Regional housing sales volume change in year to February 2018 Region Year-on-year change in sales volumes Wales -8.6% Scotland -9.1% Northern Ireland -12.4% London -23.9% South East -19.7% South West -11.9% North East -16.2% North West -12.0% West Midlands -6.9% East Midlands -10.1% East of England -17.4% Yorkshire and the Humber % 2018 UK -14.3% Source: ONS, Land Registry 2 April 2018 is the most recent data point available at the time of publication. 3 Complete sales data typically lags two months behind the initial house price estimates. The most recently available sales data is therefore for February 2018 at the time of writing. UK Economic Outlook July
22 Box 3.1 The impact of fixed rate mortgages on household budgets In recent years there has been substantial shifts in the UK mortgage market. First, the cost of borrowing has continued to fall. Homebuyers and those seeking re-mortgage can now access rates of around 1.5% on 2-year fixed mortgages. The cost of borrowing on longer-term mortgages has also continued to decline: for example, the typical interest rate on a 5-year fixed rate mortgage has nearly halved from around 3.75% in mid-2014 to around 2% now 4. Second, there has been a surge in the popularity of fixed-rate mortgages. As shown below, the share of new mortgages that are fixed-rate has increased from 50% in 2010 to 94% in 2017 (see left hand chart in Figure 3.1.1). This recent upward trend has helped to boost the share of all mortgages that are fixed-rate to over 60% from under 30% in 2012 (see right hand chart in Figure 3.1.1). As we head into 2018, that share of outstanding fixed rate mortgages looks likely to increase even further. This trend means that fewer households will feel an immediate squeeze on their budgets from any future interest rate rise. For many, the impact may not be felt until some years later 5. Extrapolating data on home ownership from the English housing survey to the whole of the UK, we estimate that only around 28% of all UK households now have a mortgage (others will own outright or rent). Figure Share of fixed rate mortgages for new mortgages and as a % of the overall stock of mortgages Share of new mortgages by type (%) Fixed rate mortgages as share of total outstanding (%) Source: Council of mortgage lenders 50% 2010 Fixed Discounted Tracker Capped SVR Therefore, assuming only around 40% of these mortgaged households now have a variable rate mortgage based on the data in Figure 3.1.2, we estimate that only around 11% of total households will immediately % feel the impact of rate rises on their budgets. The equivalent figure in 2012 was more than twice as high at around 24%. 4 Source: Council of mortgage lenders, table IR3, figures for March The FCA s December 2017 Data Bulletin noted that most popular length of fixed rate mortgage was 2 years, but that 5-year and 10-year fixed rate mortgages were increasing in popularity. 22
23
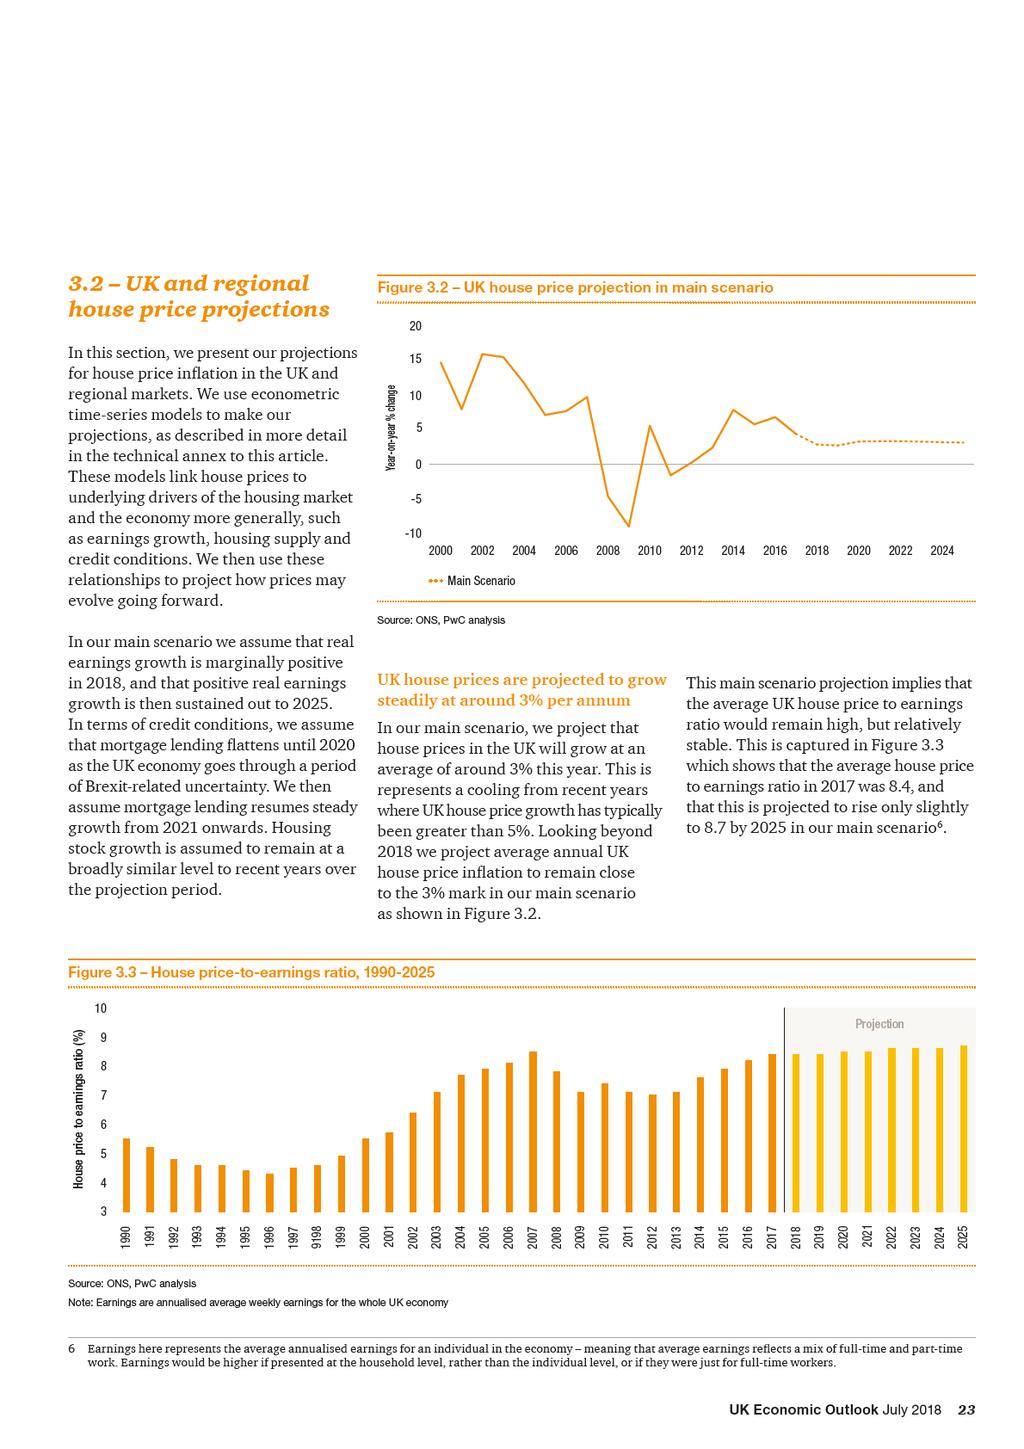
24 Figure 3.4 Projected house price inflation by UK region in Year-on-year % change West Midlands Scotland East Midlands South West East of England Yorkshire & The Humber Northern Ireland North West Wales South East North East London Source: PwC analysis In our main scenario, the average price of a UK house in 2018 is around 227,000. This represents a 6,000 increase on the average 2017 price. Looking to the longer-term, our main scenario projects the average house will cost approximately 285,000 in As shown in Table 3.2 even after adjusting house prices for projected general consumer price inflation, there is still an upward trend. Specifically, in real terms at 2017 prices, we project that house prices could be around 9% more expensive by 2025 than in Regionally, the average house price differs significantly, ranging from 480,000 in 2017 in London to just 127,000 in the North East of England. Table 3.2: UK house prices - main scenario projections Year Main scenario (% growth) Main scenario (in cash terms) Main scenario (real terms at 2017 prices) Price to earnings ratio 2017 (actual) 4.5% 221, , % 227, , % 234, , % 242, , % (average growth) Source: PwC analysis based on ONS house price index 285,000 (in 2025) 241,000 (in 2025) 8.7 (in 2025) In our main scenario we project that 2018 house price growth will be positive at moderate levels for most regions (see Figure 3.4). We project the strongest house price growth in the West Midlands this year and in the East of England next year, with the weakest house price trends being projected in London and the North East. 24
25 In London, where affordability has been most stretched, we project negative average annual house price growth both this year and next. This reflects the downward pressure on property prices from: a very high deposit saving hurdle, particularly where Help to Buy (or the bank of mum and dad ) is unavailable; increased economic uncertainty related to Brexit acting as a drag on international capital flows into London property; and reduced numbers of housing transactions in the capital, which may be partly associated with the increased transaction costs imposed by the introduction of the stamp duty surcharge on second homes in Our house price growth and average house price level projections by region are set out in more detail in Table 3.3. However, it should be noted that even greater uncertainty exists at the regional house price level compared to the UK level, and in particular, longer term projections should be treated with caution so we do not try to extend our regional analysis here beyond Table 3.3: Projected regional house price growth and house price values ( 000 s) in our main scenario Average house price growth Region (average) Average house price values ( 000s in cash terms) East of England 4.0% 4.5% 3.4% East Midlands 4.4% 3.7% 3.4% South West 4.3% 3.7% 3.6% West Midlands 4.8% 4.3% 3.6% South East 2.3% 3.1% 3.3% North West 3.2% 2.7% 3.5% London -1.7% -0.2% 2.6% Wales 3.0% 2.1% 3.4% Scotland 4.8% 3.4% 3.6% Yorkshire & the Humber 3.5% 2.7% 3.4% Northern Ireland 3.4% 3.9% 4.0% North East 1.2% 0.7% 3.1% UK 2.9% 2.8% 3.4% Source: ONS, PwC analysis 7 Based on the average price of a London house as at April 2017 ( 485,000), the Stamp duty surcharge would increase the overall stamp duty to be paid from 14,250 to 28,800, a greater than 100% increase. 8 This is because some unpredictable factors causing regional house price projection errors will be area-specific factors that are not correlated across regions, and so will tend to cancel out when looking at aggregate national house prices. The latter will therefore tend to have lower forecasting errors on average than projections for individual regions (whether for house prices or other economic variables). UK Economic Outlook July
26 Alternative UK house price scenarios Projecting house prices involves many uncertainties both about economic drivers like earnings and interest rates and about more intangible factors like buyer or lender confidence. To reflect these uncertainties, we therefore always develop two alternative house price inflation scenarios based on different inputs for the key model drivers (see Figure 3.5). Our high price scenario assumes real earnings growth reverts relatively quickly to long-run historical trends, which provides a boost to housing demand. This scenario also assumes that credit conditions are more favourable with relatively strong mortgage lending growth to In this scenario annual house price growth is projected to average 4.4% in 2018, but then reverts to around 6% from 2019 onwards. This would represent a continued stretching of house price to earnings ratios at the UK level. In terms of price implications, the average house price could be over 340,000 by 2025 in this scenario. Our low price scenario assumes that negative real wage growth reasserts itself and persists into the longer term, dampening housing demand. It also assumes that more challenging economic conditions (linked perhaps to a less smooth Brexit and/or rising global trade restrictions) are associated with a retrenchment in mortgage lending back towards 2014 levels. In this scenario, UK house price growth weakens substantially this year to around 1% and then remains subdued from 2019 onwards, with close to zero average house price growth. In this case, house prices would remain close to 2017 levels, and are estimated to be around 224,000 in Figure 3.5 Alternative UK house price inflation scenarios Year-on-year % change Main Scenario Source: ONS, PwC analysis High Scenario Assessing the local housing supply challenge The general consensus of housing market analysts, which was also accepted by the government in its housing white paper last year, is that there is a serious shortage of affordable housing in the UK. The fact the UK average house price to earnings ratio has gone back to its pre-crisis peak (see Figure 3.4 above) is one indication of this problem and, in areas like London, Oxford and Cambridge, the affordability challenge is clearly even more severe. Coupled with higher deposit requirements set by lenders, this poses particular challenges for potential first time buyers. In 2016, we estimated that potential buyers without any parental or other help might have to save for 19 years to buy their first home 9, up from just 3 years in the early 1990s (although mortgage rates were also much higher then, offsetting the benefits of lower initial deposits) Low Scenario In an attempt to mitigate these affordability issues, the government has launched a number of first time buyer support schemes, including Help to Buy equity loans and ISAs and stamp duty discounts. However, while these schemes make housing more affordable in the short term, they also compound the underlying structural problem by further increasing housing demand. The government s focus more recently has therefore shifted towards longer term solutions to affordability aimed primarily at boosting housing supply. In particular, in his Autumn 2017 Budget, Phillip Hammond announced plans to increase net housebuilding in England to an average of 300,000 homes a year by the mid-2020s 10, up from around 220,000 in This builds upon a White Paper published by the government in February 2017, Fixing our broken housing market, which sets out a range of policies that the government should introduce to reform the planning regime and other measures to boost the supply of new homes. 9 Assuming the deposit has to be raised entirely from their own savings without family assistance. See the July 2016 edition of UK Economic Outlook for full details of this analysis. 10 Source: Philip Hammond (2017). Autumn Budget 2017 Philip Hammond Speech. Source: 26
27 Ultimately though housing market conditions vary widely across the country so it is not enough to set national targets; you also need to build the extra homes where demand is highest and the affordability challenges are most severe. We have therefore explored this issue at a local level in England 11 to understand in more detail the extent to which local housing shortage is linked to higher house price growth and where shortages are occurring. We do this by combining housing stock data with population 12 estimates to compare housing supply and demand trends at a local authority level across England. Figure 3.6 Net change in dwellings and population in England ( ) 13 Net change from previous years 300, , , , ,000 50, , New build completions Net conversions Net change of use Net other gains Demolitions Adjustment to Census 2011 Net additional dwellings Population 600, , , , , ,000 0 Change in population from previous year To set the scene, we first look at the picture for England as whole. Figure 3.6 compares the net change in the dwelling stock in England with the net annual change in population, scaled to match given we are looking at absolute numbers. Table 3.4 then looks at percentage changes in these variables and calculates an excess housing demand growth measure defined as population growth minus net housing stock growth. Source: ONS, DCLG, PwC analysis From Figure 3.6 we can see that, by 2016, growth in the number of dwellings had returned to a similar level as prior to the financial crisis, following several years of subdued housebuilding growth. The number of dwellings made available through a change of use (in which industrial properties may be converted to residential) has also increased year-on-year since 2013, following a relaxation of regulatory restrictions on such conversions. Nonetheless, the rate of population growth in England was consistently above housing stock growth from as Table 3.4 shows. This is in contrast to the period prior to 2010, where the percentage of net additional dwellings consistently outpaced population growth. At a high level, this supports the hypothesis that excess demand (linked to inadequate supply) has helped to stoke house price growth since the financial crisis, although we also recognise that other factors will have been in play here, including exceptionally low mortgage rates since late Table 3.4: Population growth, net housing stock change and estimated excess housing demand growth for England Population growth 0.5% 0.5% 0.5% 0.8% 0.7% 0.8% 0.8% 0.7% 0.9% 0.9% 0.7% 0.7% 0.8% 0.9% 0.9% Housing stock growth 0.6% 0.7% 0.5% 1.0% 0.7% 1.2% 1.0% 1.0% 0.5% 0.4% 0.4% 0.3% 0.3% 0.4% 0.4% Excess demand -0.1% -0.2% 0.0% -0.2% 0.1% -0.3% -0.2% -0.2% 0.4% 0.4% 0.4% 0.4% 0.5% 0.5% 0.5% Source: ONS, DCLG, PwC analysis 11 We could only carry out the analysis for England as data for all countries within the United Kingdom were not consistently available at local authority level. 12 We also commissioned local authority level data on household numbers from the ONS but found that there was high volatility of these estimates from year to year at local level, perhaps due to small sample sizes. For the final version of this analysis, we therefore chose to focus on local data on population, which was less volatile over time than that for household numbers. We implicitly assume here that average household size is broadly stable over time. Additionally, we tested the conclusions against previous versions of the household dataset at a local authority level published by the DCLG and found a similar relationship between excess demand and price growth, and a similar regional picture. 13 Data for change in dwellings by component is only available from UK Economic Outlook July
28
29
30
31 Figure 3.10 shows that high growth in population and high excess housing demand were particularly acute in London, illustrated by 85% of London local authorities being to the right of the 45 degree line. Local Authorities in the South East and East of England also experienced relatively high price growth and tended to be to the right of the 45 degree line, but the trend is less pronounced than for London. In England as a whole, half of local authorities had excess demand (i.e. were right of the line) and half did not. This suggests that the supply problems are very much about not building houses in the right place and less so about an overall supply shortage. Whilst the result that too few homes have been built in London to keep up with population growth is not a surprise, it does enable us to estimate how large the shortfall has been and where it has been most apparent. In Table 3.6 we present figures for the five London local authorities with the greatest excess demand growth and their cumulative housing shortfall from Overall in London we estimate that an additional 110,000 new homes between 2011 and 2016 would have been needed to match the population growth that was experienced. Table 3.7 repeats this analysis for the five English local authorities outside London with the highest percentage excess housing demand growth. In other English local authorities, housing stock growth does not appear to have been a constraint. Demand side factors, such as very low interest rates, rising employment since 2012 and Help to Buy schemes, may be the primary cause of house price increases. However, it is possible that the housing being built in these areas is not of an appropriate mix (e.g. too many small properties or premium properties), which would make the effective growth in the housing stock smaller. If this is the case, local house building targets may still be beneficial to these areas as well as hot spots like London or Oxford and Manchester. Table 3.6: Excess housing demand growth and estimated housebuilding shortage for local authorities in London, Local Authority Excess demand Price Growth Shortfall Tower Hamlets 12% 60% 12,000 City of Westminster 10% 63% 11,000 Camden 9% 38% 9,000 Islington 8% 56% 8,000 Kingston upon Thames 8% 60% 5,000 London (including all boroughs) 3% 61% 110,000 Source: PwC analysis of ONS and DCLG data (numbers rounded to nearest percent or thousand) Table 3.7: Excess housing demand growth and estimated housebuilding shortage for selected local authorities in England (excluding London), Local Authority Excess demand Price Growth Shortfall Exeter 5% 18% 3,000 Guildford 5% 37% 3,000 Oxford 5% 45% 3,000 Runnymede 5% 42% 2,000 Manchester 5% 23% 10,000 Source: PwC analysis of ONS and DCLG data (numbers rounded to nearest percent or thousand) 15 We exclude City of London from this table as it is an extreme outlier. UK Economic Outlook July
32 Future declines in population growth may help alleviate supply pressures, but housing supply needs to expand to cover past backlogs Looking ahead, population growth rates in England are projected by the ONS to fall to below 250,000 a year by 2030 from recent rates of around 400,000 to 500,000 per annum (see Figure 3.11). We would expect a reduction in the population growth rate to put downward pressure on the number of households and in turn on house prices. DCLG assume that a 1% increase in the population pushes house prices up by 2%, other things being equal, so affordability could improve as a result of declining population growth 16. If we assume that demand for houses will increase proportionally 17 with the population between 2017 and 2030, then the government s target of building 300,000 new homes per year in England by the mid-2020s would be more than enough to match projected population growth. However, this ignores the fact that there is a backlog of under-supply to be made up and that, even after that, current affordability levels need to be reduced if the government s long-term objective to get home ownership rates back on an upward trend is to be achieved. We should also note that, by international standards, UK housing stock growth has been relatively slow for many decades, as the analysis in Box 3.2 shows. All of this suggests that it is reasonable to aim for 300,000 new homes per year as a target for England as a whole, but it is important to target these new homes on locations where past under-supply has been most evident, as our local analysis above indicates. Figure 3.11 Population projections for England to , , , , , , High - Low Population Population projection (Principal) Source: ONS, PwC analysis 16 Source: Ministry of Housing, Communities & Local Government (2018). Analysis of the determinants of house price changes 17 This assumes a constant average household size, which ONS data suggests has been broadly the case over the past two decades, remaining around 2.4 since
33 Box 3.2 UK housing stock growth per household has been slower than other similar countries We review data for the number of houses per household to understand how the market has changed in the UK and other comparable countries, as shown in Figure Figure International comparison of housing stock per household, From Figure 3.2.1, we can see that the UK has experienced the lowest growth in the number of houses per household of similar international economies. While it had one of the highest rates of housing per household in 1990, it had one of the lowest rates in 2015, with around 1 house per household. It is important to note that this analysis is only illustrative. It does not consider the average size of dwellings: while housing stock may have increased considerably in some countries, this is not to say that living standards (i.e. the quality of their homes) have been maintained. Further, other factors may be influencing the housing stock per household in some countries, such as holiday homes and cultural differences. Nonetheless, it is suggestive of the UK lagging behind in housing supply growth relative to population growth relative to other advanced economies since Houses per household Norway Source: UN, PwC analysis United Kingdom Australia New Zealand United States of America Finland Switzerland Ireland 18 We have assumed a constant household size to derive the number of households, using the latest household size figures from the UN. Over a longer period of time, average household size can change, though generally not by that much for mature advanced economies. ONS data shows, for example, that average household size in the UK has remained at around 2.4 since UK Economic Outlook July
34 3.4 Summary and conclusions UK house price growth remained relatively resilient in 2017 despite a weakening economic backdrop, but has shown signs of moderating during the first half of 2018, particularly in London. In our main scenario, we project a further softening of UK house price growth to around 3% on average in 2018 and we expect this to continue at a similar average rate in the medium term to This implies that the average UK house price would rise from 221,000 in 2017 to around 285,000 by Price growth at this pace would mean that the ratio of house prices to earnings would remain broadly stable, but still at high levels by historical standards. We expect that most regions will experience house price growth in 2018 broadly similar to that of the UK average except for London, where we project that house prices could drop by nearly 2% compared to In the medium term, however, London house price growth should pick up again, and a large affordability gap will remain between the capital and other UK regions. We also considered the effect of the recent marked trend towards fixed rate mortgages, which in 2017 accounted for 94% of new mortgages compared to only around 50% in At the same time, only around 28% of UK households now have a mortgage, as opposed renting or owning their home outright. Combining these two factors, we estimate that only 11% of all UK households would now be immediately affected if mortgage interest rates rose, compared to around 24% in This would be a reason for the MPC not to be overly concerned about small rate rises causing significant economic damage. Persistently rising house prices can be driven by a number of factors, but one of these has been a lack of new housing supply. To further investigate this we have carried out new analysis at local authority level across England, which suggests a clear link between lack of new housing supply, relative to population growth, and local house price growth since This has been particularly marked in London, where we estimated around 110,000 additional homes would need to have been built between 2011 and 2016 to keep up with population growth. Looking ahead, if the government can achieve its target of building 300,000 new homes a year in England, then this should exceed the increase in housing demand from projected population growth and should therefore start to make up the backlog from past under-supply. But our local analysis suggests that these homes need to be built where demand is highest in London and the South East and East of England to prevent a further worsening of affordability in those regions. Local targets need to be set and met for housebuilding, linked to supporting infrastructure development, as well as national targets. 34
35 Technical annex: Modelling methodologies UK house price projections Our analysis focuses on the new ONS and Land Registry house price indices. Data from the ONS vary from those provided by Nationwide and Halifax, though broad trends tend to be similar over time. We focus on the ONS data as they cover a larger sample size, given that Nationwide and Halifax base their indices only on their own mortgage approvals. The PwC house price model consists of two parts: a long run equilibrium equation and a short run error correction model that indicates how house prices adjust back towards this equilibrium level. In the long run, we found that real house prices were driven by three key variables: real annual earnings, the ratio of the housing stock to the population ( supply ) and a variable which reflects general credit conditions. Monetary values are deflated into real (inflation adjusted) terms using CPI. In the short run, we found that changes in real house prices were driven by: deviations from the long run equilibrium; changes in real annual earnings; changes in credit conditions; and the previous period s mortgage interest rate (cost of borrowing). The coefficients for these model variables and other summary statistics for both models are shown in the tables below. The parameters of the model were estimated using the standard ordinary least squares (OLS) econometric technique based on annual data for Regional house price projections The regional house price projections relate to the main scenario only, but it should be borne in mind that uncertainties are even greater at the regional than the national level, so these projections can only be considered illustrative. Our regional projections are based on a regression between house price to earnings ratios and mortgage rates. The results are then adjusted so as to aggregate to the UK average estimates. Long run model (Cointegrating equation) R-squared = 0.93 Dependent variable: Real house prices Coefficient No. of observations=43 t-statistics Earnings Supply Credit Constant Short run model R-squared = 0.63 Dependent variable: Change in Real house prices Coefficient No. of observations=42 t-statistics L. co-integrating equation residual D.Credit D.Earnings L.Mortgage rate Constant Note: D refers to the first difference of a variable (i.e. change on previous year). L refers to the lagged value of a variable in the previous year. UK Economic Outlook July
36 4 What will be the net impact of AI and related technologies on jobs in the UK? 1 Key points AI and related technologies such as robotics, drones and driverless vehicles could displace many jobs formerly done by humans, but will also create many additional jobs as productivity and real incomes rise and new and better products are developed. We estimate that these countervailing displacement and income effects are likely to broadly balance each other out over the next 20 years in the UK, with the share of existing jobs displaced by AI (c.20%) likely to be approximately equal to the additional jobs that are created. Although the overall effect on UK jobs is estimated to be broadly neutral in our central projections, there will inevitably be winners and losers by industry sector. The sectors that we estimate will see the largest net increase in jobs in the long run include health (+22%), professional, scientific and technical services (+16%) and education (+6%). The sectors estimated to see the largest net long-term decrease in jobs due to AI include manufacturing (-25%), transport and storage (-22%) and public administration (-18%). Based on differences in industry structure alone, our projections do not imply large variations by region, though our central estimates imply a small net job gain in London offset by small net losses in the North and Midlands. But other factors could lead to larger regional variations than captured by our analysis. Although our central estimate is that the net effect of AI on jobs will be broadly neutral, there are many uncertain factors that could tip the balance towards more optimistic or pessimistic scenarios. We identify some policy areas where action could help to maximise the benefits (e.g. boosting research funding for AI, ensuring competition is adequate to ensure productivity gains are passed on to consumers) and/or mitigate the costs in terms of impacts on jobs (e.g. a national retraining programme for older workers as well as renewed efforts to build STEAM 2 skills in schools and universities). Introduction Societies have worried about technological unemployment ever since the Industrial Revolution of the late 18th century. These concerns have generally not been borne out by historical experience as new technologies have stimulated economic growth, creating new demand for labour to replace jobs displaced in the short term. However, the latest advances in Artificial Intelligence (AI) 3 and related technologies such as robotics have the potential to surpass human capabilities in a broader range of cognitive skills, replacing our minds as well as our muscles. So could this time be different? In this article we take an objective look at the evidence on this for the UK and weigh up the potential for AI to replace human workers, which we refer to as the displacement effect, against the ability for AI to create additional jobs, through a mechanism we refer to as the income effect. We begin by setting out the background to, and conceptual framework for, the analysis (Section 4.1). Next, we present our estimates of the displacement effect (Section 4.2) and the income effect (Section 4.3). In Section 4.4 we weigh these effects against each other, both for the UK economy as a whole and by industry, and in Section 4.5 we present some illustrative estimates of potential regional job impacts based on differences in industry structure across regions. Section 4.6 then explores the uncertainties around our central estimates by constructing alternative optimistic and pessimistic scenarios. In Section 4.7 we discuss potential policy implications and Section 4.8 summarises the analysis and concludes. Further details of our methodology are provided in a technical annex. 1 This article was written by John Hawksworth and Yuval Fertig of the PwC economics practice, drawing on earlier data analysis by Tom Markovitch and Richard Berriman. 2 STEAM = science, technology, engineering, art & design, and maths. 3 For brevity we sometimes refer just to AI in this article, but this should be taken to encompass a broader range of technologies including not just AI per se but also robotics, drones, driverless vehicles and other digital innovations aimed at smart automation. 36

37
38 4.2 The displacement effect In their much-cited paper on the susceptibility of jobs to computerisation, Frey and Osborne (2013) considered a list of 702 occupations and used a mixture of expert judgement and machine learning techniques to estimate the probability that each would be automated 6. Many analysts, including PwC, have since adopted some variant of this bottom-up approach, but estimates of the proportion of jobs at significant long-term risk of automation vary widely. Frey and Osborne s original estimate for the US was 47%, or around 35% for the UK, but more recently Arntz, Gregory and Zierahn (2016) came up with a much lower estimate of around 10% for both countries based on analysing tasks rather than occupations. Our own past estimates using the same OECD PIAAC survey data suggest that the proportion of existing UK jobs at high risk of automation could be up to 30% over the next 20 years, which places us within the range of the estimates mentioned above (see annex for more details of our methodology) 7. Although we estimate that up to 30% of existing UK jobs could be at high risk of being automated, a job being at high risk of being automated does not mean that it will definitely be automated, as there could be a range of economic, legal and regulatory and organisational barriers to the adoption of these new technologies 8. Figure 4.2 The proportion of existing UK jobs that could be displaced in each sector over the next 20 years Transportation and storage Manufacturing Wholesale and retail trade Financial and insurance activities Administrative and support service activities Public administration and defence All sectors Information and communication Professional, scientific and technical activities Accommodation and food service activities Construction Other sectors Human health and social work activities Education Estimated actual job displacement Sources: PwC analysis using data from the OECD PIAAC survey % Jobs at potential risk of displacement 6 Frey, C.B. and M.A. Osborne (2013), The Future of Employment: How Susceptible are Jobs to Computerisation?, University of Oxford. 7 This is based on a detailed analysis of the task composition of UK jobs using the OECD s PIAAC database. 8 As discussed in more detail in our February 2018 report on job automation here: 38
39 Based on our earlier probabilistic risk analysis, we think it is reasonable to scale down our estimates by a factor of two thirds to reflect these barriers, so our central estimate of the proportion of existing jobs that will actually be automated over the next 20 years is reduced to 20%. There is uncertainty over the correct scaling factor to use here, however, so we consider a range of alternative scenarios for this estimate in Section 4.6 below. Automation rates will vary by industry sector as illustrated by our estimates in Figure 4.2. Our analysis implies that the transportation and storage sector could see the highest proportion of existing jobs at risk (nearly 40% even after scaling down as described in the previous paragraph) as driverless vehicles roll out across the economy over the next two decades. Sectors like health and education are projected to see relative low displacement effects, but no sector will be unaffected by automation. These figures represent the total proportion of existing UK jobs (based on 2017 data) estimated to be automated by 2037, but we would expect some sectors to be hit earlier than others, due to the fact that certain types of AI will develop faster than others (e.g. algorithmic trading is already here while driverless cars will take much longer to roll out) 9. We presented estimates of the timing of potential job losses in an earlier report, which we would expect to follow a typical S-curve shape with relatively small impacts over the next few years but more substantial effects as we look a decade or more ahead 10. In this article, however, we are concerned with the long term effects of AI, so we focus on the impact over 20 years, giving time for both the displacement and income effects to take effect fairly fully across the economy. We should recognise, however, that the precise timing of these effects is uncertain, as reflected in the scenario analysis in Section 4.6 below. 4.3 The income effect AI creates jobs through its effect on the cost, quality and range of products, which boosts real income levels and creates additional demand for new jobs, as described above. In PwC s 2017 Sizing the Prize report we evaluated thousands of potential use cases for AI across all sectors of the economy and combined these in a global econometric model to value the total impact of AI on GDP for the world economy as a whole as well as major individual economies including the US, China and the UK. For the UK, the headline estimate was that GDP could be boosted by around 10% by through application of AI and related technologies (the global average boost to GDP was higher at around 14%, due in particular to very high potential benefits from AI in China). For this article we have converted this value into jobs numbers by, first, projecting UK output (GVA) growth by industry sector over the next 20 years, and second, estimating the proportion of GVA growth that is attributable to AI, as implied by the estimates in our Sizing the prize report. We assume here that the projected increase in jobs due to the income effect will be the same as the projected increase in GVA since productivity gains are already accounted for through the displacement effect 12. We explain these steps in more detail in the annex. 9 For example, our previous analysis finds that the financial sector will see the most job losses for its size by 2030, but will be exceeded by the transport, manufacturing and retail sectors by PwC, Will robots really steal our jobs? (2018): uk/economic-services/assets/international-impact-of-automation-feb-2018.pdf 11 For the present report, we extrapolate this estimate forward from 2030 to Because we are capturing productivity effects on labour input through the displacement effect, we assume in estimating income effects that the potential percentage increase in jobs from this source is the same as the estimated percentage increase in GVA attributable to AI. This is the same general approach as in the Oxford Economics/Cisco report on The AI Paradox (December 2017) for the US, although they further assume that the income effect on jobs exactly offsets the negative displacement effect, which is a relatively restrictive assumption to make a priori. UK Economic Outlook July
40 The headline result of our analysis is that we expect 46% of long-term UK output growth will come from AI (although this may be higher or lower depending on the sector). Since we are expecting overall UK GDP (and GVA) growth of just under 2% per year on average over the next two decades, this implies that AI contributes around 0.9% growth per annum on average. Over 20 years this serves to increase the number of jobs by around 20% of current levels (after allowing for compounding effects over time). The sectoral breakdown of our income effect estimates is presented in Figure 4.3. The analysis suggests that there are two notable outliers at both ends of the spectrum: the health sector and the professional, scientific and technical services sector stand to benefit the most from AI in terms of the proportion of additional jobs created, whilst manufacturing and public administration and defence stand to benefit the least. Figure 4.3 Estimated additional UK jobs that could be created by AI and related technologies in each sector over the next 20 years, expressed as a percentage of existing jobs in 2017 Education Professional, scientific and technical activities Information and communication Wholesale and retail trade Administrative and support service activities Accommodation and food service activities All sectors Financial and insurance activities Transportation and storage Other sectors Construction Education Manufacturing Public administration and defence In general, the sectors benefiting most are those that combine strong underlying demand growth with a relatively high propensity to see benefits from application of AI and related technologies, based on the detailed use case analysis in our Sizing the Prize report. Sources: PwC analysis % 40
41
42 Whilst our central estimate suggests that the overall net effect of AI on UK jobs may be broadly neutral, this is not true for individual sectors. The most positive effect is seen in the health and social work sector, where we expect the number of jobs to increase by nearly 1 million, equivalent to around 20% of existing jobs in this sector. On the other hand, we estimate that the number of jobs in the manufacturing sector could be reduced by around 25% due to AI and related technologies, representing a net loss of nearly 700,000 jobs. Further details of our sectoral results are set out in Table 4.1. Table 4.1: Estimated job displacement and creation from AI by industry sector ( ) Industry sector Health and social work Professional, scientific and technical Information and communication % of existing jobs (in 2017) Number of jobs (000s) Creation Displacement Net effect Creation Displacement Net effect 34% -12% 22% 1, % -18% 16% 1, % -18% 8% Education 12% -5% 6% Accommodation and food services 22% -16% 6% Administrative and support services 23% -24% -1% Other sectors 13% -15% -2% Wholesale and retail trade 26% -28% -3% 1,276-1, Construction 12% -15% -3% Financial and insurance activities Public administration and defence Transportation and storage 18% -25% -7% % -23% -18% % -38% -22% Manufacturing 5% -30% -25% Total 20% -20% 0% 7,176-7, Source: PwC analysis 42
43
44 The sectors that are more likely to see net job losses from AI/automation are those involving a high degree of repetitive and routine tasks Transportation and storage We estimate that automation could displace almost 40% of existing jobs in this sector by 2037 as driverless vehicles roll out across the economy and warehouses become increasingly automated, but might only create less than half this number of additional jobs through income effects. Manufacturing We estimate that there could be around 25% fewer jobs in the manufacturing sector by 2037 as a result of automation, continuing a long-established trend of recent decades. Many of these jobs may be displaced in early waves of AI as routine factory tasks continue to be replaced by algorithms and robots, over and above what has already happened. Public administration and defence Clerical tasks in the public sector are also liable to be replaced by algorithms as public finances remain under strain with an ageing population, leading to a continuing focus on efficiency gains through automation of routine tasks. There may be further use of drones, AI systems and related technologies in defence, although there will also be new job creation here for technology experts (e.g. in cybersecurity). 4.5 Regional differences in AI job impacts Our analysis reveals that the costs and benefits of AI are unevenly distributed across industry sectors. Since the industry mix of employment varies across different parts of the UK, this has implications for the regional impact of AI/automation on jobs. Table 4.2 shows the results of applying our analysis at a regional level (assuming that the only difference is due to the varying industrial structure of employment across regions). Table 4.2: Estimated regional jobs impact of AI based only on variations in industry mix Region % of existing jobs (in 2017) Number of jobs (000s) Creation Displacement Net effect Creation Displacement Net effect London 22.0% -19.7% 2.3% 1,297 1, South East 20.6% -19.7% 0.8% 1, Wales 19.7% -18.9% 0.7% Scotland 20.2% -19.6% 0.5% South West 19.9% -19.5% 0.4% North East 20.0% -19.8% 0.2% East of England 20.4% -20.3% 0.1% North West 20.4% -20.4% 0.0% West Midlands 20.1% -20.4% -0.3% Northern Ireland 19.4% -19.8% -0.4% Yorkshire and the Humber According to this analysis, the net effect of AI on jobs may not vary that much across the UK. London has the most positive estimated impact (+2%), which benefits from being home to 28% of the UK s professional, scientific and technical activities, as well as 31% of the UK s information and communication sector. In contrast, regions in the North and Midlands, with higher weightings towards relatively automatable industrial jobs, have marginally negative estimated net impacts, but always by only around 1% or less of existing job numbers. 20.0% -20.4% -0.4% East Midlands 19.5% -20.7% -1.1% Total 20% -20% 0% 7,176-7, Source: PwC analysis 44
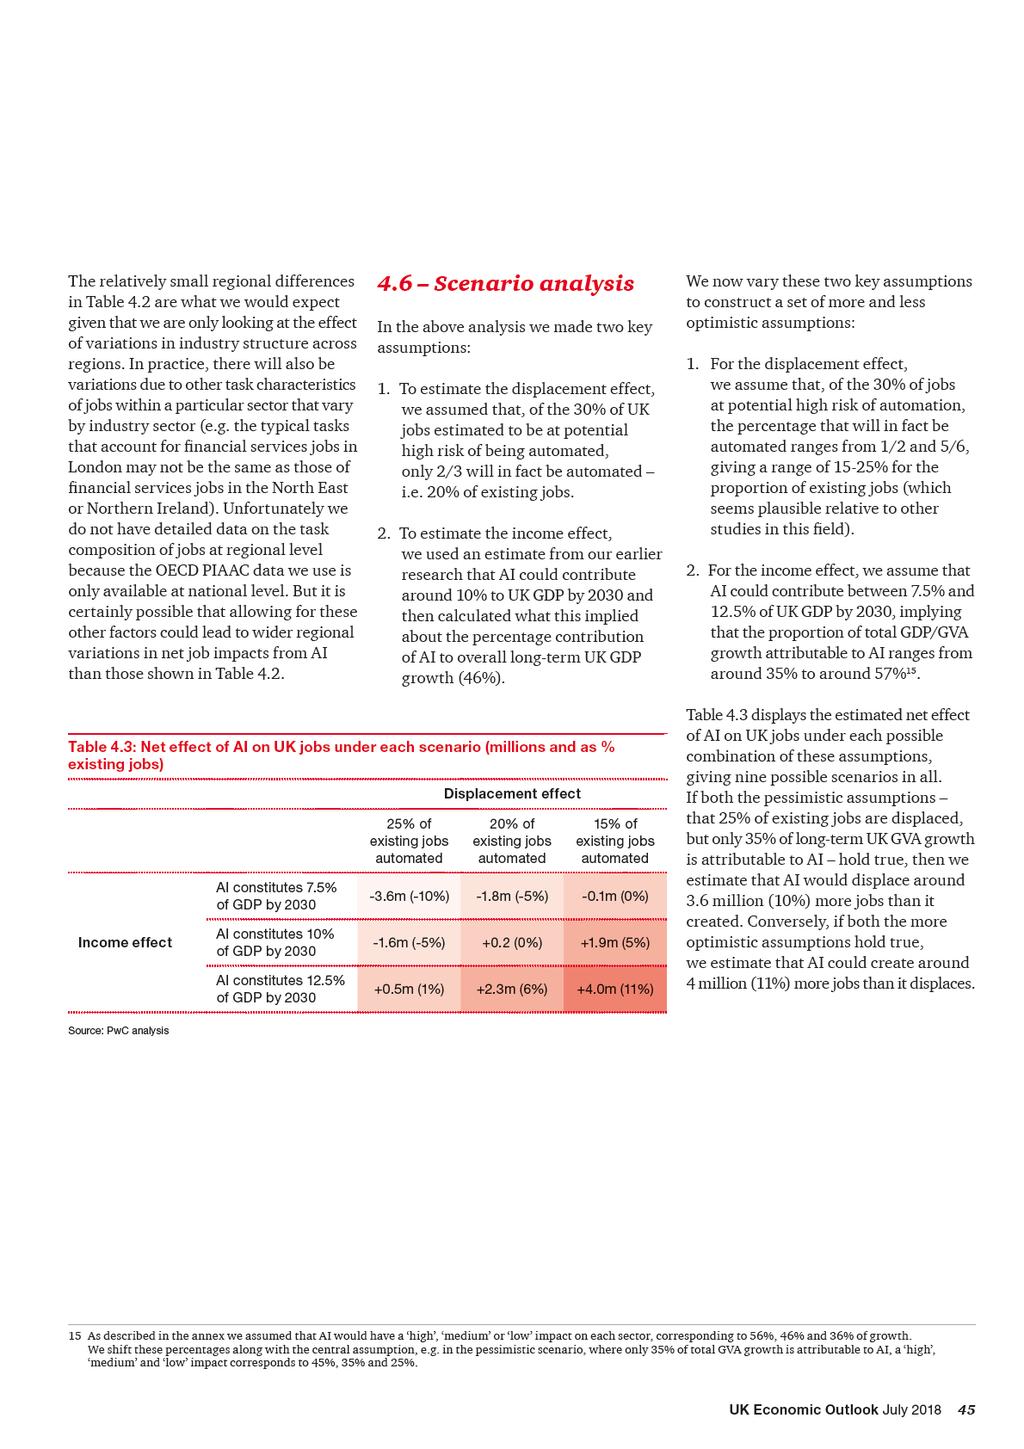
45
Highlights and key messages for business and public policy
 Highlights and key messages for business and public policy Key projections 2018 2019 Real GDP growth 1.5% 1.6% Consumer spending growth 1.1% 1.3% Inflation (CPI) 2.7% 2.3% Source: PwC main scenario projections
Figure 2.3 Purchasing Managers Indices of business activity. Figure 2.4 US dollar and euro exchange rates against the pound.
 Prior to 20, consumer spending was a key driver of GDP growth, but this was achieved in part by running up ever higher debts. We explore this further in our latest Precious Plastic report 2, which highlighted
Highlights and key messages for business and public policy
 Highlights and key messages for business and public policy Key projections 2017 2018 Real GDP growth 1.5% 1.4% Consumer spending growth 1.6% 1.1% Inflation (CPI) 2.7% 2.7% Source: PwC main scenario projections
Highlights and key messages for business and public policy
 Highlights and key messages for business and public policy Key projections 2019 2020 Real GDP growth 1.1% 1.6% Consumer spending growth 1.4% 1.7% Fixed investment growth -1.0% 2.1% Inflation (CPI) 1.8%
UK Economic Outlook July 2018
 www.pwc.co.uk/economics UK Economic Outlook July 2018 Contents 1 2 3 4 Global outlook UK economic prospects UK housing market outlook Impact of AI and related technologies on jobs in the UK UK Economic
Highlights and key messages for business and public policy
 Highlights and key messages for business and public policy Key projections 2018 2019 Real GDP growth 1.5% 1.6% Consumer spending growth 1.1% 1.3% Inflation (CPI) 2.7% 2.3% Source: PwC main scenario projections
UK Economic Outlook March 2017
 www.pwc.co.uk/economics Contents 1 2 3 4 Global outlook UK economic trends and prospects Consumer spending prospects after Brexit Will robots steal our jobs? 2 Global growth in 2017 should be slightly
UK Economic Outlook July 2017
 www.pwc.co.uk/economics Contents 1 2 3 4 Global outlook UK economic trends and prospects UK housing market outlook Nowcasting current GDP growth PwC 2 Global growth in 2017 should be slightly stronger
November UK Economic Outlook. How robust is the UK consumer recovery? Getting the balance right in the UK regions.
 November 2014 UK Economic Outlook How robust is the UK consumer recovery? Getting the balance right in the UK regions www.pwc.co.uk/economics Contents Highlights and key messages 3 1. Summary 4 2. UK economic
UK Economic Outlook. March The impact of lower oil prices on the UK economy
 March 2015 UK Economic Outlook The impact of lower oil prices on the UK economy New job creation in the UK: which regions will benefit most from the digital revolution? www.pwc.co.uk/economics Contents
UK Economic Outlook July 2013
 www.pwc.co.uk UK Economic Outlook July 213 Feature articles: Is the UK housing market on the road to recovery? The trillion pound question are gilts the next bubble to burst? PwC firms help organisations
Highlights and key messages for business and public policy
 Highlights and key messages for business and public policy Key projections 2018 2019 Real GDP growth 1.3% 1.6% Consumer spending growth 1.7% 1.5% Fixed investment growth -0.5% 0.8% Inflation (CPI) 2.5%
July UK Economic Outlook. UK house prices bubble or no bubble? The UK s standing in the world.
 July 2014 UK Economic Outlook UK house prices bubble or no bubble? The UK s standing in the world www.pwc.co.uk/economics Contents Highlights and key messages 03 1 Summary 04 2 UK economic prospects 07
Highlights and key messages for business and public policy
 Highlights and key messages for business and public policy Key projections 2017 2018 Real GDP growth 1.5% 1.4% Consumer spending growth 1.6% 1.1% Inflation (CPI) 2.7% 2.7% Source: PwC main scenario projections
Northern Ireland Quarterly Sectoral Forecasts
 2017 Quarter 1 Northern Ireland Quarterly Sectoral Forecasts Forecast summary The Northern Ireland economy enjoyed a solid performance in 2016 with overall growth of 1.5%, the strongest rate of growth
BCC UK Economic Forecast Q4 2015
 BCC UK Economic Forecast Q4 2015 David Kern, Chief Economist at the BCC The main purpose of the BCC Economic Forecast is to articulate a BCC view on economic topics that are relevant to our members, and
Economic ProjEctions for
 Economic Projections for 2016-2018 ECONOMIC PROJECTIONS FOR 2016-2018 Outlook for the Maltese economy 1 Economic growth is expected to ease Following three years of strong expansion, the Bank s latest
MINUTES OF THE MONETARY POLICY COMMITTEE MEETING 4 AND 5 NOVEMBER 2009
 Publication date: 18 November 2009 MINUTES OF THE MONETARY POLICY COMMITTEE MEETING 4 AND 5 NOVEMBER 2009 These are the minutes of the Monetary Policy Committee meeting held on 4 and 5 November 2009. They
3. The outlook for consumer spending and online retail 1
 3. The outlook for consumer spending and online retail 1 Key points Consumer spending growth is estimated to have slowed for a second consecutive year in 2018, but is still expected to have grown at an
4 Regional growth trends and prospects 1
 4 Regional growth trends and prospects 1 Key points has consistently outperformed other UK regions for most of the past two decades in terms of economic growth, both before and after the global financial
Svein Gjedrem: The outlook for the Norwegian economy
 Svein Gjedrem: The outlook for the Norwegian economy Address by Mr Svein Gjedrem, Governor of Norges Bank (Central Bank of Norway), at the Bergen Chamber of Commerce and Industry, Bergen, 11 April 2007.
LETTER. economic. The price of oil and prices at the pump: why the difference? NOVEMBER bdc.ca
 economic LETTER NOVEMBER 211 The price of oil and prices at the pump: why the difference? Since the end of April the price of crude oil based on the West Texas Intermediate (WTI) benchmark has dropped
Eurozone. EY Eurozone Forecast September 2014
 Eurozone EY Eurozone Forecast September 2014 Austria Belgium Cyprus Estonia Finland France Germany Greece Ireland Italy Latvia Luxembourg Malta Netherlands Portugal Slovakia Slovenia Spain Outlook for
Legal services sector forecasts
 www.lawsociety.org.uk Legal services sector forecasts 2017-2025 August 2018 Legal services sector forecasts 2017-2025 2 The Law Society of England and Wales August 2018 CONTENTS SUMMARY OF FORECASTS 4
International Monetary and Financial Committee
 International Monetary and Financial Committee Thirty-Third Meeting April 16, 2016 IMFC Statement by Angel Gurría Secretary-General The Organisation for Economic Co-operation and Development (OECD) IMF
Monetary Policy Summary and minutes of the Monetary Policy Committee meeting ending on 10 May 2017
 Monetary Policy Summary and minutes of the Monetary Policy Committee meeting ending on 10 May 2017 Publication date: 11 May 2017 These are the minutes of the Monetary Policy Committee meeting ending on
Svein Gjedrem: Interest rates, the exchange rate and the outlook for the Norwegian economy
 Svein Gjedrem: Interest rates, the exchange rate and the outlook for the Norwegian economy Speech by Mr Svein Gjedrem, Governor of Norges Bank (Central Bank of Norway), to the Mid-Norway Chamber of Commerce
Eurozone Economic Watch. July 2018
 Eurozone Economic Watch July 2018 Eurozone: A shift to more moderate growth with increased downward risks BBVA Research - Eurozone Economic Watch July 2018 / 2 Hard data improved in May but failed to recover
Economic Projections For 2014 And 2015
 Economic Projections For 2014 And 2015 Article published in the Quarterly Review 2014:3, pp. 77-81 7. ECONOMIC PROJECTIONS FOR 2014 AND 2015 Outlook for the Maltese economy 1 The Bank s latest macroeconomic
Asda Income Tracker. Report: December 2015 Released: January Centre for Economics and Business Research ltd
 Asda Income Tracker Report: December 2015 Released: January 2016 M a k i n g B u s i n e s s S e n s e Centre for Economics and Business Research ltd Unit 1, 4 Bath Street, London EC1V 9DX t 020 7324 2850
Monetary Policy Summary and minutes of the Monetary Policy Committee meeting ending on 13 December 2017
 Monetary Policy Summary and minutes of the Monetary Policy Committee meeting ending on 13 December 2017 Publication date: 14 December 2017 These are the minutes of the Monetary Policy Committee meeting
Global PMI. Global economy buoyed by rising US strength. June 12 th IHS Markit. All Rights Reserved.
 Global PMI Global economy buoyed by rising US strength June 12 th 2018 2 Global PMI rises but also brings signs of slower future growth At 54.0 in May, the headline JPMorgan Global Composite PMI, compiled
Finland falling further behind euro area growth
 BANK OF FINLAND FORECAST Finland falling further behind euro area growth 30 JUN 2015 2:00 PM BANK OF FINLAND BULLETIN 3/2015 ECONOMIC OUTLOOK Economic growth in Finland has been slow for a prolonged period,
FSB VOICE OF SMALL BUSINESS fsb.org.uk
 Q4 FSB VOICE OF SMALL BUSINESS INDEX QUARTER 4, 2016 @fsb_policy fsb.org.uk SBI Q4 2016 Small business confidence rebounded in the last quarter, but cost pressures are at their highest since early 2014
3 The outlook for consumer spending and the impact of automation 1
 3 The outlook for consumer spending and the impact of automation 1 Key points Consumer spending slowed during 2017, but has nonetheless grown by an average of 2.3 percentage points per annum faster than
Business in Britain. A survey of opinions and trends 48th edition September For your next step
 Business in Britain A survey of opinions and trends 48th edition September 16 For your next step BUSINESS IN BRITAIN REPORT OUR CONTRIBUTORS CONTENTS 3 4 Hann-Ju Ho Senior Economist Economic Research Lloyds
Economic projections
 Economic projections 2017-2020 December 2017 Outlook for the Maltese economy Economic projections 2017-2020 The pace of economic activity in Malta has picked up in 2017. The Central Bank s latest economic
FSB VOICE OF SMALL BUSINESS fsb.org.uk
 Q1 FSB VOICE OF SMALL BUSINESS INDEX QUARTER 1, 2017 @fsb_policy fsb.org.uk Q1 2017 FSB Small Business Index 2 SBI Q1 2017 fsb.org.uk Small business confidence at highest in over a year, but firms are
Economic Projections for
 Economic Projections for 2015-2017 Article published in the Quarterly Review 2015:3, pp. 86-91 7. ECONOMIC PROJECTIONS FOR 2015-2017 Outlook for the Maltese economy 1 The Bank s latest macroeconomic projections
Monetary Policy Summary and minutes of the Monetary Policy Committee meeting ending on 15 March 2017
 Monetary Policy Summary and minutes of the Monetary Policy Committee meeting ending on 15 March 2017 Publication date: 16 March 2017 These are the minutes of the Monetary Policy Committee meeting ending
NIESR MONTHLY GDP TRACKER: July 2018
 Press Release NIESR MONTHLY GDP TRACKER: July 2018 GDP Tracker indicates growth of 0.4 per cent in 2018 Q2 and 0.5 per cent in 2018 Q3 Figure 1: UK GDP growth (3 months on previous 3 months, per cent)
LIFTING THE LID ON PANDORA S BOX A CHANGE OF PACE FOR BRITISH CONSTRUCTION
 LIFTING THE LID ON PANDORA S BOX A CHANGE OF PACE FOR BRITISH CONSTRUCTION EXECUTIVE SUMMARY The UK economy continues to perform robustly though significant threats remain. Potential risk of a slowdown
Monetary Policy Summary and minutes of the Monetary Policy Committee meeting ending on 21 March 2018
 Monetary Policy Summary and minutes of the Monetary Policy Committee meeting ending on 21 March 2018 Publication date: 22 March 2018 These are the minutes of the Monetary Policy Committee meeting ending
Eurozone. Economic Watch FEBRUARY 2017
 Eurozone Economic Watch FEBRUARY 2017 EUROZONE WATCH FEBRUARY 2017 Eurozone: A slight upward revision to our GDP growth projections The recovery proceeded at a steady and solid pace in, resulting in an
EUROPEAN COMMISSION DIRECTORATE-GENERAL FOR ECONOMIC AND FINANCIAL AFFAIRS. September 2006 Interim forecast
 EUROPEAN COMMISSION DIRECTORATE-GENERAL FOR ECONOMIC AND FINANCIAL AFFAIRS September 26 Interim forecast Press conference of 6 September 26 European economic growth speeding up, boosted by buoyant domestic
Growth to accelerate. A quarterly analysis of trends in the Irish economy
 Produced by the Economic Research Unit July 2014 A quarterly analysis of trends in the Irish economy Growth to accelerate Strong start to 2014 Recovery becoming more broad-based GDP growth revised up for
Economic Projections :2
 Economic Projections 2018-2020 2018:2 Outlook for the Maltese economy Economic projections 2018-2020 The Central Bank s latest economic projections foresee economic growth over the coming three years to
Asda Income Tracker. Report: September 2015 Released: October Centre for Economics and Business Research ltd
 Asda Income Tracker Report: September 2015 Released: October 2015 M a k i n g B u s i n e s s S e n s e Centre for Economics and Business Research ltd Unit 1, 4 Bath Street, London EC1V 9DX t 020 7324
Global PMI. Solid Q2 growth masks widening growth differentials. July 7 th IHS Markit. All Rights Reserved.
 Global PMI Solid Q2 growth masks widening growth differentials July 7 th 2017 2 Widening developed and emerging world growth trends The global economy enjoyed further steady growth in June, according to
The UK economic and fiscal outlook
 The UK economic and fiscal outlook Report for StepChange Debt Charity Centre for Economics and Business Research ltd Contents Executive summary 3 Global economic outlook 4 UK economic outlook 8 UK regional
UK BUSINESS CONFIDENCE MONITOR Q3 2013
 UK BUSINESS CONFIDENCE MONITOR 213 BUSINESS WITH CONFIDENCE WELCOME Businesses are feeling at their most confident since Q2 21, with that confidence yet again registering across all sectors and all regions.
UK Business Confidence Monitor Q4 2016
 UK Business Confidence Monitor 2016 BUSINESS WITH CONFIDENCE icaew.com/bcm 2016 Overall confidence -9.8 Export sales growth Input price growth remains negative to outpace domestic sales rising faster than
EUROPEAN EXPORT INDEX Q4 2017
 EUROPEAN EXPORT INDEX Q4 2017 BDO EXPORT INDEX KEY FIGURES The BDO Export Indices are composite indicators which provide snapshots of the export markets in Europe s five largest economies Germany, UK,
DEVELOPMENTS IN THE COST COMPETITIVENESS OF THE EUROPEAN UNION, THE UNITED STATES AND JAPAN MAIN FEATURES
 DEVELOPMENTS IN THE COST COMPETITIVENESS OF THE EUROPEAN UNION, THE UNITED STATES AND JAPAN MAIN FEATURES The euro against major international currencies: During the second quarter of 2000, the US dollar,
Ireland. Eurozone rebalancing. EY Eurozone Forecast June Portugal Slovakia Slovenia Spain. Latvia Lithuania Luxembourg Malta Netherlands
 EY Forecast June 2015 rebalancing recovery Outlook for Rising domestic demand improves prospects for 2015 Published in collaboration with Highlights The Irish economy grew by 4.8% last year, which was
BANK OF FINLAND ARTICLES ON THE ECONOMY
 BANK OF FINLAND ARTICLES ON THE ECONOMY Table of Contents Global economy to grow steadily 3 FORECAST FOR THE GLOBAL ECONOMY Global economy to grow steadily TODAY 1:00 PM BANK OF FINLAND BULLETIN 1/2017
INFLATION REPORT PRESS CONFERENCE. Thursday 10 th May Opening Remarks by the Governor
 INFLATION REPORT PRESS CONFERENCE Thursday 10 th May 2018 Opening Remarks by the Governor Three months ago, the MPC said that an ongoing tightening of monetary policy over the next few years would be appropriate
The reasons why inflation has moved away from the target and the outlook for inflation.
 BANK OF ENGLAND Mark Carney Governor The Rt Hon George Osborne Chancellor of the Exchequer HM Treasury 1 Horse Guards Road London SW1A2HQ 12 May 2016 On 12 April, the Office for National Statistics (ONS)
Global Travel Service
 15 Nov 2018 Global Travel Service Global Highlights, November 2018 Economists Adam Sacks President of Tourism Economics asacks@oxfordeconomics. com David Goodger Director of Tourism Economics dgoodger@oxfordeconomi
Economic Projections :1
 Economic Projections 2017-2020 2018:1 Outlook for the Maltese economy Economic projections 2017-2020 The Central Bank s latest economic projections foresee economic growth over the coming three years to
Incomes and inequality: the last decade and the next parliament
 Incomes and inequality: the last decade and the next parliament IFS Briefing Note BN202 Andrew Hood and Tom Waters Incomes and inequality: the last decade and the next parliament Andrew Hood and Tom Waters
UK Outlook. Economy in holding pattern amid Brexit uncertainty. July Economic Research Unit
 UK Outlook July Economy in holding pattern amid Brexit uncertainty While it has been a game of two halves for the UK economy over the first six months of - poor weather dampening activity in the first
Northern Ireland Quarterly Sectoral Forecasts
 Economic Analysis Northern Ireland Quarterly Sectoral Forecasts 2018 Quarter 1 Northern Ireland Quarterly Sectoral Forecasts Forecast summary For the Northern Ireland economy, the first part of 2018 has
Economic activity gathers pace
 Produced by the Economic Research Unit October 2014 A quarterly analysis of trends in the Irish economy Economic activity gathers pace Positive data flow Recovery broadening out GDP growth revised up to
Outlook for Economic Activity and Prices
 Not to be released until : p.m. Japan Standard Time on Saturday, October 31, 15. October 31, 15 Bank of Japan Outlook for Economic Activity and Prices October 15 (English translation prepared by the Bank's
Global Macroeconomic Monthly Review
 Global Macroeconomic Monthly Review August 14 th, 2018 Arie Tal, Research Economist Capital Markets Division, Economics Department 1 Please see disclaimer on the last page of this report Key Issues Global
The ECB Survey of Professional Forecasters. Fourth quarter of 2016
 The ECB Survey of Professional Forecasters Fourth quarter of 16 October 16 Contents 1 Inflation expectations for 16-18 broadly unchanged 3 2 Longer-term inflation expectations unchanged at 1.8% 4 3 Real
Ulster Bank Northern Ireland PMI
 Embargoed until 0101 UK (0001 UTC) 13 August 2018 Ulster Bank Northern Ireland PMI Fastest rise in output since January Key Findings Sharper increases in both output and new orders Slowest rise in employment
LESS DYNAMIC GROWTH AMID HIGH UNCERTAINTY
 OVERVIEW: The European economy has moved into lower gear amid still robust domestic fundamentals. GDP growth is set to continue at a slower pace. LESS DYNAMIC GROWTH AMID HIGH UNCERTAINTY Interrelated
Monetary Policy Summary and minutes of the Monetary Policy Committee meeting ending on 9 May 2018
 Monetary Policy Summary and minutes of the Monetary Policy Committee meeting ending on 9 May 2018 Publication date: 10 May 2018 These are the minutes of the Monetary Policy Committee meeting ending on
Construction Industry Focus Survey. Volume 27 Issue 2 November 2017
 Construction Industry Focus Survey Volume 27 Issue 2 1 CONTENTS Executive Summary 1 1. Leading Activity Indicator 1 2. Activity by sector and constraints Residential, Nonresidential, Civil Engineering
DECEMBER 2017 BREXIT: BDO S MONTHLY ECONOMIC UPDATE
 DECEMBER 2017 BREXIT: BDO S MONTHLY ECONOMIC UPDATE Welcome to the 18th edition of BDO s monthly economic outlook a temperature check of how UK businesses are feeling in the post-referendum world. Our
Outlook for Economic Activity and Prices (April 2010)
") April 30, 2010 Bank of Japan Outlook for Economic Activity and Prices (April 2010) The Bank's View 1 The global economy has emerged from the sharp deterioration triggered by the financial crisis and has
April 30, 2010 Bank of Japan Outlook for Economic Activity and Prices (April 2010) The Bank's View 1 The global economy has emerged from the sharp deterioration triggered by the financial crisis and has
Asda Income Tracker. Report: June 2012 Released: July Centre for Economics and Business Research ltd
 Asda Income Tracker Report: June 2012 Released: July 2012 M a k i n g B u s i n e s s S e n s e Centre for Economics and Business Research ltd Unit 1, 4 Bath Street, London EC1V 9DX t 020 7324 2850 w www.cebr.com
The Outlook for the UK Consumer Sector A Note. Gavyn Davies. 9 May Overview
 The Outlook for the UK Consumer Sector A Note Gavyn Davies 9 May 2018 Overview Consumers expenditure accounts for 66 per cent of GDP in the UK. There is therefore a huge variety of investment opportunities
Consumer Debt and Money Report Q making business sense
 Consumer Debt and Money Report Q3 2012 3 making business sense Executive summary & commentary The StepChange Debt Charity Consumer Debt and Money Report Q3 2012 expands on previous reports to build a nuanced
Counting the cost BRIEFING. UK living standards since the 2016 referendum. James Smith February 2019
 BRIEFING UK living standards since the 2016 referendum James Smith February 2019 info@resolutionfoundation.org +44 (0)203 372 2960 @resfoundation resolutionfoundation.org Resolution Foundation 2 Later
Irish Economic Update AIB Treasury Economic Research Unit
 Irish Economic Update AIB Treasury Economic Research Unit 9th October 2018 Budget 2019 Public Finances in Balance The Irish economy has performed strongly in recent years, boosting tax revenues. Corporation
APPENDIX: Country analyses
 APPENDIX: Country analyses Appendix A Germany: Low economic momentum The economic situation in Germany continues to be lackluster in 2014. Strong growth in the first quarter was followed by a decline
MINUTES OF THE MONETARY POLICY COMMITTEE MEETING 7 AND 8 OCTOBER 2009
 Publication date: 21 October 2009 MINUTES OF THE MONETARY POLICY COMMITTEE MEETING 7 AND 8 OCTOBER 2009 These are the minutes of the Monetary Policy Committee meeting held on 7 and 8 October 2009. They
WTO lowers forecast after sub-par trade growth in first half of 2014
 PRESS RELEASE PRESS/722 26 September 214 (-) WTO lowers forecast after sub-par trade growth in first half of 214 TRADE STATISTICS WTO economists have reduced their forecast for world trade growth in 214
Regional Forecast and Analysis Greater London (example) Sample from June 2015 forecast
 Sample from June 2015 forecast") Regional Forecast and Analysis Greater London (example) from June 2015 forecast Greater South London East Economic Outlook CONTENTS 1. Executive Summary 2. UK Economy Prospects & key risks Recent trends
Regional Forecast and Analysis Greater London (example) from June 2015 forecast Greater South London East Economic Outlook CONTENTS 1. Executive Summary 2. UK Economy Prospects & key risks Recent trends
South African Reserve Bank STATEMENT OF THE MONETARY POLICY COMMITTEE. Issued by Lesetja Kganyago, Governor of the South African Reserve Bank
 South African Reserve Bank PRESS STATEMENT EMBARGO DELIVERY 20 November 2014 STATEMENT OF THE MONETARY POLICY COMMITTEE Issued by Lesetja Kganyago, Governor of the South African Reserve Bank Since the
remain the same until the end of 2018.
 We predict that the European interest rate will remain the same until the end of 2018. Throughout the past three years the interest rate has remained low. In 2017 and 2016 it has been 0.00% and in 2015
Eurozone. EY Eurozone Forecast March 2015
 Eurozone EY Eurozone Forecast March 2015 Austria Belgium Cyprus Estonia Finland France Germany Greece Ireland Italy Latvia Lithuania Luxembourg Malta Netherlands Slovakia Slovenia Spain Outlook for Modest
Interest Rate Forecast
 Interest Rate Forecast Economics January Highlights Global growth firms Waiting for Trumponomics Bank of Canada on hold Recent growth momentum in the global economy continued in December and looks to extend
Economic Projections :3
 Economic Projections 2018-2020 2018:3 Outlook for the Maltese economy Economic projections 2018-2020 The Central Bank s latest projections foresee economic growth over the coming three years to remain
ECONOMIC RECOVERY AT CRUISE SPEED
 EBF Economic Outlook Nr 43 May 2018 2018 SPRING OUTLOOK ON THE EURO AREA ECONOMIES IN 2018-2019 ECONOMIC RECOVERY AT CRUISE SPEED EDITORIAL TEAM: Francisco Saravia (author), Helge Pedersen - Chair of the
Release Date : 26 June Economic update - May Key data highlights:
 Release Date : 26 June Economic update - Key data highlights:. The UK economy is growing at its slowest pace in more than five years, marked by weaker manufacturing and construction growth. Consumer-facing
Monetary Policy Summary and minutes of the Monetary Policy Committee meeting ending on 19 December 2018
 Monetary Policy Summary and minutes of the Monetary Policy Committee meeting ending on 19 December 2018 Publication date: 20 December 2018 These are the minutes of the Monetary Policy Committee meeting
Eurozone Economic Watch Higher growth forecasts for January 2018
 Eurozone Economic Watch Higher growth forecasts for 2018-19 January 2018 Eurozone Economic Watch January 2018 Eurozone: Higher growth forecasts for 2018-19 Our MICA-BBVA model estimates a broadly stable
Maneuvering Past Stagflation: Prospects for the U.S. Economy In
 Maneuvering Past Stagflation: Prospects for the U.S. Economy In 2007-2008 By Michael Mussa Senior Fellow The Peter G. Peterson Institute for International Economics Washington, DC Presented at the annual
NIESR Monthly GDP Tracker 10 September, NIESR MONTHLY GDP TRACKER: September UK economic growth gathers momentum. 0.7 NIESR forecast 0.
 Press Release NIESR MONTHLY GDP TRACKER: September 2018 UK economic growth gathers momentum Figure 1: UK GDP growth (3 months on previous 3 months, per cent) 0.7 NIESR forecast 0.6 0.4 0.3 0.2 0.1 0 2017
Monetary Policy Summary and minutes of the Monetary Policy Committee meeting ending on 12 September 2018
 Monetary Policy Summary and minutes of the Monetary Policy Committee meeting ending on 12 September 2018 Publication date: 13 September 2018 These are the minutes of the Monetary Policy Committee meeting
1 World Economy. Value of Finnish Forest Industry Exports Fell by Almost a Quarter in 2009
 1 World Economy The recovery in the world economy that began during 2009 has started to slow since spring 2010 as stocks are replenished and government stimulus packages are gradually brought to an end.
Monetary Policy Summary and minutes of the Monetary Policy Committee meeting ending on 20 March 2019
 Monetary Policy Summary and minutes of the Monetary Policy Committee meeting ending on 20 March 2019 Publication date: 21 March 2019 These are the minutes of the Monetary Policy Committee meeting ending
In this report we discuss three important areas of the economy that have received a great deal of attention recently, namely:
 March 26, 218 Executive Summary George Mokrzan, PH.D., Director of Economics In this report we discuss three important areas of the economy that have received a great deal of attention recently, namely:
Editor: Thomas Nilsson. The Week Ahead Key Events Jul, 2017
 Editor: Thomas Nilsson The Week Ahead Key Events 10 16 Jul, 2017 European Sovereign Rating Reviews Recent rating reviews Upcoming rating reviews Source: Bloomberg Monday 10, 08.00 NOR: CPI (Jun) SEB Cons.
UK BUSINESS CONFIDENCE MONITOR Q4 2013
 UK BUSINESS CONFIDENCE MONITOR 213 BUSINESS WITH CONFIDENCE WELCOME This quarter s ICAEW/Grant Thornton Business Confidence Monitor shows that business confidence has now risen for five consecutive quarters.
ECONOMY REPORT - CHINESE TAIPEI
 ECONOMY REPORT - CHINESE TAIPEI (Extracted from 2001 Economic Outlook) REAL GROSS DOMESTIC PRODUCT The Chinese Taipei economy grew strongly during the first three quarters of 2000, thanks largely to robust