2018 Economic Forum CALHOUN COUNTY CHAMBER OF COMMERCE AND VISITORS CENTER. School of Business and Industry. Information provided by
|
|
|
- Edwina Eaton
- 5 years ago
- Views:
Transcription


1 2018 Economic Forum CALHOUN COUNTY CHAMBER OF COMMERCE AND VISITORS CENTER Information provided by School of Business and Industry


2 THANK YOU to our SPONSORS

")
")
 2")
3 Calhoun County Economy Forum National Update (Slides 3-15) Alabama Update (Slides 16-53) Calhoun County Update (Slides ) 2
4 GDP % Change from Preceding Period for U.S. 4% 3.2% 3% 2% 1% 0% 1st Qtr th Qtr % 4 th Qtr % 1.6% 0.5% 0.6% 3.1% 2.8% 3.2% 2.6% 2.2% 1.8% 1.2% 15Q1 Q2 Q3 Q4 16Q1 Q2 Q3 Q4 17Q1 Q2 Q3 Q4 Source: U.S. Bureau of Economic Analysis Real Gross Domestic Product Seasonally adjusted at annual rates 3
5 U.S. Industrial Production Jan 2015 Dec Jan-15 Jul-15 Jan-16 Jul-16 Jan-17 Jul-17 Source: Board of Governors of Federal Reserve System +3.60% 12 Months 108 4
6 Payroll Emp in 1,000s Change in Total Nonfarm Payroll Employment for U.S. 500 Jan Jan 2018 in 1,000s Jan 18 Pre +200, Jan 14 Jan 15 Jan 16 Jan 17 Jan 18 Source: U.S. Bureau of Labor Statistics: Seasonally Adjusted 5
7 Dow Jones Industrial Average (DJIA) Feb 2016 Feb ,000 25,000 23,000 21,000 19,000 17,000 15, % 12 Months 26,617 23,837 24,191 20,941 19,864 21,830 17,685 19,124 18,401 F-16 A-16 F-17 A-17 F-18 Source: NY Stock Exchange 6
8 Consumer Price Index U.S. Jan 2015-Dec Jan-15 Jan-16 Jan-17 Source: U.S. Bureau of Labor Statistics +2.1% 12 Months
9 U.S. Consumer Sentiment Jan 2015 Jan Jan-15 Jul-15 Jan-16 Jul-16 Jan-17 Jul-17 Jan-18 Source: University of Michigan Institute of Social Research Last 12 Months -2.8% 8
10 In $Billions $510 $490 $470 $450 $430 $436 Monthly Sales for Retail & Food Services in U.S. Jan 2015-Dec 2017 in $ Bill $458 $450 $445 $453 $495 $477 $469 $494 $ % 12 Months $410 Jan-2015 Jan-2016 Jan-2017 Source: U.S. Census Bureau 9
11 Case Shiller 20-City Home Price Index Jan 2015-Dec % 12 Months Jan-15 Jul-15 Jan-16 Jul-16 Jan-17 Jul-17 Source: 10
12 In Millions Labor Force U.S in Millions Seasonally Adjusted Source: U.S. Bureau of Labor Statistics 11
13 In Millions Labor Force U.S. Jan Dec 2017 in Millions , Months Seasonally Adjusted Jan Feb Mar Apr May Jun Jul Aug Sep Oct Nov Dec Source: U.S. Bureau of Labor Statistics 12
14 In Millions Employment U.S in Millions 155 Seasonally Adjusted Source: U.S. Bureau of Labor Statistics 13
15 In Millions Employment U.S. Jan Dec 2017 in Millions ,940, Months 153 Seasonally Adjusted Jan Feb Mar Apr May Jun Jul Aug Sep Oct Nov Dec Source: U.S. Bureau of Labor Statistics 14
16 % Unemployed Unemployment Rate U.S. Jan Jan % 4.8% 4.5% 4.3% 4.0% 3.8% 4.8% 4.7% 4.5% 4.4% 4.3% 4.4% 4.3% 4.4% 4.2% 4.1% 4.1% 4.1% 4.1% Jan-17 Mar May Jul Sep Nov Jan-18 Source: U.S. Bureau of Labor Statistics -.7% from 2017 Seasonally Adjusted 15
 Unemployment (31-35) Tax Revenues (36-42) 16")
17 State of Alabama Economy Population (17-24) Labor Force (27-28) Employment (29-30) Unemployment (31-35) Tax Revenues (36-42) 16
18 In Millions Population Estimates State of Alabama in Millions Source: U.S. Census Bureau


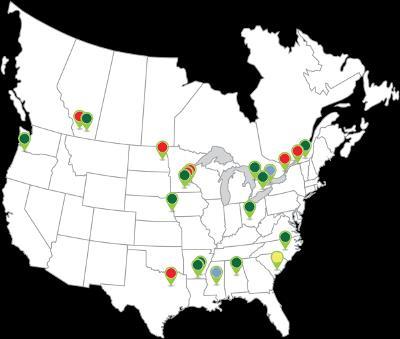
19 Migration Patterns Based Upon Household Moves Jan-Dec 2016 High Inbound Balanced High Outbound Source: United Van Lines 2016 Movers Study Alabama Out In

20 Migration Patterns Based Upon Household Moves Jan-Dec 2017 Inbound Outbound Balanced Alabama Out In Source: United Van Lines Migration Study
21 Top Inbound & Top Outbound States for Migration 2017 Top 10 Inbound States 1. Vermont 2. Oregon 3. Idaho 4. Nevada Washington S Carolina N Carolina Colorado 5. S Dakota 10. Alabama Top 10 Outbound States 1. Illinois 6. Massachusetts 2. New Jersey 7. Ohio 3. New York 8. Kentucky 4. Connecticut 9. Utah 5. Kansas 10.Wisconsin Source: United Van Lines Migration Study
22 Alabama Migration Patterns Based Upon Household Moves Year of Study Classification* Inbound Outbound Percentage 2017 Inbound % 2016 Balanced % 2015 Inbound % 2014 Balanced % 2013 Balanced % 2012 Balanced % Source: United Van Lines Migration Study 2017 *55% ratio of moved are Inbound 21
23 Top Reported Reasons for Migration In and Out of Alabama 2017 Inbound Top Reasons Outbound Reason Reported Reason 14.44% Retirement 5.83% 6.67% Health 4.17% 21.67% Family 14.17% 6.11% Lifestyle 3.33% 61.11% Job* 74.17% Source: United Van Lines Migration Study
24 Age for Migration In and Out of Alabama 2017 Inbound Age Age Categories Outbound Age 19.19% <18 to %* 18.02% % 16.28% % 28.49%* % 18.02% 65 and Older 16.96% Source: United Van Lines Migration Study
25 Income for Migration In and Out of Alabama 2017 Inbound Income Income Categories Outbound Income 8.53% Less than $50, % 27.91%* $50,000 to $74, % 13.95% $75,000 to $99, % 22.48% $100,000 to $149, % 27.13%* $150,000 or More 39.00%* Source: United Van Lines Migration Study
26 GDP % Change from Preceding Year for State of AL Vs U.S. 6% 4% 2% 0% -2% -4% 4.5% 3.8% 3.3% 1.6% 3.8% 1.6% -2.1% -2.5% % 4.1% 3.3% 4.4% 4.0% 2.8% 3.4% 2.9% 2.4% 1.9% 3.3% 2.6% US AL Source: U.S. Bureau of Economic Analysis: Current $ 25

27 GDP % Change from Previous Quarter State of AL Vs U.S. 8% 6% 4% 2% 0% 1 st Qtr rd Qtr % * 5.0% 5.3% 4.2% 4.6% 4.1% 1.9% 4.6% 4.6% 3.6% 3.3% 3.7% US AL 0.9% 1.1% 16Q1 16Q2 16Q3 16Q4 17Q1 17Q2 17Q3 Source: U.S. Bureau of Economic Analysis: Current $ 26
28 In Millions Labor Force State of Alabama in Millions Seasonally Adjusted Source: U.S. Bureau of Labor Statistics 27
29 In Millions Labor Force State of Alabama Jan Dec 2017 in Millions Seasonally Adjusted Jan Feb Mar Apr May Jun Jul Aug Sep Oct Nov Dec Source: U.S. Bureau of Labor Statistics 28
30 In Millions Employment State of Alabama in Millions Seasonally Adjusted Source: U.S. Bureau of Labor Statistics 29
31 In Millions Employment State of Alabama Jan Dec 2017 in Millions ,226 for 12 Months Seasonally Adjusted Jan Feb Mar Apr May Jun Jul Aug Sep Oct Nov Dec Source: U.S. Bureau of Labor Statistics 30
32 % Unemployed Unemployment Rate State of AL Jan - Dec 2016 vs % 6% 5% 4% 6.4% 6.2% 6.2% 6.2% % 6.1% 6.0% 6.0% 5.7% 5.8% 5.4% 4.9% 4.6% 4.5% 4.2% Seasonally Adjusted 5.4% 5.4% 5.7% 5.9% 6.2% -2.9% from % 3.6% 3.5% 3.5% 3% Jan Feb Mar Apr May Jun Jul Aug Sep Oct Nov Dec Source: U.S. Bureau of Labor Statistics 31
33 % Unemployed Unemployment Rate AL vs U.S. Jan - Dec % 6% 5% 4% 6.4% 6.2% 5.8% 5.4% 4.9% 4.6% 4.5% Seasonally Adjusted 4.4% 4.2% 4.1% 4.1% 4.1% 4.8% 4.7% 4.5% 4.4% 4.3% 4.4% 4.3% 4.2% 3.8% 3.6% 3.5% 3.5% AL U.S. 3% 2% Jan Feb Mar Apr May Jun Jul Aug Sep Oct Nov Dec Source: U.S. Bureau of Labor Statistics 32
34 TN 4.9% KY 4.8% Seasonally Adjusted NC 5.1% SC 4.3% MS 5.6% AL 6.2% GA 5.4% Unemployment Rates Southeastern United States Source: AL Dept of Labor Dec 2016 FL 4.9% 33


35 TN 3.2% KY 4.4% Seasonally Adjusted NC 4.5% SC 4.1% MS 4.6% AL 3.5% GA 4.4% Unemployment Rates Southeastern United States Source: AL Dept of Labor Dec 2017 FL 3.7% 34
36 In Thousands Job Quit Levels Annual Per Month Average for U.S. South Region in Thousands Source: Bureau of Labor Statistics
37 In $ Billions Gross Revenue Collections State of Alabama FY11-12 FY16-17 $10.50 $10.00 in $ Billions +4.16% from FY $9.78 $9.90 $10.31 * $9.50 $9.00 $8.93 $9.28 $9.40 $8.50 $8.00 FY11-12 FY12-13 FY13-14 FY14-15 FY15-16 FY16-17 Source: Alabama Department of Revenue *Record High for Alabama 36
38 In $ Billions Individual Income Tax Gross Collections State of Alabama FY11-12 FY16-17 in $ Billions $4.40 $4.21 $ % from 2016 $4.07 $4.00 $3.93 $3.80 $3.75 $3.75 $3.58 $3.60 $3.40 $3.20 FY11-12 FY12-13 FY13-14 FY14-15 FY15-16 FY16-17 Source: Alabama Department of Revenue 37
39 In $ Billions Sales Tax Gross Collections State of Alabama FY11-12 FY16-17 $2.40 $2.30 $2.20 $2.10 $2.00 $1.90 $1.80 in $ Billions $2.28 $2.24 $2.15 $2.08 $2.03 $1.99 FY11-12 FY12-13 FY13-14 FY14-15 FY15-16 FY16-17 Source: Alabama Department of Revenue +1.83% from FY
40 Total/Sales/Individual Income Tax State of AL in $ Millions FYTD vs FYTD In $ FYTD FYTD % Change Millions Individual Income Tax $1,193 $1, % Sales Tax $776 $ % Total $3,461 $3, % Source: Alabama Department of Revenue Oct-Jan 39
41 Total/Sales/Individual Income Tax State of AL in $ Millions Jan 2017 vs Jan 2018 In $ Millions Jan 2017 Jan 2018 % Change Individual Income Tax $ $ % Sales Tax $ $ % Total $ $ % Source: Alabama Department of Revenue 40
42 In $ Billions Simplified Sellers Use Tax Program* State of Alabama Total Collections by $20 $15 $10 Fiscal Quarter FY16Q1-FY2017Q4 $52.4 Millions FY 2017 $16.82 $16.71 $15.04 $7.24 $5 $0 $1.81 $2.08 $0.01 $0.47 FY16Q1 FY16Q2 FY16Q3 FY16Q4 FY17Q1 FY17Q2 FY17Q3 FY17Q4 Source: Alabama Department of Revenue *State capturing online sales as use tax, Amazon joins 11/01/16 41
43 Simplified Sellers Use Tax Program State of Alabama FY Education $6,545,297 12% Municipalities $13,090,594 25% $52.4 Millions FY 2017 Counties $13,090,594 25% General Fund $19,635,891 38% Source: Alabama Department of Revenue 42
44 Housing Statistics State of AL 2016 vs % Change Median Price $141,442 $148, % Avg Days on Market % Total Homes Sold 53,759 57, % Source: Alabama Center for Real Estate 43

45 CULVERHOUSE College of Commerce Alabama Business Confidence Index State Survey 4 th Quarter 2017 Approximately 164 respondents Operated by University of Alabama Center for Business and Economic Research cber.cba.ua.edu 44
46 % of Respondents Economic Outlook for Alabama Q compared to Q % 45% 30% 42.4% 47.3% 15% 0% 0.6% 7.9% Much Worse Worse Remain the Same Better 1.8% Much Better Source: Alabama Business Confidence Index 45
47 Index Value Economic Outlook Index for Alabama Q1 16 Q % Change Q3 17 Q % % Change Q4 16 Q % Q1 16 Q2 16 Q3 16 Q4 16 Q1 17 Q2 17 Q3 17 Q4 17 Source: Alabama Business Confidence Index 46
48 % of Respondents Hiring Outlook for Alabama Q compared to Q % 53.3% 45% 30% 36.4% 15% 0% 3.0% 5.5% Strong Decrease Moderate Decrease No Change Moderate Increase 1.8% Strong Increase Source: Alabama Business Confidence Index 47
49 Index Value Hiring Outlook Index for Alabama Q1 16 Q % Change Q3 17 Q % % Change Q4 16 Q % Q1 16 Q2 16 Q3 16 Q4 16 Q1 17 Q2 17 Q3 17 Q4 17 Source: Alabama Business Confidence Index 48
50 % of Respondents Sales Outlook for Alabama Q compared to Q % 45% 42.4% 47.3% 30% 15% 0% 0.6% Strong Decrease 7.9% Moderate Decrease No Change Moderate Increase 1.8% Strong Increase Source: Alabama Business Confidence Index 49
51 Index Value Sales Outlook Index for Alabama Q1 16 Q % Change Q3 17 Q % % Change Q4 16 Q % Q1 16 Q2 16 Q3 16 Q4 16 Q1 17 Q2 17 Q3 17 Q4 17 Source: Alabama Business Confidence Index 50
52 % of Respondents Capital Expenditures Outlook Q compared to Q % 45% 49.7% 39.2% 30% 15% 0% 1.2% Strong Decrease 5.8% Moderate Decrease No Change Moderate Increase 4.1% Strong Increase Source: Alabama Business Confidence Index 51
53 Index Value Capital Expenditures Outlook Alabama Q1 16 Q % Change Q Q % % Change Q Q % Q1 16 Q2 16 Q3 16 Q4 16 Q1 17 Q2 17 Q3 17 Q4 17 Source: Alabama Business Confidence Index 52
54 State of Alabama Summary Population Census Up, High Inbound State (57%) State GDP Up ( %, 2017 estimate June 18) Labor Force Flat to Up Slightly (+4, , Trending Down) Employment Up (+27, ) Unemployment Rate Down (3.5% Dec) Housing Up (+7.1% Homes Sold 2016 vs 2017) State Tax Revenues Exceed $10 Billion 1 st Time ($10.31 B) 53

55 Calhoun County Economy 54
 Municipal Tax Collections (102-113) Economic Development Council (115-124)")
56 Calhoun County Economy Membership Survey (56-78) Employment (81-90) County Tax Collections (94-96) Tourism & Housing (97-101) Municipal Tax Collections ( ) Economic Development Council ( ) 55
57 Membership Survey of Calhoun County Chamber of Commerce 2018 Ten years of data from Membership Results for seven questions First chart last years results Second chart this years results Third chart results from last 10 years Index value = (sum of item values)x(response%)/(#options) 56
58 Q#1: Overall Economic Outlook Last Year (Jan 2017) 50% 40% 30% 20% 10% 0% 0% Jan 2017 Index.82 11% 22% 46% 28% Much Worse Worse About Same Better Much Better Source: 2017 Calhoun County Chamber of Commerce Membership Survey 57
59 Q#1: Overall Economic Outlook This Year (Jan 2018) 60% 50% 40% 30% 20% 10% 0% Jan 2018 Index.79 1% 1% 24% 49% 24% Much Worse Worse About Same Better Much Better Source: 2018 Calhoun County Chamber of Commerce Membership Survey 58
60 Index Value Q#1: Overall Economic Outlook Source: Calhoun County Chamber of Commerce Membership Survey 59
61 Q#2: Employment Outlook Last Year (Jan 2017) 50% 40% 30% Jan 2017 Index.69 45% 41% 20% 10% 0% 0% Major Cutback # Emp 7% Slight Cutback # Emp Source: 2017 Calhoun County Chamber of Commerce Membership Survey Remain Same Slight Increase # Emp 6% Major Increase # Emp 60
62 Q#2: Employment Outlook This Year (Jan 2018) 70% 60% 50% 40% 30% 20% 10% 0% 0% 3% Major Cutback # Emp Jan 2018 Index.67 Slight Cutback # Emp Source: 2018 Calhoun County Chamber of Commerce Membership Survey 58% Remain Same 38% Slight Increase # Emp 1% Major Increase # Emp 61
63 Index Value Q#2: Employment Outlook Source: Calhoun County Chamber of Commerce Membership Survey 62
64 Remain same 75 Q#3: Intentions Concerning Employee Compensation This Year (Jan 2017) 70% 60% 50% 40% 30% 20% 10% 0% 0% Major Decrease Jan 2017 Index.73 5% Slight Decrease Source: 2017 Calhoun County Chamber of Commerce Membership Survey 28% Remain Same 64% Slight Increase 3% Major Increase 63
65 Q#3: Intentions Concerning Employee Compensation This Year (Jan 2018) 70% 60% 50% 40% 30% 20% 10% 0% 0% 0% Major Decrease Jan 2018 Index.73 Slight Decrease Source: 2018 Calhoun County Chamber of Commerce Membership Survey 36% Remain Same 63% Slight Increase 1% Major Increase 64
66 Index Value Q#3: Intentions Concerning Employee Compensation Source: Calhoun County Chamber of Commerce Membership Survey 65
67 Q#4: Demand for Products/Services Last Year (Jan 2017) 60% 45% Jan 2017 Index.76 55% 30% 26% 15% 0% 0% Major Decrease 5% Slight Decrease Source: 2017 Calhoun County Chamber of Commerce Membership Survey Remain Same Slight Increase 14% Major Increase 66
68 Q#4: Demand for Products/Services This Year (Jan 2018) 60% 45% 30% Jan 2018 Index.76 34% 44% 20% 15% 0% 1% 1% Major Decrease Slight Decrease Source: 2018 Calhoun County Chamber of Commerce Membership Survey Remain Same Slight Increase Major Increase 67
69 Index Value Q#4: Demand for Products/Services Source: Calhoun County Chamber of Commerce Membership Survey 68
70 Remain same 75 Q#5: New Product Offerings Last Year (Jan 2017) 50% 40% 30% 20% 10% 0% 0% 2% Major Decrease Jan 2017 Index.74 Slight Decrease 43% 41% Remain Same Slight Increase 15% Major Increase Source: 2017 Calhoun County Chamber of Commerce Membership Survey 69
71 Remain same 75 Q#5: New Product Offerings This Year (Jan 2018) 60% 50% 40% 30% 20% 10% 0% 0% 1% Major Decrease Jan 2018 Index.71 Slight Decrease 48% Remain Same 42% Slight Increase Source: 2018 Calhoun County Chamber of Commerce Membership Survey 70 8% Major Increase
72 Index Value Q#5: New Product Offerings Source: Calhoun County Chamber of Commerce Membership Survey 71
73 Remain same 75 Q#6: Intention to Change Number of Outlets Last Year (Jan 2017) 90% 75% 60% Jan 2017 Index.63 81% 45% 30% 15% 0% 0% 1% Major Decrease Slight Decrease Source: 2017 Calhoun County Chamber of Commerce Membership Survey Remain Same 16% Slight Increase 2% Major Increase 72
74 Remain same 75 Q#6: Intention to Change Number of Outlets This Year (Jan 2018) 90% 75% 60% Jan 2018 Index.63 83% 45% 30% 15% 0% 0% 1% Major Decrease Slight Decrease Source: 2018 Calhoun County Chamber of Commerce Membership Survey Remain Same 16% Slight Increase 0% Major Increase 73
75 Index Value Q#6: Intention to Change Number of Outlets Source: Calhoun County Chamber of Commerce Membership Survey 74
76 Remain same 75 60% 50% 40% 30% 20% 10% 0% 1% Major Decrease Q#7: Intentions Concerning Expenditures on Advertising Last Jan 2017 Index.68 7% Slight Decrease Source: 2017 Calhoun County Chamber of Commerce Membership Survey Year (Jan 2017) 48% Remain Same 36% Slight Increase 7% Major Increase 75
77 Remain same 75 50% 40% 30% 20% 10% 0% Q#7: Intentions Concerning Expenditures on Advertising This 1% 3% Major Decrease Jan 2018 Index.70 Slight Decrease Source: 2018 Calhoun County Chamber of Commerce Membership Survey Year (Jan 2018) 46% 44% Remain Same Slight Increase 6% Major Increase 76
78 Index Value Q#7: Intentions Concerning Expenditures on Advertising Source: Calhoun County Chamber of Commerce Membership Survey 77
79 Membership Survey: Largest Response Category by % 2018 Overall Outlook Slightly Better 49% Number of Employees No Change 58% Employee Pay Slight Increase 63% Demand for Products Slightly Better 44% New Products No Change 48% Number of Outlets No Change 83% Advertising Spending No Change 46% 78
80 In Thousands Population Trends Calhoun County in Thousands , , Source: U.S. Census Bureau
81 GDP % Change from Preceding Year Calhoun County & State of Alabama 8% 6% 4% 2% 0% -2% -4% -6% 7.1% 3.3% 2.5% 1.6% -2.5% -3.4% % 3.8% 3.4% 2.9% 2.4% 1.9% 3.3% 2.6% -1.3% -1.1% -3.5% 1.1% 0.7% Calhoun Alabama 2.1% Source: U.S. Bureau of Economic Analysis: Current $ 80
82 In Thousands Labor Force Calhoun County in Thousands % Source: U.S. Bureau of Labor Statistics 81
83 In Thousands Labor Force Calhoun County Jan Dec 2017 in Thousands for 12 Months Jan Feb Mar Apr May Jun Jul Aug Sep Oct Nov Dec Source: U.S. Bureau of Labor Statistics 82
84 In Thousands Employment for Calhoun County in Thousands % Source: U.S. Bureau of Labor Statistics 83
85 In Thousands Employment Calhoun County Jan Dec 2017 in Thousands for 12 Months Jan Feb Mar Apr May Jun Jul Aug Sep Oct Nov Dec Source: U.S. Bureau of Labor Statistics 84
86 % Unemployed Unemployment Rate for Calhoun County % 9.9% 9.8% 9.2% 9% 8.0% 7.2% 7.2% 6.9% 6.6% 7% 5% 5.1% 5.2% 3% Source: U.S. Bureau of Labor Statistics 85
87 % Unemployed Unemployment Rate Calhoun County vs Alabama % 6% 4% 2% 7.5% 6.8% 6.7% 6.1% Source: U.S. Bureau of Labor Statistics 6.0% 5.3% Not Seasonally Adjusted 5.0% 4.8% 5.9% 5.5% 4.8% 4.4% 4.2% 5.2% 4.9% 4.3% Calhoun AL 3.8% 4.0% 4.0% 3.9% 3.3% 3.5% 3.6% 3.5% Jan Feb Mar Apr May Jun Jul Aug Sep Oct Nov Dec 86

88 6.6% Alabama Unemployment Rates December 2016 State Ave 5.9% Unemployment Rate 6.1% and Below 6.2% - 7.4% 7.5% and Above Source: Alabama Department of Labor Not Seasonally Adjusted 87


89 3.9% Alabama Unemployment Rates December 2017 State Ave 3.5% Unemployment Rate 6.5% and Below 6.6% - 7.9% 8.0% and Above Source: Alabama Department of Labor Not Seasonally Adjusted 88
90 Employment State Peak to Now % Change AL MSAs 20% 10% 0% -10% 0% 18% Jan 07- Dec 17-1% -4% -8% -3% -3% 10% -1% 1% 14% -20% -18% Tusc Mont Mob Hunt Gads Flor Doth Deca Bham Aub Ann AL Source: U.S. Bureau of Labor Statistics 89
91 Employment % Change AL & AL MSAs Dec 16- Dec 17 5% 4.0% 3.3% 3% 0% 1.8% 2.0% 0.9% 2.6% 1.1% 0.2% 2.4% 0.9% 1.4% 2.4% Tusc Mont Mob Hunt Gads Flor Doth Deca Bham Aub Ann AL Source: U.S. Bureau of Labor Statistics 90
92 Average Hourly Earnings Private Sector Calhoun County & State of Alabama $24 $21 $18 $15 $ $19.68 $19.86 $20.14 $20.21 $20.18 $20.73 $21.02 $ % $22.56 $18.59 $18.23 $18.16 $17.48 $17.56 $17.05 $16.22 $15.31 $16.34 Alabama Calhoun Source: U.S. Bureau of Labor Statistics 76% 91
93 Average Hourly Earnings Private Sector Calhoun County & State of Alabama $25 $22 $19 $16 Jan Dec Alabama Calhoun 76% State Average $13 Jan Feb Mar Apr May Jun Jul Aug Sep Oct Nov Dec Source: U.S. Bureau of Labor Statistics 92
94 Thousands Per Capita Personal Income Calhoun County & State Of Alabama $40 $35 $30 $25 Source: U.S. Bureau of Economic Analysis in $ Thousands $32.6 $33.4 $32.7 $33.7 $34.7 $35.5 $36.9 $ % $29.9 $30.7 $30.1 $30.7 $31.5 $31.7 $31.4 $32.4 Calhoun $38.2 $ % $33.5 $34.4 Alabama
95 In $ Millions State Sales Tax Collections Calhoun County FY FY in $ Millions $33 $30 $28 $25 $23 $ % Fiscal Yr $28.00 $29.12 $31.19 $31.02 $30.50 $31.34 $25.24 $ Source: AL Dept of Revenue 94
96 In $ Millions State Use Tax Collections Calhoun County FY FY $1.5 in $ Millions $1.3 $ % Fiscal Yr $1.10 $1.08 $1.08 $1.19 $1.12 $1.27 $0.9 $0.93 $0.84 $0.7 Source: AL Dept of Revenue
97 Simplified Sellers Use Tax Allocations Calhoun County FY Weaver $13,766 2% Piedmont $22,104 4% Jacksonville $56,859 9% Source: AL Dept of Revenue Ohatchee $5,301 1% Oxford $96,735 15% Calhoun County $324,741 52% Anniston $104,702 17% $624,210 FY
98 In $ Thousands State Lodging Tax Collections from Calhoun County FY09-10 FY16-17 $1,200 $1,100 $1,000 $900 $800 in $ Thousands % Fiscal Yr $883.6 $915.1 $778.4 $824.5 $847.1 $771.6 $1,022.8 $1,141.0 $700 Source: AL Dept of Revenue
99 Tourism Economic Impact State of Alabama 2016 Est over 25.8 Million visitors 2016 Spending $13.8 Billion in 2016 Represent 6.8% of State GDP Est 179,644 jobs (9.1% of non agricultural) Generated $836 Million State/Local Tax Revenues Source: Alabama Tourism Department,
100 Billions Tourism Expenditures in AL in $ Billions $14 $12 $10 $8 Up Avg of 5.81%/Yr Last 10 yrs $9.3 $9.6 $10.2 $9.3 $9.1 $8.5 $12.7 $11.8 $10.7 $11.0 $13.4 $ Source: Alabama Tourism Department,
101 Jobs Earnings in Millions Tourism Impact in Calhoun County Jobs & Earnings ,000 Up 6.5% Up 7.3% $ $25 $23 $21.8 $23.4 $ $ Source: Alabama Tourism Department,
102 Housing Statistics Calhoun County 2016 vs % Change Average Price $134,558 $138, % Avg Days on Market % Total Homes Sold 1,510 1, % Source: Alabama Center for Real Estate 101
103 Home Sales/Month Average Number of Home Sales Per Month Calhoun County Avg Source: Alabama Center for Real Estate 102
104 In $ Millions Sales, Use & Lodging Tax Annual Total FY09-10 FY16-17 $24 $22 $20 $ % FY $19.0 * $17.1 $17.5 Anniston in $ Millions $22.0 $21.2 * $20.8 $20.6 $22.3 $ Source: City of Anniston * increase in sales and use tax rate from 4% to 5% effective April 2012 (25%) 103
105 In $ Millions $6.0 $5.5 $5.0 $4.5 $4.0 Source: City of Anniston Sales, Use & Lodging Tax Oct - Dec 2016 vs Oct Dec 2017 Anniston in $ Millions $ % O-D 16vs17 $5.83 Oct16-Dec16 Oct17-Dec17 104
106 In $ Millions Sales & Use Tax Collected by AL Annual Total FY09-10 FY16-17 Oxford in $ Millions $33 $31 $28 $26 $23 $21 $18 Source: AL Dept of Revenue +1.6% FY $31.0 $31.5 $28.4 $26.6 $25.3 $25.5 $24.3 $
107 In $ Millions $7.5 $7.0 $6.5 Sales & Use Tax Oct - Dec 2016 vs Oct Dec 2017 Oxford in $ Millions $ % O-D 16vs17 $7.50 $6.0 Source: City of Oxford Oct16-Dec16 Oct17-Dec17 106
108 In $ Millions Sales & Use Tax Annual Total FY09-10 FY16-17 Jacksonville in $ Millions $7.5 $ % FY $6.5 $6.8 $7.0 $7.0 $7.3 $7.3 $5.5 $5.3 $5.5 $4.5 Source: City of Jacksonville
109 In $Millions Sales & Use Tax FYTD Oct - Dec 2016 vs 2017 Jacksonville in $ Millions $2.00 $ % O-D 16vs17 $1.937 $1.90 $1.80 Oct16-Dec16 Oct17-Dec17 Source: City of Jacksonville 108
110 In $ Thousands $650 $600 $550 $500 $450 Sales & Use Tax Annual Total FY FY16-17 Ohatchee in $ Thousands +12.6% FY $550 $534 $545 $489 $444 $571 $549 $618 $ Source: City of Ohatchee 109
111 In $ Millions Sales, Use & Lodging Tax Annual Total FY09-10 FY16-17 Piedmont in $ Millions $2.0 $1.9 $1.8 $1.7 $1.6 $1.5 $1.4 $1.3 Source: City of Piedmont $1.37 $ % FY $1.45 $1.46 $1.46 $1.75 $1.89 $ *1% tax increase Jan 1, 2015 * * 110
112 In $ Thousands Sales, Use & Lodging Tax Oct - Dec 2016 vs Oct Dec 2017 Piedmont in $ Thousands $500 $450 $ % O-D 16vs17 $400 $350 Source: City of Piedmont Oct16-Dec16 $397 Oct17-Dec17 111
113 In $ Thousands Sales, Use Tax Annual Total FY09-10 FY16-17 Weaver in $ Thousands $600 $500 $571 $594 $555 $444 $400 $343 $300 $289 $245 $234 $ Source: City of Weaver +7.07% FY
114 In $ Thousands Sales, Use & Lodging Tax Oct - Dec 2016 vs Oct Dec 2017 Weaver in $ Thousands $180 $160 $140 $120 $100 $80 Source: City of Weaver +21% O-D 16vs17 $ Oct16-Dec16 $ Oct17-Dec17 113
115 Calhoun County: Economic Summary Membership Survey- Positive Slightly Better Population- Estimated Down Slightly Employment Jan-Dec 2017 (+626 Jan-Dec 2016) Unemployment- Dec % (Dec %) Municipal Revenues- Up FY 16-17; Mixed to Flat FYTD Housing Market- Up 9.00% Total Homes Sold Tourism Revenues/Employment Up; Lodging Taxes % 114
116 Calhoun County Economic Development Council New & Expanding Industries 2017 Near Atlanta, Near Birmingham, Near Perfect 115


117 40 new jobs $4.5 million investment 116


118 Vehicle Innovation Center $25 million investment 117


119 STRYKER $250,000 investment 25 new jobs 118


120 $5 Million Expansion 119


121 150 new jobs! 120


122 $5.4 million Investment 121

123 Oxford West Industrial Park Advantage Site Designation Mass Grading and New Entrance 122

124 Calhoun County Economic Development Council Five Years $610 million Industrial Parks in new investment Over 2000 new jobs! 123


125 Calhoun County Economic Development Council Near Atlanta, Near Birmingham, Near Perfect 124
126 Calhoun County: Economic Summary Membership Survey- Positive Slightly Better Population- Estimated Down Slightly Employment Jan-Dec 2017 (+626 Jan-Dec 2016) Unemployment- Dec % (Dec %) Municipal Revenues- Up FY 16-17; Mixed to Flat FYTD Housing Market- Up 9% Total Homes Sold Tourism Revenues/Employment Up; Lodging Taxes +11.6% 125
CALHOUN COUNTY CHAMBER OF COMMERCE AND VISITORS CENTER
 2017 Economic Forum CALHOUN COUNTY CHAMBER OF COMMERCE AND VISITORS CENTER Information provided by School of Business and Industry THANK YOU to our SPONSORS Calhoun County Economy Forum National Update
U.S. Consumer Sentiment Jan 2011 Jan 2012
 2012 Economic Update Information provided by Jacksonville State University Center for Economic Development and College of Commerce and Business Administration U.S. Consumer Sentiment Jan 2011 Jan 2012
Connecting Our Greater Communities: Overview
 2014 Economic Update Information provided by Jacksonville State University Center for Economic Development and College of Commerce and Business Administration Connecting Our Greater Communities: Overview
Thanks to Sponsors of Economic Forum
 2013 Economic Update Information provided by Jacksonville State University Center for Economic Development and College of Commerce and Business Administration Thanks to Sponsors of Economic Forum Presenting
NEAZ Members: Cherokee County
 1 NEAZ Members: Cherokee County 2 NEAZ Members: DeKalb County 3 NEAZ Members: Etowah County 4 NEAZ Members: Marshall County 5 NEAZ Members: Cherokee County April 27, 2011 6 NEAZ Members: DeKalb County
Information provided by. Jacksonville State University Center for Economic Development and Business Research School of Business & Industry
 Information provided by Jacksonville State University Center for Economic Development and Business Research School of Business & Industry Connecting Our Greater Communities: Overview CEAZ Update (#2-#75)
Slow and Low: The Economic and Financial Outlook
 Southern Legislative Conference 7th Annual Meeting Slow and Low: The Economic and Financial Outlook July, William R. Emmons Federal Reserve Bank of St. Louis William.R.Emmons@stls.frb.org These comments
Mutual Fund Tax Information
 Mutual Fund Tax Information We have provided this information as a service to our shareholders. Thornburg Investment Management cannot and does not give tax or accounting advice. If you have further questions
Mutual Fund Tax Information
 2008 Mutual Fund Tax Information We have provided this information as a service to our shareholders. Thornburg Investment Management cannot and does not give tax or accounting advice. If you have further
Quarterly Economic Update Key Trends
 Quarterly Economic Update Key Trends Linda Haran Senior Director June 2011 Experian and the marks used herein are service marks or registered trademarks of Experian Information Solutions, Inc. Other product
REBUILD & RECOVER. VEGAS HOUSING REPORT Suncoast Hotel & Casino April 22, Prepared by:
 REBUILD & RECOVER VEGAS HOUSING REPORT Suncoast Hotel & Casino April 22, 2014 Prepared by: REBUILD The Great Recovery continues moderately. Nevada Recovery Comparison: Last 11 Recessions % Job Losses Compared
Union Members in New York and New Jersey 2018
 For Release: Friday, March 29, 2019 19-528-NEW NEW YORK NEW JERSEY INFORMATION OFFICE: New York City, N.Y. Technical information: (646) 264-3600 BLSinfoNY@bls.gov www.bls.gov/regions/new-york-new-jersey
1. External Economic Drivers 2. Current Conditions 3. Economic Projections 4. Long term Trends
 Maine s Economic Outlook: 2010 and Beyond January 12, 2010 James Breece, Ph.D. University of Maine System Outline 1. External Economic Drivers 2. Current Conditions 3. Economic Projections 4. Long term
Uinta Basin Energy Summit Economic Overview September 10, 2015
 Uinta Basin Energy Summit Economic Overview September 10, 2015 Overview National Economic Conditions Utah Economic Conditions Utah is One of the Fastest Growing CA States in the Country Percent Change
CALCULATING THE SUPPLEMENTAL NUTRITION ASSISTANCE PROGRAM (SNAP) PROGRAM ACCESS INDEX: A STEP-BY-STEP GUIDE FOR 2016
 PROGRAM ACCESS INDEX: A STEP-BY-STEP GUIDE FOR 2016") USDA ~ United States Department of Agriculture Food and Nutrition Service February 2018 CALCULATING THE SUPPLEMENTAL NUTRITION ASSISTANCE PROGRAM (SNAP) PROGRAM ACCESS INDEX: A STEPBYSTEP GUIDE FOR 2016
USDA ~ United States Department of Agriculture Food and Nutrition Service February 2018 CALCULATING THE SUPPLEMENTAL NUTRITION ASSISTANCE PROGRAM (SNAP) PROGRAM ACCESS INDEX: A STEPBYSTEP GUIDE FOR 2016
Use of State Coincident Indexes
 Use of State Coincident Indexes Federal Tax Administrators Revenue Estimating and Tax Research Conference October 17, 2016 Paul R. Flora* Senior Economic Analyst, Research & Policy Support Manager FEDERAL
Undocumented Immigrants are:
 Immigrants are: Current vs. Full Legal Status for All Immigrants Appendix 1: Detailed State and Local Tax Contributions of Total Immigrant Population Current vs. Full Legal Status for All Immigrants
Key Labor Market and Economic Metrics
 Key Labor Market and Economic Metrics May Update Incorporates Data Available on May 27 th, 2016 This reference is the result of a collaboration between the Bureau of Labor Market Information and Strategic
nc today october 2006 Photo courtesy of NC Division of Tourism, Film and Sports development. Linn Cove Viaduct, Blue Ridge Parkway, NC
 nc today october 2006 Photo courtesy of NC Division of Tourism, Film and Sports development. Linn Cove Viaduct, Blue Ridge Parkway, NC September Highlights North Carolina Unemployment Rate (Seasonally
Minnesota s Economics & Demographics Looking To 2030 & Beyond. Tom Stinson, State Economist Tom Gillaspy, State Demographer July 2008
 Minnesota s Economics & Demographics Looking To 2030 & Beyond Tom Stinson, State Economist Tom Gillaspy, State Demographer July 2008 Minnesota Has Been Very Successful (Especially For A Cold Weather State
Economic Indicators December 2017
 Economic Indicators December 2017 General Economy GDP % Change U.S. GDP Growth First two consecutive quarters over 3% in 3 years 6.0% 4.0% 2.0% 0.0% -2.0% -4.0% -6.0% Last 3 quarters: 3Q17: 3.2% 2Q17:
Update: 50-State Survey of Retiree Health Care Liabilities Most recent data show changes to benefits, funding policies could help manage rising costs
 A fact sheet from Dec 2018 Update: 50-State Survey of Retiree Health Care Liabilities Most recent data show changes to benefits, funding policies could help manage rising costs Getty Images Overview States
The Florida Turnaround Story. Jesse Panuccio DEO Executive Director September 2, 2015
 The Florida Turnaround Story Jesse Panuccio DEO Executive Director September 2, 2015 1 2 Private-Sector Jobs Created December 2010 July 2015, Seasonally Adjusted 917,400 Private Sector Jobs Created 3 Port
James K. Polk United States President ( ) Mecklenburg County NC
 Mecklenburg County NC") february 2006 James K. Polk United States President (1845-1849) Mecklenburg County NC http://www.whitehouse.gov/history/presidents/jp11.html January Highlights The Unemployment Rate (Seasonally Adjusted)
february 2006 James K. Polk United States President (1845-1849) Mecklenburg County NC http://www.whitehouse.gov/history/presidents/jp11.html January Highlights The Unemployment Rate (Seasonally Adjusted)
ECONOMIC UPDATE. (Northeast Alabama Regional Economic Indicators) July 2018
 July 2018") ECONOMIC UPDATE (Northeast Alabama Regional Economic Indicators) July 2018 Center for Economic Development and Business Research School of Business and Industry Jacksonville State University 700 Pelham
ECONOMIC UPDATE (Northeast Alabama Regional Economic Indicators) July 2018 Center for Economic Development and Business Research School of Business and Industry Jacksonville State University 700 Pelham
CBER Indexes for Nevada and Southern Nevada
 CBER Indexes for Nevada and Southern Nevada Published March 24, 2016 Stephen M. Miller, PhD, Director Jinju Lee, Economic Analyst Summary of CBER s Nevada Indexes Coincident Index Leading Index Mo. to
Exhibit 1. Morningstar, State of North Carolina Pension Overview (Nov. 20, 2013).
.") Exhibit 1 Morningstar, Pension Overview (Nov. 20, 2013). Also available at https://www.nctreasurer.com/ret/documents/morningstarncpensionreport.pdf Morningstar Pension Report Release Date: 20 Nov 2013
Exhibit 1 Morningstar, Pension Overview (Nov. 20, 2013). Also available at https://www.nctreasurer.com/ret/documents/morningstarncpensionreport.pdf Morningstar Pension Report Release Date: 20 Nov 2013
Southwest Florida Regional Economic Indicators. June 2013
 Southwest Florida Regional Economic Indicators June 213 Regional Economic Research Institute Lutgert College Of Business Phone 239-59-7319 Florida Gulf Coast University 151 FGCU Blvd. South Fort Myers,
Power of Travel Promotion Evolution
 Power of Travel Promotion Evolution Promotion More Important than Ever Power of Promotion $7 million Median state = marketing budget FY 2014-15 OR 45 seconds worth of Super Bowl ads $100 million = Presidential
Current Economic Review April 16, 2014
 Current Economic Review April 16, 2014 Brian Bonnenfant Project Manager Center for Regional Studies University of Nevada, Reno 784-1771 bonnen@unr.edu 230,000 225,000 **Peak = 228,100 Emp **Start of Great
ECONOMIC UPDATE. (Northeast Alabama Regional Economic Indicators) September 2017
 September 2017") ECONOMIC UPDATE (Northeast Alabama Regional Economic Indicators) September 2017 Center for Economic Development and Business Research School of Business and Industry Jacksonville State University 700 Pelham
ECONOMIC UPDATE (Northeast Alabama Regional Economic Indicators) September 2017 Center for Economic Development and Business Research School of Business and Industry Jacksonville State University 700 Pelham
VECTRA BANK 23 RD ANNUAL ECONOMIC FORECAST BREAKFAST START SMART IN 2016! Member FDIC VectraBank.com
 VECTRA BANK 23 RD ANNUAL ECONOMIC FORECAST BREAKFAST START SMART IN 2016! Member FDIC VectraBank.com Economic Presentation April 26, 2016 Tatiana Bailey, Ph.D. Director, UCCS Economic Forum A Little Humor
Confronting the UI Solvency Crisis
 Confronting the UI Solvency Crisis Andrew Stettner Deputy Director Serious UI Financing i Crisis i UI programs are set up to be self-financing. State funds are deposited in and guarded by the U.S. Treasury,
City of Modesto Economic Indicators December 2014 Edition
 City of Modesto Economic Indicators December 2014 Edition Steve Christensen City of Modesto Economic Outlook: City of Modesto The City of Modesto continues to slowly recover from the Great Recession. Some
ECONOMIC UPDATE. (Northeast Alabama Regional Economic Indicators) March 2019
 March 2019") ECONOMIC UPDATE (Northeast Alabama Regional Economic Indicators) March 2019 Center for Economic Development and Business Research School of Business and Industry Jacksonville State University 700 Pelham
ECONOMIC UPDATE (Northeast Alabama Regional Economic Indicators) March 2019 Center for Economic Development and Business Research School of Business and Industry Jacksonville State University 700 Pelham
Minimum Wage per State
 per State Future and Notes ALABAMA NONE Federal minimum applies. BIRMINGHAM: July 2016 $ 8.50; July 2017: $10.10 ALASKA $8.75 ARIZONA $8.05 ARKANSAS $7.50 Nov. 4 2014 ballot measure approved to raise minimum
MINIMUM WAGE WORKERS IN TEXAS 2016
 For release: Thursday, May 4, 2017 17-488-DAL SOUTHWEST INFORMATION OFFICE: Dallas, Texas Contact Information: (972) 850-4800 BLSInfoDallas@bls.gov www.bls.gov/regions/southwest MINIMUM WAGE WORKERS IN
U.S. and New England Economic Conditions and Outlook
 U.S. and New England Economic Conditions and Outlook Yolanda Kodrzycki Senior Economist and Policy Advisor charts prepared by Ana Patricia Muñoz presented to New England Board of Higher Education conference
Office of the Chief Economist National Credit Union Administration. Economic Overview. California State Examiner School.
 Office of the Chief Economist National Credit Union Administration California State Examiner School May 30, 2017 Credit Union Performance Trends Recent Data About Credit Union Performance in California,
CHAPTER 6. The Economic Contribution of Hospitals
 CHAPTER 6 The Economic Contribution of Hospitals Chart 6.1: National Health Expenditures as a Percentage of Gross Domestic Product and Breakdown of National Health Expenditures, 2014 U.S. GDP 2014 $3.03
The State of. National Conference of Fiscal Leaders Seminar San Diego, CA December 9, Donald J. Boyd
 The State of State Budgets National Conference of State Legislatures Fiscal Leaders Seminar San Diego, CA December 9, 2009 Donald J. Boyd Senior Fellow State & local governments role as implementers of
!!!!!!!! Testimony!of! Andrew!Stettner! National!Employment!Law!Project!!!! Hearing!Before!the! U.S.!House!of!Representatives,!
 Testimonyof AndrewStettner NationalEmploymentLawProject HearingBeforethe U.S.HouseofRepresentatives, Ways&MeansCommittee, SubcommitteeonIncomeSecurity&FamilySupport May4,2010 AndrewStettner,DeputyDirector
State, Local and Net Tuition Revenue Supporting General Operating Expenses of Higher Education, U.S., Fiscal Year 2010, Current (unadjusted) Dollars
 Dollars") State, Local and Net Tuition Revenue Supporting General Operating Expenses of Higher Education, U.S., Fiscal Year 2010, Current (unadjusted) Dollars Net Tuition $51.3 Billion 37% All State Support $73.7
State, Local and Net Tuition Revenue Supporting General Operating Expenses of Higher Education, U.S., Fiscal Year 2010, Current (unadjusted) Dollars Net Tuition $51.3 Billion 37% All State Support $73.7
Crisis of Long-Term Unemployment is Far From Over Now Reaching Most Segments of the Labor Market By
 February 2003 Crisis of Long-Term Unemployment is Far From Over Now Reaching Most Segments of the Labor Market By National Employment Law Project The rise in long-term joblessness shows no signs of subsiding,
National Trends in State and Local Government Employment and Finances
 National Trends in State and Local Government Employment and Finances Economic Advisory Board Meeting New York State Division of the Budget State Capitol, Albany, NY (By Telephone) December 7, 2010 Donald
Aetna Individual Direct Pay Commissions Schedule
 Aetna Individual Direct Pay Commissions Schedule Cards Issued Broker Rate Broker Tier Per Year 1st Yr 2nd Yr 3+ Yrs Levels 11-Jan 4.00% 4.00% 3.00% Bronze 24-Dec 6.00% 4.00% 3.00% Silver 25-49 8.00% 4.00%
Household Income for States: 2010 and 2011
 Household Income for States: 2010 and 2011 American Community Survey Briefs By Amanda Noss Issued September 2012 ACSBR/11-02 INTRODUCTION Estimates from the 2010 American Community Survey (ACS) and the
Economic and Travel Indicator
 Economic and Travel Indicator If you have any questions, please contact: February 217 Economic and Labor Market Information Division Released March 29, 217 82-828-422 Labor.Lmi@vermont.gov VERMONT ECONOMIC
Economic and Travel Indicator
 Economic and Travel Indicator If you have any questions, please contact: March 217 Economic and Labor Market Information Division 82-828-422 Labor.Lmi@vermont.gov Released May 16, 217 VERMONT ECONOMIC
MINIMUM WAGE WORKERS IN HAWAII 2013
 WEST INFORMATION OFFICE San Francisco, Calif. For release Wednesday, June 25, 2014 14-898-SAN Technical information: (415) 625-2282 BLSInfoSF@bls.gov www.bls.gov/ro9 Media contact: (415) 625-2270 MINIMUM
Data current as of: August 5, ,200,000 1,000, , , , , , , , , , , ,000
 Forecast Version: Spring 216 Economic Indicators The Bureau of Labor Statistics reported a total nonfarm payroll employment increase of 287, in June with the unemployment rate rising.2% to 4.9%. The jobs
Checkpoint Payroll Sources All Payroll Sources
 Checkpoint Payroll Sources All Payroll Sources Alabama Alaska Announcements Arizona Arkansas California Colorado Connecticut Source Foreign Account Tax Compliance Act ( FATCA ) Under Chapter 4 of the Code
Leading Economic Indicator Nebraska
 Nebraska Monthly Economic Indicators: July 29, 2016 Prepared by the UNL College of Business Administration, Department of Economics Authors: Dr. Eric Thompson, Dr. William Walstad Leading Economic Indicator...1
Emerging Trends in the U.S. and Colorado Economies
 Emerging Trends in the U.S. and Colorado Economies Sam Chapman Associate Economist Federal Reserve Bank of Kansas City Denver Branch The views expressed are those of the presenter and do not necessarily
Monthly Complaint Report
 August 2015 Monthly Complaint Report Vol. 2 Table of contents Table of contents... 1 1. Complaint volume... 2 1.1 Complaint volume by product... 3 1.2 Complaint volume by state... 7 1.3 Complaint volume
Economic Forecast January 2019
 Economic Forecast 2019 January 2019 ON THE ECONOMIC, BUSINESS AND POLITICAL CLIMATE Roger Tutterow, Ph.D. Coles College of Business Kennesaw State University rtuttero@kennesaw.edu Contributions To GDP
CBER Economic Indexes for Nevada and Southern Nevada
 CBER Economic Indexes for Nevada and Southern Nevada Published December 19, 2017 Stephen M. Miller, PhD, Director Nicolas Prada, M.A., Graduate Research Assistant Summary of CBER s Nevada Indexes Coincident
CBER Indexes for Nevada and Southern Nevada
 CBER Indexes for Nevada and Southern Nevada Published June 23, 2017 Stephen M. Miller, PhD, Director Nicolas Prada, Graduate Research Assistant Summary of CBER s Nevada Indexes Coincident Index (March)
ECONOMY AT A GLANCE. Figure 1. Leading indices. 1/18 2/18 3/18 4/18 5/18 6/18 7/18 8/18 9/18 10/1811/1812/18 1/19 Mississippi
 MARCH 2019 V OLUME 77, NUMBER 3 Inside this issue: Mississippi Leading Index, January 2019 National Trends 4 Mississippi Employment Trends Mississippi Population Trends A Publication of the University
Zions Bank Economic Overview
 Zions Bank Economic Overview Utah Institute of Real Estate Management Economic Summit September 12, 2017 National Economic Conditions August Job Indicators Indicator Expectation Actual Total Nonfarm Payrolls
Economic and Travel Indicator
 Economic and Travel Indicator February 216 If you have any questions, please contact: Economic and Labor Market Information Division 82-828-422 Labor.Lmi@vermont.gov Released April 4, 216 VERMONT ECONOMIC
Economic and Travel Indicator
 Economic and Travel Indicator 21 If you have any questions, please contact: Economic and Labor Market Information Division 82-828-422 Labor.Lmi@vermont.gov Released March, 22 216 VERMONT ECONOMIC AND TRAVEL
Illinois Job Index Note: BLS revised its estimates for the number of jobs and seasonal adjustment method at the beginning of 2010.
 Illinois Job Index Release Data Issue 4/21/2010 Jan 1990 / Mar 2010 Note: BLS revised its estimates for the number of jobs and seasonal adjustment method at the beginning of 2010. For April Illinois Job
Kentucky , ,349 55,446 95,337 91,006 2,427 1, ,349, ,306,236 5,176,360 2,867,000 1,462
 TABLE B MEMBERSHIP AND BENEFIT OPERATIONS OF STATE-ADMINISTERED EMPLOYEE RETIREMENT SYSTEMS, LAST MONTH OF FISCAL YEAR: MARCH 2003 Beneficiaries receiving periodic benefit payments Periodic benefit payments
Illinois Job Index. Growth Rate %
 Illinois Job Index Release Data Issue 03/14/2011 Jan 1990 / Jan 2011 2011.02 www.real.illinois.edu For January Illinois Job Index, the Nation, RMW and the state all had positive job growth. The monthly
C I T Y O F B O I S E
 C I T Y O F B O I S E D E P A R T M E N T O F F I N A N C E A N D A D M I N I S T R A T I O N Office of Budget Development & Monitoring Economic Brief Mike Sherack, Senior Budget Analyst & Brent Davis,
Old Dominion University 2017 Regional Economic Forecast. Strome College of Business
 Old Dominion University 2017 Regional Economic Forecast January 25, 2017 Professor Vinod Agarwal Director, Economic Forecasting Project Strome College of Business www.odu.edu/forecasting The views expressed
What Does the Unemployment Rate Indicate About the Weak Labor Market?
 What Does the Unemployment Rate Indicate About the Weak Labor Market? Testimony to the Subcommittee on Income Security and Family Support House Ways and Means Committee April 10, 2008 Rebecca M. Blank
Southwest Florida Regional Economic Indicators. May 2013
 Southwest Florida Regional Economic Indicators May 213 Regional Economic Research Institute Lutgert College Of Business Phone 239-59-7319 Florida Gulf Coast University 151 FGCU Blvd. South Fort Myers,
NCSL Midwest States Fiscal Leaders Forum. March 10, 2017
 NCSL Midwest States Fiscal Leaders Forum March 10, 2017 Public Pensions: 50-State Overview David Draine, Senior Officer Public Sector Retirement Systems Project The Pew Charitable Trusts More than 40 active,
Age of Insured Discount
 A discount may apply based on the age of the insured. The age of each insured shall be calculated as the policyholder s age as of the last day of the calendar year. The age of the named insured in the
our 2013 CFO Outlook.
 2013 CFO Outlook Annual Survey of U.S. Senior Financial Executives Forward Focus Will the post-election landscape create a path for growth? How will CFOs lead their businesses forward? See what s ahead
# of Credit Unions As of September 30, 2011
 # of Credit Unions # of Credit Unions # of Credit Unions As of September 30, 2011 8,400 8,200 8,000 7,800 7,600 7,400 7,200 8,332 8,065 7,794 7,556 7,325 7,000 6,800 9,000 8,000 7,000 6,000 5,000 4,000
Put in place to assist the unemployed or underemployed.
 By:Erin Sollund The federal government Put in place to assist the unemployed or underemployed. Medicaid, The Women, Infants, and Children (WIC) Program, and Aid to Families with Dependent Children (AFDC)
EMPLOYMENT COST INDEX MARCH 2011
 Transmission of material in this release is embargoed until 8:30 a.m. (EDT) Friday, April 29, USDL-11-0586 Technical information: Media contact: (202) 691-6199 NCSinfo@bls.gov www.bls.gov/ect (202) 691-5902
ECONOMY AT A GLANCE. n April the value of the Mississippi Leading Index (MLI) rose 0.3 percent as seen
 rose 0.3 percent as seen") JUNE 2018 V OLUME 76, NUMBER 6 Inside this issue: Mississippi Leading Index, April 2018 Mississippi Coincident Index, April 2018 National Trends 5 Mississippi Employment Trends Change in Mississippi Real
JUNE 2018 V OLUME 76, NUMBER 6 Inside this issue: Mississippi Leading Index, April 2018 Mississippi Coincident Index, April 2018 National Trends 5 Mississippi Employment Trends Change in Mississippi Real
STATE BOND COMMISSION DEPARTMENT OF TREASURY. March 15, 2018
 STATE BOND COMMISSION DEPARTMENT OF TREASURY March 15, 2018 1 Overview In accordance with the Comprehensive Capital Outlay Budget, cash lines of credit provide a mechanism to cash flow capital outlay projects
Department of Public Welfare (DPW)
") Department of Public Welfare (DPW) Office of Income Maintenance Electronic Benefits Transfer Card Risk Management Report Out-of-State Residency Review FISCAL YEAR 2014-2015 September 2014 (June, July and
Department of Public Welfare (DPW) Office of Income Maintenance Electronic Benefits Transfer Card Risk Management Report Out-of-State Residency Review FISCAL YEAR 2014-2015 September 2014 (June, July and
November 2018 Labor Market Review Reported by: Kent Sellers
 November 2018 Labor Market Review Reported by: Kent Sellers Regional Workforce Analyst Tel: 260-469-4313 Email Kent wsellers@dwd.in.gov Economic Growth Region 6 Statistical Data Report for November 2018,
Status of the Unemployment Trust Fund and Related Issues. Commission on Unemployment Compensation. Ellen Marie Hess, Commissioner.
 Status of the Unemployment Trust Fund and Related Issues Commission on Unemployment Compensation August 8, 2018 Ellen Marie Hess, Commissioner 2 Trust Fund Data Standard Forecast (Millions of Dollars)
STATE AND LOCAL TAXES A Comparison Across States
 STATE AND LOCAL TAXES A Comparison Across States INDEPENDENT FISCAL OFFICE FEBRUARY 2018 Methodology This report uses data from the U.S. Census Bureau, the Internal Revenue Service (IRS), the U.S. Bureau
Alabama New Construction Report December 2018
 Alabama New Construction Report December 2018 Single Family Permits* Current Month December 2018 786 December permits for new single family vs. Prior Month November 2018 984-20.1% housing units decreased
National Economic Conditions. Cheyenne AIA Meeting February 25th, 2011 Rob Godby
 National Economic Conditions Cheyenne AIA Meeting February 25th, 2011 Rob Godby Percent Change Recovery is Technically Underway 8 Quarter-Quarter Growth in Real GDP 6 4 2 0-2 -4-6 -8 I II III IV I II III
Paul Sommers Seattle University February 2009
 The Economy and the Regional Construction Market Paul Sommers Seattle University February 2009 Employment falling, financial market chaos continues Extraordinary policy measures taken by both the Fed and
Economic and Travel Indicator
 Economic and Travel Indicator If you have any questions, please contact: May 218 Economic and Labor Market Information Division 82-828-422 Released July 9, 218 Labor.Lmi@vermont.gov VERMONT ECONOMIC AND
Southwest Florida Regional Economic Indicators. August 2013
 Southwest Florida Regional Economic Indicators August 213 Regional Economic Research Institute Lutgert College Of Business Phone 239-59-7319 Florida Gulf Coast University 151 FGCU Blvd. South Fort Myers,
WikiLeaks Document Release
 WikiLeaks Document Release February 2, 2009 Congressional Research Service Report 98-972 Federal Employee Retirement Programs: Summary of Recent Trends Patrick J. Purcell, Domestic Social Policy Division
NASRA Issue Brief: Employee Contributions to Public Pension Plans
 NASRA Issue Brief: Employee Contributions to Public Pension Plans September 2017 Unlike in the private sector, nearly all employees of state and local government are required to share in the cost of their
Economic Trends, Challenges, and Opportunities Affecting the P/C and Surety LOB
 Economic Trends, Challenges, and Opportunities Affecting the P/C and Surety LOB New Jersey Surety Association September 13, 2012 Steven N. Weisbart, Ph.D., CLU, Senior Vice President & Chief Economist
Special Report. Sources of Health Insurance and Characteristics of the Uninsured EBRI EMPLOYEE BENEFIT RESEARCH INSTITUTE
 January 1993 Jan. Feb. Sources of Health Insurance and Characteristics of the Uninsured Analysis of the March 1992 Current Population Survey Mar. Apr. May Jun. Jul. Aug. EBRI EMPLOYEE BENEFIT RESEARCH
An Economic & Commercial Real Estate Forecast
 WEDNESDAY, NOVEMBER 14, 2018 An Economic & Commercial Real Estate Forecast Presented by: Matthew Gardner CHIEF ECONOMIST WINDERMERE REAL ESTATE So Where are We Headed? The Global Economy Global Growth
CBER Economic Indexes for Nevada and Southern Nevada
 CBER Economic Indexes for Nevada and Southern Nevada Published November 14, 2018 Stephen M. Miller, PhD, Director Hasara Rathnasekara, Graduate Research Assistant Summary of CBER s Nevada Indexes Coincident
Economic Outlook and Housing Market Forecast
 Economic Outlook and Housing Market Forecast NVAR Housing Finance Summit Terry L, Clower, Ph.D. Director, Center for Regional Analysis Schar School of Policy and Government George Mason University May
The U.S. and California Is The Recovery Here at Last? UCLA Anderson School of
 The U.S. and California Is The Recovery Here at Last? Jerry Nickelsburg Senior Economist UCLA Anderson Forecast State of the County January 20, 2010 SEPTEMBER 2008 In September 2008 Financial Markets Stopped
Growth. Total non-farm Positive Nation , ,008,000
 Employment May 2007 Jun 2007 Growth Number of Growth Last 12 months Number of Jobs Total non-farm June 2007 employment Rate % Jobs Rate % Positive Nation +0.10 +132,000 +1.48 +2,008,000 RMW* +0.11 +21,300-0.03-6,400
July 2018 Labor Market Review Reported by: Cassie Janes
 July 2018 Labor Market Review Reported by: Cassie Janes Regional Workforce Analyst Tel: 765-454-4760 Email Cassie cjanes@dwd.in.gov Economic Growth Region 8 Statistical Data Report for July 2018, Released
Indicators of the Kansas Economy
 Governor s Council of Economic Advisors Indicators of the Kansas Economy A Review of Economic Trends and the Kansas Economy 1000 S.W. Jackson St. Suite 100 Topeka, KS 66612-1354 Phone: (785) 296-0967 Fax:
MAGAZINE Publisher s Statement Six months ended June 30, 2013 Subject to Audit
 MAGAZINE Publisher s Statement Six months ended June 30, 2013 Subject to Audit Field Served: The video/computer game consumer market. Published by Sunrise Publications, Inc. Frequency: 12 times/year 1.
Sales Tax Return Filing Thresholds by State
 Thanks to R&M Consulting for assistance in putting this together Sales Tax Return Filing Thresholds by State State Alabama Alaska Arizona Arkansas California Colorado Connecticut Delaware Filing Thresholds
Economic and Travel Indicator
 Economic and Travel Indicator If you have any questions, please contact: Nov 218 Economic and Labor Market Information Division Released Jan 2, 219 82-828-422 Labor.Lmi@vermont.gov VERMONT ECONOMIC AND