LAMPIRAN 1 ETHICAL CLEARANCE
|
|
|
- Ashley Baker
- 6 years ago
- Views:
Transcription
1 LAMPIRAN 1 ETHICAL CLEARANCE
2 LAMPIRAN 2 INFORMED CONSENT
3
4 LAMPIRAN 3 LAPORAN HARIAN PASIEN HIV
5 LAMPIRAN 4 SURAT PERIZINAN PENELITIAN DARI UNIVERSITAS GADJAH MADA
 Sample Name: 1 Date Acquired: Fri, Oct 17, 2014 10:27 AM Sample ID: 1017.")
: 4 CD3/CD4/CD45 Reagent Lot ID: 17226 Events Acquired: 10000 Data Set [ 1 ] Data File: 101.01 Attr Def File: 3/4/45 Tri v2.")

6 LAMPIRAN 5 ANALISIS HASIL LABORATORIUM Director: Operator: BAG.PATOLOGI KLINIK FK-UGM (0274) Prof. dr. Budi Mulyono MM. SpPK-K farid-elfaraby MultiSET Lab Report Software: Cytometer: MultiSET V1.1.2 FACSCalibur (#E5446) Sample Name: 1 Date Acquired: Fri, Oct 17, :27 AM Sample ID: Date Analyzed: Fri, Oct 17, 2014 Case Number: 1 Ref. Range Type: BD Panel Name: CD4/CD8 DUAL User Inputs: WBC (x1000): 6.0 Lymphs (%): 4 CD3/CD4/CD45 Reagent Lot ID: Events Acquired: Data Set [ 1 ] Data File: Attr Def File: 3/4/45 Tri v2.0 Lymph Events 4813 CD3+ %Lymph 64 CD3+ Abs Cnt 1864 CD3+CD4+ %Lymph 18 Lo CD3+CD4+ Abs Cnt 530 CD45+ Abs Cnt 2922 QC Messages: Code 4: The CD3+CD4+ %Lymph value lies outside the normal reference range. Code 7: Manual Gate is in effect. CD3/CD8/CD45 Reagent Lot ID: Events Acquired: Data Set [ 1 ] Data File: Attr Def File: 3/8/45 Tri v2.0 Lymph Events 5219 CD3+ %Lymph 64 CD3+ Abs Cnt 1882 CD3+CD8+ %Lymph 41 CD3+CD8+ Abs Cnt 1210 Hi CD45+ Abs Cnt 2922 Multi-tube QC Sample ID: Case Number: Panel Name: CD3 % Lymph Difference: CD3 Abs Cnt Range: T Helper/Suppressor Ratio:
7 LAMPIRAN 6 ANALISIS STATISTIK A. Hasil Pemeriksaan Laboratorium Kelompok EKBM kelompok ekstrak kulit buah manggis kode CD4 IL2 CD8 CD38 NK cell IFN sample pre post pre post pre post pre post pre post pre post ,44 5, ,09 6, ,78 3, ,082 16, ,28 5, ,01 1, ,9 66, ,12 8, ,4 18, ,15 30, ,6 7, ,4 13, ,53 7, , ,78 2, ,78 10, ,06 11, ,54 0, ,9 11, ,4 5, ,63 10, ,3 25, ,63 2, ,3 6, ,26 9, ,57 6, ,16 8, ,05 9, ,95 3, ,86 87, ,47 19, ,67 9, ,32 5, ,52 6, ,48 2, ,32 3, ,04 7, ,04 7, ,32 4, ,53 79, ,65 4, ,1 12, ,7 9, ,6 3, ,47 19, ,4 96, ,16 11, ,63 5, ,94 3, ,11 17, ,24 10, ,22 11, ,11 6, ,55 12, ,53 9, ,32 6, ,71 7, ,41 8, ,55 1, ,71 6,55 B. Hasil Pemeriksaan Laboratorium Kelompok Placebo kelompok placebo kode CD4 IL2 CD8 CD38 NK cell IFN sample pre post pre post pre post pre post pre post pre post ,04 0, ,19 3, ,93 3, ,44 16, ,4 56, ,24 11, ,51 11, ,22 15, ,08 2, ,5 9, , ,32 5, ,46 43, ,53 7, ,55 0, ,87 27, ,54 7, ,4 0, ,94 4, ,17 9, ,01 13, ,96 12, ,02 4, ,85 8, ,96 33, ,79 4, , ,79 6, ,57 64, ,41 1, ,82 6, ,02 5, , ,69 5, ,94 48, ,84 10, ,53 2, ,16 1, ,96 2, ,29 3, ,45 2, ,02 4, ,54 4, ,07 67, ,29 8, ,35 3, ,7 0, ,88 13, ,23 3, ,17 9, ,59 14, ,16 16, ,63 25, ,61 12, ,93 7, ,78 27, ,39 20, ,29 8, ,34 18,45
8 C. Limfosit T CD4+ Case Processing Summary precd4 postcd4 treatment Cases Valid Missing Total N Percent N Percent N Percent Ekstrak ,0% 0 0,0% ,0% Plasebo ,0% 0 0,0% ,0% Ekstrak ,0% 0 0,0% ,0% Plasebo ,0% 0 0,0% ,0% Tests of Normality treatment Kolmogorov-Smirnov a Shapiro-Wilk Statistic df Sig. Statistic df Sig. precd4 Ekstrak,093 20,200 *,960 20,536 Plasebo,121 20,200 *,960 20,551 postcd4 Ekstrak,117 20,200 *,970 20,749 Plasebo,138 20,200 *,958 20,513 *. This is a lower bound of the true significance. a. Lilliefors Significance Correction Paired T Test Paired Samples Statistics Treatment N Std. Deviation Std. Error Ekstrak Pair 1 precd4 373, , ,43103 postcd4 401, , ,20214 Plasebo Pair 1 precd4 438, , ,52939 postcd4 492, , ,89109 Paired Samples Correlations treatment N Correlation Sig. Ekstrak Pair 1 precd4 & postcd4 20,850,000 Plasebo Pair 1 precd4 & postcd4 20,940,000 Paired Samples Test treatment Paired Differences t df Sig. (2- Std. Deviation Std. Error 95% Confidence Interval of the Difference tailed) Lower Upper Ekstra Pair 1 precd , , , , , ,553 19,137 k Plase bo Pair 1 postcd4 precd4 - postcd4-54, , , , , ,482 19,002 Ranks treatment N Rank Sum of Ranks Ekstrak 20 18,73 374,50 precd4 Plasebo 20 22,28 445,50 Total 40 Ekstrak 20 18,40 368,00 postcd4 Plasebo 20 22,60 452,00 Total 40 Test Statistics a precd4 postcd4 Mann-Whitney U 164, ,000 Wilcoxon W 374, ,000 Z -,960-1,136 Asymp. Sig. (2-tailed),337,256 Exact Sig. [2*(1-tailed Sig.)],341 b,265 b a. Grouping Variable: treatment b. Not corrected for ties.
9 precd4 postcd4 Descriptives Treatment Statistic Std. Error 373, ,43103 Ekstrak Plasebo Ekstrak Plasebo 95% Confidence Interval for Lower Bound 314,4432 Upper Bound 433,4568 5% Trimmed 380,2778 Median 389,5000 Variance 16166,471 Std. Deviation 127,14744 Minimum 44,00 Maximum 590,00 Range 546,00 Interquartile Range 181,25 Skewness -,757,512 Kurtosis 1,044, , , % Confidence Interval for Lower Bound 361,8931 Upper Bound 514,8069 5% Trimmed 435,0556 Median 401,0000 Variance 26687,924 Std. Deviation 163,36439 Minimum 191,00 Maximum 745,00 Range 554,00 Interquartile Range 242,50 Skewness,329,512 Kurtosis -,802, , , % Confidence Interval for Lower Bound 330,3641 Upper Bound 473,5359 5% Trimmed 407,8333 Median 383,0000 Variance 23395,734 Std. Deviation 152,95664 Minimum 43,00 Maximum 655,00 Range 612,00 Interquartile Range 203,75 Skewness -,468,512 Kurtosis,105, , , % Confidence Interval for Lower Bound 400,9849 Upper Bound 584,7151 5% Trimmed 486,7778 Median 450,0000 Variance 38528,555 Std. Deviation 196,28692 Minimum 194,00 Maximum 901,00 Range 707,00 Interquartile Range 280,75 Skewness,535,512 Kurtosis -,266,992
10 D. Kadar IL-2 Case Processing Summary treatment Cases Valid Missing Total N Percent N Percent N Percent preil2 Ekstrak ,0% 0 0,0% ,0% Plasebo ,0% 0 0,0% ,0% postil2 Ekstrak ,0% 0 0,0% ,0% Plasebo ,0% 0 0,0% ,0% Wilcoxon test IL-2 Tests of Normality treatment Kolmogorov-Smirnov a Shapiro-Wilk Statistic df Sig. Statistic df Sig. preil2 Ekstrak,229 20,007,734 20,000 Plasebo,181 20,084,902 20,044 postil2 Ekstrak,309 20,000,654 20,000 Plasebo,176 20,106,890 20,026 a. Lilliefors Significance Correction Ranks Treatment N Rank Sum of Ranks Negative Ranks 12 a 10,25 123,00 Ekstrak postil2 - preil2 Positive Ranks 7 b 9,57 67,00 Ties 1 c Total 20 Negative Ranks 17 a 10,35 176,00 Plasebo postil2 - preil2 Positive Ranks 3 b 11,33 34,00 Ties 0 c Total 20 a. postil2 < preil2 b. postil2 > preil2 c. postil2 = preil2 Test Statistics a treatment postil2 - preil2 Z -1,127 b Ekstrak Asymp. Sig. (2-tailed),260 Z -2,651 b Plasebo Asymp. Sig. (2-tailed),008 a. Wilcoxon Signed Ranks Test b. Based on positive ranks. Ranks treatment N Rank Sum of Ranks Ekstrak 20 19,13 382,50 preil2 Plasebo 20 21,88 437,50 Total 40 Ekstrak 20 20,88 417,50 postil2 Plasebo 20 20,13 402,50 Total 40 Test Statistics a preil2 postil2 Mann-Whitney U 172, ,500 Wilcoxon W 382, ,500 Z -,744 -,203 Asymp. Sig. (2-tailed),457,839 Exact Sig. [2*(1-tailed Sig.)],461 b,841 b a. Grouping Variable: treatment b. Not corrected for ties.
11 preil2 postil2 Descriptives Treatment Statistic Std. Error 26,7576 7,36085 Ekstrak Plasebo Ekstrak Plasebo 95% Confidence Interval for Lower Bound 11,3512 Upper Bound 42,1640 5% Trimmed 22,3150 Median 15,9000 Variance 1083,643 Std. Deviation 32,91873 Minimum,08 Maximum 133,40 Range 133,32 Interquartile Range 27,29 Skewness 2,257,512 Kurtosis 5,478,992 22,9335 3, % Confidence Interval for Lower Bound 16,2320 Upper Bound 29,6350 5% Trimmed 22,1322 Median 20,5000 Variance 205,033 Std. Deviation 14,31896 Minimum 3,41 Maximum 56,88 Range 53,47 Interquartile Range 16,63 Skewness 1,069,512 Kurtosis 1,283,992 22,1435 5, % Confidence Interval for Lower Bound 9,7140 Upper Bound 34,5730 5% Trimmed 19,0711 Median 9,9600 Variance 705,324 Std. Deviation 26,55795 Minimum 3,42 Maximum 96,17 Range 92,75 Interquartile Range 16,39 Skewness 2,011,512 Kurtosis 3,030,992 13,7420 2, % Confidence Interval for Lower Bound 8,7102 Upper Bound 18,7738 5% Trimmed 12,8667 Median 11,7800 Variance 115,590 Std. Deviation 10,75128 Minimum,05 Maximum 43,19 Range 43,14 Interquartile Range 11,70 Skewness 1,343,512 Kurtosis 1,994,992
12 E. Uji korelasi Spearman pretest dan posttest antara kedua kelompok Correlations treatment precd4 postcd4 preil2 postil2 Correlation Coefficient 1,000,819 ** -,174 -,122 precd4 Sig. (2-tailed).,000,464,609 N Correlation Coefficient,819 ** 1,000,038 -,295 postcd4 Sig. (2-tailed),000.,874,207 Ekstrak N Correlation Coefficient -,174,038 1,000,098 preil2 Sig. (2-tailed),464,874.,680 N Correlation Coefficient -,122 -,295,098 1,000 postil2 Sig. (2-tailed),609,207,680. Spearman's rho N Correlation Coefficient 1,000,919 **,025 -,152 precd4 Sig. (2-tailed).,000,917,523 N Correlation Coefficient,919 ** 1,000,060,036 postcd4 Sig. (2-tailed),000.,801,880 Plasebo N Correlation Coefficient,025,060 1,000,256 preil2 Sig. (2-tailed),917,801.,276 N Correlation Coefficient -,152,036,256 1,000 postil2 Sig. (2-tailed),523,880,276. N **. Correlation is significant at the 0.01 level (2-tailed). Korelasi antara jumlah limfosit T CD4 dan IL-2 terhadap kelompok ekstrak dan placebo Spearman's rho Correlations treatment precd4 preil2 Correlation Coefficient 1,000 -,249 precd4 Sig. (2-tailed).,121 Ekstrak N Correlation Coefficient -,249 1,000 preil2 Sig. (2-tailed),121. N Correlation Coefficient 1,000 -,018 precd4 Sig. (2-tailed).,912 Plasebo N Correlation Coefficient -,018 1,000 preil2 Sig. (2-tailed),912. N 40 40


13 LAMPIRAN 7 FOTO KEGIATAN A. Persiapan Ekstrak dan Placebo Foto Ekstrak dan Placebo Persiapan pengemasan ekstrak dan placebo B. Label dengan metode Double Blind Randomize control trial


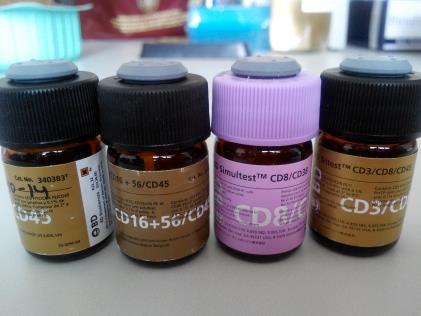
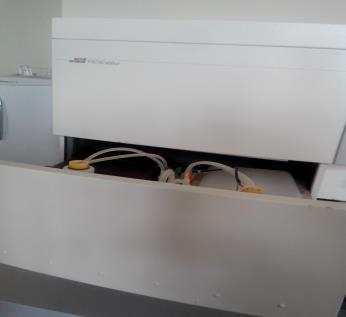

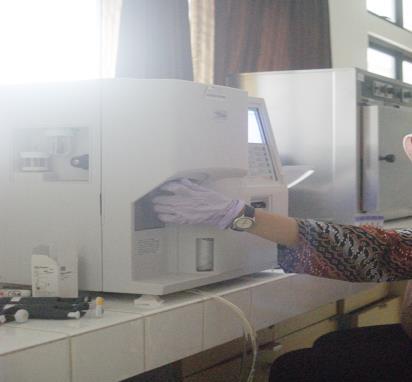
14 C. Alat dan bahan Alat centrifugasi Alat yang sudah disterilisasi Vortex Icepack untuk membawa sampel darah ke UGM Reagen untuk CD4+ FACS calibur Flourescence Activated Cell Sorting (FACS) Pemeriksaan HB


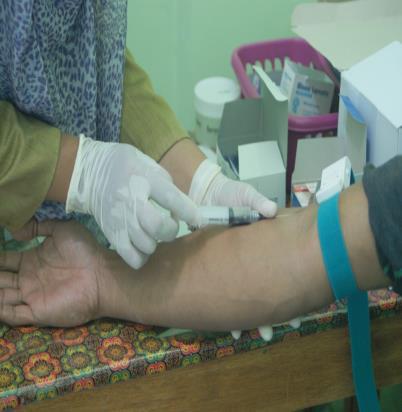

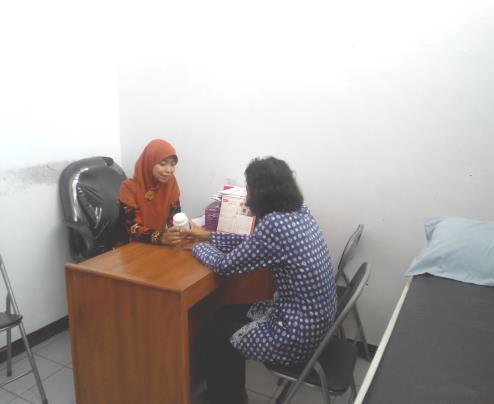


15 D. Pengambilan darah Persiapan Alat dan Bahan Persiapan alat untuk dibawa saat pengambilan darah Pemeriksaan Fisik Vaccutainer Pemberian EKBM pada Pasien

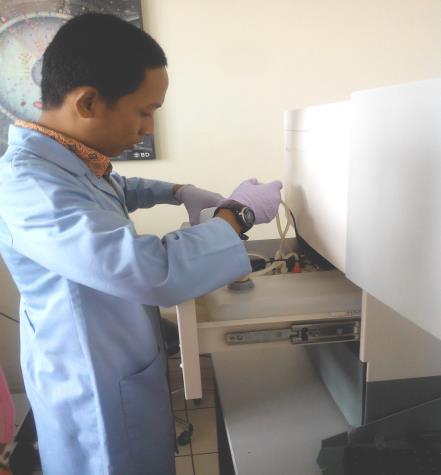


16 E. Pemeriksaan laboratorium UGM Foto Peneliti dan Analis


17 F. Foto peneliti bersama pembimbing dan penguji G. Foto peneliti dan Tim medis dari klinik seroja RSUD.Gunung Jati Cirebon
GGraph. Males Only. Premium. Experience. GGraph. Gender. 1 0: R 2 Linear = : R 2 Linear = Page 1
 GGraph 9 Gender : R Linear =.43 : R Linear =.769 8 7 6 5 4 3 5 5 Males Only GGraph Page R Linear =.43 R Loess 9 8 7 6 5 4 5 5 Explore Case Processing Summary Cases Valid Missing Total N Percent N Percent
LAMPIRAN 1. adalah 26,7 %. Jumlah energi 1 gr Lemak = 9 Kkal. Perhitungan asam lemak trans 5 % = 26,7 % X 84,425 gr X 9 Kkal/gr = 202,86
 LAMPIRAN 1 Komposisi diet hewan coba (Sumber Research Diets Inc, 21 Oktober 2011 ) Komponen pangan Jumlah gm % kcal % gm % kcal % Protein 24 20 24 20 Carbohydrate 41 35 41 35 Fat 24 45 24 45 Total 100
Valid Missing Total. N Percent N Percent N Percent , ,0% 0,0% 2 100,0% 1, ,0% 0,0% 2 100,0% 2, ,0% 0,0% 5 100,0%
 dimension1 GET FILE= validacaonestscoremédico.sav' (só com os 59 doentes) /COMPRESSED. SORT CASES BY UMcpEVA (D). EXAMINE VARIABLES=UMcpEVA BY NoRespostasSignif /PLOT BOXPLOT HISTOGRAM NPPLOT /COMPARE
HASIL PENELITIAN BERUPA OUTPUT SPSS
 VARIABEL INDEPENDEN HASIL PENELITIAN BERUPA OUTPUT SPSS 1. RATA-RATA ASUPAN ENERGI UJI NORMALITAS DATA Rata2AsupanE 70 100.0% 0.0% 70 100.0% Descriptives Rata2AsupanE 1375.77 44.068 Lower Bound 1287.85
LAMPIRAN 1: OUTPUT SPSS
 LAMPIRAN : OUTPUT SPSS Statistik Deskriptif Descriptive Statistics N Minimum Maximum Mean Std. Deviation Daabs 95.0022.0902.03744.0226569 CAR 95.0789.339.43306.0463305 RORA 95 -.447.8074.052244.29802 ROA
LAMPIRAN IV PENGUJIAN HIPOTESIS
 LAMPIRAN IV PENGUJIAN HIPOTESIS 89 NORMALITAS I Explore Case Processing Summary Cases Valid Missing Total N Percent N Percent N Percent 390 00.0% 0.0% 390 00.0% Descriptives Mean 95% Confidence Interval
SPSS t tests (and NP Equivalent)
") SPSS t tests (and NP Equivalent) Descriptive Statistics To get all the descriptive statistics you need: Analyze > Descriptive Statistics>Explore. Enter the IV into the Factor list and the DV into the Dependent
SPSS t tests (and NP Equivalent) Descriptive Statistics To get all the descriptive statistics you need: Analyze > Descriptive Statistics>Explore. Enter the IV into the Factor list and the DV into the Dependent
Table of Contents. New to the Second Edition... Chapter 1: Introduction : Social Research...
 iii Table of Contents Preface... xiii Purpose... xiii Outline of Chapters... xiv New to the Second Edition... xvii Acknowledgements... xviii Chapter 1: Introduction... 1 1.1: Social Research... 1 Introduction...
Lampiran 1 Lampiran 1 Data Keuangan Bank konvensional
 Lampiran 1 Lampiran 1 Data Keuangan Bank konvensional BANK YEAR Z-Score TOTAL ASET (milyar rupiah) ROA (%) NPL (%) BI RATE (%) KURS (rupiah) BNI 1.9 5.51.9 1.9.5 919.5 11 7.71 99.5.9.17 915.7 1 7.7 333.3.9.
Daftar Perusahaan yang Mengadopsi ESOP pada periode Tahun pengadopsian ESOP
 Lampiran 1 Daftar Perusahaan yang Mengadopsi ESOP pada periode 2004-2012 No. Daftar Emiten Tahun pengadopsian ESOP Jenis 1 ADHI 2004 Employee Stock 2 BBRI 2004 Employee Stock 3 BMRI 2004 Employee Stock
Technology Arts Sciences Cologne Faculty of Economics, Business and Law Prof. Dr. Arrenberg Room 221, Tel
 Technology Arts Sciences Cologne Faculty of Economics, Business and Law Prof. Dr. Arrenberg Room 221, Tel. 39 14 jutta.arrenberg@th-koeln.de Exercises Quantitative Methods Worksheet: Goodness-of-fit Test
Two-Sample T-Test for Superiority by a Margin
 Chapter 219 Two-Sample T-Test for Superiority by a Margin Introduction This procedure provides reports for making inference about the superiority of a treatment mean compared to a control mean from data
Two-Sample T-Test for Non-Inferiority
 Chapter 198 Two-Sample T-Test for Non-Inferiority Introduction This procedure provides reports for making inference about the non-inferiority of a treatment mean compared to a control mean from data taken
Descriptive Analysis
 Descriptive Analysis HERTANTO WAHYU SUBAGIO Univariate Analysis Univariate analysis involves the examination across cases of one variable at a time. There are three major characteristics of a single variable
Lintang Prathama Puteri Mochammad Al Musadieq Faculty of Administrative Science Brawijaya University Malang
 ANALYSIS OF DIFFERENCES ON ABNORMAL RETURN AND TRADING VOLUME ACTIVITY (TVA) BECAUSE OF INNCREASING CIGARETTE PRICE (Study at stocks listed in LQ-45 index on August 2016-January 2017) Lintang Prathama
Analysis of 2x2 Cross-Over Designs using T-Tests for Non-Inferiority
 Chapter 235 Analysis of 2x2 Cross-Over Designs using -ests for Non-Inferiority Introduction his procedure analyzes data from a two-treatment, two-period (2x2) cross-over design where the goal is to demonstrate
iskills & Proficiency Profile (PP) Report
 Report") 1 iskills & Proficiency Profile (PP) Report Descriptive Statistics & Correlations Report Submitted: Aug 17, 2011 Perry Deess, Director, Institutional Research & Planning orbert Elliot, Chair, Middle States
1 iskills & Proficiency Profile (PP) Report Descriptive Statistics & Correlations Report Submitted: Aug 17, 2011 Perry Deess, Director, Institutional Research & Planning orbert Elliot, Chair, Middle States
Do Incumbents 22 Utilise Local Government Budgets in Their Renomination in Regional General Election? Evidence from Indonesia
 Do Incumbents 22 Utilise Local Government Budgets in Their Renomination in Regional General Election? Evidence from Indonesia Irwan Taufiq Ritonga 23, Lecturer at Department of Accounting, Faculty of Economics
Sales Sales
 lix Lampiran I PT. Akasha Wira International Tbk PT. Tiga Pilar Sejahtera Food Tbk PT. Cahaya Kalbar Tbk 2010 2009 2008 2007 2010 2009 2008 2007 2010 2009 2008 2007 Sales 219 134 130 132 705 533 489 484
Tabel Penentuan Sampel Penelitian
 LAMPIRAN I No Tabel Penentuan Sampel Penelitian Emiten Kriteria 1 2 3 Sampel 1. Astra Agro Lestari Tbk. 1 2. Adaro Energy Tbk. 3. Aneka Tambang (Persero) Tbk. 2 4. Astra Internasional Tbk. 3 5. Alam Sutera
OLAH DATA INSTRUMEN PENELITIAN DENGAN SPSS VERSI 16.0
 OLAH DATA INSTRUMEN PENELITIAN DENGAN SPSS VERSI 16.0 DESKRIPTIF Variabel Customer Relationship Marketing Descriptive Statistics N Minimum Maximum Sum Mean Std. Deviation Skewness Kurtosis Statistic Statistic
ANALYSIS OF RIGHT ISSUE ANNOUNCEMENT EFFECT TOWARD STOCK PRICE MOVEMENT AND STOCK TRADING VOLUME WITHIN ISSUER IN INDONESIA STOCK EXCHANGE
 Binus Business Review, 7(1), May 2016, 33-38 DOI: 10.21512/bbr.v7i1.1447 P-ISSN: 2087-1228 E-ISSN: 2476-9053 ANALYSIS OF RIGHT ISSUE ANNOUNCEMENT EFFECT TOWARD STOCK PRICE MOVEMENT AND STOCK TRADING VOLUME
Ceria Minati Singarimbun and Ana Noveria School of Business and Management Institut Teknologi Bandung, Indonesia
 JOURNAL OF BUSINESS AND MANAGEMENT Vol. 3, No.4, 2014: 401-409 THE RELATIONSHIP AMONG OIL PRICES, GOLD PRICES, GROSS DOMESTIC PRODUCT, AND INTEREST RATE TO THE STOCK MARKET RETURN OF BASIC INDUSTRY AND
Lampiran 1 Data Efektivits BPHTB
 Lampiran 1 Data Efektivits BPHTB No Kecamatan Semester 1 Tahun 2011 Semester 2 Tahun 2011 Semester 1 Tahun 2012 Semester 2 Tahun 2012 Realisasi Potensi % Realisasi Potensi % Realisasi Potensi % Realisasi
LAMPIRAN PERHITUNGAN EVIEWS
 LAMPIRAN PERHITUNGAN EVIEWS DESCRIPTIVE PK PDRB TP TKM Mean 12.22450 10.16048 14.02443 12.63677 Median 12.41945 10.09179 14.22736 12.61400 Maximum 13.53955 12.73508 15.62581 13.16721 Minimum 10.34509 8.579417
One Way ANOVA with Tukey Post hoc. Case Processing Summary
 EXAMINE VARIABLES=Score BY Group /PLOT BOXPLOT NPPLOT /COMPARE GROUP /STATISTICS DESCRIPTIVES /CINTERVAL 95 /MISSING LISTWISE /NOTOTAL. Explore Group One Way ANOVA with Tukey Post hoc Case Processing Summary
1 Exercise One. 1.1 Calculate the mean ROI. Note that the data is not grouped! Below you find the raw data in tabular form:
 1 Exercise One Note that the data is not grouped! 1.1 Calculate the mean ROI Below you find the raw data in tabular form: Obs Data 1 18.5 2 18.6 3 17.4 4 12.2 5 19.7 6 5.6 7 7.7 8 9.8 9 19.9 10 9.9 11
2018 AAPM: Normal and non normal distributions: Why understanding distributions are important when designing experiments and analyzing data
 Statistical Failings that Keep Us All in the Dark Normal and non normal distributions: Why understanding distributions are important when designing experiments and Conflict of Interest Disclosure I have
DWI WINDARIH* TAUFIQ RIDWAN R Universitas Gadjah Mada
 THE INDONESIAN JOURNAL OF ACCOUNTING RESEARCH Vol. 20, No. 2, May 2017 Page 259-282 Analysis of the Relationship between Quality of Financial Statements Review and Audit Findings on the Local Government
Exploratory Data Analysis (EDA)
") Exploratory Data Analysis (EDA) Introduction A Need to Explore Your Data The first step of data analysis should always be a detailed examination of the data. The examination of your data is called Exploratory
Exploratory Data Analysis (EDA) Introduction A Need to Explore Your Data The first step of data analysis should always be a detailed examination of the data. The examination of your data is called Exploratory
LAMPIRAN. TAHUN TANGGAL Return Pasar
 LAMPIRAN Lampiran 1 : Return Pasar (IHSG) TAHUN TANGGAL Return Pasar 2013 2014 Januari 0,032 Februari 0,077 Maret 0,030 April 0,019 Mei 0,007 Juni -0,049 Juli -0,043 Agustus -0,090 September 0,029 Oktober
THE IMPACT OF WEBSITE QUALITY ON REPURCHASE INTENTION MEDIATED BY PERCEIVED TRUST AND PERCEIVED VALUE IN THE CASE OF TOKOPEDIA IN SURABAYA
 THE IMPACT OF WEBSITE QUALITY ON REPURCHASE INTENTION MEDIATED BY PERCEIVED TRUST AND PERCEIVED VALUE IN THE CASE OF TOKOPEDIA IN SURABAYA BY: LEONARDUS ADRIAN 3303014019 INTERNATIONAL BUSINESS MANAGEMENT
Gilang Ramadhan Fajri Lecturer at Politeknik BBC, Sukabumi
 Research. THE IMPACT OF THE FINANCIAL RATIOS AS THE MEASUREMENT UPON THE PERFORMANCE OF RETURN ON ASSETS AT THE PUBLIC BANKS IN INDONESIA (The Empiric Study upon The Gilang Ramadhan Fajri Lecturer at Politeknik
LAMPIRAN. Universitas Sumatera Utara
 LAMPIRAN 99 Lampiran 1 Daftar Sampel Penelitian No Kode Nama Reksadana Tanggal Diluncurkan 1 BIIDINA AXA Citradinamis 05-08-1997 2 NISP Abeerdeen Indonesia Equity Fund 27-12-2007 3 000D1B BNI-AM Dana Berkembang
Lampiran 1. Daftar sampel bank konvensional dan bank syariah. Bank Mandiri Syariah
 82 Lampiran 1 Daftar sampel bank konvensional dan bank syariah BANK KONVENSIONAL Bank Mandiri Bank BRI Bank BNI Bank BUKOPIN Bank BCA BANK SYARIAH Bank Mega Syariah Bank BRI Syariah Bank Mandiri Syariah
Lampiran 1 : Grafik Data HIV Asli
 Lampiran 1 : Grafik Data HIV Asli 70 60 50 Penderita 40 30 20 10 2007 2008 2009 2010 2011 Tahun HIV Mean 34.15000 Median 31.50000 Maximum 60.00000 Minimum 19.00000 Std. Dev. 10.45057 Skewness 0.584866
Financial Time Series and Their Characteristics
 Financial Time Series and Their Characteristics Egon Zakrajšek Division of Monetary Affairs Federal Reserve Board Summer School in Financial Mathematics Faculty of Mathematics & Physics University of Ljubljana
Real earnings management of operation before and after the implementation of IFRS using cash flow measurement approach
 The Indonesian Accounting Review Vol. 5, No. 1, January June 2015, pages 55 62 Real earnings management of operation before and after the implementation of IFRS using cash flow measurement approach Tiara
EFFECT OF LISTING AND DELISTING FROM LQ45 INDEX TOWARDS PRICE OF A STOCK: A STUDY FROM INDONESIA STOCK EXCHANGE
 ICEBESS 2016 Proceeding EFFECT OF LISTING AND DELISTING FROM LQ45 INDEX TOWARDS PRICE OF A STOCK: A STUDY FROM INDONESIA STOCK EXCHANGE Adrian Etantyo 1, Asep Darmansyah 1 1 Bandung Institute of Technology,
Raditya Pratama Accounting Study Program, Faculty of Business Universitas Presiden, Cikarang, Indonesia
 18 JAAF (Journal of Applied Accounting and Finance) Volume 2, Number 1, 2018, 18-35 The Analysis of Company Size, Complexity of Operation, Profitability, Solvency and Audit Firm Size toward Timeliness
Lampiran 1. Tabulasi Data
 Lampiran 1. Tabulasi Data Tahun PDRB PDRBt-1 PAD BH DAU INF 2001:1 372696.65 372696.65 1005.61 2684.67 26072.42 0.87 2001:4 376433.52 372696.65 1000.96 2858.50 28795.27 1.08 2001:8 387533.83 376433.52
Contents Part I Descriptive Statistics 1 Introduction and Framework Population, Sample, and Observations Variables Quali
 Part I Descriptive Statistics 1 Introduction and Framework... 3 1.1 Population, Sample, and Observations... 3 1.2 Variables.... 4 1.2.1 Qualitative and Quantitative Variables.... 5 1.2.2 Discrete and Continuous
LAMPIRAN. Lampiran I
 67 LAMPIRAN Lampiran I Data Volume Impor Jagung Indonesia, Harga Impor Jagung, Produksi Jagung Nasional, Nilai Tukar Rupiah/USD, Produk Domestik Bruto (PDB) per kapita Tahun Y X1 X2 X3 X4 1995 969193.394
LAMPIRAN-LAMPIRAN. A. Perhitungan Return On Asset
 88 LAMPIRAN-LAMPIRAN A. Perhitungan Return On Asset Tahun Perusahaan Laba Bersih Total Aset Laba/Total Aset ROA (% ) 2011 ROA_ADRO 5006470 51315458 0,09756261 9,76 ROA_AKRA 2284080 8308244 0,274917299
Program Studi Akuntansi, Fakultas Ekonomi, Universitas Atma Jaya. Yogyakarta. Jalan Babarsari 43-44, Yogyakarta
 THE ADOPTION OF IFRS AND EARNINGS QUALITY OF INDONESIA REAL ESTATE, PROPERTY AND BUILDING CONSTRUCTION COMPANIES Written by: A Vendix Christo Dewa S Jenjang Sri Lestari Program Studi Akuntansi, Fakultas
INFLUENCE OF APPLICATON INCOME TAX LAW NUMBER 36/2008 ON THE LEVEL OF RETURN ON INVESTMENT (ROI) IN LISTED COMPANIES ON INDONESIA STOCK EXCHANGE (BEI)
 IN LISTED COMPANIES ON INDONESIA STOCK EXCHANGE (BEI)") INFLUENCE OF APPLICATON INCOME TAX LAW NUMBER 36/2008 ON THE LEVEL OF RETURN ON INVESTMENT (ROI) IN LISTED COMPANIES ON INDONESIA STOCK EXCHANGE (BEI) Diana Sari Lecturer of Faculty Economy at Widyatama
INFLUENCE OF APPLICATON INCOME TAX LAW NUMBER 36/2008 ON THE LEVEL OF RETURN ON INVESTMENT (ROI) IN LISTED COMPANIES ON INDONESIA STOCK EXCHANGE (BEI) Diana Sari Lecturer of Faculty Economy at Widyatama
Notice that X2 and Y2 are skewed. Taking the SQRT of Y2 reduces the skewness greatly.
 Notice that X2 and Y2 are skewed. Taking the SQRT of Y2 reduces the skewness greatly. The MEANS Procedure Variable Mean Std Dev Minimum Maximum Skewness ƒƒƒƒƒƒƒƒƒƒƒƒƒƒƒƒƒƒƒƒƒƒƒƒƒƒƒƒƒƒƒƒƒƒƒƒƒƒƒƒƒƒƒƒƒƒƒƒƒƒƒƒƒƒƒƒƒƒƒƒƒƒƒƒƒƒƒƒƒƒƒƒƒƒƒƒƒƒƒƒƒƒƒƒƒƒƒƒ
The effect of earnings smoothness on manufacturing company s performance
 The Indonesian Accounting Review Vol. 3, No. 2, July 2013, pages 181 192 The effect of earnings smoothness on manufacturing company s performance Riani Yandiarti 1 1 STIE Perbanas Surabaya, Nginden Semolo
EFFECT OF EMPLOYEE STOCK OPTION PLANS (ESOPS) TO PEFORMANCE AND FIRM VALUE : EMPIRICAL STUDY AT JSX. Azwar Anwar. Zaki Baridwan
 TO PEFORMANCE AND FIRM VALUE : EMPIRICAL STUDY AT JSX. Azwar Anwar. Zaki Baridwan") EFFECT OF EMPLOYEE STOCK OPTION PLANS (ESOPS) TO PEFORMANCE AND FIRM VALUE : EMPIRICAL STUDY AT JSX Azwar Anwar Zaki Baridwan 1. INTRODUCTION 1.1 Background Conflict of interests may be happen between
EFFECT OF EMPLOYEE STOCK OPTION PLANS (ESOPS) TO PEFORMANCE AND FIRM VALUE : EMPIRICAL STUDY AT JSX Azwar Anwar Zaki Baridwan 1. INTRODUCTION 1.1 Background Conflict of interests may be happen between
THE EFFECT OF NPL, CAR, LDR, OER AND NIM TO BANKING RETURN ON ASSET
 International Journal of Economics, Commerce and Management United Kingdom Vol. VI, Issue 3, March 2018 http://ijecm.co.uk/ ISSN 2348 0386 THE EFFECT OF NPL, CAR, LDR, OER AND NIM TO BANKING RETURN ON
FV N = PV (1+ r) N. FV N = PVe rs * N 2011 ELAN GUIDES 3. The Future Value of a Single Cash Flow. The Present Value of a Single Cash Flow
 N. FV N = PVe rs * N 2011 ELAN GUIDES 3. The Future Value of a Single Cash Flow. The Present Value of a Single Cash Flow") QUANTITATIVE METHODS The Future Value of a Single Cash Flow FV N = PV (1+ r) N The Present Value of a Single Cash Flow PV = FV (1+ r) N PV Annuity Due = PVOrdinary Annuity (1 + r) FV Annuity Due = FVOrdinary
QUANTITATIVE METHODS The Future Value of a Single Cash Flow FV N = PV (1+ r) N The Present Value of a Single Cash Flow PV = FV (1+ r) N PV Annuity Due = PVOrdinary Annuity (1 + r) FV Annuity Due = FVOrdinary
Contents. An Overview of Statistical Applications CHAPTER 1. Contents (ix) Preface... (vii)
 Preface... (vii)") Contents (ix) Contents Preface... (vii) CHAPTER 1 An Overview of Statistical Applications 1.1 Introduction... 1 1. Probability Functions and Statistics... 1..1 Discrete versus Continuous Functions... 1..
Contents (ix) Contents Preface... (vii) CHAPTER 1 An Overview of Statistical Applications 1.1 Introduction... 1 1. Probability Functions and Statistics... 1..1 Discrete versus Continuous Functions... 1..
THE EFFECT OF CREDIT RATING ANNOUNCEMENT TO MARKET REACTION PENGARUH PENGUMUMAN KREDIT RATING TERHADAP REAKSI PASAR
 THE EFFECT OF CREDIT RATING ANNOUNCEMENT TO MARKET REACTION PENGARUH PENGUMUMAN KREDIT RATING TERHADAP REAKSI PASAR by: Eunike Zega 1 James D.D Massie 2 Hizkia H.D Tasik 3 Faculty of Economics and Business,
esia/perkembangan/
 http://afghanaus.com/uanggiral/http://www.bi.go.id/web/id/sistem+pembayaran/sistem+pembayaran+di+indon esia/perkembangan/ http://id.shvoong.com/social-sciences/economics/2129762-jumlah-uang-beredar-diindonesia/
The comparative analysis of discretionary accruals viewed from the styles of audit and IFRS adoption
 The comparative analysis of discretionary accruals viewed from the styles of audit and IFRS adoption Sulhani 1, Hangga Darisman 2 1, 2 Sekolah Tinggi Ekonomi Islam Tazkia, Sentul City, Bogor, 16810, West
CORPORATE PROFITABILITY: SOME EVIDENCES OF MALAYSIAN LISTED FIRMS
 CORPORATE PROFITABILITY: SOME EVIDENCES OF MALAYSIAN LISTED FIRMS Master Project submitted to the Graduate School of Universiti Utara Malaysia in fulfillment of the requirement for the degree of Master
EFFECT OF WORKING CAPITAL MANAGEMENT ON THE FINANCIAL PERFORMANCE OF MANUFACTURING FIRMS IN SULTANATE OF OMAN
 Innovative Journal of Business and Management 6 : 3,May June (2017) 38-42. Contents lists available at www.innovativejournal.in INNOVATIVE JOURNAL OF BUSINESS AND MANAGEMENT Journal homepage: http://www.innovativejournal.in/ijbm/index.php/ijbm
Asian Journal of Business and Management Sciences ISSN: Vol. 1 No. 7 [92-105]
![Asian Journal of Business and Management Sciences ISSN: Vol. 1 No. 7 [92-105]](/thumbs/86/93952915.jpg "Asian Journal of Business and Management Sciences ISSN: Vol. 1 No. 7 [92-105]") THE ANALYSIS OF COMPANY S FINANCIAL PERFORMANCE BEFORE AND AFTER IMPLEMENTING ENTERPRISE RISK MANAGEMENT: AN EMPIRICAL STUDY IN INDONESIA Arif Singapurwoko Faculty of Economics, Universitas Islam Indonesia
THE ANALYSIS OF COMPANY S FINANCIAL PERFORMANCE BEFORE AND AFTER IMPLEMENTING ENTERPRISE RISK MANAGEMENT: AN EMPIRICAL STUDY IN INDONESIA Arif Singapurwoko Faculty of Economics, Universitas Islam Indonesia
Basic Procedure for Histograms
 Basic Procedure for Histograms 1. Compute the range of observations (min. & max. value) 2. Choose an initial # of classes (most likely based on the range of values, try and find a number of classes that
NCSS Statistical Software. Reference Intervals
 Chapter 586 Introduction A reference interval contains the middle 95% of measurements of a substance from a healthy population. It is a type of prediction interval. This procedure calculates one-, and
Descriptive Statistics
 Petra Petrovics Descriptive Statistics 2 nd seminar DESCRIPTIVE STATISTICS Definition: Descriptive statistics is concerned only with collecting and describing data Methods: - statistical tables and graphs
The Effect of Money Supply, Interest Rate, and Exchange Rate on Inflation in Indonesia
 The Effect of Money Supply, Interest Rate, and Exchange Rate on Inflation in Indonesia 2001-2013 Sri Wulandari Economics Department, State University of Medan, Medan, Indonesia; Email: wulandarisri0208@yahoo.com
Accounting Analysis Journal
 AAJ 5 (4) (2016) Accounting Analysis Journal http://journal.unnes.ac.id/sju/index.php/aaj The Effect of Accounting Conservatism, Investment Opportunity Set, Leverage, and Company Size on Earnings Quality
1. Distinguish three missing data mechanisms:
 1 DATA SCREENING I. Preliminary inspection of the raw data make sure that there are no obvious coding errors (e.g., all values for the observed variables are in the admissible range) and that all variables
The Normal Distribution & Descriptive Statistics. Kin 304W Week 2: Jan 15, 2012
 The Normal Distribution & Descriptive Statistics Kin 304W Week 2: Jan 15, 2012 1 Questionnaire Results I received 71 completed questionnaires. Thank you! Are you nervous about scientific writing? You re
SHARE PRICE ANALYST WITH PBV, DER, AND EPS AT INITIAL PUBLIC OFFERING
 SHARE PRICE ANALYST WITH PBV, DER, AND EPS AT INITIAL PUBLIC OFFERING Kriswanto Accounting Department, Faculty of Economic and Comunication, Bina Nusantara University Jln. K.H. Syahdan No 9, Palmerah,
Data Distributions and Normality
 Data Distributions and Normality Definition (Non)Parametric Parametric statistics assume that data come from a normal distribution, and make inferences about parameters of that distribution. These statistical
Kabupaten Langkat Suku Bunga Kredit. PDRB harga berlaku
 Lampiran 1. Data Penelitian Tahun Konsumsi Masyarakat PDRB harga berlaku Kabupaten Langkat Suku Bunga Kredit Kredit Konsumsi Tabungan Masyarkat Milyar Rp. Milyar Rp. % Milyar Rp. Milyar Rp. 1990 559,61
MEMORANDUM. TO: Me FROM: Me RE: Memo containing output for SPSS practice exam #2
 MEMORADUM DATE: ovember 5, 2024 TO: Me FROM: Me RE: Memo containing output for SPSS practice exam #2 Task 3a. Below is bar graph of the number of cases for the variable beltfrnt. 40 30 20 10 0 o Seat Belt
International Journal of Scientific Engineering and Science Volume 2, Issue 9, pp , ISSN (Online):
:") Relevance Analysis on the Form of Shared Saving Contract between Tulungagung District Government and CV Harsari AMT (Case Study: Construction Project of Rationalization System of Public Street Lighting
Relevance Analysis on the Form of Shared Saving Contract between Tulungagung District Government and CV Harsari AMT (Case Study: Construction Project of Rationalization System of Public Street Lighting
Quantitative Methods
 THE ASSOCIATION OF BUSINESS EXECUTIVES DIPLOMA PART 2 QM Quantitative Methods afternoon 26 May 2004 1 Time allowed: 3 hours. 2 Answer any FOUR questions. 3 All questions carry 25 marks. Marks for subdivisions
DETERMINANTS OF FINANCIAL PERFORMANCE IN THE INDONESIAN ISLAMIC INSURANCE INDUSTRY
 Etikonomi Volume 16 (1), April 2017 P-ISSN: 1412-8969; E-ISSN: 2461-0771 Page 1-12 DETERMINANTS OF FINANCIAL PERFORMANCE IN THE INDONESIAN ISLAMIC INSURANCE INDUSTRY Universitas Siliwangi imanfirman@unsil.ac.id,
INVESTOR DECISION MAKING BASED ON FUNDAMENTAL ANALYSES ON SHARE MARKET
 INVESTOR DECISION MAKING BASED ON FUNDAMENTAL ANALYSES ON SHARE MARKET Septi Herawati Misdiyono, Faculty of Economics Gunadarma University Jl. Margonda Raya No. 00, Depok, 644, Indonesia septiherawati90@yahoo.com
Quantitative Methods
 THE ASSOCIATION OF BUSINESS EXECUTIVES DIPLOMA PART 2 QM Quantitative Methods afternoon 27 November 2002 1 Time allowed: 3 hours. 2 Answer any FOUR questions. 3 All questions carry 25 marks. Marks for
Financial Performance of Conventional and Syariah Banks: An Empirical Studies in Indonesia
 Journal of Islamic Banking and Finance December 2017, Vol. 5, No. 2, pp. 9-14 ISSN 2374-2666 (Print) 2374-2658 (Online) Copyright The Author(s). All Rights Reserved. Published by American Research Institute
Evaluating the Characteristics of Data CHARACTERISTICS OF LEVELS OF MEASUREMENT
 C H A P T E R 3 Evaluating the Characteristics of Data Chapter 2 focused on the process of statistical hypothesis testing. Part of this process (Step 6) involves evaluating the extent to which the data
The SAS System 11:03 Monday, November 11,
 The SAS System 11:3 Monday, November 11, 213 1 The CONTENTS Procedure Data Set Name BIO.AUTO_PREMIUMS Observations 5 Member Type DATA Variables 3 Engine V9 Indexes Created Monday, November 11, 213 11:4:19
Chapter 11 : Model checking and refinement An example: Blood-brain barrier study on rats
 EXST3201 Chapter 11b Geaghan Fall 2005: Page 1 Chapter 11 : Model checking and refinement An example: Blood-brain barrier study on rats This study investigates the permeability of the blood-brain barrier
INCREASING COMPANY PERFORMANCE WITH LIQUIDITY, SOLVENCY IN CIGARETTE INDUSTRYLISTED IN IDX
 INCREASING COMPANY PERFORMANCE WITH LIQUIDITY, SOLVENCY IN CIGARETTE INDUSTRYLISTED IN IDX Suprihati 1) Abdul Haris.R 2) Gita Wahyu.A.M 3) STIE-AAS Surakarta, Central Java, Indonesia Suprihati4566@gmail.com
BA (Bachelor Accounting) From Dept.Accounting at Universitas Jayabaya., Indonesia
 From Dept.Accounting at Universitas Jayabaya., Indonesia") 2018 IJSRST Volume 4 Issue 5 Print ISSN: 2395-6011 Online ISSN: 2395-602X Themed Section: Science and Technology Influence of Compulsory Tax Compulsion on Acceptance of Income Tax on the Office of Tax
2018 IJSRST Volume 4 Issue 5 Print ISSN: 2395-6011 Online ISSN: 2395-602X Themed Section: Science and Technology Influence of Compulsory Tax Compulsion on Acceptance of Income Tax on the Office of Tax
The Benefits of Financial Ratios as the Indicators of Future Bankruptcy on the Economic Crisis
 The Benefits of Financial Ratios as the Indicators of Future Bankruptcy on the Economic Crisis Setia Mulyawan Student of Graduate Program, Padjadjaran University, Bandung, Indonesia. Lecturer of Department
Management Science Letters
 Management Science Letters 3 (2013) 73 80 Contents lists available at GrowingScience Management Science Letters homepage: www.growingscience.com/msl Investigating different influential factors on capital
DOES ECONOMIC VALUE ADDED INFLUENCE THE SHAREHOLDER VALUE IN INDONESIA?
 I J A B E R, Vol. 14, No. 3, (2016): 1547-1560 DOES ECONOMIC VALUE ADDED INFLUENCE THE SHAREHOLDER VALUE IN INDONESIA? Rio Dhani Laksana * and Hersugondo, Hersugondo ** Abstract: The company s main goal
Chapter 6 Part 3 October 21, Bootstrapping
 Chapter 6 Part 3 October 21, 2008 Bootstrapping From the internet: The bootstrap involves repeated re-estimation of a parameter using random samples with replacement from the original data. Because the
Management Science Letters
 Management Science Letters 2 (2012) 2625 2630 Contents lists available at GrowingScience Management Science Letters homepage: www.growingscience.com/msl The impact of working capital and financial structure
Problem Set 4 Answer Key
 Economics 31 Menzie D. Chinn Fall 4 Social Sciences 7418 University of Wisconsin-Madison Problem Set 4 Answer Key This problem set is due in lecture on Wednesday, December 1st. No late problem sets will
Dot Plot: A graph for displaying a set of data. Each numerical value is represented by a dot placed above a horizontal number line.
 Introduction We continue our study of descriptive statistics with measures of dispersion, such as dot plots, stem and leaf displays, quartiles, percentiles, and box plots. Dot plots, a stem-and-leaf display,
TCorporation of India (LICI), since its inception in
, since its inception in") 95 Firm Performances in Indian Life Insurance Industry: Non-Parametric Analysis Joy Chakraborty A b s t r a c t The present study makes a comparison between 15 life insurance firms in India over a period
95 Firm Performances in Indian Life Insurance Industry: Non-Parametric Analysis Joy Chakraborty A b s t r a c t The present study makes a comparison between 15 life insurance firms in India over a period
ANALYSISS. tendency of. Bank X is. one of the. Since. is various. customer of. Bank X. geographic, service. Figure 4.1 0% 0% 5% 15% 0% 1% 27% 16%
 CHAPTER 4 ANALYSISS In this chapter the author discuss about the issues raised in the research include the trend of ATM and DEBIT usage as well as the tendency of customers that use the transaction using
THE INFLUENCE OF MERGERS AND ACQUISITIONS ON FINANCIAL PERFORMANCE AND STOCK RETURN OF INDONESIAN BANKS
 THE INFLUENCE OF MERGERS AND ACQUISITIONS ON FINANCIAL PERFORMANCE AND STOCK RETURN OF INDONESIAN BANKS Nicky Irawan Putra, Hermanto Siregar 1 and Suwinto Johan 2 1 School of Business Bogor Agricultural
Introduction to Statistical Data Analysis II
 Introduction to Statistical Data Analysis II JULY 2011 Afsaneh Yazdani Preface Major branches of Statistics: - Descriptive Statistics - Inferential Statistics Preface What is Inferential Statistics? Preface
MATHEMATICS APPLIED TO BIOLOGICAL SCIENCES MVE PA 07. LP07 DESCRIPTIVE STATISTICS - Calculating of statistical indicators (1)
") LP07 DESCRIPTIVE STATISTICS - Calculating of statistical indicators (1) Descriptive statistics are ways of summarizing large sets of quantitative (numerical) information. The best way to reduce a set of
LP07 DESCRIPTIVE STATISTICS - Calculating of statistical indicators (1) Descriptive statistics are ways of summarizing large sets of quantitative (numerical) information. The best way to reduce a set of
LAMPIRAN. Lampiran 1. Wilayah Tahun PAD JOW PDRB JH JR Yogyakarta
 LAMPIRAN Lampiran 1 Data jumlah PAD sektor pariwisata, Jumlah Obyek Wisata, PDRB, Jumlah Hotel, dan Jumlah Restoran dan rumah makan di kabupaten/kota Daerah Istimewa Yogyakarta, Tahun 2010-2015 Wilayah
Effect of Macroeconomic Indicators toward Government Bonds Price in the Secondary Market
 International Journal of Scientific and Research Publications, Volume 6, Issue 12, December 2016 56 Effect of Macroeconomic Indicators toward Government Bonds Price in the Secondary Market Miftahul Masyhuri
The distribution of the Return on Capital Employed (ROCE)
") Appendix A The historical distribution of Return on Capital Employed (ROCE) was studied between 2003 and 2012 for a sample of Italian firms with revenues between euro 10 million and euro 50 million. 1
Appendix A The historical distribution of Return on Capital Employed (ROCE) was studied between 2003 and 2012 for a sample of Italian firms with revenues between euro 10 million and euro 50 million. 1
Descriptive Statistics
 Chapter 3 Descriptive Statistics Chapter 2 presented graphical techniques for organizing and displaying data. Even though such graphical techniques allow the researcher to make some general observations
Management Science Letters
 Management Science Letters 3 (2013) 527 532 Contents lists available at GrowingScience Management Science Letters homepage: www.growingscience.com/msl How banking sanctions influence on performance of
Jurnal InFestasi Vol. 14 No. 2 Desember 2018 Hal A R T I C L E I N F O A B S T R A C T A B S T R A K
 Jurnal InFestasi Vol. 1 No. 2 Desember 218 Hal. 16 15 Effect of Corporate Governance And Disclosure of Corporate Social Responsibility on The Quality of Financial Statements Winda Pramudita Rusady 1, Andrian
Key Objectives. Module 2: The Logic of Statistical Inference. Z-scores. SGSB Workshop: Using Statistical Data to Make Decisions
 SGSB Workshop: Using Statistical Data to Make Decisions Module 2: The Logic of Statistical Inference Dr. Tom Ilvento January 2006 Dr. Mugdim Pašić Key Objectives Understand the logic of statistical inference
Fundamentals of Statistics
 CHAPTER 4 Fundamentals of Statistics Expected Outcomes Know the difference between a variable and an attribute. Perform mathematical calculations to the correct number of significant figures. Construct