One Way ANOVA with Tukey Post hoc. Case Processing Summary
|
|
|
- Janel Allison
- 5 years ago
- Views:
Transcription
1 EXAMINE VARIABLES=Score BY Group /PLOT BOXPLOT NPPLOT /COMPARE GROUP /STATISTICS DESCRIPTIVES /CINTERVAL 95 /MISSING LISTWISE /NOTOTAL. Explore Group One Way ANOVA with Tukey Post hoc Case Processing Summary Score Cases Valid Missing Total Group N Percent N Percent N Percent % 0.0% % % 0.0% % % 0.0% % % 0.0% % Descriptives Score Group Statistic Std. Error 1 Mean % Confidence Lower Bound 2.83 Interval for Mean Upper Bound % Trimmed Mean 6.00 Median 6.00 Variance Std. Deviation Minimum 3 Maximum 9 Range 6 Interquartile Range 5 Skewness Kurtosis Mean % Confidence Lower Bound 7.48 Interval for Mean Upper Bound % Trimmed Mean 8.94 Median 9.00
2 3 4 Variance Std. Deviation Minimum 8 Maximum 11 Range 3 Interquartile Range 2 Skewness Kurtosis Mean % Confidence Lower Bound 5.04 Interval for Mean Upper Bound % Trimmed Mean 7.00 Median 7.00 Variance Std. Deviation Minimum 5 Maximum 9 Range 4 Interquartile Range 3 Skewness Kurtosis Mean % Confidence Lower Bound.32 Interval for Mean Upper Bound % Trimmed Mean 2.33 Median 2.00 Variance Std. Deviation Minimum 1 Maximum 5 Range 4 Interquartile Range 3 Skewness Kurtosis Score Kolmogorov-Smirnov(a) Tests of Normality Shapiro-Wilk Group Statistic df Sig. Statistic df Sig (*) (*) (*) * This is a lower bound of the true significance. a Lilliefors Significance Correction
3 Test the Shapiro-Wilk statistic Score UNIANOVA Score BY Group /METHOD = SSTYPE(3) /INTERCEPT = INCLUDE /POSTHOC = Group ( TUKEY ) /PRINT = DESCRIPTIVE ETASQ HOMOGENEITY /CRITERIA = ALPHA(.05) /DESIGN = Group.
4 Univariate Analysis of Variance Between-Subjects Factors Group N Dependent Variable: Score Descriptive Statistics Group Mean Std. Deviation N Total Levene's Test of Equality of Error Variances(a) Dependent Variable: Score F df1 df2 Sig Tests the null hypothesis that the error variance of the dependent variable is equal across groups. a Design: Intercept+Group HOV test at.01. Dependent Variable: Score Tests of Between-Subjects Effects Source Type III Sum of Squares df Mean Square F Sig. Partial Eta Squared Corrected Model (a) Intercept Group Error Total Corrected Total a R Squared =.683 (Adjusted R Squared =.624) Use the row with the name of the IV to interpret the ANOVA results. A statistically significant difference amongthe means is evident.
5 Post Hoc Tests Group Multiple Comparisons Dependent Variable: Score Tukey HSD (I) Group Mean 95% Confidence Interval Difference (J) Group (I-J) Std. Error Sig. Lower Bound Upper Bound (*) (*) (*) (*) (*) (*) Based on observed means. * The mean difference is significant at the.05 level. Tukey post hoc analysis to determine where the differences exist between the groups. Homogeneous Subsets Tukey HSD Score Subset Group N Sig Means for groups in homogeneous subsets are displayed. Based on Type III Sum of Squares The error term is Mean Square(Error) = a Uses Harmonic Mean Sample Size = b Alpha =.05.
6 A priori ANOVA EXAMINE VARIABLES=Score BY Group /PLOT BOXPLOT NPPLOT /COMPARE GROUP /STATISTICS DESCRIPTIVES /CINTERVAL 95 /MISSING LISTWISE /NOTOTAL. Explore Group Case Processing Summary Score Cases Valid Missing Total Group N Percent N Percent N Percent % 0.0% % % 0.0% % % 0.0% % % 0.0% % Descriptives Score Group Statistic Std. Error 1 Mean % Confidence Lower Bound 2.83 Interval for Mean Upper Bound % Trimmed Mean 6.00 Median 6.00 Variance Std. Deviation Minimum 3 Maximum 9 Range 6 Interquartile Range 5 Skewness Kurtosis Mean % Confidence Lower Bound 7.48 Interval for Mean Upper Bound % Trimmed Mean 8.94 Median 9.00
7 3 4 Variance Std. Deviation Minimum 8 Maximum 11 Range 3 Interquartile Range 2 Skewness Kurtosis Mean % Confidence Lower Bound 5.04 Interval for Mean Upper Bound % Trimmed Mean 7.00 Median 7.00 Variance Std. Deviation Minimum 5 Maximum 9 Range 4 Interquartile Range 3 Skewness Kurtosis Mean % Confidence Lower Bound.32 Interval for Mean Upper Bound % Trimmed Mean 2.33 Median 2.00 Variance Std. Deviation Minimum 1 Maximum 5 Range 4 Interquartile Range 3 Skewness Kurtosis Score Kolmogorov-Smirnov(a) Tests of Normality Shapiro-Wilk Group Statistic df Sig. Statistic df Sig (*) (*) (*) * This is a lower bound of the true significance. a Lilliefors Significance Correction
8 Score UNIANOVA Score BY Group /METHOD = SSTYPE(3) /INTERCEPT = INCLUDE /POSTHOC = Group ( TUKEY ) /PRINT = DESCRIPTIVE ETASQ HOMOGENEITY /CRITERIA = ALPHA(.05) /DESIGN = Group.
9 Univariate Analysis of Variance Between-Subjects Factors Group N Dependent Variable: Score Descriptive Statistics Group Mean Std. Deviation N Total Levene's Test of Equality of Error Variances(a) Dependent Variable: Score F df1 df2 Sig Tests the null hypothesis that the error variance of the dependent variable is equal across groups. a Design: Intercept+Group Dependent Variable: Score Tests of Between-Subjects Effects Source Type III Sum of Squares df Mean Square F Sig. Partial Eta Squared Corrected Model (a) Intercept Group Error Total Corrected Total a R Squared =.683 (Adjusted R Squared =.624) ONEWAY Score BY Group /CONTRAST= /CONTRAST= /MISSING ANALYSIS.
10 Contrast Coefficients Group Contrast Contrast Tests Score Assume equal variances Contrast Value of Contrast Std. Error t df Sig. (2-tailed) Does not assume equal variances The t-tests serve as the a priori analyses after a significant ANOVA. Because the HOV test was not significant, assume equal variances.
11 Factorial ANOVA with No Interaction EXAMINE VARIABLES=gpaimpr BY gender method /PLOT BOXPLOT NPPLOT /COMPARE GROUP /STATISTICS DESCRIPTIVES /CINTERVAL 95 /MISSING LISTWISE /NOTOTAL. Explore Notes Output Created 20-DEC :17:55 Comments Input Missing Value Handling Syntax Data C:\Documents and Settings\BalkinRick\Desktop\613\SPS S data\windows\lesson 25\Lesson 25 Data File 1.sav Active Dataset DataSet4 Filter <none> Weight <none> Split File <none> N of Rows in Working Data File 60 Definition of Missing Cases Used User-defined missing values for dependent variables are treated as missing. Statistics are based on cases with no missing values for any dependent variable or factor used. EXAMINE VARIABLES=gpaimpr BY gender method /PLOT BOXPLOT NPPLOT /COMPARE GROUP /STATISTICS DESCRIPTIVES /CINTERVAL 95 /MISSING LISTWISE /NOTOTAL. Resources Elapsed Time 0:00:03.76
12 Gender Case Processing Summary Change in GPA Cases Valid Missing Total Gender N Percent N Percent N Percent Men % 0.0% % Women % 0.0% % Descriptives Change in GPA Gender Statistic Std. Error Men Mean % Confidence Lower Bound.2792 Interval for Mean Upper Bound.4808 Women 5% Trimmed Mean.3741 Median.3500 Variance.073 Std. Deviation Minimum -.10 Maximum 1.00 Range 1.10 Interquartile Range.41 Skewness Kurtosis Mean % Confidence Interval for Mean Lower Bound.1228 Upper Bound % Trimmed Mean.1870 Median.2000 Variance.036 Std. Deviation Minimum -.10 Maximum.60 Range.70 Interquartile Range.33 Skewness Kurtosis
13 Tests of Normality Change in GPA Kolmogorov-Smirnov(a) Shapiro-Wilk Gender Statistic df Sig. Statistic df Sig. Men (*) Women * This is a lower bound of the true significance. a Lilliefors Significance Correction Tests for normality of GPA change across gender at.01. Change in GPA
14 Note-Taking methods Case Processing Summary Change in GPA Cases Valid Missing Total Note-Taking methods N Percent N Percent N Percent Method % 0.0% % Method % 0.0% % Control % 0.0% % Descriptives Change in GPA Note-Taking methods Statistic Std. Error Method 1 Mean % Confidence Lower Bound.1502 Interval for Mean Upper Bound.3548 Method 2 Control 5% Trimmed Mean.2361 Median.2250 Variance.048 Std. Deviation Minimum.00 Maximum.80 Range.80 Interquartile Range.38 Skewness Kurtosis Mean % Confidence Lower Bound.3560 Interval for Mean Upper Bound % Trimmed Mean.4694 Median.5000 Variance.062 Std. Deviation Minimum.00 Maximum 1.00 Range 1.00 Interquartile Range.34 Skewness Kurtosis Mean % Confidence Interval for Mean Lower Bound.0662 Upper Bound % Trimmed Mean.1333
15 Median.1000 Variance.022 Std. Deviation Minimum -.10 Maximum.40 Range.50 Interquartile Range.24 Skewness Kurtosis Change in GPA Tests of Normality Kolmogorov-Smirnov(a) Shapiro-Wilk Note-Taking methods Statistic df Sig. Statistic df Sig. Method (*) Method (*) Control (*) * This is a lower bound of the true significance. a Lilliefors Significance Correction Tests for normality of GPA change across method at.01.
16 Change in GPA Boxplots UNIANOVA gpaimpr BY gender method /METHOD = SSTYPE(3) /INTERCEPT = INCLUDE /POSTHOC = method ( TUKEY ) /PLOT = PROFILE( method*gender ) /PRINT = DESCRIPTIVE ETASQ HOMOGENEITY /CRITERIA = ALPHA(.05) /DESIGN = gender method gender*method.
17 Univariate Analysis of Variance Between-Subjects Factors Gender Note-Taking methods Value Label N 1 Men 30 2 Women 30 1 Method Method Control 20 Descriptive Statistics Dependent Variable: Change in GPA Gender Note-Taking methods Mean Std. Deviation N Men Method Method Control Total Women Method Method Control Total Total Method Method Control Total Levene's Test of Equality of Error Variances(a) Dependent Variable: Change in GPA F df1 df2 Sig Tests the null hypothesis that the error variance of the dependent variable is equal across groups. a Design: Intercept+gender+method+gender * method HOV test at.01
18 Tests of Between-Subjects Effects Dependent Variable: Change in GPA Source Type III Sum of Squares df Mean Square F Sig. Partial Eta Squared Corrected Model 1.889(a) Intercept gender method gender * method Error Total Corrected Total a R Squared =.515 (Adjusted R Squared =.470) First, look at the interaction effect--it is not signficant. So, main effects can be interpreted. The main effects are denoted by the rows with the names of the IVs. Each of the main effects is statistically significant. Because Method has more than two levels, a Tukey post hoc is needed to determine where the differences lie. Post Hoc Tests Note-Taking methods Dependent Variable: Change in GPA Tukey HSD Multiple Comparisons (I) Note-Taking methods Method 1 Method 2 Control Based on observed means. * The mean difference is significant at the.05 level. Mean 95% Confidence Interval Difference (J) Note-Taking methods (I-J) Std. Error Sig. Lower Bound Upper Bound Method (*) Control Method (*) Control.3375(*) Method Method (*)
19 Homogeneous Subsets Tukey HSD Change in GPA Subset Note-Taking methods N 1 2 Control Method Method Sig Means for groups in homogeneous subsets are displayed. Based on Type III Sum of Squares The error term is Mean Square(Error) =.033. a Uses Harmonic Mean Sample Size = b Alpha =.05.
20 Profile Plots I have included this plot for instructional purposes, as it is not necessary since the interaction effect was not significant. Note the similarity in the patterns of responses.
21 Factorial ANOVA with Significant Interaction EXAMINE VARIABLES=gpaimpr BY gender method /PLOT BOXPLOT NPPLOT /COMPARE GROUP /STATISTICS DESCRIPTIVES /CINTERVAL 95 /MISSING LISTWISE /NOTOTAL. Explore Gender Case Processing Summary Change in GPA Cases Valid Missing Total Gender N Percent N Percent N Percent Men % 0.0% % Women % 0.0% % Descriptives Change in GPA Gender Statistic Std. Error Men Mean % Confidence Lower Bound.1934 Interval for Mean Upper Bound.3433 Women 5% Trimmed Mean.2611 Median.2500 Variance.040 Std. Deviation Minimum -.10 Maximum.80 Range.90 Interquartile Range.30 Skewness Kurtosis Mean % Confidence Lower Bound.1958 Interval for Mean Upper Bound % Trimmed Mean.2907 Median.2250 Variance.086 Std. Deviation.29254
22 Minimum -.10 Maximum 1.00 Range 1.10 Interquartile Range.53 Skewness Kurtosis Tests of Normality Kolmogorov-Smirnov(a) Shapiro-Wilk Gender Statistic df Sig. Statistic df Sig. Change in GPA Men Women a Lilliefors Significance Correction
23 Change in GPA Note-Taking methods Case Processing Summary Change in GPA Cases Valid Missing Total Note-Taking methods N Percent N Percent N Percent Method % 0.0% % Method % 0.0% % Control % 0.0% %
24 Descriptives Change in GPA Note-Taking methods Statistic Std. Error Method 1 Mean % Confidence Lower Bound.1502 Interval for Mean Upper Bound.3548 Method 2 Control 5% Trimmed Mean.2361 Median.2250 Variance.048 Std. Deviation Minimum.00 Maximum.80 Range.80 Interquartile Range.38 Skewness Kurtosis Mean % Confidence Lower Bound.3560 Interval for Mean Upper Bound % Trimmed Mean.4694 Median.5000 Variance.062 Std. Deviation Minimum.00 Maximum 1.00 Range 1.00 Interquartile Range.34 Skewness Kurtosis Mean % Confidence Interval for Mean Lower Bound.0662 Upper Bound % Trimmed Mean.1333 Median.1000 Variance.022 Std. Deviation Minimum -.10 Maximum.40 Range.50 Interquartile Range.24 Skewness Kurtosis
25 Change in GPA Tests of Normality Kolmogorov-Smirnov(a) Shapiro-Wilk Note-Taking methods Statistic df Sig. Statistic df Sig. Method (*) Method (*) Control (*) * This is a lower bound of the true significance. a Lilliefors Significance Correction Change in GPA Boxplots
26 UNIANOVA gpaimpr BY gender method /METHOD = SSTYPE(3) /INTERCEPT = INCLUDE /PLOT = PROFILE( method*gender ) /PRINT = DESCRIPTIVE ETASQ HOMOGENEITY /CRITERIA = ALPHA(.05) /DESIGN = gender method gender*method. Univariate Analysis of Variance Between-Subjects Factors Gender Note-Taking methods Value Label N 1 Men 30 2 Women 30 1 Method Method Control 20 Descriptive Statistics Dependent Variable: Change in GPA Gender Note-Taking methods Mean Std. Deviation N Men Method Method Control Total Women Method Method Control Total Total Method Method Control Total Levene's Test of Equality of Error Variances(a) Dependent Variable: Change in GPA F df1 df2 Sig Tests the null hypothesis that the error variance of the dependent variable is equal across groups. a Design: Intercept+gender+method+gender * method
27 Tests of Between-Subjects Effects Dependent Variable: Change in GPA Source Type III Sum of Squares df Mean Square F Sig. Partial Eta Squared Corrected Model 1.889(a) Intercept gender method gender * method Error Total Corrected Total a R Squared =.515 (Adjusted R Squared =.470) In this example, there is a significant interaction, so main effects cannot be interpreted. Simple effects will need to be analyzed.
28 Profile Plots The interaction effect is plotted to demonstrate the discrepancy among the groups. UNIANOVA gpaimpr BY gender method /emmeans=table(gender*method) comp(method). SPSS code for analyzing simple effects.
29 Estimated Marginal Means Gender * Note-Taking methods Estimates Dependent Variable: Change in GPA 95% Confidence Interval Gender Note-Taking methods Mean Std. Error Lower Bound Upper Bound Men Method Method Control Women Method Method Control Dependent Variable: Change in GPA Pairwise Comparisons 95% Confidence Interval for Mean Difference(a) Gender (I) Note-Taking methods (J) Note-Taking methods Difference (I-J) Std. Error Sig.(a) Lower Bound Upper Bound Men Method 1 Method Control.170(*) Women Method 2 Control Method 1 Method 2 Control Method Control Method (*) Method Method (*) Control Method 1.470(*) Control.535(*) Method Method (*) Based on estimated marginal means * The mean difference is significant at the.050 level. a Adjustment for multiple comparisons: Least Significant Difference (equivalent to no adjustments). SPSS runs the post hoc tests before the tests for simple effects. Analyze simple effects first. Note that the simple effects (below)show statistical significance for women, but not men. Thus, we only need to look at post hoc tests for women.
30 Univariate Tests Dependent Variable: Change in GPA Gender Men Women Sum of Squares df Mean Square F Sig. Contrast Error Contrast Error Each F tests the simple effects of Note-Taking methods within each level combination of the other effects shown. These tests are based on the linearly independent pairwise comparisons among the estimated marginal means.
31 EXAMINE VARIABLES=time1 time2 time3 time4 /PLOT BOXPLOT NPPLOT /COMPARE GROUP /STATISTICS DESCRIPTIVES /CINTERVAL 95 /MISSING LISTWISE /NOTOTAL. Explore Case Processing Summary Repeated Measures ANOVA Cases Valid Missing Total N Percent N Percent N Percent time % 0.0% % time % 0.0% % time % 0.0% % time % 0.0% % Descriptives time1 time2 Statistic Std. Error Mean % Confidence Lower Bound Interval for Mean Upper Bound % Trimmed Mean Median Variance Std. Deviation Minimum 46 Maximum 81 Range 35 Interquartile Range 12 Skewness Kurtosis Mean % Confidence Lower Bound Interval for Mean Upper Bound % Trimmed Mean Median Variance Std. Deviation Minimum 41
32 time3 time4 Maximum 85 Range 44 Interquartile Range 12 Skewness Kurtosis Mean % Confidence Interval for Mean Lower Bound Upper Bound % Trimmed Mean Median Variance Std. Deviation Minimum 42 Maximum 84 Range 42 Interquartile Range 9 Skewness Kurtosis Mean % Confidence Interval for Mean Lower Bound Upper Bound % Trimmed Mean Median Variance Std. Deviation Minimum 35 Maximum 91 Range 56 Interquartile Range 15 Skewness Kurtosis Kolmogorov-Smirnov(a) Tests of Normality Shapiro-Wilk Statistic df Sig. Statistic df Sig. time (*) time time time * This is a lower bound of the true significance. a Lilliefors Significance Correction Note that normality tests are run without a factor.
33 time1 time2
34 time3
35 time4
36 GLM time1 time2 time3 time4 /WSFACTOR = time 4 Polynomial /METHOD = SSTYPE(3) /PRINT = DESCRIPTIVE ETASQ /CRITERIA = ALPHA(.05) /WSDESIGN = time.
37 General Linear Model Within-Subjects Factors Measure: MEASURE_1 Dependent time Variable 1 time1 2 time2 3 time3 4 time4 Descriptive Statistics Mean Std. Deviation N time time time time Multivariate Tests(b) Partial Eta Effect Value F Hypothesis df Error df Sig. Squared time Pillai's Trace (a) Wilks' Lambda (a) Hotelling's Trace (a) Roy's Largest Root (a) a Exact statistic b Design: Intercept Within Subjects Design: time Measure: MEASURE_1 Mauchly's Test of Sphericity(b) Epsilon(a) Within Subjects Effect Mauchly's W Approx. Chi- Square df Sig. Greenhouse- Geisser Huynh-Feldt Lower-bound time Tests the null hypothesis that the error covariance matrix of the orthonormalized transformed dependent variables is proportional to an identity matrix. a May be used to adjust the degrees of freedom for the averaged tests of significance. Corrected tests are displayed in the Tests of Within-Subjects Effects table. b Design: Intercept Within Subjects Design: time The sphericity assumption is not met. Additionally, E <.70. So, ANOVA results should be analyzed using Greenhouse-Geisser analysis below.
38 Measure: MEASURE_1 Source time Error(time) Tests of Within-Subjects Effects Type III Sum of Squares df Mean Square F Sig. Partial Eta Squared Sphericity Assumed Greenhouse-Geisser Huynh-Feldt Lower-bound Sphericity Assumed Greenhouse-Geisser Huynh-Feldt Lower-bound Since the Greenhouse-Geisser results are significant, post hoc analysis is necessary. A Tukey post hoc can be conducted by dependentt-tests. Measure: MEASURE_1 Source time Error(time) Tests of Within-Subjects Contrasts time Type III Sum of Squares df Mean Square F Sig. Partial Eta Squared Linear Quadratic Cubic Linear Quadratic Cubic Measure: MEASURE_1 Transformed Variable: Average Tests of Between-Subjects Effects Source Type III Sum of Squares df Mean Square F Sig. Partial Eta Squared Intercept Error T-TEST PAIRS = time1 time1 time1 time2 time2 time3 WITH time2 time3 time4 time3 time4 time4 (PAIRED) /CRITERIA = CI(.992) /MISSING = ANALYSIS.
39 T-Test Paired Samples Statistics Pair 1 Pair 2 Pair 3 Pair 4 Pair 5 Pair 6 Mean N Std. Deviation Std. Error Mean time time time time time time time time time time time time Paired Samples Correlations N Correlation Sig. Pair 1 time1 & time Pair 2 time1 & time Pair 3 time1 & time Pair 4 time2 & time Pair 5 time2 & time Pair 6 time3 & time Paired Samples Test Mean Paired Differences 99.2% Confidence Interval of the Difference Std. Error Std. Deviation Mean Lower Upper t df Sig. (2-tailed) Pair 1 time1 - time Pair 2 time1 - time Pair 3 time1 - time Pair 4 time2 - time Pair 5 time2 - time Pair 6 time3 - time Since repeated t-tests are conducted, a Bonferroni adjustment is needed..05 / 6 =.008. So, tests are conducted at an alpha level of.008.
40 SPANOVA GET FILE='/Users/richardbalkin/Desktop/CNEP 6372/SPANOVA data.sav'. EXAMINE VARIABLES=Pretest Posttest BY Exercisetype /PLOT BOXPLOT NPPLOT /COMPARE GROUP /STATISTICS DESCRIPTIVES /CINTERVAL 95 /MISSING LISTWISE /NOTOTAL. Explore Input Missing Value Handling Notes Output Created 14-Jan :10:07 Comments Data Active Dataset Filter Weight Split File N of Rows in Working Data File Definition of Missing Cases Used /Users/richardbalkin/Desktop/CNEP 6372/SPANOVA data.sav DataSet1 <none> <none> <none> User-defined missing values for dependent variables are treated as missing. 50 Statistics are based on cases with no missing values for any dependent variable or factor used.
41 Syntax EXAMINE VARIABLES=Pretest Posttest BY Exercisetype /PLOT BOXPLOT NPPLOT /COMPARE GROUP /STATISTICS DESCRIPTIVES /CINTERVAL 95 /MISSING LISTWISE /NOTOTAL. Resources Processor Time 0:00: Elapsed Time 0:00: [DataSet1] /Users/richardbalkin/Desktop/CNEP 6372/SPANOVA data.sav Exercise type Case Processing Summary Cases Exercis Valid Missing Total e type N Percent N Percent N Percent Pretest Posttest % 0.0% % % 0.0% % % 0.0% % % 0.0% %
42 Pretest Descriptives Exercise type Statistic Std. Error 1 2 Posttest 1 95% Confidence Interval for Mean 95% Confidence Interval for Mean Mean Lower Bound 2.20 Upper Bound % Trimmed Mean 2.35 Median 2.45 Variance.112 Std. Deviation.335 Minimum 2 Maximum 3 Range 1 Interquartile Range 0 Skewness Kurtosis Mean Lower Bound 2.28 Upper Bound % Trimmed Mean 2.40 Median 2.40 Variance.069 Std. Deviation.264 Minimum 2 Maximum 3 Range 1 Interquartile Range 0 Skewness Kurtosis Mean % Confidence Interval Lower Bound 2.71 for Mean Upper Bound 2.80
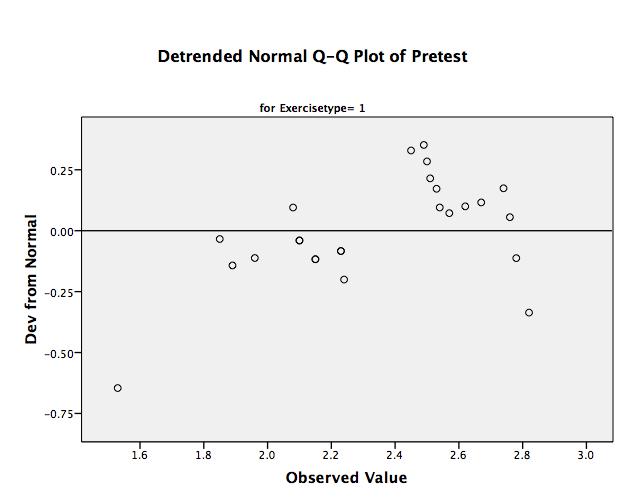
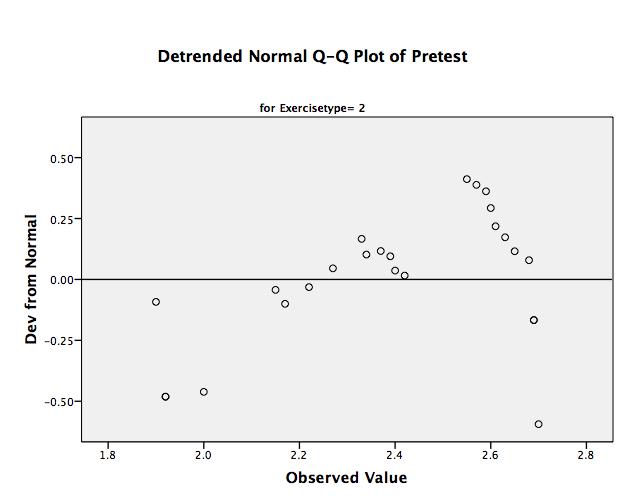
43 2 5% Trimmed Mean 2.76 Median 2.76 Variance.011 Std. Deviation.105 Minimum 2 Maximum 3 Range 0 Interquartile Range 0 Skewness Kurtosis Mean % Confidence Interval Lower Bound 2.91 for Mean Upper Bound % Trimmed Mean 2.97 Median 2.96 Variance.017 Std. Deviation.129 Minimum 3 Maximum 3 Range 0 Interquartile Range 0 Skewness Kurtosis Tests of Normality Exercis Kolmogorov-Smirnov a Shapiro-Wilk e type Statistic df Sig. Statistic df Sig. Pretest Posttest * *
44 a. Lilliefors Significance Correction *. This is a lower bound of the true significance. Pretest Normal Q-Q Plots
45
46 Detrended Normal Q-Q Plots
47
48

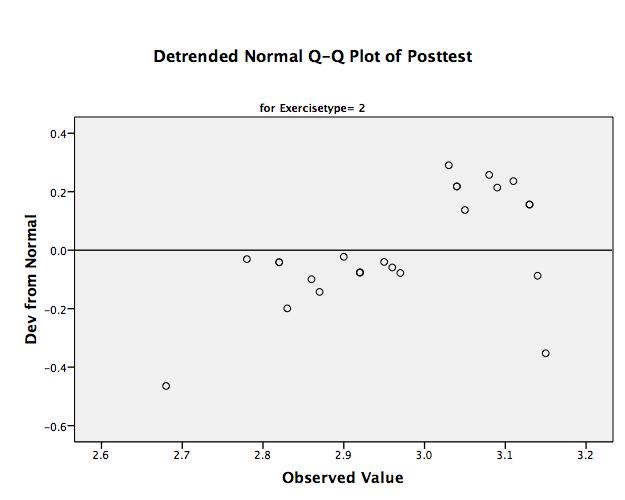
49 Posttest Normal Q-Q Plots
50
51 Detrended Normal Q-Q Plots
52
53
54 GLM Pretest Posttest BY Exercisetype /WSFACTOR=time 2 Polynomial /METHOD=SSTYPE(3) /PLOT=PROFILE(time*Exercisetype) /PRINT=DESCRIPTIVE ETASQ HOMOGENEITY /CRITERIA=ALPHA(.05) /WSDESIGN=time /DESIGN=Exercisetype.
55 General Linear Model Input Missing Value Handling Notes Output Created 14-Jan :11:49 Comments Data Active Dataset Filter Weight Split File N of Rows in Working Data File Definition of Missing Cases Used Syntax /Users/richardbalkin/Desktop/CNEP 6372/SPANOVA data.sav DataSet1 <none> <none> <none> User-defined missing values are treated as missing. Statistics are based on all cases with valid data for all variables in the model. GLM Pretest Posttest BY Exercisetype /WSFACTOR=time 2 Polynomial /METHOD=SSTYPE(3) 50 /PLOT=PROFILE(time*Exercisetype) /PRINT=DESCRIPTIVE ETASQ HOMOGENEITY /CRITERIA=ALPHA(.05) /WSDESIGN=time /DESIGN=Exercisetype. Resources Processor Time 0:00: Elapsed Time 0:00: [DataSet1] /Users/richardbalkin/Desktop/CNEP 6372/SPANOVA data.sav
56 Within-Subjects Factors Measure:MEASURE_1 time 1 Pretest 2 Posttest Dependent Variable Between-Subjects Factors N Exercise type Pretest Posttest Descriptive Statistics Exercis e type Mean Std. Deviation N Total Total
57 Box's Test of Equality of Covariance Matrices a Box's M F df1 3 df Sig..332 Tests the null hypothesis that the observed covariance matrices of the dependent variables are equal across groups. a. Design: Intercept + Exercisetype Within Subjects Design: time Multivariate Tests b Effect Value F Hypothesis df Error df Sig. time time * Exercisetype a. Exact statistic Partial Eta Squared Pillai's Trace a Wilks' Lambda a Hotelling's Trace a Roy's Largest Root a Pillai's Trace a Wilks' Lambda a Hotelling's Trace a Roy's Largest Root b. Design: Intercept + Exercisetype Within Subjects Design: time a
58 Measure:MEASURE_1 Within Subjec ts Effect Mauchly's W a Mauchly's Test of Sphericity b Approx. Chi- Square df Sig. Epsilon a Greenhouse- Geisser Huynh-Feldt Lower-bound time Tests the null hypothesis that the error covariance matrix of the orthonormalized transformed dependent variables is proportional to an identity matrix. a. May be used to adjust the degrees of freedom for the averaged tests of significance. Corrected tests are displayed in the Tests of Within-Subjects Effects table. b. Design: Intercept + Exercisetype Within Subjects Design: time
59 Measure:MEASURE_1 Source time time * Exercisetype Error(time) Sphericity Assumed Greenhouse- Geisser Tests of Within-Subjects Effects Type III Sum of Squares df Mean Square F Sig. Partial Eta Squared Huynh-Feldt Lower-bound Sphericity Assumed Greenhouse- Geisser Huynh-Feldt Lower-bound Sphericity Assumed Greenhouse- Geisser Huynh-Feldt Lower-bound Measure:MEASURE_1 Source time Tests of Within-Subjects Contrasts Type III Sum of Squares df Mean Square F Sig. Partial Eta Squared time Linear time * Exercisetype Linear Error(time) Linear
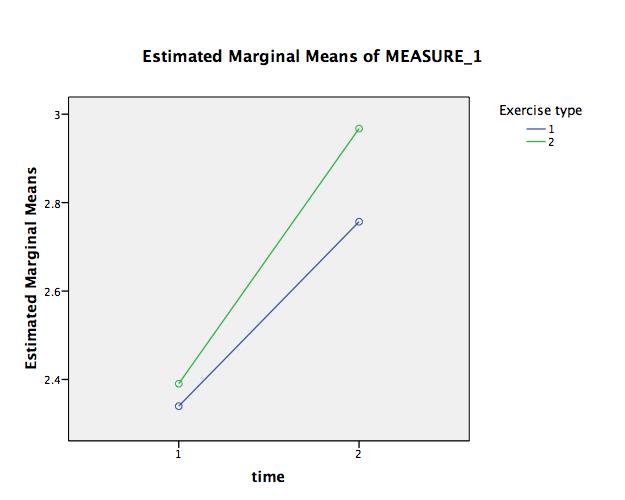
60 Levene's Test of Equality of Error Variances a F df1 df2 Sig. Pretest Posttest Tests the null hypothesis that the error variance of the dependent variable is equal across groups. a. Design: Intercept + Exercisetype Within Subjects Design: time Measure:MEASURE_1 Transformed Variable:Average Source Tests of Between-Subjects Effects Type III Sum of Squares df Mean Square F Sig. Partial Eta Squared Intercept Exercisetype Error Profile Plots
61
62 EXAMINE VARIABLES=statexam /PLOT BOXPLOT HISTOGRAM NPPLOT /COMPARE GROUP /STATISTICS DESCRIPTIVES /CINTERVAL 95 /MISSING LISTWISE /NOTOTAL. Explore Multiple Regression Case Processing Summary Average percentage correct on statistics exams Cases Valid Missing Total N Percent N Percent N Percent % 0.0% % Descriptives Average percentage correct on statistics exams Statistic Std. Error Mean % Confidence Lower Bound Interval for Mean Upper Bound % Trimmed Mean Median Variance Std. Deviation Minimum 23 Maximum 97 Range 74 Interquartile Range 33 Skewness Kurtosis Average percentage correct on statistics exams a Lilliefors Significance Correction Tests of Normality Kolmogorov-Smirnov(a) Shapiro-Wilk Statistic df Sig. Statistic df Sig
63 Criterion variable should be normally distributed Average percentage correct on statistics exams REGRESSION /DESCRIPTIVES MEAN STDDEV CORR SIG N /MISSING LISTWISE /STATISTICS COEFF OUTS R ANOVA COLLIN TOL ZPP /CRITERIA=PIN(.05) POUT(.10) /NOORIGIN /DEPENDENT statexam /METHOD=ENTER mathtest engtest /SCATTERPLOT=(*ZRESID,*ZPRED ) /SAVE ZRESID.
64 on Descriptive Statistics Mean Std. Deviation N entage tistics test score de test Correlations elation Average percentage correct on statistics exams Average percentage correct on statistics exams Math aptitude test score English aptitude test score Math aptitude test score English aptitude test score Average percentage correct on statistics exams Math aptitude test score English aptitude test score Average percentage correct on statistics exams Math aptitude test score English aptitude test score r correlations and intercorrelations. When you divide the correlation of a predictor to the criterion by R you get the structure or that predictor.
65 ered/removed(b) riables ntered ish ude test e, Math ude test e(a) Variables Removed. Enter Method d variables entered. Variable: Average percentage correct on statistics exams Model Summary(b) R R Square Adjusted R Square Std. Error of the Estimate 505(a) Constant), English aptitude test score, Math aptitude test score Variable: Average percentage correct on statistics exams ariance accounted for in the model ANOVA(b) Sum of Squares df Mean Square F Sig. ression (a) dual l Constant), English aptitude test score, Math aptitude test score Variable: Average percentage correct on statistics exams of the model Coefficients(a) Unstandardized Coefficients Standardized Coefficients Correlations Collinear B Std. Error Beta t Sig. Zero-order Partial Part Tolerance nstant) h aptitude test score ish aptitude test e Variable: Average percentage correct on statistics exams rdized beta coefficients are the amount of increase in the criterion for each change in the predict s show statistical significance of the beta weights. quare the part correlation you have the squared semi-partial correlation coefficient-the unique amo ontributed by a predictor variable. d tolerance show no multicollinearlity noted.
66 Collinearity Diagnostics(a) ension Eigenvalue Condition Index (Constant) Variance Proportions Math aptitude test score English aptitude test score Variable: Average percentage correct on statistics exams Residuals Statistics(a) Minimum Maximum Mean Std. Deviation N ue Value Variable: Average percentage correct on statistics exams
67 have a constant variance. p between the criterion variable and each predictor variable should be linear. S=ZRE_1 XPLOT NPPLOT GROUP ICS DESCRIPTIVES AL 95 LISTWISE.
68 Case Processing Summary Cases Valid Missing Total N Percent N Percent N Percent Residual % 0.0% % Descriptives Residual Statistic Std. Error Mean % Confidence Interval for Mean Lower Bound Upper Bound % Trimmed Mean Median Variance.980 Std. Deviation Minimum Maximum Range Interquartile Range Skewness Kurtosis Tests of Normality Kolmogorov-Smirnov(a) Shapiro-Wilk Statistic df Sig. Statistic df Sig. Residual nificance Correction diction should be normally distributed.
69 Standardized Residual
70 MANOVA with Discriminant Analysis Post hoc GET FILE='/Users/richardbalkin/Desktop/CNEP 6370/GreenSalkind/Lesson 28/Lesson 28 Data File 1.sav'. EXAMINE VARIABLES=applicat recall BY group /PLOT BOXPLOT NPPLOT /COMPARE GROUP /STATISTICS DESCRIPTIVES /CINTERVAL 95 /MISSING LISTWISE /NOTOTAL. Explore Input Missing Value Handling Notes Output Created 18-Feb :42:17 Comments Data Active Dataset Filter Weight Split File N of Rows in Working Data File Definition of Missing Cases Used /Users/richardbalkin/Desktop/CNEP 6370/GreenSalkind/Lesson 28/Lesson 28 Data File 1.sav DataSet1 <none> <none> <none> User-defined missing values for dependent variables are treated as missing. 30 Statistics are based on cases with no missing values for any dependent variable or factor used.
71 Syntax EXAMINE VARIABLES=applicat recall BY group /PLOT BOXPLOT NPPLOT /COMPARE GROUP /STATISTICS DESCRIPTIVES /CINTERVAL 95 /MISSING LISTWISE /NOTOTAL. Resources Processor Time 0:00: Elapsed Time 0:00: [DataSet1] /Users/richardbalkin/Desktop/CNEP 6370/GreenSalkind/Lesson 28/Lesson 28 Data File 1.sav Study Strategy Groups Case Processing Summary Study Cases Strategy Valid Missing Total Groups N Percent N Percent N Percent Application Exam Recall Exam Think % 0.0% % Write % 0.0% % Talk % 0.0% % Think % 0.0% % Write % 0.0% % Talk % 0.0% % Descriptives Study Strategy Groups Statistic Std. Error
72 Application Exam Think Write Talk 95% Confidence Interval for Mean 95% Confidence Interval for Mean 95% Confidence Interval for Mean Mean Lower Bound 2.32 Upper Bound % Trimmed Mean 3.22 Median 3.00 Variance Std. Deviation Minimum 1 Maximum 5 Range 4 Interquartile Range 2 Skewness Kurtosis Mean Lower Bound 3.74 Upper Bound % Trimmed Mean 5.06 Median 5.00 Variance Std. Deviation Minimum 2 Maximum 7 Range 5 Interquartile Range 3 Skewness Kurtosis Mean Lower Bound 3.56 Upper Bound % Trimmed Mean 4.39
73 Recall Exam Think Write Median 4.50 Variance Std. Deviation Minimum 3 Maximum 6 Range 3 Interquartile Range 2 Skewness Kurtosis Mean % Confidence Interval Lower Bound 2.82 for Mean Upper Bound % Trimmed Mean 3.33 Median 3.00 Variance.456 Std. Deviation.675 Minimum 2 Maximum 4 Range 2 Interquartile Range 1 Skewness Kurtosis Mean % Confidence Interval Lower Bound 5.06 for Mean Upper Bound % Trimmed Mean 5.72 Median 5.50 Variance Std. Deviation Minimum 5 Maximum 8
74 Talk Range 3 Interquartile Range 1 Skewness Kurtosis Mean % Confidence Interval Lower Bound 3.39 for Mean Upper Bound % Trimmed Mean 4.22 Median 4.00 Variance Std. Deviation Minimum 2 Maximum 6 Range 4 Interquartile Range 1 Skewness Kurtosis Application Exam Recall Exam a. Lilliefors Significance Correction Tests of Normality Study Strategy Kolmogorov-Smirnov a Shapiro-Wilk Groups Statistic df Sig. Statistic df Sig. Think Write * Talk * Think Write Talk *. This is a lower bound of the true significance.
75 Application Exam Recall Exam

76 GLM recall applicat BY group /METHOD=SSTYPE(3) /INTERCEPT=INCLUDE /PRINT=DESCRIPTIVE ETASQ HOMOGENEITY /CRITERIA=ALPHA(.05) /DESIGN= group.
77 General Linear Model Input Missing Value Handling Notes Output Created 18-Feb :43:33 Comments Data Active Dataset Filter Weight Split File N of Rows in Working Data File Definition of Missing Cases Used Syntax /Users/richardbalkin/Desktop/CNEP 6370/GreenSalkind/Lesson 28/Lesson 28 Data File 1.sav DataSet1 <none> <none> <none> User-defined missing values are treated as missing. Statistics are based on all cases with valid data for all variables in the model. GLM recall applicat BY group /METHOD=SSTYPE(3) /INTERCEPT=INCLUDE /PRINT=DESCRIPTIVE ETASQ HOMOGENEITY /CRITERIA=ALPHA(.05) /DESIGN= group. 30 Resources Processor Time 0:00: Elapsed Time 0:00: [DataSet1] /Users/richardbalkin/Desktop/CNEP 6370/GreenSalkind/Lesson 28/Lesson 28 Data File 1.sav
78 Between-Subjects Factors Value Label N Study Strategy Groups 1 Think 10 2 Write 10 3 Talk 10 Recall Exam Application Exam Descriptive Statistics Study Strategy Groups Mean Std. Deviation N Think Write Talk Total Think Write Talk Total Box's Test of Equality of Covariance Matrices a Box's M F df1 6 df Sig..398
79 Tests the null hypothesis that the observed covariance matrices of the dependent variables are equal across groups. a. Design: Intercept + group Multivariate Tests c Effect Value F Hypothesis df Error df Sig. Intercept group a. Exact statistic Partial Eta Squared Pillai's Trace a Wilks' Lambda a Hotelling's Trace a Roy's Largest Root a Pillai's Trace Wilks' Lambda a Hotelling's Trace Roy's Largest Root b b. The statistic is an upper bound on F that yields a lower bound on the significance level. c. Design: Intercept + group Levene's Test of Equality of Error Variances a F df1 df2 Sig. Recall Exam Application Exam Tests the null hypothesis that the error variance of the dependent variable is equal across groups. a. Design: Intercept + group
80 Source Corrected Model Intercept group Error Total Corrected Total Dependent Variable Tests of Between-Subjects Effects Type III Sum of Squares df Mean Square F Sig. Partial Eta Squared Recall Exam a Application Exam b Recall Exam Application Exam Recall Exam Application Exam Recall Exam Application Exam Recall Exam Application Exam Recall Exam Application Exam a. R Squared =.559 (Adjusted R Squared =.526) b. R Squared =.237 (Adjusted R Squared =.181) DISCRIMINANT /GROUPS=group(1 3) /VARIABLES=recall applicat /ANALYSIS ALL /PRIORS EQUAL /PLOT=COMBINED /CLASSIFY=NONMISSING POOLED. Discriminant
81 Input Missing Value Handling Notes Output Created 18-Feb :50:39 Comments Data Active Dataset Filter Weight Split File N of Rows in Working Data File Definition of Missing Cases Used Syntax /Users/richardbalkin/Desktop/CNEP 6370/GreenSalkind/Lesson 28/Lesson 28 Data File 1.sav DataSet1 <none> <none> <none> User-defined missing values are treated as missing in the analysis phase. 30 In the analysis phase, cases with no user- or system-missing values for any predictor variable are used. Cases with user-, system-missing, or out-of-range values for the grouping variable are always excluded. DISCRIMINANT /GROUPS=group(1 3) /VARIABLES=recall applicat /ANALYSIS ALL /PRIORS EQUAL /PLOT=COMBINED /CLASSIFY=NONMISSING POOLED. Resources Processor Time 0:00: Elapsed Time 0:00: [DataSet1] /Users/richardbalkin/Desktop/CNEP 6370/GreenSalkind/Lesson 28/Lesson 28 Data File 1.sav
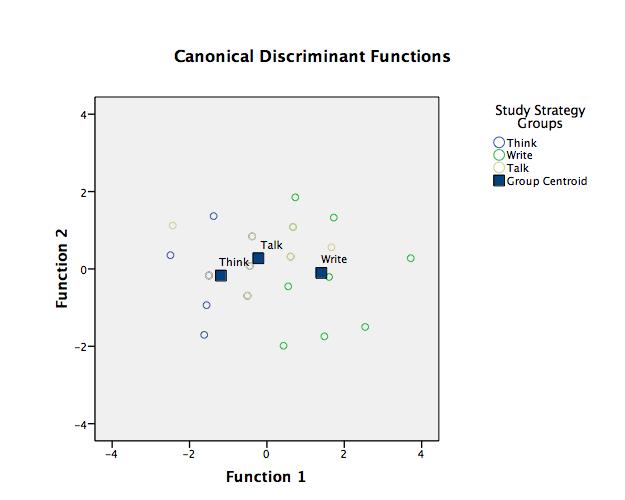
82 Analysis Case Processing Summary Unweighted Cases N Percent Excluded Valid Missing or out-of-range group codes At least one missing discriminating variable Both missing or out-ofrange group codes and at least one missing discriminating variable Total 0.0 Total Group Statistics Valid N (listwise) Study Strategy Groups Unweighted Weighted Think Recall Exam Application Exam Write Talk Total Recall Exam Application Exam Recall Exam Application Exam Recall Exam Application Exam Analysis 1 Summary of Canonical Discriminant Functions
83 Eigenvalues Functio n Eigenvalue % of Variance Cumulative % Canonical Correlation a a a. First 2 canonical discriminant functions were used in the analysis. Wilks' Lambda Test of Function(s) Wilks' Lambda Chi-square df Sig. 1 through Standardized Canonical Discriminant Function Coefficients Function 1 2 Recall Exam Application Exam Structure Matrix Function 1 2 Recall Exam.997 * Application Exam *
84 Pooled within-groups correlations between discriminating variables and standardized canonical discriminant functions Variables ordered by absolute size of correlation within function. *. Largest absolute correlation between each variable and any discriminant function Functions at Group Centroids Study Function Strategy Groups 1 2 Think Write Talk Unstandardized canonical discriminant functions evaluated at group means Classification Statistics Excluded Classification Processing Summary Processed 30 Missing or out-of-range group codes At least one missing discriminating variable Used in Output Prior Probabilities for Groups
85 Study Cases Used in Analysis Strategy Groups Prior Unweighted Weighted Think Write Talk Total
86
87 Canonical Correlation manova coping followup with TSR_Beh TSR_Emo /discrim all alpha(1) /print=sig (eigen dim). Manova Input Notes Output Created 22-Apr :49:38 Comments Data Active Dataset Filter Weight Split File N of Rows in Working Data File Syntax /Volumes/Cruzer/Family Journal Article/GASS Family Journal Data.sav DataSet5 <none> <none> <none> manova coping followup with TSR_Beh TSR_Emo /discrim all alpha(1) /print=sig (eigen dim). 125 Resources Processor Time 0:00: Elapsed Time 0:00: [DataSet5] /Volumes/Cruzer/Family Journal Article/GASS Family Journal Data.sav The default error term in MANOVA has been changed from WITHIN CELLS to
88 WITHIN+RESIDUAL. Note that these are the same for all full factorial designs. * * * * * * * * * * * * * * * * * A n a l y s i s o f V a r i a n c e * * * * * * * * * * * * * * * * * 120 cases accepted. 0 cases rejected because of out-of-range factor values. 5 cases rejected because of missing data. 1 non-empty cell. 1 design will be processed * * * * * * * * * * * * * * * * * A n a l y s i s o f V a r i a n c e -- Design 1 * * * * * * * * * * * * * * * * * EFFECT.. WITHIN CELLS Regression Multivariate Tests of Significance (S = 2, M = -1/2, N = 57 ) Test Name Value Approx. F Hypoth. DF Error DF Sig. of F Pillais Hotellings Wilks Roys Note.. F statistic for WILKS' Lambda is exact Eigenvalues and Canonical Correlations Root No. Eigenvalue Pct. Cum. Pct. Canon Cor. Sq. Cor Dimension Reduction Analysis Roots Wilks L. F Hypoth. DF Error DF Sig. of F 1 TO TO
89 EFFECT.. WITHIN CELLS Regression (Cont.) Univariate F-tests with (2,117) D. F. Variable Sq. Mul. R Adj. R-sq. Hypoth. MS Error MS F Sig. of F coping followup Raw canonical coefficients for DEPENDENT variables Function No. Variable 1 2 coping followup Standardized canonical coefficients for DEPENDENT variables Function No. Variable 1 2 coping followup Correlations between DEPENDENT and canonical variables Function No. Variable 1 2 coping followup Variance in dependent variables explained by canonical variables CAN. VAR. Pct Var DEP Cum Pct DEP Pct Var COV Cum Pct COV Raw canonical coefficients for COVARIATES
90 Function No. COVARIATE 1 2 TSR_Beh TSR_EMO Standardized canonical coefficients for COVARIATES CAN. VAR. COVARIATE 1 2 TSR_Beh TSR_EMO Correlations between COVARIATES and canonical variables CAN. VAR. Covariate 1 2 TSR_Beh TSR_EMO Variance in covariates explained by canonical variables CAN. VAR. Pct Var DEP Cum Pct DEP Pct Var COV Cum Pct COV Regression analysis for WITHIN CELLS error term --- Individual Univariate.9500 confidence intervals Dependent variable.. coping COVARIATE B Beta Std. Err. t-value Sig. of t Lower - 95% CL- Upper TSR_Beh TSR_EMO Dependent variable.. followup
91 COVARIATE B Beta Std. Err. t-value Sig. of t Lower - 95% CL- Upper TSR_Beh TSR_EMO * * * * * * * * * * * * * * * * * A n a l y s i s o f V a r i a n c e -- Design 1 * * * * * * * * * * * * * * * * * EFFECT.. CONSTANT Multivariate Tests of Significance (S = 1, M = 0, N = 57 ) Test Name Value Exact F Hypoth. DF Error DF Sig. of F Pillais Hotellings Wilks Roys Note.. F statistics are exact Eigenvalues and Canonical Correlations Root No. Eigenvalue Pct. Cum. Pct. Canon Cor EFFECT.. CONSTANT (Cont.) Univariate F-tests with (1,117) D. F. Variable Hypoth. SS Error SS Hypoth. MS Error MS F Sig. of F coping followup EFFECT.. CONSTANT (Cont.)
92 Raw discriminant function coefficients Function No. Variable 1 coping followup Standardized discriminant function coefficients Function No. Variable 1 coping followup Estimates of effects for canonical variables Canonical Variable Parameter Correlations between DEPENDENT and canonical variables Canonical Variable Variable 1 coping followup
93 ANCOVA GET FILE='/Users/richardbalkin/Desktop/CNEP 6370/GreenSalkind/Lesson 27/Lesson 27 Data File 1.sav'. EXAMINE VARIABLES=days predays BY group /PLOT BOXPLOT NPPLOT /COMPARE GROUP /STATISTICS DESCRIPTIVES /CINTERVAL 95 /MISSING LISTWISE /NOTOTAL. Explore Input Missing Value Handling Notes Output Created 25-Feb :26:34 Comments Data Active Dataset Filter Weight Split File N of Rows in Working Data File Definition of Missing Cases Used /Users/richardbalkin/Desktop/CNEP 6370/GreenSalkind/Lesson 27/Lesson 27 Data File 1.sav DataSet1 <none> <none> <none> User-defined missing values for dependent variables are treated as missing. 30 Statistics are based on cases with no missing values for any dependent variable or factor used.
94 Syntax EXAMINE VARIABLES=days predays BY group /PLOT BOXPLOT NPPLOT /COMPARE GROUP /STATISTICS DESCRIPTIVES /CINTERVAL 95 /MISSING LISTWISE /NOTOTAL. Resources Processor Time 0:00: Elapsed Time 0:00: [DataSet1] /Users/richardbalkin/Desktop/CNEP 6370/GreenSalkind/Lesson 27/Lesson 27 Data File 1.sav Vitamin C Treatment Case Processing Summary Cases Valid Missing Total Vitamin C Treatment N Percent N Percent N Percent Days with Colds: Post Placebo % 0.0% % Low Vitamin C Dose % 0.0% % High Vitamin C Dose % 0.0% % Days with Colds: Prior Placebo % 0.0% % Low Vitamin C Dose % 0.0% % High Vitamin C Dose % 0.0% %
95 Days with Colds: Post Vitamin C Treatment Placebo Low Vitamin C Dose Descriptives 95% Confidence Interval for Mean 95% Confidence Interval for Mean Statistic Std. Error Mean Lower Bound 7.77 Upper Bound % Trimmed Mean Median Variance Std. Deviation Minimum 0 Maximum 20 Range 20 Interquartile Range Skewness Kurtosis Mean Lower Bound 5.66 Upper Bound % Trimmed Mean 8.61 Median 9.50 Variance Std. Deviation Minimum 0 Maximum 13 Range 13 Interquartile Range Skewness Kurtosis High Vitamin C Mean
96 Days with Colds: Prior Placebo Low Vitamin C Dose 95% Confidence Interval for Mean Lower Bound 3.92 Upper Bound % Trimmed Mean 6.39 Median 6.50 Variance Std. Deviation Minimum 0 Maximum 13 Range 13 Interquartile Range Skewness Kurtosis Mean % Confidence Lower Bound 3.87 Interval for Mean Upper Bound % Trimmed Mean 7.94 Median 8.00 Variance Std. Deviation Minimum 0 Maximum 19 Range 19 Interquartile Range Skewness Kurtosis Mean % Confidence Lower Bound 6.31 Interval for Mean Upper Bound % Trimmed Mean Median
97 High Vitamin C Dose Variance Std. Deviation Minimum 0 Maximum 19 Range 19 Interquartile Range 10 Skewness Kurtosis Mean % Confidence Lower Bound 4.75 Interval for Mean Upper Bound % Trimmed Mean 8.50 Median 9.50 Variance Std. Deviation Minimum 0 Maximum 15 Range 15 Interquartile Range Skewness Kurtosis Tests of Normality Kolmogorov-Smirnov a Shapiro-Wilk Vitamin C Treatment Statistic df Sig. Statistic df Sig. Days with Colds: Post Placebo * Low Vitamin C Dose High Vitamin C Dose * Days with Colds: Prior Placebo *
98 Low Vitamin C Dose * High Vitamin C Dose * a. Lilliefors Significance Correction *. This is a lower bound of the true significance. Days with Colds: Post

99 Days with Colds: Prior

100 UNIANOVA days BY group WITH predays /METHOD=SSTYPE(3) /INTERCEPT=INCLUDE /CRITERIA=ALPHA(0.05) /DESIGN=group predays group*predays.
GGraph. Males Only. Premium. Experience. GGraph. Gender. 1 0: R 2 Linear = : R 2 Linear = Page 1
 GGraph 9 Gender : R Linear =.43 : R Linear =.769 8 7 6 5 4 3 5 5 Males Only GGraph Page R Linear =.43 R Loess 9 8 7 6 5 4 5 5 Explore Case Processing Summary Cases Valid Missing Total N Percent N Percent
Valid Missing Total. N Percent N Percent N Percent , ,0% 0,0% 2 100,0% 1, ,0% 0,0% 2 100,0% 2, ,0% 0,0% 5 100,0%
 dimension1 GET FILE= validacaonestscoremédico.sav' (só com os 59 doentes) /COMPRESSED. SORT CASES BY UMcpEVA (D). EXAMINE VARIABLES=UMcpEVA BY NoRespostasSignif /PLOT BOXPLOT HISTOGRAM NPPLOT /COMPARE
Table of Contents. New to the Second Edition... Chapter 1: Introduction : Social Research...
 iii Table of Contents Preface... xiii Purpose... xiii Outline of Chapters... xiv New to the Second Edition... xvii Acknowledgements... xviii Chapter 1: Introduction... 1 1.1: Social Research... 1 Introduction...
LAMPIRAN 1: OUTPUT SPSS
 LAMPIRAN : OUTPUT SPSS Statistik Deskriptif Descriptive Statistics N Minimum Maximum Mean Std. Deviation Daabs 95.0022.0902.03744.0226569 CAR 95.0789.339.43306.0463305 RORA 95 -.447.8074.052244.29802 ROA
LAMPIRAN IV PENGUJIAN HIPOTESIS
 LAMPIRAN IV PENGUJIAN HIPOTESIS 89 NORMALITAS I Explore Case Processing Summary Cases Valid Missing Total N Percent N Percent N Percent 390 00.0% 0.0% 390 00.0% Descriptives Mean 95% Confidence Interval
Lampiran 1 Data Efektivits BPHTB
 Lampiran 1 Data Efektivits BPHTB No Kecamatan Semester 1 Tahun 2011 Semester 2 Tahun 2011 Semester 1 Tahun 2012 Semester 2 Tahun 2012 Realisasi Potensi % Realisasi Potensi % Realisasi Potensi % Realisasi
SPSS t tests (and NP Equivalent)
") SPSS t tests (and NP Equivalent) Descriptive Statistics To get all the descriptive statistics you need: Analyze > Descriptive Statistics>Explore. Enter the IV into the Factor list and the DV into the Dependent
SPSS t tests (and NP Equivalent) Descriptive Statistics To get all the descriptive statistics you need: Analyze > Descriptive Statistics>Explore. Enter the IV into the Factor list and the DV into the Dependent
Influence of Personal Factors on Health Insurance Purchase Decision
 Influence of Personal Factors on Health Insurance Purchase Decision INFLUENCE OF PERSONAL FACTORS ON HEALTH INSURANCE PURCHASE DECISION The decision in health insurance purchase include decisions about
Notice that X2 and Y2 are skewed. Taking the SQRT of Y2 reduces the skewness greatly.
 Notice that X2 and Y2 are skewed. Taking the SQRT of Y2 reduces the skewness greatly. The MEANS Procedure Variable Mean Std Dev Minimum Maximum Skewness ƒƒƒƒƒƒƒƒƒƒƒƒƒƒƒƒƒƒƒƒƒƒƒƒƒƒƒƒƒƒƒƒƒƒƒƒƒƒƒƒƒƒƒƒƒƒƒƒƒƒƒƒƒƒƒƒƒƒƒƒƒƒƒƒƒƒƒƒƒƒƒƒƒƒƒƒƒƒƒƒƒƒƒƒƒƒƒƒ
Data screening, transformations: MRC05
 Dale Berger Data screening, transformations: MRC05 This is a demonstration of data screening and transformations for a regression analysis. Our interest is in predicting current salary from education level
Descriptive Analysis
 Descriptive Analysis HERTANTO WAHYU SUBAGIO Univariate Analysis Univariate analysis involves the examination across cases of one variable at a time. There are three major characteristics of a single variable
The FREQ Procedure. Table of Sex by Gym Sex(Sex) Gym(Gym) No Yes Total Male Female Total
 Gym(Gym) No Yes Total Male Female Total") Jenn Selensky gathered data from students in an introduction to psychology course. The data are weights, sex/gender, and whether or not the student worked-out in the gym. Here is the output from a 2 x
Jenn Selensky gathered data from students in an introduction to psychology course. The data are weights, sex/gender, and whether or not the student worked-out in the gym. Here is the output from a 2 x
Summary of Statistical Analysis Tools EDAD 5630
 Summary of Statistical Analysis Tools EDAD 5630 Test Name Program Used Purpose Steps Main Uses/Applications in Schools Principal Component Analysis SPSS Measure Underlying Constructs Reliability SPSS Measure
EXST7015: Multiple Regression from Snedecor & Cochran (1967) RAW DATA LISTING
 RAW DATA LISTING") Multiple (Linear) Regression Introductory example Page 1 1 options ps=256 ls=132 nocenter nodate nonumber; 3 DATA ONE; 4 TITLE1 ''; 5 INPUT X1 X2 X3 Y; 6 **** LABEL Y ='Plant available phosphorus' 7 X1='Inorganic
Multiple (Linear) Regression Introductory example Page 1 1 options ps=256 ls=132 nocenter nodate nonumber; 3 DATA ONE; 4 TITLE1 ''; 5 INPUT X1 X2 X3 Y; 6 **** LABEL Y ='Plant available phosphorus' 7 X1='Inorganic
XLSTAT TIP SHEET FOR BUSINESS STATISTICS CENGAGE LEARNING
 XLSTAT TIP SHEET FOR BUSINESS STATISTICS CENGAGE LEARNING INTRODUCTION XLSTAT makes accessible to anyone a powerful, complete and user-friendly data analysis and statistical solution. Accessibility to
CHAPTER III FINANCIAL INCLUSION INITIATIVES OF COMMERCIAL BANKS
 CHAPTER III FINANCIAL INCLUSION INITIATIVES OF COMMERCIAL BANKS "Efficient financial systems are vital for the prosperity of a community and a nation as whole. To ensure that poor people are included in
Exploratory Data Analysis (EDA)
") Exploratory Data Analysis (EDA) Introduction A Need to Explore Your Data The first step of data analysis should always be a detailed examination of the data. The examination of your data is called Exploratory
Exploratory Data Analysis (EDA) Introduction A Need to Explore Your Data The first step of data analysis should always be a detailed examination of the data. The examination of your data is called Exploratory
Subject CS1 Actuarial Statistics 1 Core Principles. Syllabus. for the 2019 exams. 1 June 2018
 ` Subject CS1 Actuarial Statistics 1 Core Principles Syllabus for the 2019 exams 1 June 2018 Copyright in this Core Reading is the property of the Institute and Faculty of Actuaries who are the sole distributors.
Resilience and Stability of Algeria s Financial System towards Resilience versus Stability - Approach. Salima Guettafi 1 & Yassine Laib 2
 Journal of Economics and Development Studies March 2016, Vol. 4, No. 1, pp. 78-90 ISSN: 2334-2382 (Print), 2334-2390 (Online) Copyright The Author(s). All Rights Reserved. Published by American Research
OLAH DATA INSTRUMEN PENELITIAN DENGAN SPSS VERSI 16.0
 OLAH DATA INSTRUMEN PENELITIAN DENGAN SPSS VERSI 16.0 DESKRIPTIF Variabel Customer Relationship Marketing Descriptive Statistics N Minimum Maximum Sum Mean Std. Deviation Skewness Kurtosis Statistic Statistic
Statistical Models of Stocks and Bonds. Zachary D Easterling: Department of Economics. The University of Akron
 Statistical Models of Stocks and Bonds Zachary D Easterling: Department of Economics The University of Akron Abstract One of the key ideas in monetary economics is that the prices of investments tend to
Stat 328, Summer 2005
 Stat 328, Summer 2005 Exam #2, 6/18/05 Name (print) UnivID I have neither given nor received any unauthorized aid in completing this exam. Signed Answer each question completely showing your work where
Data Distributions and Normality
 Data Distributions and Normality Definition (Non)Parametric Parametric statistics assume that data come from a normal distribution, and make inferences about parameters of that distribution. These statistical
Copyright 2011 Pearson Education, Inc. Publishing as Addison-Wesley.
 Appendix: Statistics in Action Part I Financial Time Series 1. These data show the effects of stock splits. If you investigate further, you ll find that most of these splits (such as in May 1970) are 3-for-1
2SLS HATCO SPSS, STATA and SHAZAM. Example by Eddie Oczkowski. August 2001
 2SLS HATCO SPSS, STATA and SHAZAM Example by Eddie Oczkowski August 2001 This example illustrates how to use SPSS to estimate and evaluate a 2SLS latent variable model. The bulk of the example relates
Two-Sample T-Test for Superiority by a Margin
 Chapter 219 Two-Sample T-Test for Superiority by a Margin Introduction This procedure provides reports for making inference about the superiority of a treatment mean compared to a control mean from data
Two-Sample T-Test for Non-Inferiority
 Chapter 198 Two-Sample T-Test for Non-Inferiority Introduction This procedure provides reports for making inference about the non-inferiority of a treatment mean compared to a control mean from data taken
Descriptive Statistics
 Petra Petrovics Descriptive Statistics 2 nd seminar DESCRIPTIVE STATISTICS Definition: Descriptive statistics is concerned only with collecting and describing data Methods: - statistical tables and graphs
Two Way ANOVA in R Solutions
 Two Way ANOVA in R Solutions Solutions to exercises found here # Exercise 1 # #Read in the moth experiment data setwd("h:/datasets") moth.experiment = read.csv("moth trap experiment.csv", header = TRUE)
Point-Biserial and Biserial Correlations
 Chapter 302 Point-Biserial and Biserial Correlations Introduction This procedure calculates estimates, confidence intervals, and hypothesis tests for both the point-biserial and the biserial correlations.
HASIL PENELITIAN BERUPA OUTPUT SPSS
 VARIABEL INDEPENDEN HASIL PENELITIAN BERUPA OUTPUT SPSS 1. RATA-RATA ASUPAN ENERGI UJI NORMALITAS DATA Rata2AsupanE 70 100.0% 0.0% 70 100.0% Descriptives Rata2AsupanE 1375.77 44.068 Lower Bound 1287.85
SAS Simple Linear Regression Example
 SAS Simple Linear Regression Example This handout gives examples of how to use SAS to generate a simple linear regression plot, check the correlation between two variables, fit a simple linear regression
SOCIAL BANKING PERFORMANCE
 SOCIAL BANKING PERFORMANCE Contents 7.1 Analysis Based on Average Ratios 7.2 Bank-wi wise Analysis 7.3 Bank Group-wise Analysis 7.4 Bank Sector-wi wise Analysis 7 As a result of the reforms made in the
CHAPTER 6 DATA ANALYSIS AND INTERPRETATION
 208 CHAPTER 6 DATA ANALYSIS AND INTERPRETATION Sr. No. Content Page No. 6.1 Introduction 212 6.2 Reliability and Normality of Data 212 6.3 Descriptive Analysis 213 6.4 Cross Tabulation 218 6.5 Chi Square
Copyrighted 2007 FINANCIAL VARIABLES EFFECT ON THE U.S. GROSS PRIVATE DOMESTIC INVESTMENT (GPDI)
") FINANCIAL VARIABLES EFFECT ON THE U.S. GROSS PRIVATE DOMESTIC INVESTMENT (GPDI) 1959-21 Byron E. Bell Department of Mathematics, Olive-Harvey College Chicago, Illinois, 6628, USA Abstract I studied what
FINANCIAL VARIABLES EFFECT ON THE U.S. GROSS PRIVATE DOMESTIC INVESTMENT (GPDI) 1959-21 Byron E. Bell Department of Mathematics, Olive-Harvey College Chicago, Illinois, 6628, USA Abstract I studied what
Random Effects ANOVA
 Random Effects ANOVA Grant B. Morgan Baylor University This post contains code for conducting a random effects ANOVA. Make sure the following packages are installed: foreign, lme4, lsr, lattice. library(foreign)
Model of the Determination of the Feasibility of Making Loans to Members at HIPPATAS Credit Cooperative Tasikmalaya
 Model of the Determination of the Feasibility of Making s to Members at HIPPATAS Credit Cooperative Tasikmalaya Adi Kuswanto Sacretary Staff of The Economics Doctoral Program Gunadarma University kuswanto@staff.gunadarma.ac.id
CHAPTER 4 DATA ANALYSIS Data Hypothesis
 CHAPTER 4 DATA ANALYSIS 4.1. Data Hypothesis The hypothesis for each independent variable to express our expectations about the characteristic of each independent variable and the pay back performance
Sales Sales
 lix Lampiran I PT. Akasha Wira International Tbk PT. Tiga Pilar Sejahtera Food Tbk PT. Cahaya Kalbar Tbk 2010 2009 2008 2007 2010 2009 2008 2007 2010 2009 2008 2007 Sales 219 134 130 132 705 533 489 484
KARACHI UNIVERSITY BUSINESS SCHOOL UNIVERSITY OF KARACHI BS (BBA) VI
 VI") 88 P a g e B S ( B B A ) S y l l a b u s KARACHI UNIVERSITY BUSINESS SCHOOL UNIVERSITY OF KARACHI BS (BBA) VI Course Title : STATISTICS Course Number : BA(BS) 532 Credit Hours : 03 Course 1. Statistical
88 P a g e B S ( B B A ) S y l l a b u s KARACHI UNIVERSITY BUSINESS SCHOOL UNIVERSITY OF KARACHI BS (BBA) VI Course Title : STATISTICS Course Number : BA(BS) 532 Credit Hours : 03 Course 1. Statistical
Manager Comparison Report June 28, Report Created on: July 25, 2013
 Manager Comparison Report June 28, 213 Report Created on: July 25, 213 Page 1 of 14 Performance Evaluation Manager Performance Growth of $1 Cumulative Performance & Monthly s 3748 3578 348 3238 368 2898
iskills & Proficiency Profile (PP) Report
 Report") 1 iskills & Proficiency Profile (PP) Report Descriptive Statistics & Correlations Report Submitted: Aug 17, 2011 Perry Deess, Director, Institutional Research & Planning orbert Elliot, Chair, Middle States
1 iskills & Proficiency Profile (PP) Report Descriptive Statistics & Correlations Report Submitted: Aug 17, 2011 Perry Deess, Director, Institutional Research & Planning orbert Elliot, Chair, Middle States
LAMPIRAN 1. adalah 26,7 %. Jumlah energi 1 gr Lemak = 9 Kkal. Perhitungan asam lemak trans 5 % = 26,7 % X 84,425 gr X 9 Kkal/gr = 202,86
 LAMPIRAN 1 Komposisi diet hewan coba (Sumber Research Diets Inc, 21 Oktober 2011 ) Komponen pangan Jumlah gm % kcal % gm % kcal % Protein 24 20 24 20 Carbohydrate 41 35 41 35 Fat 24 45 24 45 Total 100
Demonstrate Approval of Loans by a Bank
 1 Running head: The Data Consists of 100 Cases of Hypothetical Data to Demonstrate Approval of Loans by a Bank Name Course Subject 2 Introduction There has been witnessed an alarming trend in the number
Key Objectives. Module 2: The Logic of Statistical Inference. Z-scores. SGSB Workshop: Using Statistical Data to Make Decisions
 SGSB Workshop: Using Statistical Data to Make Decisions Module 2: The Logic of Statistical Inference Dr. Tom Ilvento January 2006 Dr. Mugdim Pašić Key Objectives Understand the logic of statistical inference
DATA ANALYSIS. ratio as a measurement of bank s growth. (further details can bee seen in appendix A) 1. Permata Bank (BNLI) Central Asia Bank (BCA)
 1. Permata Bank (BNLI) Central Asia Bank (BCA)") Chapter 4 DATA ANALYSIS This chapter discusses the capital structure in each groups and the effect of that differences which reflect on their debt, equity, debt to equity ratio and capital adequacy ratio
Chapter 4 DATA ANALYSIS This chapter discusses the capital structure in each groups and the effect of that differences which reflect on their debt, equity, debt to equity ratio and capital adequacy ratio
1. Distinguish three missing data mechanisms:
 1 DATA SCREENING I. Preliminary inspection of the raw data make sure that there are no obvious coding errors (e.g., all values for the observed variables are in the admissible range) and that all variables
**BEGINNING OF EXAMINATION** A random sample of five observations from a population is:
 **BEGINNING OF EXAMINATION** 1. You are given: (i) A random sample of five observations from a population is: 0.2 0.7 0.9 1.1 1.3 (ii) You use the Kolmogorov-Smirnov test for testing the null hypothesis,
Contents. An Overview of Statistical Applications CHAPTER 1. Contents (ix) Preface... (vii)
 Preface... (vii)") Contents (ix) Contents Preface... (vii) CHAPTER 1 An Overview of Statistical Applications 1.1 Introduction... 1 1. Probability Functions and Statistics... 1..1 Discrete versus Continuous Functions... 1..
Contents (ix) Contents Preface... (vii) CHAPTER 1 An Overview of Statistical Applications 1.1 Introduction... 1 1. Probability Functions and Statistics... 1..1 Discrete versus Continuous Functions... 1..
Technology Arts Sciences Cologne Faculty of Economics, Business and Law Prof. Dr. Arrenberg Room 221, Tel
 Technology Arts Sciences Cologne Faculty of Economics, Business and Law Prof. Dr. Arrenberg Room 221, Tel. 39 14 jutta.arrenberg@th-koeln.de Exercises Quantitative Methods Worksheet: Goodness-of-fit Test
Stat 101 Exam 1 - Embers Important Formulas and Concepts 1
 1 Chapter 1 1.1 Definitions Stat 101 Exam 1 - Embers Important Formulas and Concepts 1 1. Data Any collection of numbers, characters, images, or other items that provide information about something. 2.
Chapter 4 Financial Strength Analysis
 Chapter 4 Financial Strength Analysis 4.1 Meaning of Financial Strength Finance is an essential requirement for every business enterprise. Various type of finance was needed by the concern for their activity
SFSU FIN822 Project 1
 SFSU FIN822 Project 1 This project can be done in a team of up to 3 people. Your project report must be accompanied by printouts of programming outputs. You could use any software to solve the problems.
BUSI 344 LESSON 8 SUPPLEMENT TIME ADJUSTMENT ILLUSTRATION
 BUSI 344 LESSON 8 SUPPLEMENT TIME ADJUSTMENT ILLUSTRATION The "Ontario" database used in Lesson 8 did not have sufficient market movement to require a time adjustment. However, because this is a common
EFFECT OF WORKING CAPITAL MANAGEMENT ON THE FINANCIAL PERFORMANCE OF MANUFACTURING FIRMS IN SULTANATE OF OMAN
 Innovative Journal of Business and Management 6 : 3,May June (2017) 38-42. Contents lists available at www.innovativejournal.in INNOVATIVE JOURNAL OF BUSINESS AND MANAGEMENT Journal homepage: http://www.innovativejournal.in/ijbm/index.php/ijbm
Anshika 1. Abstract. 1. Introduction
 Micro-economic factors affecting stock returns: an empirical study of S&P BSE Bankex companies Abstract Anshika 1 1 Research Scholar, PEC University of Technology, Sector 12, Chandigarh, 160012, India
The SAS System 11:03 Monday, November 11,
 The SAS System 11:3 Monday, November 11, 213 1 The CONTENTS Procedure Data Set Name BIO.AUTO_PREMIUMS Observations 5 Member Type DATA Variables 3 Engine V9 Indexes Created Monday, November 11, 213 11:4:19
starting on 5/1/1953 up until 2/1/2017.
 An Actuary s Guide to Financial Applications: Examples with EViews By William Bourgeois An actuary is a business professional who uses statistics to determine and analyze risks for companies. In this guide,
Multiple regression analysis of performance indicators in the ceramic industry
 Available online at www.sciencedirect.com Procedia Economics and Finance 3 ( 2012 ) 509 514 Emerging Markets Queries in Finance and Business Multiple regression analysis of performance indicators in the
Evaluating the Characteristics of Data CHARACTERISTICS OF LEVELS OF MEASUREMENT
 C H A P T E R 3 Evaluating the Characteristics of Data Chapter 2 focused on the process of statistical hypothesis testing. Part of this process (Step 6) involves evaluating the extent to which the data
Analysis of 2x2 Cross-Over Designs using T-Tests for Non-Inferiority
 Chapter 235 Analysis of 2x2 Cross-Over Designs using -ests for Non-Inferiority Introduction his procedure analyzes data from a two-treatment, two-period (2x2) cross-over design where the goal is to demonstrate
Overview/Outline. Moving beyond raw data. PSY 464 Advanced Experimental Design. Describing and Exploring Data The Normal Distribution
 PSY 464 Advanced Experimental Design Describing and Exploring Data The Normal Distribution 1 Overview/Outline Questions-problems? Exploring/Describing data Organizing/summarizing data Graphical presentations
ASDA2 ANALYSIS EXAMPLE REPLICATION SPSS C5
 ASDA2 ANALYSIS EXAMPLE REPLICATION SPSS C5 SAS DATA='P:\ASDA 2\Data sets\nhanes 2011_2012\nhanes1112_sub_8aug2016.sas7bdat'. DATASET NAME DataSet2 WINDOW=FRONT. DATASET NAME DataSet1 WINDOW=FRONT. USE
CHAPTER 7 MULTIPLE REGRESSION
 CHAPTER 7 MULTIPLE REGRESSION ANSWERS TO PROBLEMS AND CASES 5. Y = 7.5 + 3(0) - 1.(7) = -17.88 6. a. A correlation matrix displays the correlation coefficients between every possible pair of variables
FV N = PV (1+ r) N. FV N = PVe rs * N 2011 ELAN GUIDES 3. The Future Value of a Single Cash Flow. The Present Value of a Single Cash Flow
 N. FV N = PVe rs * N 2011 ELAN GUIDES 3. The Future Value of a Single Cash Flow. The Present Value of a Single Cash Flow") QUANTITATIVE METHODS The Future Value of a Single Cash Flow FV N = PV (1+ r) N The Present Value of a Single Cash Flow PV = FV (1+ r) N PV Annuity Due = PVOrdinary Annuity (1 + r) FV Annuity Due = FVOrdinary
QUANTITATIVE METHODS The Future Value of a Single Cash Flow FV N = PV (1+ r) N The Present Value of a Single Cash Flow PV = FV (1+ r) N PV Annuity Due = PVOrdinary Annuity (1 + r) FV Annuity Due = FVOrdinary
BUSI 444 Suggested Answers to Review and Discussion Questions: Lesson 7
 BUSI 444 Suggested Answers to Review and Discussion Questions: Lesson 7 1. Use Analyze Descriptive Statistics Descriptives to calculate the standard deviation and mean for each variable. Then manually
Maximum Likelihood Estimation
 Maximum Likelihood Estimation EPSY 905: Fundamentals of Multivariate Modeling Online Lecture #6 EPSY 905: Maximum Likelihood In This Lecture The basics of maximum likelihood estimation Ø The engine that
Study The Relationship between financial flexibility and firm's ownership structure in Tehran Stock Exchang.
 Advances in Environmental Biology, 7(10) Cot 2013, Pages: 3175-3180 AENSI Journals Advances in Environmental Biology Journal home page: http://www.aensiweb.com/aeb.html Study The Relationship between financial
Application of statistical methods in the determination of health loss distribution and health claims behaviour
 Mathematical Statistics Stockholm University Application of statistical methods in the determination of health loss distribution and health claims behaviour Vasileios Keisoglou Examensarbete 2005:8 Postal
PRMIA Exam 8002 PRM Certification - Exam II: Mathematical Foundations of Risk Measurement Version: 6.0 [ Total Questions: 132 ]
![PRMIA Exam 8002 PRM Certification - Exam II: Mathematical Foundations of Risk Measurement Version: 6.0 [ Total Questions: 132 ]](/thumbs/74/69839183.jpg "PRMIA Exam 8002 PRM Certification - Exam II: Mathematical Foundations of Risk Measurement Version: 6.0 [ Total Questions: 132 ]") s@lm@n PRMIA Exam 8002 PRM Certification - Exam II: Mathematical Foundations of Risk Measurement Version: 6.0 [ Total Questions: 132 ] Question No : 1 A 2-step binomial tree is used to value an American
s@lm@n PRMIA Exam 8002 PRM Certification - Exam II: Mathematical Foundations of Risk Measurement Version: 6.0 [ Total Questions: 132 ] Question No : 1 A 2-step binomial tree is used to value an American
Mixed models in R using the lme4 package Part 3: Inference based on profiled deviance
 Mixed models in R using the lme4 package Part 3: Inference based on profiled deviance Douglas Bates Department of Statistics University of Wisconsin - Madison Madison January 11, 2011
The instructions on this page also work for the TI-83 Plus and the TI-83 Plus Silver Edition.
 The instructions on this page also work for the TI-83 Plus and the TI-83 Plus Silver Edition. The position of the graphically represented keys can be found by moving your mouse on top of the graphic. Turn
Statistics TI-83 Usage Handout
 Statistics TI-83 Usage Handout This handout includes instructions for performing several different functions on a TI-83 calculator for use in Statistics. The Contents table below lists the topics covered
A Survey of the Relationship between Earnings Management and the Cost of Capital in Companies Listed on the Tehran Stock Exchange
 AENSI Journals Advances in Environmental Biology Journal home page: http://www.aensiweb.com/aeb.html A Survey of the Relationship between Earnings Management and the Cost of Capital in Companies Listed
Chapter 11 : Model checking and refinement An example: Blood-brain barrier study on rats
 EXST3201 Chapter 11b Geaghan Fall 2005: Page 1 Chapter 11 : Model checking and refinement An example: Blood-brain barrier study on rats This study investigates the permeability of the blood-brain barrier
Non-Inferiority Tests for the Ratio of Two Means in a 2x2 Cross-Over Design
 Chapter 515 Non-Inferiority Tests for the Ratio of Two Means in a x Cross-Over Design Introduction This procedure calculates power and sample size of statistical tests for non-inferiority tests from a
NCSS Statistical Software. Reference Intervals
 Chapter 586 Introduction A reference interval contains the middle 95% of measurements of a substance from a healthy population. It is a type of prediction interval. This procedure calculates one-, and
Written by N.Nilgün Çokça. Advance Excel. Part One. Using Excel for Data Analysis
 Written by N.Nilgün Çokça Advance Excel Part One Using Excel for Data Analysis March, 2018 P a g e 1 Using Excel for Calculations Arithmetic operations Arithmetic operators: To perform basic mathematical
Chapter 11 Part 6. Correlation Continued. LOWESS Regression
 Chapter 11 Part 6 Correlation Continued LOWESS Regression February 17, 2009 Goal: To review the properties of the correlation coefficient. To introduce you to the various tools that can be used to decide
1 Exercise One. 1.1 Calculate the mean ROI. Note that the data is not grouped! Below you find the raw data in tabular form:
 1 Exercise One Note that the data is not grouped! 1.1 Calculate the mean ROI Below you find the raw data in tabular form: Obs Data 1 18.5 2 18.6 3 17.4 4 12.2 5 19.7 6 5.6 7 7.7 8 9.8 9 19.9 10 9.9 11
When determining but for sales in a commercial damages case,
 JULY/AUGUST 2010 L I T I G A T I O N S U P P O R T Choosing a Sales Forecasting Model: A Trial and Error Process By Mark G. Filler, CPA/ABV, CBA, AM, CVA When determining but for sales in a commercial
THE EFFECT OF NPL, CAR, LDR, OER AND NIM TO BANKING RETURN ON ASSET
 International Journal of Economics, Commerce and Management United Kingdom Vol. VI, Issue 3, March 2018 http://ijecm.co.uk/ ISSN 2348 0386 THE EFFECT OF NPL, CAR, LDR, OER AND NIM TO BANKING RETURN ON
Lecture 1: Empirical Properties of Returns
 Lecture 1: Empirical Properties of Returns Econ 589 Eric Zivot Spring 2011 Updated: March 29, 2011 Daily CC Returns on MSFT -0.3 r(t) -0.2-0.1 0.1 1986 1987 1988 1989 1990 1991 1992 1993 1994 1995 1996
Booth School of Business, University of Chicago Business 41202, Spring Quarter 2013, Mr. Ruey S. Tsay. Midterm
 Booth School of Business, University of Chicago Business 41202, Spring Quarter 2013, Mr. Ruey S. Tsay Midterm ChicagoBooth Honor Code: I pledge my honor that I have not violated the Honor Code during this
Financial Risk Tolerance and the influence of Socio-demographic Characteristics of Retail Investors
 Financial Risk Tolerance and the influence of Socio-demographic Characteristics of Retail Investors * Ms. R. Suyam Praba Abstract Risk is inevitable in human life. Every investor takes considerable amount
DETERMINANTS OF FINANCIAL STRUCTURE OF GREEK COMPANIES
 Gargalis PANAGIOTIS Doctoral School of Economics and Business Administration Alexandru Ioan Cuza University of Iasi, Romania DETERMINANTS OF FINANCIAL STRUCTURE OF GREEK COMPANIES Empirical study Keywords
Stat 401XV Exam 3 Spring 2017
 Stat 40XV Exam Spring 07 I have neither given nor received unauthorized assistance on this exam. Name Signed Date Name Printed ATTENTION! Incorrect numerical answers unaccompanied by supporting reasoning
Homework Assignment Section 3
 Homework Assignment Section 3 Tengyuan Liang Business Statistics Booth School of Business Problem 1 A company sets different prices for a particular stereo system in eight different regions of the country.
Study 2: data analysis. Example analysis using R
 Study 2: data analysis Example analysis using R Steps for data analysis Install software on your computer or locate computer with software (e.g., R, systat, SPSS) Prepare data for analysis Subjects (rows)
Final Exam Suggested Solutions
 University of Washington Fall 003 Department of Economics Eric Zivot Economics 483 Final Exam Suggested Solutions This is a closed book and closed note exam. However, you are allowed one page of handwritten
Diploma Part 2. Quantitative Methods. Examiner s Suggested Answers
 Diploma Part 2 Quantitative Methods Examiner s Suggested Answers Question 1 (a) The binomial distribution may be used in an experiment in which there are only two defined outcomes in any particular trial
Lecture Notes #2: Introduction to Analysis of Variance 2-1
 Lecture Notes #2: Introduction to Analysis of Variance 2-1 Richard Gonzalez Psych 613 Version 2.6 (9/2016) LECTURE NOTES #2 Reading assignment Read MD ch 3 or G ch 6. Goals for Lecture Notes #2 Introduce
Final Exam - section 1. Thursday, December hours, 30 minutes
 Econometrics, ECON312 San Francisco State University Michael Bar Fall 2013 Final Exam - section 1 Thursday, December 19 1 hours, 30 minutes Name: Instructions 1. This is closed book, closed notes exam.
Topic 8: Model Diagnostics
 Topic 8: Model Diagnostics Outline Diagnostics to check model assumptions Diagnostics concerning X Diagnostics using the residuals Diagnostics and remedial measures Diagnostics: look at the data to diagnose
Business Statistics 41000: Probability 3
 Business Statistics 41000: Probability 3 Drew D. Creal University of Chicago, Booth School of Business February 7 and 8, 2014 1 Class information Drew D. Creal Email: dcreal@chicagobooth.edu Office: 404
Effect of Change Management Practices on the Performance of Road Construction Projects in Rwanda A Case Study of Horizon Construction Company Limited
 International Journal of Scientific and Research Publications, Volume 6, Issue 0, October 206 54 ISSN 2250-353 Effect of Change Management Practices on the Performance of Road Construction Projects in
Statistics and Finance
 David Ruppert Statistics and Finance An Introduction Springer Notation... xxi 1 Introduction... 1 1.1 References... 5 2 Probability and Statistical Models... 7 2.1 Introduction... 7 2.2 Axioms of Probability...
Chapter 6 Simple Correlation and
 Contents Chapter 1 Introduction to Statistics Meaning of Statistics... 1 Definition of Statistics... 2 Importance and Scope of Statistics... 2 Application of Statistics... 3 Characteristics of Statistics...
Parametric Statistics: Exploring Assumptions.
 Parametric Statistics: Exploring Assumptions http://www.pelagicos.net/classes_biometry_fa17.htm Reading - Field: Chapter 5 R Packages Used in This Chapter For this chapter, you will use the following packages:
LAMPIRAN 1 ETHICAL CLEARANCE
 LAMPIRAN 1 ETHICAL CLEARANCE LAMPIRAN 2 INFORMED CONSENT LAMPIRAN 3 LAPORAN HARIAN PASIEN HIV LAMPIRAN 4 SURAT PERIZINAN PENELITIAN DARI UNIVERSITAS GADJAH MADA LAMPIRAN 5 ANALISIS HASIL LABORATORIUM