Data Analysis and Statistical Methods Statistics 651
|
|
|
- Ernest Jennings
- 6 years ago
- Views:
Transcription
1 Data Analysis and Statistical Methods Statistics Lecture 14 (MWF) The t-distribution Suhasini Subba Rao
2 Review of previous lecture Often the precision of an estimator is stated in terms of it s margin of error. For example, the proportion of Americans that are happy is 40% with a margin of error 2.5%. We now know that margin of error corresponds to the plus/minus part in a confidence interval [ X E, X + E] = [ X σ , }{{ n X } Margin of Error σ 2 n ]. The margin of error does not mean that the proportion of Americans that 1
3 are happy is definitely in the interval [37.5, 42.5]% (this is the difference between knowing for certain and a confidence interval). Technically, the margin of error means that for every 100 sample mean drawn about 95% of them will lie inside the interval [ X E, X + E]. We can use the margin of error to determine the ideal sample size using the formula n = ( zα/2 σ E ) 2 To calculate the margin of error we had to assume the standard deviation is known. If it is not known we need to come up with an intelligent guess for an upper bound. 2
4 Terminology: Standard deviations and errors The standard deviation is a measure of variation/spread of a variable (in the population). This is typically denoted as σ. See Lecture 4. The standard error is a measure of variation/spread of the sample mean. The standard error of the sample mean X = 1 n n i=1 X i is σ n. See Lecture 12. Usually, σ is unknown. To get some idea of the spread, we estimate it 3
5 from the sample {X i } n i=1 s = 1 n 1 n (X i X) 2. i=1 using the formula Lecture 14 (MWF) The t-distribution We call s the sample standard deviation. It is an estimator of the standard deviation σ. Usually s σ. Often s < σ (especially, when the sample size is not large). Since σ is usually unknown, the standard error σ/ n is usually unknown. Instead we estimate it using the sample standard error is s n. 4
6 Motivation Lecture 14 (MWF) The t-distribution We take a SRS of 5 students and record their heights 61, 63, 65, 66, 72. The sample mean/average is Our objective is to construct a 95% confidence interval for the population mean of students. Putting numbers into the formula gives [ σ 5, σ 5 ] But the population standard deviation, σ, is unknown. We can estimate it from the data 61, 63, 65, 66, 72, using the sample standard deviation which is s = ( )2 + ( ) 2 + ( ) 2 + ( ) 2 + ( ) 2 =
7 and put 4.16 into the above confidence interval. Lecture 14 (MWF) The t-distribution What we want to know is whether it changes anything. In fact it turns out that the population standard deviation is σ = what does this tells us about the interval? 6
8 How estimating the standard deviation effects our results So far we have assumed that the standard deviation σ is known. This is sometimes a plausible assumption. There are situations when one may know the standard deviation but not the population mean. However in general we will not know σ. σ is unknown and has to be estimated from the data. Given a data set X 1,..., X n (say the 9 observations 0.025,0.025,0.057,0.064,0.054,0.035,0.047,0.059,0.045, used in the lecture 13) we can estimate it. 7
9 We can estimate the variance using the sample standard deviation s = 1 n 1 n (X i X) 2. i=1 Constructing confidence intervals In this case it seems reasonable to replace σ with s when evaluations a z-transform or a 95% CI: z-transform 95% CI [ X µ σ 2 n X µ s 2 n X ± 1.96 σ n ] t-transform [ X ± 1.96 s n ]?? CI But have we lost anything in replacing σ with s? 8
10 The effect of estimating the standard deviation In the discussion below we are assuming that the observations {X i } are independent random variables from a normal distribution with mean µ and standard deviation σ. What we discuss below has nothing to do with correcting for normality of the observations. It is about estimation of the population standard deviation σ. The sample standard deviation s is random it varies from sample to sample. If the sample size is relatively small it can often underestimate the true standard deviation. This can cause substantial problems. 9
11 The z-transform is the number of standard errors that can fit between the mean and the sample mean. If the standard deviation has been underestimated, then the z-transform will be larger than what it is suppose to be z = X µ σ X µ s n n }{{} smaller larger. There is a change in terminology (when we replace the population standard error with the sample standard error) we call it t-transform = X µ s. n 10
12 Equivalently, if we use the estimated standard deviation to construct the confidence interval, an underestimated standard deviation will result in a confidence interval that is too narrow. Consider the 95% confidence interval [ X 1.96 σ n, X σ n ] [ X 1.96 s n, X s ]. n If s is smaller than σ, then the interval will be too narrow for it to be a 95% confidence interval. We need to correct for the fact that s tends to underestimate the population standard deviation σ. Indeed, it is very simple to make the correction. All we need to do is change the distribution from a normal distribution to a t-distribution. 11
13 Gossett s experiment Lecture 14 (MWF) The t-distribution We find that when we estimate the variance (rather than use the true variance) we need to increase the size of the confidence interval to account for the greater variation in the Z-transform. This fact was discovered by William Gossett, who was a chemist, working for Guinness the brewery (in Ireland) and had to judge the quality of several brews. He was working with a small sample size X 1,..., X 10 (sample size is 10), 10 i=1 (X i X) and estimated the standard deviation from this s = From previous experiments he knew that the true mean was µ = 4. He wanted to construct 95% CIs for the mean. But, rather than use the population standard deviation σ, he replaced it with the sample standard 12
14 1 n deviation s = n 1 i=1 (X i X) 2. For each sample of size 10 he constructed the 95% CI: [ X 1.96 s, X s ] He counted the number of times the true mean µ was in the interval. You would expect that about 5% of the time the true mean should be outside the interval (since it is a 95% CI). What William Gosset noticed was that the true mean was outside the interval more than 5% of time. This interval is not a 95% confidence interval. 13

15 An illustration: Confidence intervals We draw a sample of size 10, from a normal distribution, and estimate both the sample mean and standard deviation and construct a 95% CI using z = Observe only 91 of the 100 confidence intervals contain the mean. We have less confidence in this interval than the stated 95% level! 14
16 The t-distribution Lecture 14 (MWF) The t-distribution The transform (which we formally called the z-transform) t = X µ s/ n t(n 1), has a t-distribution with (n 1)-degrees of freedom where n is the number of observations used to estimate σ and µ. Since t can usually be larger than z (since the sample standard error tends to be smaller than the population standard error), the distribution of t has thicker tails than a normal distribution. This means it can have extreme values or outliers. This is reflected in the critical values which are given 3 slides on. 15
17 The term degrees of freedom is a word commonly used in statistics. It refers to the effective sample used to estimate the population standard deviation. The (n 1)- comes into play because once the sample mean is estimated the effective sample size is (n 1) and not n. The distribution of X µ s/ n depends on the sample size. We call t(n 1) the Student t-distribution with (n 1)-degrees of freedom. We use the name Student, in honor of William Gosset (he wrote all his papers under the pseudonym Student). 16
18 How does this change things? We do almost everything as we did before, but when we estimate the standard deviation we use the t-distribution instead of the standard normal. The t-values are larger than the z-values to compensate for the underestimation of standard deviation. Rather than use the normal tables we use the t-tables which are very easy to use and can be found on my website. Most statistical software (such as JMP) 17

19 Reading t-tables (Table 2) 18
20 Confidence intervals using the t-distribution When the standard deviation σ is known. The (1 α)100% CI is [ X z α/2 σ, X + z α/2 σ ]. n n When the standard deviation σ is unknown, we estimate it from the data 1 n s = n 1 i=1 (X i X) 2 and use the CI [ X t α/2 (n 1) s, X + t α/2 (n 1) s ]. n n 19
 = 2.262 (compare with z = 1.96). By using the t-distribution we have 95% confidence the interval contains the mean. 20")
21 An illustration: Confidence intervals We draw a sample of size 10, from a normal distribution, and estimate both the sample mean and standard deviation and construct a 95% CI using t (9) = (compare with z = 1.96). By using the t-distribution we have 95% confidence the interval contains the mean. 20
22 Example 1: Red Wine and polyphenols It has been suggested that drinking red wine in moderation may protect against heart attacks. This is because red wine contains polyphenols which act on blood cholesterol. To see if moderate wine consumption does increase polyphenols, a group of nine random selected males were assigned to drink half a bottle of red wine daily for two weeks. The percentage change in their blood levels are 0.7, 3.5, 4, 4.9, 5.5, 7, 7.4, 8.1, 8.4 Here s the data: red_wine_polyphenol.txt. The sample mean is x = 5.5 and sample standard deviation is Construct a 95% confidence interval and discuss what your results possibly imply. 21
23 Solution 1: in JMP Lecture 14 (MWF) The t-distribution The 95% confidence interval constructed by default in JMP is [3.56, 7.43]. We discuss what this means below. 22
24 Solution 1: Red Wine Lecture 14 (MWF) The t-distribution The sample size is small, therefore to construct a reliable confidence interval we need that the distribution of the blood samples is does not deviate much from a normally distributed. Discussion of the polyphenol data set When the sample size is so small it is hard to tell from the 9 points on the QQplot whether the data has come from a normal distribution. However, the these points do not deviate too much from the line for us to believe it is skewed. Furthermore, a blood samples tend to come from a biological experiment. Based on these two facts, it seems plausible that the data does not come from a distribution severe skew or heavy tails. If this is the case, the distribution of the data is unlikely to deviate hugely from normality. Thus, the sample mean based on 9 is likely to be close to normal. We do not know the standard deviation and JMP estimates it from the 23
25 data. Therefore the 95% confidence interval constructed in JMP uses the t-distribution and not the normal distribution. The exact calculation: Use the t-tables with 8df (sample size, 9, minus one) and 2.5%. This gives the critical value Based on this the 95% CI for the mean is [ 5.5 ± ] = [3.57, 7.43], which are exactly the numbers given in the JMP output. 24
26 Example 2: Red Wine II We return to the same question but in order to get a smaller margin of error we include 6 extra males in our study. edu/~suhasini/teaching651/red_wine_polyphenol.txt. Notice some of the new guys actually had a drop in their polyphenol levels! 25
27 The sample mean is 4.3 and the sample standard deviation is Solution We now use a t-distribution with 14 degrees of freedom and the 95% CI for the mean level after drinking wine (for two weeks) is [ 4.3 ± ] = [2.1, 6]. The factor has decreased from the given in the previous example. This is because, the sample standard deviation based on n = 15 tends to be closer to the population standard deviation. 26
28 Comparing Example 1 and 2 The difference between Example 1 and Example 2 is the sample size has grown from 9 to 15. We compare the two samples below: We see that the smaller sample size contains less extreme values (the people whose polyphenol level went down with wine consumption). Less spread in the smaller sample size means that the corresponding estimated standard deviation will be less than the second sample (look at the output below and compare for n = 9, s = 2.5 whereas for n = 15, s = 3.1). We 27
29 see that for smaller sample sizes the estimated standard deviation tends to underestimate the true population standard deviation. 28
30 Extreme example: n= 3 Consider the data set 4, 5.5, 6. The sample mean and standard deviation x = 5.17 s = 1 2 [(4 5.17)2 + ( ) 2 + (6 5.17) 2 ] = With just three observations it is highly likely the sample standard deviation is anywhere close to the population standard deviation. The 95% confidence interval for the population mean is [ , ] = [2.6, 7.8] 29
31 Observe that the factor 4.3 is used instead of 1.96, since we have estimated the standard deviation using just 3 observations. 30
.")
32 Sample size and the sample standard deviation As the sample size grows, the standard error of the sample mean gets smaller (see green plot) and the sample standard deviation concentrates about the population mean (see blue plot). Below are plots of the distribution of sample means and standard deviation when n = 10 and n = 40, see the spread reduces as n gets larger. 31
33 Example: 95% Confidence intervals If σ is known. The 95% CI is [ X 1.96 σ n, X σ n ]. Below are the CIs using the sample standard deviation n = 3, n 1 = 2, t (2) = [ X s 3, X s 3 ]. n = 10, n 1 = 9, t (9) = [ X s 10, X s 10 ]. 32
34 n = 121, n 1 = 120, t (120) = Lecture 14 (MWF) The t-distribution [ X 1.98 s 121, X s 121 ]. As the sample size grows the critical values in the t-distribution get closer to the critical values of the normal distribution (in this case 1.96). 33
35 Common misunderstandings As the sample size gets large two completely different things happen: The distribution of the sample mean gets close to the normal distribution (lecture 11 and 12). This is called the central limit theorem. The sample standard error tends to get closer to the population standard deviation. This means the critical values of the t-distribution converge to those of a normal distribution. The t-distribution and the fact that the critical values of a t-distribution get closer to those of a normal distribution has nothing to do with the central limit theorem. 34
36 Conditions for using a t-distribution Observations are from a Simple Random Sample. The sample mean is close to normally distributed. 35
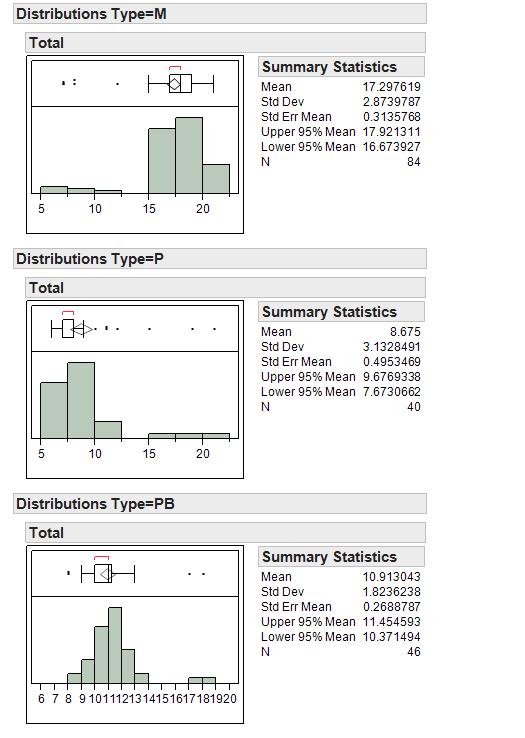
37 Example: Comparing the mean number of M&Ms in a bag We now analyse the M&M data to see whether the mean number of M&Ms in a bag vary according to the type of M&M. The data can be found here: There is a proper formal method called ANOVA, which we cover in lecture 24, where we can check to see whether all three have the same mean or not. However, a crude method is to simply check their confidence intervals. 36
38 37
39 Solution: Analysis and interpretation As the sample sizes used to construct each confidence interval are large (over 30 in each case), even though the distribution of M&Ms is not normal (they are integer valued!), it is safe to assume that the average is close to normal, therefore these 95% confidence intervals are reliably 95%. A summary of the output is given below: Plain: sample mean = 17.2, standard error = 0.31, CI = [16.67,17.92]. Peanut: sample mean = 8.6, standard error = 0.49, CI = [7.67,9.76]. Peanut butter: sample mean = 10.9, standard error = 0.26, CI = [10.37,11.45]. As none of the confidence intervals (recalling that in this interval we believe the mean for each case should like) intersect our crude analysis suggests that the means are all different. 38
40 In lecture 19 we will make the above precise (by constructing a confidence interval for the differences in the means). 39
.")
41 Statistics in articles Lecture 14 (MWF) The t-distribution This is a snap shot from the article on the influence of CO2 on diet by Eweis at. al. (2017). Below are the glucose and cholestrol levels in rats after drinking only regular water, a sugar soda, diet soda and decarbonated sugar soda (for 6 months). The table gives the [sample mean± sample standard deviation] for each group. In each group there are 4 rats. From these numbers, we can calculate the 95% confidence intervals for the population mean under each treatment. 40
42 When reading an article it is important to check if the ± is the margin of error (in which case the authors have given the confidence interval) of the sample standard deviation (in which case you need to construct the CI). In the article above the 95% confidence intervals for the mean level of water and RCB (regular soda) are [ 157 ± ] 4 [ 187 ± ] 4 = [121, 192] = [186.3, 187.6]. The intervals intersect, which means we have to cautious about saying that they have different treatment groups have different means. 41
43 However, the variation between the two data sets is very different (22 vs 0.4), which suggests that there are differences in the populations. But we need to keep in mind that these are estimated using very small sample sizes. Warning: Comparing the confidence intervals of several treatment groups can lead to false positives. This is one reason we do ANOVA, which is a method for collectively comparing the means across groups. We cover this later on in the course. 42
44 IMPORTANT!!! Lecture 14 (MWF) The t-distribution A common mistake that students make is that the t-distribution is used to correct for the non-normality of sample mean (for example when the sample size is not large enough). NOOOOOOOOOOOOOOOOOOOOOOOO In order to use the t-distribution we require that the sample mean is close to normal. THE ONLY REASON WE USE THE T-DISTRIBUTION is because the true population standard deviation is unknown and us estimated from the data. The t-distribution is used to correct for the error in the estimated standard deviation. 43

45 The t-distribution cannot correct for non-normality of the data Here we draw a sample of size 10 from a right-skewed distribution and use the t-distribution to construct a confidence interval for the mean. We see that only 87% of the confidence intervals contain the mean. Using the 44
Data Analysis and Statistical Methods Statistics 651
 Data Analysis and Statistical Methods Statistics 651 http://www.stat.tamu.edu/~suhasini/teaching.html Lecture 14 (MWF) The t-distribution Suhasini Subba Rao Review of previous lecture Often the precision
Data Analysis and Statistical Methods Statistics 651
 Data Analysis and Statistical Methods Statistics 651 http://www.stat.tamu.edu/~suhasini/teaching.html Lecture 13 (MWF) Designing the experiment: Margin of Error Suhasini Subba Rao Terminology: The population
6.1, 7.1 Estimating with confidence (CIS: Chapter 10)
") Objectives 6.1, 7.1 Estimating with confidence (CIS: Chapter 10) Statistical confidence (CIS gives a good explanation of a 95% CI) Confidence intervals Choosing the sample size t distributions One-sample
Objectives 6.1, 7.1 Estimating with confidence (CIS: Chapter 10) Statistical confidence (CIS gives a good explanation of a 95% CI) Confidence intervals Choosing the sample size t distributions One-sample
Data Analysis and Statistical Methods Statistics 651
 Data Analysis and Statistical Methods Statistics 651 http://www.stat.tamu.edu/~suhasini/teaching.html Lecture 10 (MWF) Checking for normality of the data using the QQplot Suhasini Subba Rao Checking for
Data Analysis and Statistical Methods Statistics 651
 Data Analysis and Statistical Methods Statistics 651 http://www.stat.tamu.edu/~suhasini/teaching.html Lecture 10 (MWF) Checking for normality of the data using the QQplot Suhasini Subba Rao Review of previous
Lecture 2 INTERVAL ESTIMATION II
 Lecture 2 INTERVAL ESTIMATION II Recap Population of interest - want to say something about the population mean µ perhaps Take a random sample... Recap When our random sample follows a normal distribution,
Data Analysis and Statistical Methods Statistics 651
 Data Analysis and Statistical Methods Statistics 651 http://wwwstattamuedu/~suhasini/teachinghtml Suhasini Subba Rao Review of previous lecture The main idea in the previous lecture is that the sample
Data Analysis and Statistical Methods Statistics 651
 Review of previous lecture: Why confidence intervals? Data Analysis and Statistical Methods Statistics 651 http://www.stat.tamu.edu/~suhasini/teaching.html Suhasini Subba Rao Suppose you want to know the
μ: ESTIMATES, CONFIDENCE INTERVALS, AND TESTS Business Statistics
 μ: ESTIMATES, CONFIDENCE INTERVALS, AND TESTS Business Statistics CONTENTS Estimating parameters The sampling distribution Confidence intervals for μ Hypothesis tests for μ The t-distribution Comparison
Interval estimation. September 29, Outline Basic ideas Sampling variation and CLT Interval estimation using X More general problems
 Interval estimation September 29, 2017 STAT 151 Class 7 Slide 1 Outline of Topics 1 Basic ideas 2 Sampling variation and CLT 3 Interval estimation using X 4 More general problems STAT 151 Class 7 Slide
Chapter 8 Statistical Intervals for a Single Sample
 Chapter 8 Statistical Intervals for a Single Sample Part 1: Confidence intervals (CI) for population mean µ Section 8-1: CI for µ when σ 2 known & drawing from normal distribution Section 8-1.2: Sample
Chapter 14 : Statistical Inference 1. Note : Here the 4-th and 5-th editions of the text have different chapters, but the material is the same.
 Chapter 14 : Statistical Inference 1 Chapter 14 : Introduction to Statistical Inference Note : Here the 4-th and 5-th editions of the text have different chapters, but the material is the same. Data x
CHAPTER 8. Confidence Interval Estimation Point and Interval Estimates
 CHAPTER 8. Confidence Interval Estimation Point and Interval Estimates A point estimate is a single number, a confidence interval provides additional information about the variability of the estimate Lower
1 Inferential Statistic
 1 Inferential Statistic Population versus Sample, parameter versus statistic A population is the set of all individuals the researcher intends to learn about. A sample is a subset of the population and
Confidence Intervals Introduction
 Confidence Intervals Introduction A point estimate provides no information about the precision and reliability of estimation. For example, the sample mean X is a point estimate of the population mean μ
Elementary Statistics
 Chapter 7 Estimation Goal: To become familiar with how to use Excel 2010 for Estimation of Means. There is one Stat Tool in Excel that is used with estimation of means, T.INV.2T. Open Excel and click on
Data Analysis and Statistical Methods Statistics 651
 Data Analysis and Statistical Methods Statistics 651 http://www.stat.tamu.edu/~suhasini/teaching.html Lecture 7 (MWF) Analyzing the sums of binary outcomes Suhasini Subba Rao Introduction Lecture 7 (MWF)
Determining Sample Size. Slide 1 ˆ ˆ. p q n E = z α / 2. (solve for n by algebra) n = E 2
 n = E 2") Determining Sample Size Slide 1 E = z α / 2 ˆ ˆ p q n (solve for n by algebra) n = ( zα α / 2) 2 p ˆ qˆ E 2 Sample Size for Estimating Proportion p When an estimate of ˆp is known: Slide 2 n = ˆ ˆ ( )
Determining Sample Size Slide 1 E = z α / 2 ˆ ˆ p q n (solve for n by algebra) n = ( zα α / 2) 2 p ˆ qˆ E 2 Sample Size for Estimating Proportion p When an estimate of ˆp is known: Slide 2 n = ˆ ˆ ( )
value BE.104 Spring Biostatistics: Distribution and the Mean J. L. Sherley
 BE.104 Spring Biostatistics: Distribution and the Mean J. L. Sherley Outline: 1) Review of Variation & Error 2) Binomial Distributions 3) The Normal Distribution 4) Defining the Mean of a population Goals:
The topics in this section are related and necessary topics for both course objectives.
 2.5 Probability Distributions The topics in this section are related and necessary topics for both course objectives. A probability distribution indicates how the probabilities are distributed for outcomes
AMS 7 Sampling Distributions, Central limit theorem, Confidence Intervals Lecture 4
 AMS 7 Sampling Distributions, Central limit theorem, Confidence Intervals Lecture 4 Department of Applied Mathematics and Statistics, University of California, Santa Cruz Summer 2014 1 / 26 Sampling Distributions!!!!!!
STAT Chapter 7: Confidence Intervals
 STAT 515 -- Chapter 7: Confidence Intervals With a point estimate, we used a single number to estimate a parameter. We can also use a set of numbers to serve as reasonable estimates for the parameter.
Hypothesis Tests: One Sample Mean Cal State Northridge Ψ320 Andrew Ainsworth PhD
 Hypothesis Tests: One Sample Mean Cal State Northridge Ψ320 Andrew Ainsworth PhD MAJOR POINTS Sampling distribution of the mean revisited Testing hypotheses: sigma known An example Testing hypotheses:
Lecture 10 - Confidence Intervals for Sample Means
 Lecture 10 - Confidence Intervals for Sample Means Sta102/BME102 October 5, 2015 Colin Rundel Confidence Intervals in the Real World A small problem Lets assume we are collecting a large sample (n=200)
Learning Objectives for Ch. 7
 Chapter 7: Point and Interval Estimation Hildebrand, Ott and Gray Basic Statistical Ideas for Managers Second Edition 1 Learning Objectives for Ch. 7 Obtaining a point estimate of a population parameter
LESSON 7 INTERVAL ESTIMATION SAMIE L.S. LY
 LESSON 7 INTERVAL ESTIMATION SAMIE L.S. LY 1 THIS WEEK S PLAN Part I: Theory + Practice ( Interval Estimation ) Part II: Theory + Practice ( Interval Estimation ) z-based Confidence Intervals for a Population
T.I.H.E. IT 233 Statistics and Probability: Sem. 1: 2013 ESTIMATION
 In Inferential Statistic, ESTIMATION (i) (ii) is called the True Population Mean and is called the True Population Proportion. You must also remember that are not the only population parameters. There
ECO220Y Estimation: Confidence Interval Estimator for Sample Proportions Readings: Chapter 11 (skip 11.5)
") ECO220Y Estimation: Confidence Interval Estimator for Sample Proportions Readings: Chapter 11 (skip 11.5) Fall 2011 Lecture 10 (Fall 2011) Estimation Lecture 10 1 / 23 Review: Sampling Distributions Sample
ECO220Y Estimation: Confidence Interval Estimator for Sample Proportions Readings: Chapter 11 (skip 11.5) Fall 2011 Lecture 10 (Fall 2011) Estimation Lecture 10 1 / 23 Review: Sampling Distributions Sample
Week 2 Quantitative Analysis of Financial Markets Hypothesis Testing and Confidence Intervals
 Week 2 Quantitative Analysis of Financial Markets Hypothesis Testing and Confidence Intervals Christopher Ting http://www.mysmu.edu/faculty/christophert/ Christopher Ting : christopherting@smu.edu.sg :
Previously, when making inferences about the population mean, μ, we were assuming the following simple conditions:
 Chapter 17 Inference about a Population Mean Conditions for inference Previously, when making inferences about the population mean, μ, we were assuming the following simple conditions: (1) Our data (observations)
Data Analysis and Statistical Methods Statistics 651
 Data Analysis and Statistical Methods Statistics 651 http://www.stat.tamu.edu/~suhasini/teaching.html Suhasini Subba Rao The binomial: mean and variance Recall that the number of successes out of n, denoted
Statistics for Business and Economics
 Statistics for Business and Economics Chapter 7 Estimation: Single Population Copyright 010 Pearson Education, Inc. Publishing as Prentice Hall Ch. 7-1 Confidence Intervals Contents of this chapter: Confidence
Lecture 2. Probability Distributions Theophanis Tsandilas
 Lecture 2 Probability Distributions Theophanis Tsandilas Comment on measures of dispersion Why do common measures of dispersion (variance and standard deviation) use sums of squares: nx (x i ˆµ) 2 i=1
Unit 5: Sampling Distributions of Statistics
 Unit 5: Sampling Distributions of Statistics Statistics 571: Statistical Methods Ramón V. León 6/12/2004 Unit 5 - Stat 571 - Ramon V. Leon 1 Definitions and Key Concepts A sample statistic used to estimate
Unit 5: Sampling Distributions of Statistics
 Unit 5: Sampling Distributions of Statistics Statistics 571: Statistical Methods Ramón V. León 6/12/2004 Unit 5 - Stat 571 - Ramon V. Leon 1 Definitions and Key Concepts A sample statistic used to estimate
The Two-Sample Independent Sample t Test
 Department of Psychology and Human Development Vanderbilt University 1 Introduction 2 3 The General Formula The Equal-n Formula 4 5 6 Independence Normality Homogeneity of Variances 7 Non-Normality Unequal
8.1 Estimation of the Mean and Proportion
 8.1 Estimation of the Mean and Proportion Statistical inference enables us to make judgments about a population on the basis of sample information. The mean, standard deviation, and proportions of a population
1 Small Sample CI for a Population Mean µ
 Lecture 7: Small Sample Confidence Intervals Based on a Normal Population Distribution Readings: Sections 7.4-7.5 1 Small Sample CI for a Population Mean µ The large sample CI x ± z α/2 s n was constructed
Chapter 6.1 Confidence Intervals. Stat 226 Introduction to Business Statistics I. Chapter 6, Section 6.1
 Stat 226 Introduction to Business Statistics I Spring 2009 Professor: Dr. Petrutza Caragea Section A Tuesdays and Thursdays 9:30-10:50 a.m. Chapter 6, Section 6.1 Confidence Intervals Confidence Intervals
FEEG6017 lecture: The normal distribution, estimation, confidence intervals. Markus Brede,
 FEEG6017 lecture: The normal distribution, estimation, confidence intervals. Markus Brede, mb8@ecs.soton.ac.uk The normal distribution The normal distribution is the classic "bell curve". We've seen that
Statistics 13 Elementary Statistics
 Statistics 13 Elementary Statistics Summer Session I 2012 Lecture Notes 5: Estimation with Confidence intervals 1 Our goal is to estimate the value of an unknown population parameter, such as a population
Estimation Y 3. Confidence intervals I, Feb 11,
 Estimation Example: Cholesterol levels of heart-attack patients Data: Observational study at a Pennsylvania medical center blood cholesterol levels patients treated for heart attacks measurements 2, 4,
χ 2 distributions and confidence intervals for population variance
 χ 2 distributions and confidence intervals for population variance Let Z be a standard Normal random variable, i.e., Z N(0, 1). Define Y = Z 2. Y is a non-negative random variable. Its distribution is
Biostatistics and Design of Experiments Prof. Mukesh Doble Department of Biotechnology Indian Institute of Technology, Madras
 Biostatistics and Design of Experiments Prof. Mukesh Doble Department of Biotechnology Indian Institute of Technology, Madras Lecture - 05 Normal Distribution So far we have looked at discrete distributions
Key Objectives. Module 2: The Logic of Statistical Inference. Z-scores. SGSB Workshop: Using Statistical Data to Make Decisions
 SGSB Workshop: Using Statistical Data to Make Decisions Module 2: The Logic of Statistical Inference Dr. Tom Ilvento January 2006 Dr. Mugdim Pašić Key Objectives Understand the logic of statistical inference
Elementary Statistics Triola, Elementary Statistics 11/e Unit 14 The Confidence Interval for Means, σ Unknown
 Elementary Statistics We are now ready to begin our exploration of how we make estimates of the population mean. Before we get started, I want to emphasize the importance of having collected a representative
Chapter 11: Inference for Distributions Inference for Means of a Population 11.2 Comparing Two Means
 Chapter 11: Inference for Distributions 11.1 Inference for Means of a Population 11.2 Comparing Two Means 1 Population Standard Deviation In the previous chapter, we computed confidence intervals and performed
Figure 1: 2πσ is said to have a normal distribution with mean µ and standard deviation σ. This is also denoted
 Figure 1: Math 223 Lecture Notes 4/1/04 Section 4.10 The normal distribution Recall that a continuous random variable X with probability distribution function f(x) = 1 µ)2 (x e 2σ 2πσ is said to have a
Contents. 1 Introduction. Math 321 Chapter 5 Confidence Intervals. 1 Introduction 1
 Math 321 Chapter 5 Confidence Intervals (draft version 2019/04/11-11:17:37) Contents 1 Introduction 1 2 Confidence interval for mean µ 2 2.1 Known variance................................. 2 2.2 Unknown
1. Statistical problems - a) Distribution is known. b) Distribution is unknown.
 Distribution is known. b) Distribution is unknown.") Probability February 5, 2013 Debdeep Pati Estimation 1. Statistical problems - a) Distribution is known. b) Distribution is unknown. 2. When Distribution is known, then we can have either i) Parameters
Probability February 5, 2013 Debdeep Pati Estimation 1. Statistical problems - a) Distribution is known. b) Distribution is unknown. 2. When Distribution is known, then we can have either i) Parameters
σ 2 : ESTIMATES, CONFIDENCE INTERVALS, AND TESTS Business Statistics
 σ : ESTIMATES, CONFIDENCE INTERVALS, AND TESTS Business Statistics CONTENTS Estimating other parameters besides μ Estimating variance Confidence intervals for σ Hypothesis tests for σ Estimating standard
Statistics and Probability
 Statistics and Probability Continuous RVs (Normal); Confidence Intervals Outline Continuous random variables Normal distribution CLT Point estimation Confidence intervals http://www.isrec.isb-sib.ch/~darlene/geneve/
Sampling & Confidence Intervals
 Sampling & Confidence Intervals Mark Lunt Arthritis Research UK Epidemiology Unit University of Manchester 24/10/2017 Principles of Sampling Often, it is not practical to measure every subject in a population.
Copyright 2011 Pearson Education, Inc. Publishing as Addison-Wesley.
 Appendix: Statistics in Action Part I Financial Time Series 1. These data show the effects of stock splits. If you investigate further, you ll find that most of these splits (such as in May 1970) are 3-for-1
Chapter 5. Sampling Distributions
 Lecture notes, Lang Wu, UBC 1 Chapter 5. Sampling Distributions 5.1. Introduction In statistical inference, we attempt to estimate an unknown population characteristic, such as the population mean, µ,
10/1/2012. PSY 511: Advanced Statistics for Psychological and Behavioral Research 1
 PSY 511: Advanced Statistics for Psychological and Behavioral Research 1 Pivotal subject: distributions of statistics. Foundation linchpin important crucial You need sampling distributions to make inferences:
1/12/2011. Chapter 5: z-scores: Location of Scores and Standardized Distributions. Introduction to z-scores. Introduction to z-scores cont.
 Chapter 5: z-scores: Location of Scores and Standardized Distributions Introduction to z-scores In the previous two chapters, we introduced the concepts of the mean and the standard deviation as methods
A point estimate is a single value (statistic) used to estimate a population value (parameter).
 used to estimate a population value (parameter).") Shahzad Bashir. 1 Chapter 9 Estimation & Confidence Interval Interval Estimation for Population Mean: σ Known Interval Estimation for Population Mean: σ Unknown Determining the Sample Size 2 A point estimate
Shahzad Bashir. 1 Chapter 9 Estimation & Confidence Interval Interval Estimation for Population Mean: σ Known Interval Estimation for Population Mean: σ Unknown Determining the Sample Size 2 A point estimate
ECON 214 Elements of Statistics for Economists 2016/2017
 ECON 214 Elements of Statistics for Economists 2016/2017 Topic The Normal Distribution Lecturer: Dr. Bernardin Senadza, Dept. of Economics bsenadza@ug.edu.gh College of Education School of Continuing and
. 13. The maximum error (margin of error) of the estimate for μ (based on known σ) is:
 of the estimate for μ (based on known σ) is:") Statistics Sample Exam 3 Solution Chapters 6 & 7: Normal Probability Distributions & Estimates 1. What percent of normally distributed data value lie within 2 standard deviations to either side of the
Statistics Sample Exam 3 Solution Chapters 6 & 7: Normal Probability Distributions & Estimates 1. What percent of normally distributed data value lie within 2 standard deviations to either side of the
Chapter 4: Estimation
 Slide 4.1 Chapter 4: Estimation Estimation is the process of using sample data to draw inferences about the population Sample information x, s Inferences Population parameters µ,σ Slide 4. Point and interval
CIVL Confidence Intervals
 CIVL 3103 Confidence Intervals Learning Objectives - Confidence Intervals Define confidence intervals, and explain their significance to point estimates. Identify and apply the appropriate confidence interval
1 Sampling Distributions
 1 Sampling Distributions 1.1 Statistics and Sampling Distributions When a random sample is selected the numerical descriptive measures calculated from such a sample are called statistics. These statistics
Chapter 7. Confidence Intervals and Sample Sizes. Definition. Definition. Definition. Definition. Confidence Interval : CI. Point Estimate.
 Chapter 7 Confidence Intervals and Sample Sizes 7. Estimating a Proportion p 7.3 Estimating a Mean µ (σ known) 7.4 Estimating a Mean µ (σ unknown) 7.5 Estimating a Standard Deviation σ In a recent poll,
Basic Procedure for Histograms
 Basic Procedure for Histograms 1. Compute the range of observations (min. & max. value) 2. Choose an initial # of classes (most likely based on the range of values, try and find a number of classes that
ECON 214 Elements of Statistics for Economists
 ECON 214 Elements of Statistics for Economists Session 7 The Normal Distribution Part 1 Lecturer: Dr. Bernardin Senadza, Dept. of Economics Contact Information: bsenadza@ug.edu.gh College of Education
Section 7-2 Estimating a Population Proportion
 Section 7- Estimating a Population Proportion 1 Key Concept In this section we present methods for using a sample proportion to estimate the value of a population proportion. The sample proportion is the
The Normal Distribution
 Stat 6 Introduction to Business Statistics I Spring 009 Professor: Dr. Petrutza Caragea Section A Tuesdays and Thursdays 9:300:50 a.m. Chapter, Section.3 The Normal Distribution Density Curves So far we
The "bell-shaped" curve, or normal curve, is a probability distribution that describes many real-life situations.
 6.1 6.2 The Standard Normal Curve The "bell-shaped" curve, or normal curve, is a probability distribution that describes many real-life situations. Basic Properties 1. The total area under the curve is.
Basic Data Analysis. Stephen Turnbull Business Administration and Public Policy Lecture 4: May 2, Abstract
 Basic Data Analysis Stephen Turnbull Business Administration and Public Policy Lecture 4: May 2, 2013 Abstract Introduct the normal distribution. Introduce basic notions of uncertainty, probability, events,
One sample z-test and t-test
 One sample z-test and t-test January 30, 2017 psych10.stanford.edu Announcements / Action Items Install ISI package (instructions in Getting Started with R) Assessment Problem Set #3 due Tu 1/31 at 7 PM
Name PID Section # (enrolled)
") STT 315 - Lecture 3 Instructor: Aylin ALIN 04/02/2014 Midterm # 2 A Name PID Section # (enrolled) * The exam is closed book and 80 minutes. * You may use a calculator and the formula sheet that you brought
STT 315 - Lecture 3 Instructor: Aylin ALIN 04/02/2014 Midterm # 2 A Name PID Section # (enrolled) * The exam is closed book and 80 minutes. * You may use a calculator and the formula sheet that you brought
1 Introduction 1. 3 Confidence interval for proportion p 6
 Math 321 Chapter 5 Confidence Intervals (draft version 2019/04/15-13:41:02) Contents 1 Introduction 1 2 Confidence interval for mean µ 2 2.1 Known variance................................. 3 2.2 Unknown
Statistical Intervals. Chapter 7 Stat 4570/5570 Material from Devore s book (Ed 8), and Cengage
, and Cengage") 7 Statistical Intervals Chapter 7 Stat 4570/5570 Material from Devore s book (Ed 8), and Cengage Confidence Intervals The CLT tells us that as the sample size n increases, the sample mean X is close to
7 Statistical Intervals Chapter 7 Stat 4570/5570 Material from Devore s book (Ed 8), and Cengage Confidence Intervals The CLT tells us that as the sample size n increases, the sample mean X is close to
Confidence Intervals. σ unknown, small samples The t-statistic /22
 Confidence Intervals σ unknown, small samples The t-statistic 1 /22 Homework Read Sec 7-3. Discussion Question pg 365 Do Ex 7-3 1-4, 6, 9, 12, 14, 15, 17 2/22 Objective find the confidence interval for
Reminders. Quiz today - please bring a calculator I ll post the next HW by Saturday (last HW!)
") Reminders Quiz today - please bring a calculator I ll post the next HW by Saturday (last HW!) 1 Warm Up Chat with your neighbor. What is the Central Limit Theorem? Why do we care about it? What s the (long)
Reminders Quiz today - please bring a calculator I ll post the next HW by Saturday (last HW!) 1 Warm Up Chat with your neighbor. What is the Central Limit Theorem? Why do we care about it? What s the (long)
Confidence Intervals and Sample Size
 Confidence Intervals and Sample Size Chapter 6 shows us how we can use the Central Limit Theorem (CLT) to 1. estimate a population parameter (such as the mean or proportion) using a sample, and. determine
Normal Probability Distributions
 Normal Probability Distributions Properties of Normal Distributions The most important probability distribution in statistics is the normal distribution. Normal curve A normal distribution is a continuous
Sampling and sampling distribution
 Sampling and sampling distribution September 12, 2017 STAT 101 Class 5 Slide 1 Outline of Topics 1 Sampling 2 Sampling distribution of a mean 3 Sampling distribution of a proportion STAT 101 Class 5 Slide
Chapter 9. Sampling Distributions. A sampling distribution is created by, as the name suggests, sampling.
 Chapter 9 Sampling Distributions 9.1 Sampling Distributions A sampling distribution is created by, as the name suggests, sampling. The method we will employ on the rules of probability and the laws of
A) The first quartile B) The Median C) The third quartile D) None of the previous. 2. [3] If P (A) =.8, P (B) =.7, and P (A B) =.
![A) The first quartile B) The Median C) The third quartile D) None of the previous. 2. [3] If P (A) =.8, P (B) =.7, and P (A B) =.](/thumbs/95/124846909.jpg "A) The first quartile B) The Median C) The third quartile D) None of the previous. 2. [3] If P (A) =.8, P (B) =.7, and P (A B) =.") Review for stat2507 Final (December 2008) Part I: Multiple Choice questions (on 39%): Please circle only one choice. 1. [3] Which one of the following summary measures is affected most by outliers A) The
Review for stat2507 Final (December 2008) Part I: Multiple Choice questions (on 39%): Please circle only one choice. 1. [3] Which one of the following summary measures is affected most by outliers A) The
19. CONFIDENCE INTERVALS FOR THE MEAN; KNOWN VARIANCE
 19. CONFIDENCE INTERVALS FOR THE MEAN; KNOWN VARIANCE We assume here that the population variance σ 2 is known. This is an unrealistic assumption, but it allows us to give a simplified presentation which
Distribution. Lecture 34 Section Fri, Oct 31, Hampden-Sydney College. Student s t Distribution. Robb T. Koether.
 Lecture 34 Section 10.2 Hampden-Sydney College Fri, Oct 31, 2008 Outline 1 2 3 4 5 6 7 8 Exercise 10.4, page 633. A psychologist is studying the distribution of IQ scores of girls at an alternative high
Statistical Intervals (One sample) (Chs )
 (Chs )") 7 Statistical Intervals (One sample) (Chs 8.1-8.3) Confidence Intervals The CLT tells us that as the sample size n increases, the sample mean X is close to normally distributed with expected value µ and
7 Statistical Intervals (One sample) (Chs 8.1-8.3) Confidence Intervals The CLT tells us that as the sample size n increases, the sample mean X is close to normally distributed with expected value µ and
SAMPLING DISTRIBUTIONS. Chapter 7
 SAMPLING DISTRIBUTIONS Chapter 7 7.1 How Likely Are the Possible Values of a Statistic? The Sampling Distribution Statistic and Parameter Statistic numerical summary of sample data: p-hat or xbar Parameter
A Single Population Mean using the Student t Distribution
 OpenStax-CNX module: m47001 1 A Single Population Mean using the Student t Distribution OpenStax College This work is produced by OpenStax-CNX and licensed under the Creative Commons Attribution License
Two Populations Hypothesis Testing
 Two Populations Hypothesis Testing Two Proportions (Large Independent Samples) Two samples are said to be independent if the data from the first sample is not connected to the data from the second sample.
Frequency Distribution and Summary Statistics
 Frequency Distribution and Summary Statistics Dongmei Li Department of Public Health Sciences Office of Public Health Studies University of Hawai i at Mānoa Outline 1. Stemplot 2. Frequency table 3. Summary
GETTING STARTED. To OPEN MINITAB: Click Start>Programs>Minitab14>Minitab14 or Click Minitab 14 on your Desktop
 Minitab 14 1 GETTING STARTED To OPEN MINITAB: Click Start>Programs>Minitab14>Minitab14 or Click Minitab 14 on your Desktop The Minitab session will come up like this 2 To SAVE FILE 1. Click File>Save Project
Descriptive Statistics (Devore Chapter One)
") Descriptive Statistics (Devore Chapter One) 1016-345-01 Probability and Statistics for Engineers Winter 2010-2011 Contents 0 Perspective 1 1 Pictorial and Tabular Descriptions of Data 2 1.1 Stem-and-Leaf
Descriptive Statistics (Devore Chapter One) 1016-345-01 Probability and Statistics for Engineers Winter 2010-2011 Contents 0 Perspective 1 1 Pictorial and Tabular Descriptions of Data 2 1.1 Stem-and-Leaf
Measures of Dispersion (Range, standard deviation, standard error) Introduction
 Introduction") Measures of Dispersion (Range, standard deviation, standard error) Introduction We have already learnt that frequency distribution table gives a rough idea of the distribution of the variables in a sample
Measures of Dispersion (Range, standard deviation, standard error) Introduction We have already learnt that frequency distribution table gives a rough idea of the distribution of the variables in a sample
MgtOp S 215 Chapter 8 Dr. Ahn
 MgtOp S 215 Chapter 8 Dr. Ahn An estimator of a population parameter is a rule that tells us how to use the sample values,,, to estimate the parameter, and is a statistic. An estimate is the value obtained
Statistics Class 15 3/21/2012
 Statistics Class 15 3/21/2012 Quiz 1. Cans of regular Pepsi are labeled to indicate that they contain 12 oz. Data Set 17 in Appendix B lists measured amounts for a sample of Pepsi cans. The same statistics
Tests for Two Variances
 Chapter 655 Tests for Two Variances Introduction Occasionally, researchers are interested in comparing the variances (or standard deviations) of two groups rather than their means. This module calculates
Business Statistics 41000: Probability 3
 Business Statistics 41000: Probability 3 Drew D. Creal University of Chicago, Booth School of Business February 7 and 8, 2014 1 Class information Drew D. Creal Email: dcreal@chicagobooth.edu Office: 404
Chapter 7. Inferences about Population Variances
 Chapter 7. Inferences about Population Variances Introduction () The variability of a population s values is as important as the population mean. Hypothetical distribution of E. coli concentrations from
An approximate sampling distribution for the t-ratio. Caution: comparing population means when σ 1 σ 2.
 Stat 529 (Winter 2011) Non-pooled t procedures (The Welch test) Reading: Section 4.3.2 The sampling distribution of Y 1 Y 2. An approximate sampling distribution for the t-ratio. The Sri Lankan analysis.
Multiple Regression. Review of Regression with One Predictor
 Fall Semester, 2001 Statistics 621 Lecture 4 Robert Stine 1 Preliminaries Multiple Regression Grading on this and other assignments Assignment will get placed in folder of first member of Learning Team.
Sampling Distributions and the Central Limit Theorem
 Sampling Distributions and the Central Limit Theorem February 18 Data distributions and sampling distributions So far, we have discussed the distribution of data (i.e. of random variables in our sample,
Chapter 4 Variability
 Chapter 4 Variability PowerPoint Lecture Slides Essentials of Statistics for the Behavioral Sciences Seventh Edition by Frederick J Gravetter and Larry B. Wallnau Chapter 4 Learning Outcomes 1 2 3 4 5