A point estimate is a single value (statistic) used to estimate a population value (parameter).
|
|
|
- Joseph Spencer
- 5 years ago
- Views:
Transcription
1 Shahzad Bashir. 1
2 Chapter 9 Estimation & Confidence Interval Interval Estimation for Population Mean: σ Known Interval Estimation for Population Mean: σ Unknown Determining the Sample Size 2
3 A point estimate is a single value (statistic) used to estimate a population value (parameter). An Interval Estimatestates the range within which a population parameter probably lies. A confidence intervalis a range of values within which the population parameter is expected to occur. The two confidence intervals that are used extensively are the 95%and the 99%. 3
4 Interpretation of Interval Estimation For a 95%confidence interval about 95%of the similarly constructed intervals will contain the parameter being estimated. For the 99%confidence interval, 99%of the sample means for a specified sample size will lie within 2.58standard deviations of the hypothesized population mean. 95%of the sample means for a specified sample size will lie within 1.96standard deviations of the hypothesized population mean. 4
5 Margin of Error and the Interval Estimate A point estimator cannot be expected to provide the exact value of the population parameter. An interval estimate can be computed by adding and subtracting a margin of error to the point estimate. Point Estimate +/ Margin of Error The purpose of an interval estimate is to provide information about how close the point estimate is to the value of the parameter. 5
6 Margin of Error and the Interval Estimate (Continued) The general form of an interval estimate of a population mean is x ± Margin of Error Point Estimate 6
7 Interval Estimation of a Population Mean: σ Known (Continued) In order to develop an interval estimate of a population mean,, the margin of error must be computed using either: the population standard deviation σ,, or the sample standard deviation s σ is rarely known exactly, but often a good estimate can be obtained based on historical data or other information. We refer to such cases as the σ knowncase. 7
8 Interval Estimation of a Population Mean: σ Known (Continued) There is a 1 α probability that the value of a sample mean will provide a margin of error of z or less. Sampling distribution of x α/2 1 - α of all α/2 x values α/2 σ x z α/2 σ x µ z α/2 σ x x 8
9 Interval Estimate of a Population Mean: σ Known (Continued) interval does not include µ Sampling distribution of x α/2 1 - α of all x values α/2 x z α/2 σ [ ] x µ z σ x x x α/2 [ ] [ ] x interval includes µ 9
10 Interval Estimate of a Population Mean: σ Known (Continued) Interval Estimate of µ Point Estimation of Population Mean where: x x σ ± z α n /2 Margin of Error is the sample mean 1 -αα is the confidence coefficient z α/2 is the zvalue providing an area of α/2 in the upper tail of the standard normal probability distribution σ is the population standard deviation n is the sample size 10
11 Interval Estimate of Population Mean: σ Known Example: Discount Sounds Discount Sounds has 260 retail outlets throughout the United States. The firm is evaluating a potential location for a D new outlet, based in part, on the mean annual income of the individuals in the marketing area of the new location. A sample of size n= = 36was taken; the sample mean income is $31,100. The population standard deviation is estimated to be $4,500, and the confidence coefficient to be used in the interval estimate is
12 Interval Estimate of Population Mean: σ Known D The margin of error is: z α/2 σ 4,500 = 1.96 = 1, 470 n 36 Thus, at 95% confidence, the margin of error is $1,470. Note: To find the Z from the table do the following: α/2 =.05/2=.025 and =.975 and from table Z is
13 Interval Estimate of Population Mean: σ Known D Interval estimate of µ is: x σ ± z α /2 n $31,100 + $1,470 or $29,630 to $32,570 We are 95% confident that the interval contains the population mean. Note that the sample mean was = $31,
14 Interval Estimation of a Population Mean: σ Unknown If an estimate of the population standard deviation σ cannot be developed prior to sampling, we use the sample standard deviation sto estimate σ. This is the σ unknown case. In this case, the interval estimate for µis based on the t distribution. 14

15 t Distribution The t distribution is a family of similar probability distributions. A specific t distribution depends on a parameter known as the degrees of freedom. Degrees of freedom refer to the number of independent pieces of information that go into the computation of s. 15

16 t Distribution (Continued) A t distribution with more degrees of freedom has less dispersion. As the number of degrees of freedom increases, the difference between the t distribution and the standard normal probability distribution becomes smallerand and smaller. 16
17 t Distribution (Continued) Standard normal distribution t distribution (20 degrees of freedom) t distribution (10 degrees of freedom) 0 z, t 17
18 Student s t Table 18
19 Student s t Table Upper Tail Area df
20 Student s t Table Upper Tail Area df t values 20
21 Student s t Table Upper Tail Area α / 2 df t values 0 α / 2 t 21
22 Student s t Table Upper Tail Area df α / 2 Assume: n = 3 df = n - 1 = 2 α =.10 α / 2 = t values 0 α / 2 t 22
23 Student s t Table Upper Tail Area df α / 2 Assume: n = 3 df = n - 1 = 2 α =.10 α / 2 = t values 0 α / 2 t 23
24 Student s t Table Upper Tail Area df α / 2 Assume: n = 3 df = n - 1 = 2 α =.10 α / 2 = t values 0.05 t 24
25 Student s t Table Upper Tail Area df α / 2 Assume: n = 3 df = n - 1 = 2 α =.10 α / 2 = t values t 25
26 Interval Estimation of a Population Mean: σ Unknown Interval Estimate Point Estimation of Population Mean x ± t α/2 s n Margin of Error where: 1 -α = the confidence coefficient t α/2 =the t value providing an area of α/2α in the upper tail of a t distribution with n-1 1 degrees of freedom s = the sample standard deviation 26
27 Interval Estimation of a Population Mean: σ Unknown Example: Apartment Rents A reporter for a student newspaper is writing an article on the cost of off-campus housing. A sample of 16 efficiency apartments within a half-mile of campus resulted in a sample mean of $650per month and a sample standard deviation of $55. 27

28 Interval Estimation of a Population Mean: σ Unknown (Example Continued) Example: Apartment Rents Let us provide a 95%confidence interval estimate of the mean rent per month for the population of efficiency apartments within a half-mile of campus. 28
29 Interval Estimation of a Population Mean: σ Unknown (Example Continued) At 95% confidence, α= =.05, and α/2 =.025. t is based on n 1 1 = = 15 degrees of freedom. In the t distribution table we see that t.025 = Degrees Area in Upper Tail of Freedom
30 Interval Estimation of a Population Mean: σ Unknown (Example Continued) Interval Estimate x ± t.025 s n ± = 650 ± We are 95%confident that the mean rent per month for the population of efficiency apartments within a half-mile of campus is between $620.70and $
31 Summary of Interval Estimation Procedures for a Population Mean Yes σ Known Case Can the population standard deviation σ be assumed known? No Use the sample standard deviation s to estimate x ± z Use α/2 σ n σ Unknown Case & Small Sample x ± t Use α/2 s n 31
32 If σ is unknownand n>30, the standard deviation of the sample, designated by s, is used to approximate the population standard deviation. Interval Estimation Summary X ± z s n If the population standard deviation (σ ) is known or the sample (n) is n 30we use the z distribution. 32
33 If the population standard deviation (σ) is unknown, and the underlying population is approximately normal, and the sample size is less than 30(n<30) we use the t distribution. Interval Estimation Summary s X ± t n The value oft for a given confidence level depends upon its degrees of freedom. 33
34 More Examples Confidence Interval Estimate for Mean (σknown)
35 Thinking Challenge Example You re a Q/C inspector for Gallo. The σfor 2-liter bottles is 0.05liters. A random sample of 100 bottles showedthat sample mean = 1.99liters. What is the 90% confidence interval estimate of the true meanamount amount in 2-liter bottles? To find the Z: α =1-90% =0.1 and α/2 =0.1/2 = = 0.95 and from table, the Z is: ( )/ 2 = liter 35
36 Confidence Interval Solution X σ Z µ α / 2 X + Zα / 2 n σ n µ µ We are 90% confident that interval estimate of the true meanamount amount in 2-liter bottles is between 1.98 and
37 Confidence Interval of µ (σunknown and n 30) Example The School of Business Dean at CSUwants to estimate the mean number of hours worked per week by business students. A sample of 49students showed a mean of 24hours with a standard deviation of 4 hours. What is the pointestimate of the mean number of hours worked per week by students? The point estimate is 24 hours (sample mean). What is the 95%confidence interval for the average number of hours worked per week by the students? 37
38 Example & Solution(Continued) Using the formula, we have 24 ±1.96(4/7) or we have 22.88to What are the 95% confidence limits? The endpoints of the confidence interval are the confidence limits. The lower confidence limit is 22.88and the upper confidence limit is What degree of confidence is being used? The degree of confidence (level of confidence) is
39 Example & Solution(Continued) Interpret the findings. If we had time to select 100 samples of size 49 from the population of the number of hours worked per week by business students at CSU and compute the sample means and 95% confidence intervals, the population mean of the number of hours worked by the students per week would be found in about 95 out of the 100 confidence intervals. Either a confidence interval contains the population mean or it does not. In this example, about 5out of the 100confidence intervals would not contain the population mean. 39
40 More Examples Confidence Interval Estimate for Mean (σunknown, and n<30)
41 Thinking Challenge Example You re a time study analyst in manufacturing. You ve recorded the following task times (min.): 3.6, 4.2, 4.0, 3.5, 3.8, 3.1. What is the 90% confidence interval estimate of the population mean task time? 41
42 X X = 3.7 S= = Solution n= = 6, df = n-1 1 = 6-1 = 5 S/ n = / 6 6 = t.05,5 = (2.015)(0.1592) µ (2.015)(0.1592) µ We are 90% confident that the interval estimate of the population mean task time is between 3.4and 4.0 minutes. 42
43 Confidence Interval Excel Application Given the price of ten (10) houses in one of the subdivisions located in Henry County, use Excel to construct a 95%confidence interval for the population mean. Data: $230,000, $240,000, $310,000, $198,000, $257,000, $345,000, $315,000, $260,000, $198,000, $270,


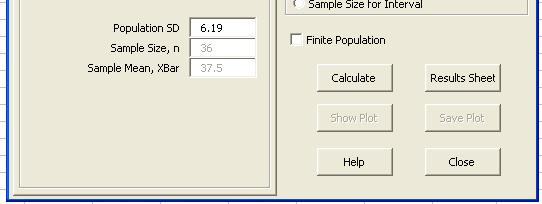
44 Excel Solution--SWStat Data Area 44


45 Excel Solution SWStat SWStat (Continued) (SWStat Statistics Intervals & Tests) 45
 $227,099 µ $297,502")
46 Excel Solution SWStat SWStat (Continued) $227,099 µ $297,502 46
47 Confidence Interval Excel Application (Another Problem) A random sample of 36 magazine subscribers is taken to estimate the mean age of all subscribers. Use Excelto construct a 90% confidence interval estimate of the mean age of all of this magazine s subscribers. See next slide for the data. 47
48 The Data Subscriber Age Subscriber Age Subscriber Age

49 Excel Solution--SWStat 49
")
50 Excel Solution (Continued) SWStat 50
51 Sample Size for an Interval Estimate of a Population Mean Let E= = the desired margin of error. We said Eis the amount added to and subtracted from the point estimate to obtain an interval estimate. x s ± t α/2 E = Margin of Error n Interval Estimate of the mean 51
52 Sample Size for an Interval Estimate of a Population Mean (Continued) Margin of Error E Necessary Sample Size σ = z α /2 n Margin of Error n z = ( α/ 2 ) E σ 52

53 Sample Size for an Interval Estimate of a Population Mean--Example Recall that Discount Sounds is evaluating a potential location for a new retail outlet, based in part, on the mean annual income of the individuals in the marketing area of the new location. Suppose that Discount Sounds management team wants an estimate of the population mean such that there is a 0.95probability that the sampling error is $500 or less. How large a sample size is needed to meet the required precision? D 53
54 Sample Size for an Interval Estimate of a Population Mean--Solution D E = z α σ /2 = 500 n Given At 95% confidence, z.025 = Recall that σ = 4,500. n z = ( α/ 2 ) E = σ 2 2 (1.96) (4, 500) n = = = (500) A sample of size 312is needed to reach a desired precision of + $500 at 95% confidence. 54
55 Sample Size for an Interval Estimate of a Population Mean (Continued) There are 3 factors that determine the size of a sample, none of which has any direct relationship to the size of the population. They are: 1- The degree of confidence selected. 2- The maximum allowable error-- --margin of error. 3- The variation of the population. n z = ( α/ 2 ) E σ 55

56 Thinking Challenge Sample Size Example 1 A consumer group would like to estimate the meanmonthly monthly electric bill for a single family house in July. Based on similar studies the standard deviation is estimated to be $ A 99%level of confidence is desired, with an accuracy of ± $5.00. How large a sample is required? n=[(2.58)(20)/5] 2 = n z = ( α/ 2 ) E σ 56
57 Thinking Challenge Sample Size Example 1 (Continued) What sample size is needed to be 90%confident of being correct within ±5?? A pilot study suggested that the standard deviation is
58 Thinking Challenge Sample Size Example 1 (Continued) What sample size is needed to be 90%confident of being correct within ±5?? A pilot study suggested that the standard deviation is 45. Note that in this example boththe the degree of confidence and population standard deviation are changed hence, the sample size is changed too. 58
59 Thinking Challenge Sample Size Example 2 You work in Human Resources at Merrill Lynch. You plan to survey employees to find their average medical expenses. You want to be 95%confident that the sample mean is within ±$50. A pilot study showed that sample standard deviation was about $400. What sample sizedo you use? 59
60 Thinking Challenge Sample Size Example 2 (Solution) 60
61 Interval Estimation of a Population Proportion OPTIONAL READINGS 61
62 End of Chapter 9 62
CHAPTER 8. Confidence Interval Estimation Point and Interval Estimates
 CHAPTER 8. Confidence Interval Estimation Point and Interval Estimates A point estimate is a single number, a confidence interval provides additional information about the variability of the estimate Lower
LESSON 7 INTERVAL ESTIMATION SAMIE L.S. LY
 LESSON 7 INTERVAL ESTIMATION SAMIE L.S. LY 1 THIS WEEK S PLAN Part I: Theory + Practice ( Interval Estimation ) Part II: Theory + Practice ( Interval Estimation ) z-based Confidence Intervals for a Population
Determining Sample Size. Slide 1 ˆ ˆ. p q n E = z α / 2. (solve for n by algebra) n = E 2
 n = E 2") Determining Sample Size Slide 1 E = z α / 2 ˆ ˆ p q n (solve for n by algebra) n = ( zα α / 2) 2 p ˆ qˆ E 2 Sample Size for Estimating Proportion p When an estimate of ˆp is known: Slide 2 n = ˆ ˆ ( )
Determining Sample Size Slide 1 E = z α / 2 ˆ ˆ p q n (solve for n by algebra) n = ( zα α / 2) 2 p ˆ qˆ E 2 Sample Size for Estimating Proportion p When an estimate of ˆp is known: Slide 2 n = ˆ ˆ ( )
Estimation and Confidence Intervals
 Estimation and Confidence Intervals Chapter 9-1/2 McGraw-Hill/Irwin Copyright 2011 by the McGraw-Hill Companies, Inc. All rights reserved. LEARNING OBJECTIVES LO1. Define a point estimate. LO2. Define
Statistics for Business and Economics
 Statistics for Business and Economics Chapter 7 Estimation: Single Population Copyright 010 Pearson Education, Inc. Publishing as Prentice Hall Ch. 7-1 Confidence Intervals Contents of this chapter: Confidence
SLIDES. BY. John Loucks. St. Edward s University
 . SLIDES. BY John Loucks St. Edward s University 1 Chapter 10, Part A Inference About Means and Proportions with Two Populations n Inferences About the Difference Between Two Population Means: σ 1 and
8.1 Estimation of the Mean and Proportion
 8.1 Estimation of the Mean and Proportion Statistical inference enables us to make judgments about a population on the basis of sample information. The mean, standard deviation, and proportions of a population
Chapter 8 Statistical Intervals for a Single Sample
 Chapter 8 Statistical Intervals for a Single Sample Part 1: Confidence intervals (CI) for population mean µ Section 8-1: CI for µ when σ 2 known & drawing from normal distribution Section 8-1.2: Sample
Chapter 14 : Statistical Inference 1. Note : Here the 4-th and 5-th editions of the text have different chapters, but the material is the same.
 Chapter 14 : Statistical Inference 1 Chapter 14 : Introduction to Statistical Inference Note : Here the 4-th and 5-th editions of the text have different chapters, but the material is the same. Data x
Confidence Intervals and Sample Size
 Confidence Intervals and Sample Size Chapter 6 shows us how we can use the Central Limit Theorem (CLT) to 1. estimate a population parameter (such as the mean or proportion) using a sample, and. determine
Statistics 13 Elementary Statistics
 Statistics 13 Elementary Statistics Summer Session I 2012 Lecture Notes 5: Estimation with Confidence intervals 1 Our goal is to estimate the value of an unknown population parameter, such as a population
Estimation and Confidence Intervals
 Estimation and Confidence Intervals Chapter 9 McGraw-Hill/Irwin Copyright 2010 by The McGraw-Hill Companies, Inc. All rights reserved. GOALS 1. Define a point estimate. 2. Define level of confidence. 3.
χ 2 distributions and confidence intervals for population variance
 χ 2 distributions and confidence intervals for population variance Let Z be a standard Normal random variable, i.e., Z N(0, 1). Define Y = Z 2. Y is a non-negative random variable. Its distribution is
Confidence Intervals Introduction
 Confidence Intervals Introduction A point estimate provides no information about the precision and reliability of estimation. For example, the sample mean X is a point estimate of the population mean μ
Interval estimation. September 29, Outline Basic ideas Sampling variation and CLT Interval estimation using X More general problems
 Interval estimation September 29, 2017 STAT 151 Class 7 Slide 1 Outline of Topics 1 Basic ideas 2 Sampling variation and CLT 3 Interval estimation using X 4 More general problems STAT 151 Class 7 Slide
Data Analysis and Statistical Methods Statistics 651
 Data Analysis and Statistical Methods Statistics 651 http://www.stat.tamu.edu/~suhasini/teaching.html Lecture 14 (MWF) The t-distribution Suhasini Subba Rao Review of previous lecture Often the precision
If the distribution of a random variable x is approximately normal, then
 Confidence Intervals for the Mean (σ unknown) In many real life situations, the standard deviation is unknown. In order to construct a confidence interval for a random variable that is normally distributed
Version A. Problem 1. Let X be the continuous random variable defined by the following pdf: 1 x/2 when 0 x 2, f(x) = 0 otherwise.
 = 0 otherwise.") Math 224 Q Exam 3A Fall 217 Tues Dec 12 Version A Problem 1. Let X be the continuous random variable defined by the following pdf: { 1 x/2 when x 2, f(x) otherwise. (a) Compute the mean µ E[X]. E[X] x
Math 224 Q Exam 3A Fall 217 Tues Dec 12 Version A Problem 1. Let X be the continuous random variable defined by the following pdf: { 1 x/2 when x 2, f(x) otherwise. (a) Compute the mean µ E[X]. E[X] x
ECON 214 Elements of Statistics for Economists 2016/2017
 ECON 214 Elements of Statistics for Economists 2016/2017 Topic The Normal Distribution Lecturer: Dr. Bernardin Senadza, Dept. of Economics bsenadza@ug.edu.gh College of Education School of Continuing and
μ: ESTIMATES, CONFIDENCE INTERVALS, AND TESTS Business Statistics
 μ: ESTIMATES, CONFIDENCE INTERVALS, AND TESTS Business Statistics CONTENTS Estimating parameters The sampling distribution Confidence intervals for μ Hypothesis tests for μ The t-distribution Comparison
Chapter Seven: Confidence Intervals and Sample Size
 Chapter Seven: Confidence Intervals and Sample Size A point estimate is: The best point estimate of the population mean µ is the sample mean X. Three Properties of a Good Estimator 1. Unbiased 2. Consistent
5.3 Interval Estimation
 5.3 Interval Estimation Ulrich Hoensch Wednesday, March 13, 2013 Confidence Intervals Definition Let θ be an (unknown) population parameter. A confidence interval with confidence level C is an interval
Chapter 4: Estimation
 Slide 4.1 Chapter 4: Estimation Estimation is the process of using sample data to draw inferences about the population Sample information x, s Inferences Population parameters µ,σ Slide 4. Point and interval
. 13. The maximum error (margin of error) of the estimate for μ (based on known σ) is:
 of the estimate for μ (based on known σ) is:") Statistics Sample Exam 3 Solution Chapters 6 & 7: Normal Probability Distributions & Estimates 1. What percent of normally distributed data value lie within 2 standard deviations to either side of the
Statistics Sample Exam 3 Solution Chapters 6 & 7: Normal Probability Distributions & Estimates 1. What percent of normally distributed data value lie within 2 standard deviations to either side of the
Statistical Intervals (One sample) (Chs )
 (Chs )") 7 Statistical Intervals (One sample) (Chs 8.1-8.3) Confidence Intervals The CLT tells us that as the sample size n increases, the sample mean X is close to normally distributed with expected value µ and
7 Statistical Intervals (One sample) (Chs 8.1-8.3) Confidence Intervals The CLT tells us that as the sample size n increases, the sample mean X is close to normally distributed with expected value µ and
Distribution. Lecture 34 Section Fri, Oct 31, Hampden-Sydney College. Student s t Distribution. Robb T. Koether.
 Lecture 34 Section 10.2 Hampden-Sydney College Fri, Oct 31, 2008 Outline 1 2 3 4 5 6 7 8 Exercise 10.4, page 633. A psychologist is studying the distribution of IQ scores of girls at an alternative high
1 Inferential Statistic
 1 Inferential Statistic Population versus Sample, parameter versus statistic A population is the set of all individuals the researcher intends to learn about. A sample is a subset of the population and
STAT Chapter 7: Confidence Intervals
 STAT 515 -- Chapter 7: Confidence Intervals With a point estimate, we used a single number to estimate a parameter. We can also use a set of numbers to serve as reasonable estimates for the parameter.
Data Analysis and Statistical Methods Statistics 651
 Data Analysis and Statistical Methods Statistics 651 http://www.stat.tamu.edu/~suhasini/teaching.html Lecture 14 (MWF) The t-distribution Suhasini Subba Rao Review of previous lecture Often the precision
Chapter 7. Confidence Intervals and Sample Sizes. Definition. Definition. Definition. Definition. Confidence Interval : CI. Point Estimate.
 Chapter 7 Confidence Intervals and Sample Sizes 7. Estimating a Proportion p 7.3 Estimating a Mean µ (σ known) 7.4 Estimating a Mean µ (σ unknown) 7.5 Estimating a Standard Deviation σ In a recent poll,
Lecture 2 INTERVAL ESTIMATION II
 Lecture 2 INTERVAL ESTIMATION II Recap Population of interest - want to say something about the population mean µ perhaps Take a random sample... Recap When our random sample follows a normal distribution,
Section 7-2 Estimating a Population Proportion
 Section 7- Estimating a Population Proportion 1 Key Concept In this section we present methods for using a sample proportion to estimate the value of a population proportion. The sample proportion is the
ECON 214 Elements of Statistics for Economists
 ECON 214 Elements of Statistics for Economists Session 7 The Normal Distribution Part 1 Lecturer: Dr. Bernardin Senadza, Dept. of Economics Contact Information: bsenadza@ug.edu.gh College of Education
8.3 CI for μ, σ NOT known (old 8.4)
") GOALS: 1. Learn the properties of the student t distribution and the t curve. 2. Understand how degrees of freedom, df, relate to t curves. 3. Recognize that t curves approach the SNC as df increases.
GOALS: 1. Learn the properties of the student t distribution and the t curve. 2. Understand how degrees of freedom, df, relate to t curves. 3. Recognize that t curves approach the SNC as df increases.
Two Populations Hypothesis Testing
 Two Populations Hypothesis Testing Two Proportions (Large Independent Samples) Two samples are said to be independent if the data from the first sample is not connected to the data from the second sample.
Week 2 Quantitative Analysis of Financial Markets Hypothesis Testing and Confidence Intervals
 Week 2 Quantitative Analysis of Financial Markets Hypothesis Testing and Confidence Intervals Christopher Ting http://www.mysmu.edu/faculty/christophert/ Christopher Ting : christopherting@smu.edu.sg :
Hypothesis Tests: One Sample Mean Cal State Northridge Ψ320 Andrew Ainsworth PhD
 Hypothesis Tests: One Sample Mean Cal State Northridge Ψ320 Andrew Ainsworth PhD MAJOR POINTS Sampling distribution of the mean revisited Testing hypotheses: sigma known An example Testing hypotheses:
Chapter 5. Sampling Distributions
 Lecture notes, Lang Wu, UBC 1 Chapter 5. Sampling Distributions 5.1. Introduction In statistical inference, we attempt to estimate an unknown population characteristic, such as the population mean, µ,
Confidence Intervals for the Difference Between Two Means with Tolerance Probability
 Chapter 47 Confidence Intervals for the Difference Between Two Means with Tolerance Probability Introduction This procedure calculates the sample size necessary to achieve a specified distance from the
Chapter 7 presents the beginning of inferential statistics. The two major activities of inferential statistics are
 Chapter 7 presents the beginning of inferential statistics. Concept: Inferential Statistics The two major activities of inferential statistics are 1 to use sample data to estimate values of population
6.1, 7.1 Estimating with confidence (CIS: Chapter 10)
") Objectives 6.1, 7.1 Estimating with confidence (CIS: Chapter 10) Statistical confidence (CIS gives a good explanation of a 95% CI) Confidence intervals Choosing the sample size t distributions One-sample
Objectives 6.1, 7.1 Estimating with confidence (CIS: Chapter 10) Statistical confidence (CIS gives a good explanation of a 95% CI) Confidence intervals Choosing the sample size t distributions One-sample
Previously, when making inferences about the population mean, μ, we were assuming the following simple conditions:
 Chapter 17 Inference about a Population Mean Conditions for inference Previously, when making inferences about the population mean, μ, we were assuming the following simple conditions: (1) Our data (observations)
Statistical Intervals. Chapter 7 Stat 4570/5570 Material from Devore s book (Ed 8), and Cengage
, and Cengage") 7 Statistical Intervals Chapter 7 Stat 4570/5570 Material from Devore s book (Ed 8), and Cengage Confidence Intervals The CLT tells us that as the sample size n increases, the sample mean X is close to
7 Statistical Intervals Chapter 7 Stat 4570/5570 Material from Devore s book (Ed 8), and Cengage Confidence Intervals The CLT tells us that as the sample size n increases, the sample mean X is close to
Confidence Intervals. σ unknown, small samples The t-statistic /22
 Confidence Intervals σ unknown, small samples The t-statistic 1 /22 Homework Read Sec 7-3. Discussion Question pg 365 Do Ex 7-3 1-4, 6, 9, 12, 14, 15, 17 2/22 Objective find the confidence interval for
σ 2 : ESTIMATES, CONFIDENCE INTERVALS, AND TESTS Business Statistics
 σ : ESTIMATES, CONFIDENCE INTERVALS, AND TESTS Business Statistics CONTENTS Estimating other parameters besides μ Estimating variance Confidence intervals for σ Hypothesis tests for σ Estimating standard
Estimation Y 3. Confidence intervals I, Feb 11,
 Estimation Example: Cholesterol levels of heart-attack patients Data: Observational study at a Pennsylvania medical center blood cholesterol levels patients treated for heart attacks measurements 2, 4,
Statistics for Managers Using Microsoft Excel 7 th Edition
 Statistics for Managers Using Microsoft Excel 7 th Edition Chapter 7 Sampling Distributions Statistics for Managers Using Microsoft Excel 7e Copyright 2014 Pearson Education, Inc. Chap 7-1 Learning Objectives
Section 8.1 Estimating μ When σ is Known
 Chapter 8 Estimation Name Section 8.1 Estimating μ When σ is Known Objective: In this lesson you learned to explain the meanings of confidence level, error of estimate, and critical value; to find the
Chapter 6.1 Confidence Intervals. Stat 226 Introduction to Business Statistics I. Chapter 6, Section 6.1
 Stat 226 Introduction to Business Statistics I Spring 2009 Professor: Dr. Petrutza Caragea Section A Tuesdays and Thursdays 9:30-10:50 a.m. Chapter 6, Section 6.1 Confidence Intervals Confidence Intervals
Probability & Statistics
 Probability & Statistics BITS Pilani K K Birla Goa Campus Dr. Jajati Keshari Sahoo Department of Mathematics Statistics Descriptive statistics Inferential statistics /38 Inferential Statistics 1. Involves:
The Normal Distribution. (Ch 4.3)
") 5 The Normal Distribution (Ch 4.3) The Normal Distribution The normal distribution is probably the most important distribution in all of probability and statistics. Many populations have distributions
5 The Normal Distribution (Ch 4.3) The Normal Distribution The normal distribution is probably the most important distribution in all of probability and statistics. Many populations have distributions
Chapter 8 Estimation
 Chapter 8 Estimation There are two important forms of statistical inference: estimation (Confidence Intervals) Hypothesis Testing Statistical Inference drawing conclusions about populations based on samples
CIVL Confidence Intervals
 CIVL 3103 Confidence Intervals Learning Objectives - Confidence Intervals Define confidence intervals, and explain their significance to point estimates. Identify and apply the appropriate confidence interval
Lecture 35 Section Wed, Mar 26, 2008
 on Lecture 35 Section 10.2 Hampden-Sydney College Wed, Mar 26, 2008 Outline on 1 2 3 4 5 on 6 7 on We will familiarize ourselves with the t distribution. Then we will see how to use it to test a hypothesis
Chapter 7. Sampling Distributions
 Chapter 7 Sampling Distributions Section 7.1 Sampling Distributions and the Central Limit Theorem Sampling Distributions Sampling distribution The probability distribution of a sample statistic. Formed
Lecture Slides. Elementary Statistics Twelfth Edition. by Mario F. Triola. and the Triola Statistics Series. Section 7.4-1
 Lecture Slides Elementary Statistics Twelfth Edition and the Triola Statistics Series by Mario F. Triola Section 7.4-1 Chapter 7 Estimates and Sample Sizes 7-1 Review and Preview 7- Estimating a Population
Statistics Class 15 3/21/2012
 Statistics Class 15 3/21/2012 Quiz 1. Cans of regular Pepsi are labeled to indicate that they contain 12 oz. Data Set 17 in Appendix B lists measured amounts for a sample of Pepsi cans. The same statistics
MATH 10 INTRODUCTORY STATISTICS
 MATH 10 INTRODUCTORY STATISTICS Tommy Khoo Your friendly neighbourhood graduate student. Midterm Exam ٩(^ᴗ^)۶ In class, next week, Thursday, 26 April. 1 hour, 45 minutes. 5 questions of varying lengths.
The "bell-shaped" curve, or normal curve, is a probability distribution that describes many real-life situations.
 6.1 6.2 The Standard Normal Curve The "bell-shaped" curve, or normal curve, is a probability distribution that describes many real-life situations. Basic Properties 1. The total area under the curve is.
Data Analysis and Statistical Methods Statistics 651
 Data Analysis and Statistical Methods Statistics 651 http://www.stat.tamu.edu/~suhasini/teaching.html Lecture 13 (MWF) Designing the experiment: Margin of Error Suhasini Subba Rao Terminology: The population
Elementary Statistics Triola, Elementary Statistics 11/e Unit 14 The Confidence Interval for Means, σ Unknown
 Elementary Statistics We are now ready to begin our exploration of how we make estimates of the population mean. Before we get started, I want to emphasize the importance of having collected a representative
MgtOp S 215 Chapter 8 Dr. Ahn
 MgtOp S 215 Chapter 8 Dr. Ahn An estimator of a population parameter is a rule that tells us how to use the sample values,,, to estimate the parameter, and is a statistic. An estimate is the value obtained
19. CONFIDENCE INTERVALS FOR THE MEAN; KNOWN VARIANCE
 19. CONFIDENCE INTERVALS FOR THE MEAN; KNOWN VARIANCE We assume here that the population variance σ 2 is known. This is an unrealistic assumption, but it allows us to give a simplified presentation which
MA131 Lecture 9.1. = µ = 25 and σ X P ( 90 < X < 100 ) = = /// σ X
 = = /// σ X") The Central Limit Theorem (CLT): As the sample size n increases, the shape of the distribution of the sample means taken with replacement from the population with mean µ and standard deviation σ will approach
The Central Limit Theorem (CLT): As the sample size n increases, the shape of the distribution of the sample means taken with replacement from the population with mean µ and standard deviation σ will approach
The Central Limit Theorem. Sec. 8.2: The Random Variable. it s Distribution. it s Distribution
 The Central Limit Theorem Sec. 8.1: The Random Variable it s Distribution Sec. 8.2: The Random Variable it s Distribution X p and and How Should You Think of a Random Variable? Imagine a bag with numbers
ASTM D02, Dec./ Orlando Statistics Seminar
 ASTM D02, Dec./ Orlando Statistics Seminar Presented by: Alex Lau, Chairman, D02.94 This brief seminar will provide : a very simple explanation on the use of statistics to estimate population parameters
Data Analysis and Statistical Methods Statistics 651
 Review of previous lecture: Why confidence intervals? Data Analysis and Statistical Methods Statistics 651 http://www.stat.tamu.edu/~suhasini/teaching.html Suhasini Subba Rao Suppose you want to know the
Section 7.2. Estimating a Population Proportion
 Section 7.2 Estimating a Population Proportion Overview Section 7.2 Estimating a Population Proportion Section 7.3 Estimating a Population Mean Section 7.4 Estimating a Population Standard Deviation or
Elementary Statistics
 Chapter 7 Estimation Goal: To become familiar with how to use Excel 2010 for Estimation of Means. There is one Stat Tool in Excel that is used with estimation of means, T.INV.2T. Open Excel and click on
Tuesday, Week 10. Announcements:
 Tuesday, Week 10 Announcements: Thursday, October 25, 2 nd midterm in class, covering Chapters 6-8 (Confidence intervals). Charissa Mikoski, the TA for our class, will be administering the exam (I will
1/12/2011. Chapter 5: z-scores: Location of Scores and Standardized Distributions. Introduction to z-scores. Introduction to z-scores cont.
 Chapter 5: z-scores: Location of Scores and Standardized Distributions Introduction to z-scores In the previous two chapters, we introduced the concepts of the mean and the standard deviation as methods
Chapter 6 Confidence Intervals Section 6-1 Confidence Intervals for the Mean (Large Samples) Estimating Population Parameters
 Estimating Population Parameters") Chapter 6 Confidence Intervals Section 6-1 Confidence Intervals for the Mean (Large Samples) Estimating Population Parameters VOCABULARY: Point Estimate a value for a parameter. The most point estimate
Chapter 6 Confidence Intervals Section 6-1 Confidence Intervals for the Mean (Large Samples) Estimating Population Parameters VOCABULARY: Point Estimate a value for a parameter. The most point estimate
Key Objectives. Module 2: The Logic of Statistical Inference. Z-scores. SGSB Workshop: Using Statistical Data to Make Decisions
 SGSB Workshop: Using Statistical Data to Make Decisions Module 2: The Logic of Statistical Inference Dr. Tom Ilvento January 2006 Dr. Mugdim Pašić Key Objectives Understand the logic of statistical inference
Contents. 1 Introduction. Math 321 Chapter 5 Confidence Intervals. 1 Introduction 1
 Math 321 Chapter 5 Confidence Intervals (draft version 2019/04/11-11:17:37) Contents 1 Introduction 1 2 Confidence interval for mean µ 2 2.1 Known variance................................. 2 2.2 Unknown
Lecture 39 Section 11.5
 on Lecture 39 Section 11.5 Hampden-Sydney College Mon, Nov 10, 2008 Outline 1 on 2 3 on 4 on Exercise 11.27, page 715. A researcher was interested in comparing body weights for two strains of laboratory
Statistical Tables Compiled by Alan J. Terry
 Statistical Tables Compiled by Alan J. Terry School of Science and Sport University of the West of Scotland Paisley, Scotland Contents Table 1: Cumulative binomial probabilities Page 1 Table 2: Cumulative
6.5: THE NORMAL APPROXIMATION TO THE BINOMIAL AND
 CD6-12 6.5: THE NORMAL APPROIMATION TO THE BINOMIAL AND POISSON DISTRIBUTIONS In the earlier sections of this chapter the normal probability distribution was discussed. In this section another useful aspect
MULTIPLE CHOICE. Choose the one alternative that best completes the statement or answers the question.
 Ch. 9 Estimating the Value of a Parameter 9.1 Estimating a Population Proportion 1 Obtain a point estimate for the population proportion. 1) When 390 junior college students were surveyed,115 said that
Chapter 3 Descriptive Statistics: Numerical Measures Part A
 Slides Prepared by JOHN S. LOUCKS St. Edward s University Slide 1 Chapter 3 Descriptive Statistics: Numerical Measures Part A Measures of Location Measures of Variability Slide Measures of Location Mean
Using the Central Limit Theorem It is important for you to understand when to use the CLT. If you are being asked to find the probability of the
 Using the Central Limit Theorem It is important for you to understand when to use the CLT. If you are being asked to find the probability of the mean, use the CLT for the mean. If you are being asked to
Discrete Probability Distribution
 1 Discrete Probability Distribution Key Definitions Discrete Random Variable: Has a countable number of values. This means that each data point is distinct and separate. Continuous Random Variable: Has
Stat511 Additional Materials
 Binomial Random Variable Stat511 Additional Materials The first discrete RV that we will discuss is the binomial random variable. The binomial random variable is a result of observing the outcomes from
1. Covariance between two variables X and Y is denoted by Cov(X, Y) and defined by. Cov(X, Y ) = E(X E(X))(Y E(Y ))
 and defined by. Cov(X, Y ) = E(X E(X))(Y E(Y ))") Correlation & Estimation - Class 7 January 28, 2014 Debdeep Pati Association between two variables 1. Covariance between two variables X and Y is denoted by Cov(X, Y) and defined by Cov(X, Y ) = E(X E(X))(Y
Correlation & Estimation - Class 7 January 28, 2014 Debdeep Pati Association between two variables 1. Covariance between two variables X and Y is denoted by Cov(X, Y) and defined by Cov(X, Y ) = E(X E(X))(Y
Statistics 6 th Edition
 Statistics 6 th Edition Chapter 5 Discrete Probability Distributions Chap 5-1 Definitions Random Variables Random Variables Discrete Random Variable Continuous Random Variable Ch. 5 Ch. 6 Chap 5-2 Discrete
Chapter 4 Continuous Random Variables and Probability Distributions
 Chapter 4 Continuous Random Variables and Probability Distributions Part 2: More on Continuous Random Variables Section 4.5 Continuous Uniform Distribution Section 4.6 Normal Distribution 1 / 27 Continuous
MULTIPLE CHOICE. Choose the one alternative that best completes the statement or answers the question. Solve the problem.
 MULTIPLE CHOICE. Choose the one alternative that best completes the statement or Solve the problem. 1. Find forα=0.01. A. 1.96 B. 2.575 C. 1.645 D. 2.33 2.Whatistheconfidencelevelofthefolowingconfidenceintervalforμ?
σ e, which will be large when prediction errors are Linear regression model
 Linear regression model we assume that two quantitative variables, x and y, are linearly related; that is, the population of (x, y) pairs are related by an ideal population regression line y = α + βx +
Learning Objectives for Ch. 7
 Chapter 7: Point and Interval Estimation Hildebrand, Ott and Gray Basic Statistical Ideas for Managers Second Edition 1 Learning Objectives for Ch. 7 Obtaining a point estimate of a population parameter
Tests for One Variance
 Chapter 65 Introduction Occasionally, researchers are interested in the estimation of the variance (or standard deviation) rather than the mean. This module calculates the sample size and performs power
The Two-Sample Independent Sample t Test
 Department of Psychology and Human Development Vanderbilt University 1 Introduction 2 3 The General Formula The Equal-n Formula 4 5 6 Independence Normality Homogeneity of Variances 7 Non-Normality Unequal
Confidence Intervals 8.6
 8.6 Confidence Intervals Governments often commission polls to gauge support for new initiatives. The polling organization surveys a small number of people and estimates support in the entire population
Unit 5: Sampling Distributions of Statistics
 Unit 5: Sampling Distributions of Statistics Statistics 571: Statistical Methods Ramón V. León 6/12/2004 Unit 5 - Stat 571 - Ramon V. Leon 1 Definitions and Key Concepts A sample statistic used to estimate
Estimating parameters 5.3 Confidence Intervals 5.4 Sample Variance
 Estimating parameters 5.3 Confidence Intervals 5.4 Sample Variance Prof. Tesler Math 186 Winter 2017 Prof. Tesler Ch. 5: Confidence Intervals, Sample Variance Math 186 / Winter 2017 1 / 29 Estimating parameters
Unit 5: Sampling Distributions of Statistics
 Unit 5: Sampling Distributions of Statistics Statistics 571: Statistical Methods Ramón V. León 6/12/2004 Unit 5 - Stat 571 - Ramon V. Leon 1 Definitions and Key Concepts A sample statistic used to estimate
GETTING STARTED. To OPEN MINITAB: Click Start>Programs>Minitab14>Minitab14 or Click Minitab 14 on your Desktop
 Minitab 14 1 GETTING STARTED To OPEN MINITAB: Click Start>Programs>Minitab14>Minitab14 or Click Minitab 14 on your Desktop The Minitab session will come up like this 2 To SAVE FILE 1. Click File>Save Project
2011 Pearson Education, Inc
 Statistics for Business and Economics Chapter 4 Random Variables & Probability Distributions Content 1. Two Types of Random Variables 2. Probability Distributions for Discrete Random Variables 3. The Binomial
Sampling and sampling distribution
 Sampling and sampling distribution September 12, 2017 STAT 101 Class 5 Slide 1 Outline of Topics 1 Sampling 2 Sampling distribution of a mean 3 Sampling distribution of a proportion STAT 101 Class 5 Slide
A continuous random variable is one that can theoretically take on any value on some line interval. We use f ( x)
") Section 6-2 I. Continuous Probability Distributions A continuous random variable is one that can theoretically take on any value on some line interval. We use f ( x) to represent a probability density
Section 6-2 I. Continuous Probability Distributions A continuous random variable is one that can theoretically take on any value on some line interval. We use f ( x) to represent a probability density
Lecture 16: Estimating Parameters (Confidence Interval Estimates of the Mean)
") Statistics 16_est_parameters.pdf Michael Hallstone, Ph.D. hallston@hawaii.edu Lecture 16: Estimating Parameters (Confidence Interval Estimates of the Mean) Some Common Sense Assumptions for Interval Estimates
Statistics 16_est_parameters.pdf Michael Hallstone, Ph.D. hallston@hawaii.edu Lecture 16: Estimating Parameters (Confidence Interval Estimates of the Mean) Some Common Sense Assumptions for Interval Estimates
Sampling Distribution
 MAT 2379 (Spring 2012) Sampling Distribution Definition : Let X 1,..., X n be a collection of random variables. We say that they are identically distributed if they have a common distribution. Definition