Reading the Tea Leaves: Model Uncertainty, Robust Foreca. Forecasts, and the Autocorrelation of Analysts Forecast Errors
|
|
|
- Isaac Young
- 6 years ago
- Views:
Transcription
1 Reading the Tea Leaves: Model Uncertainty, Robust Forecasts, and the Autocorrelation of Analysts Forecast Errors December 1, 2016
2 Table of Contents Introduction Autocorrelation Puzzle Hansen-Sargent Autocorrelation Decomposition
3 Autocorrelation Puzzle For a one-period forecast, if analysts know the process and seek to minimize mean squared-error, forcast errors will have mean zero and be serially uncorrelated. Empirical evidence that forecaster errors tend to be positive and auto-correlated. This would imply that analysts do not learn from past mistakes. Why?
4 Motivating Example Parameter uncertainty: x t = (a + u t )x t 1 + ε t where u t N(0,σ 2 ) The error dissipates as analysts learn. Model (Knightian) uncertainty: Analyst does not know the underlying model. They have an approximating model.
5 In a robust forecast, analysts overestimate Authors find that variation in mean forecast errors contributes to one-fifth of the measured autocorrelation Estimation errors of earnings growth shocks contributes another one-fifth of the measured autocorrelation Finally, model uncertainty contributes to 60% of the measured autocorrelation.
6 Why is this Important? Contributes to the literature on analyst behavior and asset pricing anomalies. Important regarding the question of efficient distribution of information and welfare.
7 Relation to other literature Other literature Uppal and Wang (2003), Maenhout (2004), and Epstein and Schneider (2008) suggest that model uncertainty is of first-order importance for portfolio choice and asset pricing. Hilary and Hsu (2013) find analyst consistency rather than accuracy determines their ranking.
8 Earning and Signals Processes Earnings Process y t+1 = µ + x t+1 + a t+1 where y t+1 is the reported earnings, x t+1 is the persistent (permanent) component of the earnings process and a t+1 is noise. Signal Process (Private Signal) s t = e t+1 + n t where e t+1 is the permanent earnings shock and n t N(0,σ 2 n ). All shocks have zero cross-correlations, autocorrelations and cross-autocorrelations.
9 Earning and Signals Processes The analyst s objective in period t is estimate y t+1 given the history of earnings and signals E[y t+1 s t,s t 1,...,s 1,y t,y t 1,...,y 1 ] = E[y t+1 F t ] This is the linear part of the model
10 The Uncertainty Environment a w t = κ 0 + κ 1 a t where a w is the worse case realization and a is the analyst s approximating model Analysts do not know the distribution but we assume they approximate this noise as a t i.i.d.n(0, ˆσ 2 a ). The author s assume the approximated variance, ˆσ 2 a, is equal to the real variance σ 2 a in order to ensure the approximating model is good. The actual realization is at w N(κ 0,κ1 2σ a 2 ), where κ 0 is a real number and κ 1 is a non-negative number. The realization is a function of a random draw from this distribution.
11 The Problem subject to min max E[{y t w ŷ t t 1 F t 1 ] ŷ t t 1 (κ 0, κ 1 ) E[{(at w at ) + (ˆx }{{} t t 1 w ˆx t t 1) } 2 F t 1 ] η 2 σa 2 }{{} Deviation Perceived Bias where y w is the worst ex ante outcome; ŷ t t 1 is the analyst s optimal forecast given information hitherto; ˆx t t 1 w is the optimal forecast of x t (using a Kalman filter) under the worst case; and ˆx t t 1 is the optimal forecast forecast of x t given the analyst s expectations of the evil agent s choice of κ 0 and κ 1. Finally, at w the worse case realization of a t, whereas a is the approximating estimate. is
12 Direct and Indirect Effects (a w t a ) is the direct effect. This expresses the amount of distortion induced by the evil agent. (ˆx w t t 1 ˆx t t 1) is the indirect effect from the analysts relying on inaccurate historical information in their future estimations. η measures the agent s concern for model misspecification and σ 2 a the variance of the noise induced by the evil agent. Thus, ησ 2 a is the degree of robustness in the model. As η, the entropy becomes so great that it becomes impossible for the analyst to distinguish models. When η = 0, we have a standard Rational Expectations model.
13 Minimax Optimization The analyst solves a static optimization problem: the forecasts are independent from her last forecasts and the same solution applies at every date t. The analyst knows the parameters of the true earnings process completely determine her current estimate (ŷ t t 1 ). In other words, after choosing (ˆκ 0, ˆκ 1 ), their estimate of the evil agent s noise process, the analyst obtains an optimal forecast using a Kalman filter.
14 Intuition behind Lemma 2.1 The forecast is a function of the previous forecast ŷ t, the forecast error (y t ŷ t ) and the additional signal s t. The Kalman gain K captures how much the analyst uses previous forecast errors to revise estimates of x t The weight w measures how much the analyst uses the extra-signal s t to estimate e t+1, the permanent growth shock.
15 Intuition behind Prop. 2 If ˆθ = θ- that is the analyst predicts the true values of the model - autocorrelation of forecast errors goes to zero. With robust forecasting, analyst knows everything but the distribution of the noise a t. The first term goes to zero but the second two terms are strictly positive.
16 Intuition behind Analysts concerned about model misspecification will issue forecasts that perform well under the worst cast (highest variance). The analyst will overestimate the amount of noise in reported earnings (y t ) in order to achieve better accuracy than expected. Why? The noisier the reported earnings, the less accurate the analyst s forecast will be. The analyst s inference of x t will be farther away, on average, from the actual state. The analyst underreacts to historical earnings. As a result, we find positive autocorrelation in forecast errors.
17 Robustness in asset pricing versus forecasting In asset pricing literature, it is the investor s preferences, the structure of their utility function, which determine the worst-case scenario. In the forecasting problem, the decision maker has a preference for accuracy.
18 Parameter vs Model uncertainty Collin-Dufresne, Johannes, and Lochstoer (2013, 2015) show that if investors have recursive preferences, rational parameter learning generates subjective, long-run risks. Why? The investors can learn or know the true model. They face parameter uncertainty. The shocks are therefore permanent and affect all future periods of consumption With a robust decision maker, the analyst accepts model misspecification as a permanent state of affairs. They focus on robust controls.
19 Data Sources Combine data from I/B/E/S, Compustat and the the Center for Research in Securities Prices (CRSP). Use data from January 1984 to December Match firms against Compustat and CRSP: firms must be listed on NYSE, Nasdaq or AMEX. Sample Selection rules (to control for outliers): Delete observations with beginning of the quarter stock price below $5. Delete observations where the forecasted year-to-year change in quarterly earnings per share is greater than $10 in absolute value Trim extreme values (1% and 99%) for earnings, forecasts and forecast errors. Require a firm to have at least 20 observations of actual earnings and forecasts.
20 Descriptive Statistics
21 AR(1)-plus-noise FE i,t+1 = α + ρfe i,t + ε i,t+1 The pooled estimate of the autocorrelation in forecast errors, 0.216, is significant with a heteroscedasticity and autocorrelation consistent t-value of
22 A Joint Model of earnings and forecasts This whole system described above can be estimated as a VARMA(1,1): Y t+1 = A + BY t = Cε t+1 + Dε t where [ ] a t σ 2 a 0 0 yt Y t =, ε ŷ t = e t, cov(ε t ) = 0 σa 2 0 t n t σ [ ] [ ] a 2 µ(1 φ) φ 0 A =, B = ˆµ(1 φ) ˆφ ˆK ˆφ(1 ˆK) where µ is the long-term mean of y t. C = [ ŵ ŵ ], D = [ φ 0 ]
23 Estimation Procedure 1 Estimate the parameters of the AR-plus-noise using maximum likelihood. 2 Holding the parameter values fixed, estimate the rest of the VARMA model using conditional maximum likelihood. 1 Use a block bootstrapping procedure, resampling at the firm level to preserve time series properties. 1 Why block bootstrap? The errors are correlated, so simple residual resampling will fail. Rather, resample blocks of data.
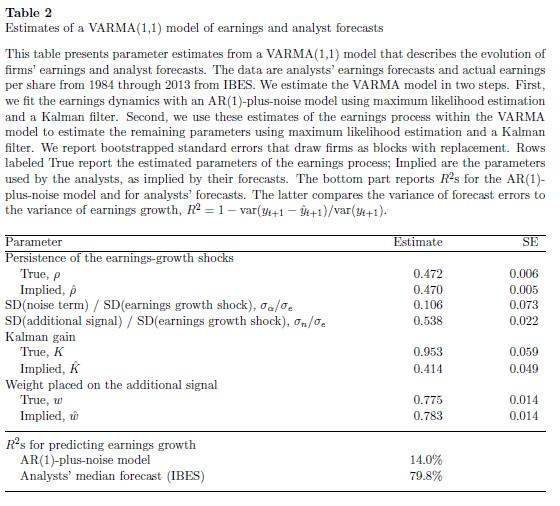
24 Table 2
25 Reliance on historical data Pseudo-R 2 of analyst forecasts = 1 var(y t+1 ŷ t+1 ) var(y t+1 ) If analysts use only historical data, the precision of their forecasts should be comparable to the R 2 of the ARMA(1,1). Using the pseudo-r 2, the authors find the R 2 of the analyst s forecasts is 79.8%.
26 Which mistakes drive the autocorrelation in forecast errors? The optimal forecast is: ŷ t = (1 ˆφ)ˆµ + ˆφ{ŷ t + ˆK(FE t )}+ŵs t ˆφ is the belief about the persistence of earnings growth shocks ˆK summarizes the belief in the informativeness of the reported earnings growth ŵ is how much the analyst weighs the additional signal s informativeness. An overconfident analyst weighs their private information more (ŵ w), while an analyst who herds weighs their information less (ŵ w).
27 Why is the Kalman Gain underestimated? Table 2 shows that it is the underestimation of K driving the autocorrelation; ˆφ and ŵ are quite close to their true values. This suggests the analysts have correct beliefs about the precision of the extra signals and the variance of the shocks to the persistent component of earnings growth. The Kalman gain used by the analysts ( ˆK = 0.414) vs. actual Kalman gain (K = 0.953) ŵ w 0, meaning analysts do not overestimate the precision of the additional signal ( ˆσ 2 n ) or the permanent growth shocks ( ˆσ 2 e ). The only explanation (in this model) for this is that ˆσ 2 a σ 2 a or an overestimation of the noise of the reported earnings.
28 Detection Error Probabilities In order to estimate the amount of robustness, we estimate the distance between the approximating and worst case model. Definitions Detection Error Probability p(η) = 1 (Pr(mistake A) + Pr(mistake W )) 2 where A is the approximating model and W is the worst case model
29 Table 3 Insert Table 3 here
30 Autocorrelation from the variation in the mean forecast error Intuition: A positive error is likely to be followed by a positive error. The sample is drawn from groups (firms, time periods or combination of both). If the mean forecasts differ between groups - then the error terms will cor(fe t+1,fe t ) = var(b m) var(µ ˆµ) = var(fe t ) var(fe t ) For examples, analysts could be accurate but issue systematically too low or too high forecasts for some firms. This will lead to an upward bias in the forecasts.
31 Figure 2
32 Autocorrelation from estimation errors in the persistence of the earnings growth shocks This effect comes from the first term in proposition 2. Variation in the estimation of the persistent component of the earnings growth. cov( ˆKy t + (1 ˆK)ŷ t,fe t ) (φ ˆφ) var(fe t )
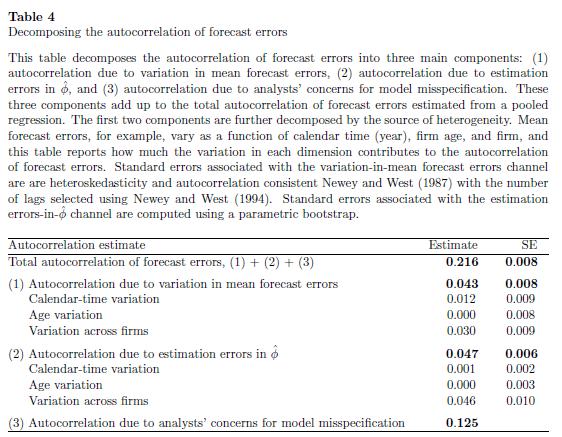
33 Table 4
34 Ideas for further research If autocorrelation is present in analysts forecasts, then it should have an effect on how investors learn about analysts ability and objectives. Following Chen et al.(2005), we have a simple estimation of Bayesian learning: M i,t = α 0 +a 1 NEWS i,t +a 2 w(n i,t ) NEWS i,t +a 3 w(n i,t ) ACC(N i,t ) NEW 1 M i,t is a measure of market impact 2 N is performance signals 3 NEWS is difference between forecast and consensus 4 ACC(N) is accuracy (average absolute forecast error) 5 w(n) is a weight increasing in observations of N
Optimal Window Selection for Forecasting in The Presence of Recent Structural Breaks
 Optimal Window Selection for Forecasting in The Presence of Recent Structural Breaks Yongli Wang University of Leicester Econometric Research in Finance Workshop on 15 September 2017 SGH Warsaw School
Week 7 Quantitative Analysis of Financial Markets Simulation Methods
 Week 7 Quantitative Analysis of Financial Markets Simulation Methods Christopher Ting http://www.mysmu.edu/faculty/christophert/ Christopher Ting : christopherting@smu.edu.sg : 6828 0364 : LKCSB 5036 November
Introduction Dickey-Fuller Test Option Pricing Bootstrapping. Simulation Methods. Chapter 13 of Chris Brook s Book.
 Simulation Methods Chapter 13 of Chris Brook s Book Christopher Ting http://www.mysmu.edu/faculty/christophert/ Christopher Ting : christopherting@smu.edu.sg : 6828 0364 : LKCSB 5036 April 26, 2017 Christopher
Chapter 6 Forecasting Volatility using Stochastic Volatility Model
 Chapter 6 Forecasting Volatility using Stochastic Volatility Model Chapter 6 Forecasting Volatility using SV Model In this chapter, the empirical performance of GARCH(1,1), GARCH-KF and SV models from
Monetary Economics Final Exam
 316-466 Monetary Economics Final Exam 1. Flexible-price monetary economics (90 marks). Consider a stochastic flexibleprice money in the utility function model. Time is discrete and denoted t =0, 1,...
Understanding the Sources of Macroeconomic Uncertainty
 Understanding the Sources of Macroeconomic Uncertainty Barbara Rossi, Tatevik Sekhposyan, Matthieu Soupre ICREA - UPF Texas A&M University UPF European Central Bank June 4, 6 Objective of the Paper Recent
Predictive Regressions: A Present-Value Approach (van Binsbe. (van Binsbergen and Koijen, 2009)
") Predictive Regressions: A Present-Value Approach (van Binsbergen and Koijen, 2009) October 5th, 2009 Overview Key ingredients: Results: Draw inference from the Campbell and Shiller (1988) present value
Predictive Regressions: A Present-Value Approach (van Binsbergen and Koijen, 2009) October 5th, 2009 Overview Key ingredients: Results: Draw inference from the Campbell and Shiller (1988) present value
Aggregate Earnings Surprises, & Behavioral Finance
 Stock Returns, Aggregate Earnings Surprises, & Behavioral Finance Kothari, Lewellen & Warner, JFE, 2006 FIN532 : Discussion Plan 1. Introduction 2. Sample Selection & Data Description 3. Part 1: Relation
D.1 Sufficient conditions for the modified FV model
 D Internet Appendix Jin Hyuk Choi, Ulsan National Institute of Science and Technology (UNIST Kasper Larsen, Rutgers University Duane J. Seppi, Carnegie Mellon University April 7, 2018 This Internet Appendix
The Variability of IPO Initial Returns
 The Variability of IPO Initial Returns Journal of Finance 65 (April 2010) 425-465 Michelle Lowry, Micah Officer, and G. William Schwert Interesting blend of time series and cross sectional modeling issues
Information Processing and Limited Liability
 Information Processing and Limited Liability Bartosz Maćkowiak European Central Bank and CEPR Mirko Wiederholt Northwestern University January 2012 Abstract Decision-makers often face limited liability
Ambiguous Information and Trading Volume in stock market
 Ambiguous Information and Trading Volume in stock market Meng-Wei Chen Department of Economics, Indiana University at Bloomington April 21, 2011 Abstract This paper studies the information transmission
Interval estimation. September 29, Outline Basic ideas Sampling variation and CLT Interval estimation using X More general problems
 Interval estimation September 29, 2017 STAT 151 Class 7 Slide 1 Outline of Topics 1 Basic ideas 2 Sampling variation and CLT 3 Interval estimation using X 4 More general problems STAT 151 Class 7 Slide
ARCH and GARCH models
 ARCH and GARCH models Fulvio Corsi SNS Pisa 5 Dic 2011 Fulvio Corsi ARCH and () GARCH models SNS Pisa 5 Dic 2011 1 / 21 Asset prices S&P 500 index from 1982 to 2009 1600 1400 1200 1000 800 600 400 200
Chapter 7 - Lecture 1 General concepts and criteria
 Chapter 7 - Lecture 1 General concepts and criteria January 29th, 2010 Best estimator Mean Square error Unbiased estimators Example Unbiased estimators not unique Special case MVUE Bootstrap General Question
Risks for the Long Run: A Potential Resolution of Asset Pricing Puzzles
 : A Potential Resolution of Asset Pricing Puzzles, JF (2004) Presented by: Esben Hedegaard NYUStern October 12, 2009 Outline 1 Introduction 2 The Long-Run Risk Solving the 3 Data and Calibration Results
Understanding Tail Risk 1
 Understanding Tail Risk 1 Laura Veldkamp New York University 1 Based on work with Nic Kozeniauskas, Julian Kozlowski, Anna Orlik and Venky Venkateswaran. 1/2 2/2 Why Study Information Frictions? Every
An analysis of momentum and contrarian strategies using an optimal orthogonal portfolio approach
 An analysis of momentum and contrarian strategies using an optimal orthogonal portfolio approach Hossein Asgharian and Björn Hansson Department of Economics, Lund University Box 7082 S-22007 Lund, Sweden
Can Rare Events Explain the Equity Premium Puzzle?
 Can Rare Events Explain the Equity Premium Puzzle? Christian Julliard and Anisha Ghosh Working Paper 2008 P t d b J L i f NYU A t P i i Presented by Jason Levine for NYU Asset Pricing Seminar, Fall 2009
Estimating a Dynamic Oligopolistic Game with Serially Correlated Unobserved Production Costs. SS223B-Empirical IO
 Estimating a Dynamic Oligopolistic Game with Serially Correlated Unobserved Production Costs SS223B-Empirical IO Motivation There have been substantial recent developments in the empirical literature on
Dividend Dynamics, Learning, and Expected Stock Index Returns
 Dividend Dynamics, Learning, and Expected Stock Index Returns October 30, 2017 Abstract We present a latent variable model of dividends that predicts, out-of-sample, 39.5% to 41.3% of the variation in
Chapter 5 Univariate time-series analysis. () Chapter 5 Univariate time-series analysis 1 / 29
 Chapter 5 Univariate time-series analysis 1 / 29") Chapter 5 Univariate time-series analysis () Chapter 5 Univariate time-series analysis 1 / 29 Time-Series Time-series is a sequence fx 1, x 2,..., x T g or fx t g, t = 1,..., T, where t is an index denoting
Chapter 5 Univariate time-series analysis () Chapter 5 Univariate time-series analysis 1 / 29 Time-Series Time-series is a sequence fx 1, x 2,..., x T g or fx t g, t = 1,..., T, where t is an index denoting
Behavioral Theories of the Business Cycle
 Behavioral Theories of the Business Cycle Nir Jaimovich and Sergio Rebelo September 2006 Abstract We explore the business cycle implications of expectation shocks and of two well-known psychological biases,
News Shocks and Asset Price Volatility in a DSGE Model
 News Shocks and Asset Price Volatility in a DSGE Model Akito Matsumoto 1 Pietro Cova 2 Massimiliano Pisani 2 Alessandro Rebucci 3 1 International Monetary Fund 2 Bank of Italy 3 Inter-American Development
Feedback Effect and Capital Structure
 Feedback Effect and Capital Structure Minh Vo Metropolitan State University Abstract This paper develops a model of financing with informational feedback effect that jointly determines a firm s capital
Unpublished Appendices to Market Reactions to Tangible and Intangible Information. Market Reactions to Different Types of Information
 Unpublished Appendices to Market Reactions to Tangible and Intangible Information. This document contains the unpublished appendices for Daniel and Titman (006), Market Reactions to Tangible and Intangible
Dividend Dynamics, Learning, and Expected Stock Index Returns
 Dividend Dynamics, Learning, and Expected Stock Index Returns Ravi Jagannathan Northwestern University and NBER Binying Liu Northwestern University September 30, 2015 Abstract We develop a model for dividend
Appendix to: AMoreElaborateModel
 Appendix to: Why Do Demand Curves for Stocks Slope Down? AMoreElaborateModel Antti Petajisto Yale School of Management February 2004 1 A More Elaborate Model 1.1 Motivation Our earlier model provides a
Consistent estimators for multilevel generalised linear models using an iterated bootstrap
 Multilevel Models Project Working Paper December, 98 Consistent estimators for multilevel generalised linear models using an iterated bootstrap by Harvey Goldstein hgoldstn@ioe.ac.uk Introduction Several
What Can Rational Investors Do About Excessive Volatility and Sentiment Fluctuations?
 What Can Rational Investors Do About Excessive Volatility and Sentiment Fluctuations? Bernard Dumas INSEAD, Wharton, CEPR, NBER Alexander Kurshev London Business School Raman Uppal London Business School,
Stochastic Volatility (SV) Models
 Models") 1 Motivations Stochastic Volatility (SV) Models Jun Yu Some stylised facts about financial asset return distributions: 1. Distribution is leptokurtic 2. Volatility clustering 3. Volatility responds to
1 Motivations Stochastic Volatility (SV) Models Jun Yu Some stylised facts about financial asset return distributions: 1. Distribution is leptokurtic 2. Volatility clustering 3. Volatility responds to
Microeconomic Foundations of Incomplete Price Adjustment
 Chapter 6 Microeconomic Foundations of Incomplete Price Adjustment In Romer s IS/MP/IA model, we assume prices/inflation adjust imperfectly when output changes. Empirically, there is a negative relationship
BIASES OVER BIASED INFORMATION STRUCTURES:
 BIASES OVER BIASED INFORMATION STRUCTURES: Confirmation, Contradiction and Certainty Seeking Behavior in the Laboratory Gary Charness Ryan Oprea Sevgi Yuksel UCSB - UCSB UCSB October 2017 MOTIVATION News
Chapter 8. Introduction to Statistical Inference
 Chapter 8. Introduction to Statistical Inference Point Estimation Statistical inference is to draw some type of conclusion about one or more parameters(population characteristics). Now you know that a
Chapter 9, section 3 from the 3rd edition: Policy Coordination
 Chapter 9, section 3 from the 3rd edition: Policy Coordination Carl E. Walsh March 8, 017 Contents 1 Policy Coordination 1 1.1 The Basic Model..................................... 1. Equilibrium with Coordination.............................
1 Volatility Definition and Estimation
 1 Volatility Definition and Estimation 1.1 WHAT IS VOLATILITY? It is useful to start with an explanation of what volatility is, at least for the purpose of clarifying the scope of this book. Volatility
Supplementary online material to Information tradeoffs in dynamic financial markets
 Supplementary online material to Information tradeoffs in dynamic financial markets Efstathios Avdis University of Alberta, Canada 1. The value of information in continuous time In this document I address
LECTURE NOTES 10 ARIEL M. VIALE
 LECTURE NOTES 10 ARIEL M VIALE 1 Behavioral Asset Pricing 11 Prospect theory based asset pricing model Barberis, Huang, and Santos (2001) assume a Lucas pure-exchange economy with three types of assets:
Financial Economics Field Exam August 2011
 Financial Economics Field Exam August 2011 There are two questions on the exam, representing Macroeconomic Finance (234A) and Corporate Finance (234C). Please answer both questions to the best of your
Lecture 22. Survey Sampling: an Overview
 Math 408 - Mathematical Statistics Lecture 22. Survey Sampling: an Overview March 25, 2013 Konstantin Zuev (USC) Math 408, Lecture 22 March 25, 2013 1 / 16 Survey Sampling: What and Why In surveys sampling
Signal or noise? Uncertainty and learning whether other traders are informed
 Signal or noise? Uncertainty and learning whether other traders are informed Snehal Banerjee (Northwestern) Brett Green (UC-Berkeley) AFA 2014 Meetings July 2013 Learning about other traders Trade motives
trading ambiguity: a tale of two heterogeneities
 trading ambiguity: a tale of two heterogeneities Sujoy Mukerji, Queen Mary, University of London Han Ozsoylev, Koç University and University of Oxford Jean-Marc Tallon, Paris School of Economics, CNRS
Identifying Long-Run Risks: A Bayesian Mixed-Frequency Approach
 Identifying : A Bayesian Mixed-Frequency Approach Frank Schorfheide University of Pennsylvania CEPR and NBER Dongho Song University of Pennsylvania Amir Yaron University of Pennsylvania NBER February 12,
Asset Pricing with Left-Skewed Long-Run Risk in. Durable Consumption
 Asset Pricing with Left-Skewed Long-Run Risk in Durable Consumption Wei Yang 1 This draft: October 2009 1 William E. Simon Graduate School of Business Administration, University of Rochester, Rochester,
Exploring Financial Instability Through Agent-based Modeling Part 2: Time Series, Adaptation, and Survival
 Mini course CIGI-INET: False Dichotomies Exploring Financial Instability Through Agent-based Modeling Part 2: Time Series, Adaptation, and Survival Blake LeBaron International Business School Brandeis
ARIMA-GARCH and unobserved component models with. GARCH disturbances: Are their prediction intervals. different?
 ARIMA-GARCH and unobserved component models with GARCH disturbances: Are their prediction intervals different? Santiago Pellegrini, Esther Ruiz and Antoni Espasa July 2008 Abstract We analyze the effects
Keynesian Views On The Fiscal Multiplier
 Faculty of Social Sciences Jeppe Druedahl (Ph.d. Student) Department of Economics 16th of December 2013 Slide 1/29 Outline 1 2 3 4 5 16th of December 2013 Slide 2/29 The For Today 1 Some 2 A Benchmark
Bailouts, Bail-ins and Banking Crises
 Bailouts, Bail-ins and Banking Crises Todd Keister Rutgers University Yuliyan Mitkov Rutgers University & University of Bonn 2017 HKUST Workshop on Macroeconomics June 15, 2017 The bank runs problem Intermediaries
Module 4: Point Estimation Statistics (OA3102)
") Module 4: Point Estimation Statistics (OA3102) Professor Ron Fricker Naval Postgraduate School Monterey, California Reading assignment: WM&S chapter 8.1-8.4 Revision: 1-12 1 Goals for this Module Define
Module 4: Point Estimation Statistics (OA3102) Professor Ron Fricker Naval Postgraduate School Monterey, California Reading assignment: WM&S chapter 8.1-8.4 Revision: 1-12 1 Goals for this Module Define
Optimal Financial Education. Avanidhar Subrahmanyam
 Optimal Financial Education Avanidhar Subrahmanyam Motivation The notion that irrational investors may be prevalent in financial markets has taken on increased impetus in recent years. For example, Daniel
Equilibrium Yield Curve, Phillips Correlation, and Monetary Policy
 Equilibrium Yield Curve, Phillips Correlation, and Monetary Policy Mitsuru Katagiri International Monetary Fund October 24, 2017 @Keio University 1 / 42 Disclaimer The views expressed here are those of
Risk and Ambiguity in Asset Returns
 Risk and Ambiguity in Asset Returns Cross-Sectional Differences Chiaki Hara and Toshiki Honda KIER, Kyoto University and ICS, Hitotsubashi University KIER, Kyoto University April 6, 2017 Hara and Honda
An Empirical Examination of the Electric Utilities Industry. December 19, Regulatory Induced Risk Aversion in. Contracting Behavior
 An Empirical Examination of the Electric Utilities Industry December 19, 2011 The Puzzle Why do price-regulated firms purchase input coal through both contract Figure and 1(a): spot Contract transactions,
FE670 Algorithmic Trading Strategies. Stevens Institute of Technology
 FE670 Algorithmic Trading Strategies Lecture 4. Cross-Sectional Models and Trading Strategies Steve Yang Stevens Institute of Technology 09/26/2013 Outline 1 Cross-Sectional Methods for Evaluation of Factor
Estimating Macroeconomic Models of Financial Crises: An Endogenous Regime-Switching Approach
 Estimating Macroeconomic Models of Financial Crises: An Endogenous Regime-Switching Approach Gianluca Benigno 1 Andrew Foerster 2 Christopher Otrok 3 Alessandro Rebucci 4 1 London School of Economics and
FE570 Financial Markets and Trading. Stevens Institute of Technology
 FE570 Financial Markets and Trading Lecture 6. Volatility Models and (Ref. Joel Hasbrouck - Empirical Market Microstructure ) Steve Yang Stevens Institute of Technology 10/02/2012 Outline 1 Volatility
Advanced Topics in Monetary Economics II 1
 Advanced Topics in Monetary Economics II 1 Carl E. Walsh UC Santa Cruz August 18-22, 2014 1 c Carl E. Walsh, 2014. Carl E. Walsh (UC Santa Cruz) Gerzensee Study Center August 18-22, 2014 1 / 38 Uncertainty
Chapter 6: Point Estimation
 Chapter 6: Point Estimation Professor Sharabati Purdue University March 10, 2014 Professor Sharabati (Purdue University) Point Estimation Spring 2014 1 / 37 Chapter Overview Point estimator and point estimate
Financial Econometrics
 Financial Econometrics Volatility Gerald P. Dwyer Trinity College, Dublin January 2013 GPD (TCD) Volatility 01/13 1 / 37 Squared log returns for CRSP daily GPD (TCD) Volatility 01/13 2 / 37 Absolute value
Problem set 1 Answers: 0 ( )= [ 0 ( +1 )] = [ ( +1 )]
![Problem set 1 Answers: 0 ( )= [ 0 ( +1 )] = [ ( +1 )]](/thumbs/90/101609040.jpg "Problem set 1 Answers: 0 ( )= [ 0 ( +1 )] = [ ( +1 )]") Problem set 1 Answers: 1. (a) The first order conditions are with 1+ 1so 0 ( ) [ 0 ( +1 )] [( +1 )] ( +1 ) Consumption follows a random walk. This is approximately true in many nonlinear models. Now we
Problem set 1 Answers: 1. (a) The first order conditions are with 1+ 1so 0 ( ) [ 0 ( +1 )] [( +1 )] ( +1 ) Consumption follows a random walk. This is approximately true in many nonlinear models. Now we
Earnings Inequality and the Minimum Wage: Evidence from Brazil
 Earnings Inequality and the Minimum Wage: Evidence from Brazil Niklas Engbom June 16, 2016 Christian Moser World Bank-Bank of Spain Conference This project Shed light on drivers of earnings inequality
Comparison of OLS and LAD regression techniques for estimating beta
 Comparison of OLS and LAD regression techniques for estimating beta 26 June 2013 Contents 1. Preparation of this report... 1 2. Executive summary... 2 3. Issue and evaluation approach... 4 4. Data... 6
Fresh Momentum. Engin Kose. Washington University in St. Louis. First version: October 2009
 Long Chen Washington University in St. Louis Fresh Momentum Engin Kose Washington University in St. Louis First version: October 2009 Ohad Kadan Washington University in St. Louis Abstract We demonstrate
Improving Returns-Based Style Analysis
 Improving Returns-Based Style Analysis Autumn, 2007 Daniel Mostovoy Northfield Information Services Daniel@northinfo.com Main Points For Today Over the past 15 years, Returns-Based Style Analysis become
Labor Economics Field Exam Spring 2011
 Labor Economics Field Exam Spring 2011 Instructions You have 4 hours to complete this exam. This is a closed book examination. No written materials are allowed. You can use a calculator. THE EXAM IS COMPOSED
Financial Time Series and Their Characteristics
 Financial Time Series and Their Characteristics Egon Zakrajšek Division of Monetary Affairs Federal Reserve Board Summer School in Financial Mathematics Faculty of Mathematics & Physics University of Ljubljana
The Consistency between Analysts Earnings Forecast Errors and Recommendations
 The Consistency between Analysts Earnings Forecast Errors and Recommendations by Lei Wang Applied Economics Bachelor, United International College (2013) and Yao Liu Bachelor of Business Administration,
Explaining the Last Consumption Boom-Bust Cycle in Ireland
 Public Disclosure Authorized Public Disclosure Authorized Public Disclosure Authorized Public Disclosure Authorized Policy Research Working Paper 6525 Explaining the Last Consumption Boom-Bust Cycle in
Alternative VaR Models
 Alternative VaR Models Neil Roeth, Senior Risk Developer, TFG Financial Systems. 15 th July 2015 Abstract We describe a variety of VaR models in terms of their key attributes and differences, e.g., parametric
Dividend Dynamics, Learning, and Expected Stock Index Returns
 Dividend Dynamics, Learning, and Expected Stock Index Returns Ravi Jagannathan Northwestern University and NBER Binying Liu Northwestern University April 14, 2016 Abstract We show that, in a perfect and
Lecture 5a: ARCH Models
 Lecture 5a: ARCH Models 1 2 Big Picture 1. We use ARMA model for the conditional mean 2. We use ARCH model for the conditional variance 3. ARMA and ARCH model can be used together to describe both conditional
Much of what appears here comes from ideas presented in the book:
 Chapter 11 Robust statistical methods Much of what appears here comes from ideas presented in the book: Huber, Peter J. (1981), Robust statistics, John Wiley & Sons (New York; Chichester). There are many
The Great Moderation Flattens Fat Tails: Disappearing Leptokurtosis
 The Great Moderation Flattens Fat Tails: Disappearing Leptokurtosis WenShwo Fang Department of Economics Feng Chia University 100 WenHwa Road, Taichung, TAIWAN Stephen M. Miller* College of Business University
Asymmetric Price Transmission: A Copula Approach
 Asymmetric Price Transmission: A Copula Approach Feng Qiu University of Alberta Barry Goodwin North Carolina State University August, 212 Prepared for the AAEA meeting in Seattle Outline Asymmetric price
STAT 509: Statistics for Engineers Dr. Dewei Wang. Copyright 2014 John Wiley & Sons, Inc. All rights reserved.
 STAT 509: Statistics for Engineers Dr. Dewei Wang Applied Statistics and Probability for Engineers Sixth Edition Douglas C. Montgomery George C. Runger 7 Point CHAPTER OUTLINE 7-1 Point Estimation 7-2
Generalized Dynamic Factor Models and Volatilities: Recovering the Market Volatility Shocks
 Generalized Dynamic Factor Models and Volatilities: Recovering the Market Volatility Shocks Paper by: Matteo Barigozzi and Marc Hallin Discussion by: Ross Askanazi March 27, 2015 Paper by: Matteo Barigozzi
Dividend Dynamics, Learning, and Expected Stock Index Returns
 Dividend Dynamics, Learning, and Expected Stock Index Returns Ravi Jagannathan Northwestern University, and NBER, ISB, SAIF Binying Liu Northwestern University September 28, 2016 Abstract We show that,
A Two-Step Estimator for Missing Values in Probit Model Covariates
 WORKING PAPER 3/2015 A Two-Step Estimator for Missing Values in Probit Model Covariates Lisha Wang and Thomas Laitila Statistics ISSN 1403-0586 http://www.oru.se/institutioner/handelshogskolan-vid-orebro-universitet/forskning/publikationer/working-papers/
Tests for One Variance
 Chapter 65 Introduction Occasionally, researchers are interested in the estimation of the variance (or standard deviation) rather than the mean. This module calculates the sample size and performs power
Toward A Term Structure of Macroeconomic Risk
 Toward A Term Structure of Macroeconomic Risk Pricing Unexpected Growth Fluctuations Lars Peter Hansen 1 2007 Nemmers Lecture, Northwestern University 1 Based in part joint work with John Heaton, Nan Li,
Do Peer Firms Affect Corporate Financial Policy?
 1 / 23 Do Peer Firms Affect Corporate Financial Policy? Journal of Finance, 2014 Mark T. Leary 1 and Michael R. Roberts 2 1 Olin Business School Washington University 2 The Wharton School University of
Control Chart for Autocorrelated Processes with Heavy Tailed Distributions
 Heldermann Verlag Economic Quality Control ISSN 0940-5151 Vol 23 (2008), No. 2, 197 206 Control Chart for Autocorrelated Processes with Heavy Tailed Distributions Keoagile Thaga Abstract: Standard control
Optimal Portfolio Inputs: Various Methods
 Optimal Portfolio Inputs: Various Methods Prepared by Kevin Pei for The Fund @ Sprott Abstract: In this document, I will model and back test our portfolio with various proposed models. It goes without
Multitask, Accountability, and Institutional Design
 Multitask, Accountability, and Institutional Design Scott Ashworth & Ethan Bueno de Mesquita Harris School of Public Policy Studies University of Chicago 1 / 32 Motivation Multiple executive tasks divided
Asymmetric Information and the Impact on Interest Rates. Evidence from Forecast Data
 Asymmetric Information and the Impact on Interest Rates Evidence from Forecast Data Asymmetric Information Hypothesis (AIH) Asserts that the federal reserve possesses private information about the current
The Estimation of Expected Stock Returns on the Basis of Analysts' Forecasts
 The Estimation of Expected Stock Returns on the Basis of Analysts' Forecasts by Wolfgang Breuer and Marc Gürtler RWTH Aachen TU Braunschweig October 28th, 2009 University of Hannover TU Braunschweig, Institute
Weight Smoothing with Laplace Prior and Its Application in GLM Model
 Weight Smoothing with Laplace Prior and Its Application in GLM Model Xi Xia 1 Michael Elliott 1,2 1 Department of Biostatistics, 2 Survey Methodology Program, University of Michigan National Cancer Institute
ANOMALIES AND NEWS JOEY ENGELBERG (UCSD) R. DAVID MCLEAN (GEORGETOWN) JEFFREY PONTIFF (BOSTON COLLEGE)
 R. DAVID MCLEAN (GEORGETOWN) JEFFREY PONTIFF (BOSTON COLLEGE)") ANOMALIES AND NEWS JOEY ENGELBERG (UCSD) R. DAVID MCLEAN (GEORGETOWN) JEFFREY PONTIFF (BOSTON COLLEGE) 3 RD ANNUAL NEWS & FINANCE CONFERENCE COLUMBIA UNIVERSITY MARCH 8, 2018 Background and Motivation
ANOMALIES AND NEWS JOEY ENGELBERG (UCSD) R. DAVID MCLEAN (GEORGETOWN) JEFFREY PONTIFF (BOSTON COLLEGE) 3 RD ANNUAL NEWS & FINANCE CONFERENCE COLUMBIA UNIVERSITY MARCH 8, 2018 Background and Motivation
Predictability of Interest Rates and Interest-Rate Portfolios
 Predictability of Interest Rates and Interest-Rate Portfolios Liuren Wu Zicklin School of Business, Baruch College Joint work with Turan Bali and Massoud Heidari July 7, 2007 The Bank of Canada - Rotman
Credit Shocks and the U.S. Business Cycle. Is This Time Different? Raju Huidrom University of Virginia. Midwest Macro Conference
 Credit Shocks and the U.S. Business Cycle: Is This Time Different? Raju Huidrom University of Virginia May 31, 214 Midwest Macro Conference Raju Huidrom Credit Shocks and the U.S. Business Cycle Background
The Kalman filter - and other methods
 The Kalman filter - and other methods Anders Ringgaard Kristensen Slide 1 Outline Filtering techniques applied to monitoring of daily gain in slaughter pigs: Introduction Basic monitoring Shewart control
The Kalman filter - and other methods
 The Kalman filter - and other methods Anders Ringgaard Kristensen Slide 1 Outline Filtering techniques applied to monitoring of daily gain in slaughter pigs: Introduction Basic monitoring Shewart control
The Predictability Characteristics and Profitability of Price Momentum Strategies: A New Approach
 The Predictability Characteristics and Profitability of Price Momentum Strategies: A ew Approach Prodosh Eugene Simlai University of orth Dakota We suggest a flexible method to study the dynamic effect
Chapter 5. Statistical inference for Parametric Models
 Chapter 5. Statistical inference for Parametric Models Outline Overview Parameter estimation Method of moments How good are method of moments estimates? Interval estimation Statistical Inference for Parametric
Applied Statistics I
 Applied Statistics I Liang Zhang Department of Mathematics, University of Utah July 14, 2008 Liang Zhang (UofU) Applied Statistics I July 14, 2008 1 / 18 Point Estimation Liang Zhang (UofU) Applied Statistics
Correlation Ambiguity
 Correlation Ambiguity Jun Liu University of California at San Diego Xudong Zeng Shanghai University of Finance and Economics This Version 2016.09.15 ABSTRACT Most papers on ambiguity aversion in the setting
Ambiguity Aversion: Implications for the Uncovered Interest Rate Parity Puzzle
 Ambiguity Aversion: Implications for the Uncovered Interest Rate Parity Puzzle Cosmin L. Ilut Duke University First version: October 2008 Revised version: March 2010 Abstract High-interest-rate currencies
PARAMETRIC AND NON-PARAMETRIC BOOTSTRAP: A SIMULATION STUDY FOR A LINEAR REGRESSION WITH RESIDUALS FROM A MIXTURE OF LAPLACE DISTRIBUTIONS
 PARAMETRIC AND NON-PARAMETRIC BOOTSTRAP: A SIMULATION STUDY FOR A LINEAR REGRESSION WITH RESIDUALS FROM A MIXTURE OF LAPLACE DISTRIBUTIONS Melfi Alrasheedi School of Business, King Faisal University, Saudi
Financial Economics Field Exam January 2008
 Financial Economics Field Exam January 2008 There are two questions on the exam, representing Asset Pricing (236D = 234A) and Corporate Finance (234C). Please answer both questions to the best of your
Exercises on the New-Keynesian Model
 Advanced Macroeconomics II Professor Lorenza Rossi/Jordi Gali T.A. Daniël van Schoot, daniel.vanschoot@upf.edu Exercises on the New-Keynesian Model Schedule: 28th of May (seminar 4): Exercises 1, 2 and