What is the Level of Volatility in Instantaneous Driving Decisions?
|
|
|
- Norman Lloyd
- 6 years ago
- Views:
Transcription
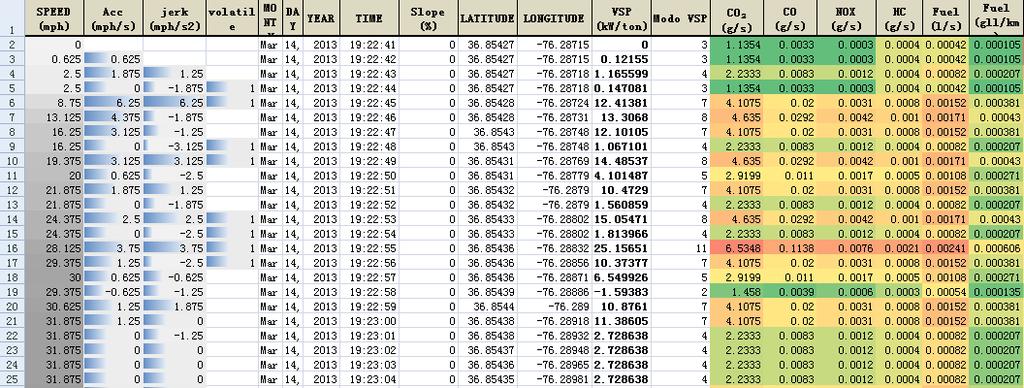
1 Transportation for Livability by Integrating Vehicles, Drivers and the Environment: What is the Level of Volatility in Instantaneous Driving Decisions? Asad Khattak, Ph.D. Beaman Professor of CEE, University of Tennessee, Knoxville Research conducted as: Frank Batten Endowed Chair Professor, Old Dominion University Editor in Chief, Journal of Intelligent Transportation Systems Collaborators: Dr. Xin Wang, Jun Liu, Golnush Masghati-Amoli, Sanghoon Son


2 Tier 1 University Transportation Center Competitively awarded UTC, focused on energy and environment Collaborative Partners include: University of Idaho Old Dominion University Texas Southern University Virginia Tech Syracuse University Thanks to USDOT

3 Background AERIS: Sustainability & Intelligent Trans Sys Volatile driving fuel consumption, tailpipe emissions, safety issues Understanding instantaneous driving decisions Big data enabling deeper insights How to properly measure volatility in drivers instantaneous driving decisions? Volatility profile for driver, road, region
4 Literature: Speed vs. Emissions Enrichment event: Emissions increase by 100 to 2500 times Identify critical decision points

5 Lit: Speed vs. Fuel consumption 75 mph
6 Possible relationship: Speed vs. Crashes Aarts, L. and I. van Schagen (2006). "Driving speed and the risk of road crashes: A review." Accident Analysis & Prevention 38(2):

7 Big Data Atlanta Regional Commission Regional Travel Survey with GPS Sub-Sample, Feb. Oct Full sample 10,278 households, 25,810 Persons, 21,270 Vehicles, 93,713 Trips GPS sub-sample 51,371 trips with sec-by-sec GPS tag 36 million sec 1652 drivers from 850 households
8 Big Data Knowledge Modeling: Knowledge Visualization: Describing data Big Data: Process and extract
 Geo-codes, road type, congestion info NOT available Note: * Available for GPS subsample")
9 Data structure Household Person Vehicle Trip *GPS data for each trip (used in this study) *Micro-trip (future work) Geo-codes, road type, congestion info NOT available Note: * Available for GPS subsample
10 Conceptual framework Situational Factors -trip purpose -trip distance/duration -location on network -time of day -passengers on board Driver Attributes -age -gender -education -personality Vehicle Attributes -body type -fuel type -vehicle age -engine performance Travel Information -in-veh navigation -message content (eco-info) -message accuracy Instantaneous driving dec. & volatility -Maintain speed -Accelerate/Decelerate -Maintain Acceleration/Deceleration -Increase marginal rate of Accel/Decel -Lane changes Outcomes -Safety -Energy -Emissions Network Attributes -road type -congestion level -traffic signals Environmental Factors -weather -lighting -pavement -landscape Describe and understand first
/d(t) = d 2 (v)/d(t) 2 = d 3 (d)/d(t) 3 J -jerk a-acceleration v-velocity")
11 Methodology: Jerk to measure volatility How jerk works-amplify oscillations LOCAL Roads Interstate or arterial LOCAL Roads J = d(a)/d(t) = d 2 (v)/d(t) 2 = d 3 (d)/d(t) 3 J -jerk a-acceleration v-velocity d-distance
12 Methodology: Vehicle jerking decisions

13

14 Time (sec) 7% - idling & speed<5 mph 47% -acceleration 41% -deceleration 5% -maintaining speed Volatility: REGIONAL LEVEL Separate out for: congested/uncongested & road type

.")
15 Sample Size: 36,715,308 second Volatility Profile: REGIONAL LEVEL Negative jerk compared with positive jerk (53.79% vs %). J- = (a, c, e) J+ = (b, d, f)
16 Jerk (mph/sec 2 ) Volatility Profile: REGIONAL LEVEL Speed vs. Vehicular jerk Speed (mph) Sample Size: 36,715,308 seconds
 25% Quartile At lower speeds, acceleration magnitude is less than deceleration.")
17 Deceleration Acceleration Volatility Profile: REGIONAL LEVEL ACCEL/DECEL-Bands 95% Percentile 75% Quartile 50% Quartile (Median) 25% Quartile At lower speeds, acceleration magnitude is less than deceleration. Sample Size: 36,715,308 sec

18 Volatility Profile: REGIONAL LEVEL ACCEL/DECEL-Bands in 3D Sample Size: 36,715,308 sec Most drivers drive at around 70 mph-their interstate speed

 25% Quartile Sample Size:")
19 Jerk- Jerk+ Volatility Profile: REGIONAL LEVEL Jerk+/Jerk- Bands 95% Percertile 75% Quartile 50% Quartile (Median) 25% Quartile Sample Size: 36,715,308 seconds

20 Volatility Profile: REGIONAL LEVEL Jerk Distribution Sample Size: 36,715,308 seconds Most drivers go at 70 mph on interstates
21 Volatility Profile: Individual Driver Local Driving Interstate Driving 5-10 mph over posted speed limit Sample Size: 27,505 seconds
22 Volatility Profile: Compare Drivers Volatility score in different speed ranges Speed Range veh9490 veh9491 veh9492 <20 mph 17.24% 12.60% 8.47% mph 21.23% 12.92% 6.61% mph 26.99% 15.02% 7.50% >60 mph 13.62% 12.63% 9.39% 9490: high volatility 9492: less volatility

23 Volatility profile: Trip Level Volatility Score for each trip For each second of the trip, tag volatile second when Acceleration/Jerk is out of the band range Red Area For each trip, calculate % of time tagged as volatile seconds Volatility Score


24 Volatility Score: Decision points Jerk better captures critical decision points volatility score - 8.6% using jerk bands - 6.1% using acceleration bands

25 Volatility score: subsample Sample: Pick one weekday for each person 543 households 843 drivers 857 vehicles 3962 trips 0.11
26 Results: Descriptive Stats & ANOVA Variable List Person Variable (N=507 for commute, N=722 for noncommute) Vehicle Type (N=507 for commute, N=736 for noncommute) Vehicle Fuel Type Trip Variable (N=1369 for commute, N=2702 for noncommute) Level (% in sample) COMMUTE TRIPS Volatility Score NON-COMMUTE TRIPS Volatility Score ANOVA ANOVA (% in Mean SD P-value F-test sample) Mean SD ANOVA P-value Gender Male (43%) base (55%) base Female (57%) (45%) yrs (7.5%) base (6.0%) base 25-34yrs (11.9%) (8.3%) Age 35-44yrs (27.4%) (20.1%) yrs (31.9%) (30.3%) yrs(16.4%) (22.8%) >65yrs (5%) (12.5%) Auto-Sedan (44%) base (42%) base Two Seated (4%) (3%) Van (9%) (12%) RV (0.2%) (0.1%) SUV (28%) (28%) Station Wagon (2%) (2%) Pickup (13%) (12%) Gasoline (96%) base (97%) base Diesel (2%) (1%) Hybrid (2%) (1%) Flex Fuel (0.5%) (1%) AM Rush (41%) (26%) Lunch Rush (6%) (7%) PM Rush (29%) (29%) Non Rush (24%) Base (37%) Base 0-15mile (78.1%) Base (88.4%) Base Distance 15-30mile(15.3%) (8.3%) mile(5.4%) (2.4%) >45mile(1.2%) (0.8%) ANOVA F-test Average Volatility Score: 11% for both commute and non-commute trips
27 Simple OLS model Person Variable Vehicle Type Samples in this model are not independent Same drivers make multiple trips Variable List Coefficient P-Value Members of same household not independent Gender: Female Age: 25-34yrs Age: 35-44yrs Age: 45-54yrs Age: 55-64yrs Age: >65yrs Two Seated Van RV SUV Station Wagon Pickup Diesel Vehicle Fuel Type Hybrid Flex Fuel Trip Distance Trip Distance Constant Number of obs = 3962, Prob > F = 0.000, R-squared = V = β X + e
28 Hierarchical Structure Too Complicated? Household1 Household Household2 Driver Vehicle Trips Micro Trips (Future layers)
29 Simplified Hierarchical structure Household1 Household Household2 Driver Vehicle Trips
30 Test 2 Layers - constant only model Drivers differ in average volatility scores inter-person differences Inter-person variance nearly the same as inter-trip variance Driver Trips Volatility Fixed Inter-trip μ00 Vij = β0j + rij β0j = μ00 + u0j Inter-person i-trip, j-driver Grand mean uoj rij OLS model problematic
31 2 Layers model add person level variables Driver Trips Vij = β0j + rij β0j = μ00 + μ01 Age+ μ00 Gender + u0j i-trip, j-driver μ01 μ02 μ00 Two fixed effects added u0j rij Dropped by 5%: Age & gender explain personlevel variance; More variables needed to reduce unexplained var.
32 2 Layers model add trip level variable Cov (negative) sig. evidence that association of volatility & trip distance is related to average volatility score of driver Driver Trips Vij = β0j + β1j Distance + rij β0j = μ00 + u0j β1j = μ10 + u1j μ10 μ00 Trip level variable added i-trip, j-driver u1j u0j rij Dropped 8%: Distance explains trip-level variance
33 Test 3 layers- Constant only model Households differ in their average volatility score; Drivers differ in their average volatility within HH; More Variance among different trips Household1 μ Vijk = β+ rijk β = μ + uk + uik Grand mean Inter-HH Inter-trip Inter-person i-trip, j-driver k-household uk rijk uik OLS model problematic
34 Implications: Volatility is useful Regional level: how people drive traffic operations 7% idling, 47% acceleration, 41% deceleration, 5% constant speed Individual level: how each person compares with driving practices of sample identify volatile drivers Trip level: how a driver performs on a particular trip design intelligent driver feedback systems
35 Conclusions: All about Volatility What is Volatility? It is a score for each trip % of time driver jerks vehicle during trip How to properly measure volatility? Using a regional jerk profile (Mean +/- SD) What is the level of volatility in discrete driving decisions? On average, 11% of the time (based on 36 million seconds)
36 Conclusions What are the correlates of volatile instantaneous driving decisions? -Females, younger people, people driving station wagon or 2-seat sports car, people driving SUV and pickup - Shorter trip - Rush hour does not associate with volatility
37 Conclusions Simple hierarchical model: Quantifies inter-person differences Quantifies inter-trip differences exist Association of trip level variables (e.g., trip length) with volatility may be related to a person s past behavior and attributes On-going research To find variables that better explain relationships
38 Contributions Fundamental in nature Driver s volatile instantaneous decisions: Analyzing large-scale GPS data Generate Volatility Score for each trip Understand typical driving practices in a metropolitan area Time used to ACCEL/DECEL Variance in ACCEL/DECEL/Jerk Relationships: Speeds vs. ACCEL/DECEL/Jerk
39 Limitations Limitations & future work Some variables not available to researchers, e.g., geo-codes, type of roads, congestion Accuracy of GPS data (constrained to 7-14 ft.) Future work Modeling volatility (hierarchical models) Explore role of technology, environment & land use Comparative studies in different regions/states
Transport Data Analysis and Modeling Methodologies
 Transport Data Analysis and Modeling Methodologies Lab Session #14 (Discrete Data Latent Class Logit Analysis based on Example 13.1) In Example 13.1, you were given 151 observations of a travel survey
32 nd Street Corridor Improvements
 Benefit-Cost Analysis Supplementary Documentation TIGER Discretionary Grant Program 32 nd Corridor Improvements USDOT TIGER BCA Results City of Joplin, MO April 29, 2016 32nd Corridor Improvements Contents...
2012 TIGER Grant Application Benefit Cost Analysis Technical Memo March 19, 2012
 Improved US 70 with Railroad Grade Separation (Highway Overpass) Valliant, Oklahoma 2012 TIGER Grant Application Benefit Cost Analysis Technical Memo March 19, 2012 Project Summary The Improved US 70 with
Gladys Porter Early College High School. Alberto Velez. Brownsville, Texas
 Gladys Porter Early College High School Alberto Velez Brownsville, Texas Chapter 14 Transportation Section 14.1 TRANSPORTATION CHOICES Objectives Identify various types of transportation. Explain how to
RMTA FY2016 Annual Traffic and Toll Revenue Report
 RMTA Richmond Metropolitan Transportation Authority RMTA RMTA FY216 Annual Traffic and Report Richmond Metropolitan Transportation Authority August 216 Final Report RMTA FY216 Annual Traffic and Report
I-81 Corridor Improvement Plan. October 2018 Public Meetings
 I-81 Corridor Improvement Plan October 2018 Public Meetings I-81 Corridor Improvement Plan Overview of I-81 Corridor Improvement Plan purpose Summary of public feedback Prioritization of potential improvements
Draft Environmental Impact Statement. Appendix G Economic Analysis Report
 Draft Environmental Impact Statement Appendix G Economic Analysis Report Appendix G Economic Analysis Report Economic Analyses in Support of Environmental Impact Statement Carolina Crossroads I-20/26/126
Transportation Research Board NHTS for Transportation Decision Making Washington D.C. June 6, 2011
 Transportation Research Board NHTS for Transportation Decision Making Washington D.C. June 6, 2011 To identify new or emerging travel behaviors, technologies and perspectives that may affect future travel
I-75 at Overpass Road Interchange
 Benefit-Cost Analysis Supplementary Documentation TIGER Grant Program I-75 at Overpass Road Interchange Pasco County, FL October 16, 2017 0 Benefit-Cost Analysis Supplementary Documentation 1. Introduction
Reexamining the Accident Externality from Driving. Using Individual Data
 Reexamining the Accident Externality from Driving Using Individual Data Rachel J. Huang * Associate Professor, Graduate Institute of Finance, National Taiwan University of Science and Technology, Taiwan
Insurance Telematics
 ISSN 2278 0211 (Online) Insurance Telematics Dr. Meena Goyal Professor, Indira School of Business Studies, Tathavade, New Mumbai Pune Highway, India Abstract: Telematics is one of the upcoming tools to
Session 4a Future of Data Analytics in Auto insurance. David Dou, FCAS
 Session 4a Future of Data Analytics in Auto insurance David Dou, FCAS August 29 2016 SOA Key messages for today Future of Data Analytics in Auto insurance Background of Data Analytics in Auto insurance
TIGER III Grant Application Benefit Cost Analysis Technical Memo October 31, 2011
 Improved US 70 with Railroad Grade Separation (Highway Overpass) Valliant, Oklahoma TIGER III Grant Application Benefit Cost Analysis Technical Memo October 31, 2011 The formal benefit-cost analysis (BCA)
Making Transportation Sustainable: Insights from Germany
 Making Transportation Sustainable: Insights from Germany Dr. Ralph Buehler, Assistant Professor in urban affairs and planning at the School of Public and International Affairs, Virginia Tech, Alexandria,
Americans AV Preferences: Dynamic Ride-Sharing, Privacy & Long-Distance Mode Choices. Dr. Kara Kockelman & Krishna Murthy Gurumurthy
 Americans AV Preferences: Dynamic Ride-Sharing, Privacy & Long-Distance Mode Choices Dr. Kara Kockelman & Krishna Murthy Gurumurthy Survey Stats. 2,588 Americans answered 70-questions. 1,258 responses
Revving up the Tax Engine: Gas Taxes and the DC Metro Area s Transportation Dilemma
 Revving up the Tax Engine: Gas Taxes and the DC Metro Area s Transportation Dilemma Peter Nelson, Kenneth Gillingham, and Elena Safirova August 2003 Urban Complexities Issue Brief 03-05 Resources for the
TESTIMONY. The Texas Transportation Challenge. Testimony Before the Study Commission on Transportation Financing
 TESTIMONY The Texas Transportation Challenge Testimony Before the Study Commission on Transportation Financing Ric Williamson Chairman Texas Transportation Commission April 19, 2006 Texas Department of
A PROCEDURAL DOCUMENT DESCRIBING THE PROCESS OF DEVELOPING THE 4-YEAR PLAN
 5-9035-01-P8 A PROCEDURAL DOCUMENT DESCRIBING THE PROCESS OF DEVELOPING THE 4-YEAR PLAN Authors: Zhanmin Zhang Michael R. Murphy TxDOT Project 5-9035-01: Pilot Implementation of a Web-based GIS System
The Heterogeneous Effects of Gasoline Taxes: Why Where We Live Matters
 The Heterogeneous Effects of Gasoline Taxes: Why Where We Live Matters Heather Stephens (West Virginia University) Elisheba Spiller (Environmental Defense Fund) Yong Chen (Oregon State University) 33RD
INVESTING STRATEGICALLY
 11 INVESTING STRATEGICALLY Federal transportation legislation (Fixing America s Surface Transportation Act FAST Act) requires that the 2040 RTP be based on a financial plan that demonstrates how the program
US Automobile: Sales, Financing and Used Vehicle Insights. Mike Buckingham Senior Director Auto Finance JD Power Data & Analytics
 US Automobile: Sales, Financing and Used Vehicle Insights Mike Buckingham Senior Director Auto Finance JD Power Data & Analytics Agenda Ø JD Power PIN Data; Background/Source Ø New Vehicle Data; Auto Sales,
Existing Conditions/Studies
 CAMPO Plan and Model Pesentation Presentation June 17, 2008 CAMPO 2035 Plan Timeline September 2008 Network/Modal Environmental Demographic Fiscal/Policy Needs Analysis Existing Conditions/Studies Vision/
Financial Report - FY 2017 Year to Date May 31, 2017
 Financial Report - FY 2017 Year to Date July 19, 2017 1 Major Highlights Revenue Sales tax remittances received through YTD April 2017 are 4.2% higher than YTD April 2016 Plaza Saltillo lease income budgeted
The Great Driver app from Electric Insurance Company
 The Great Driver app from Electric Insurance Company GOOD DRIVERS CAN EARN GREAT DISCOUNTS WITH THE GREAT DRIVER APP. GET YOUR ROAD MAP HERE. FREQUENTLY ASKED QUESTIONS www.greatdriver.com CONTENTS When
Metropolitan Council Budget Overview: State Fiscal Year
 February 1, 2017 Metropolitan Council Budget Overview: State Fiscal Year 2018-2019 Presentation to the Senate Transportation Finance and Policy Committee Transportation for a growing region 2 Regional
CE 561 Lecture Notes. Transportation System Performance. Set 4. -interaction between demand and supply Demand
 CE 561 Lecture Notes Set 4 Transportation System Performance -interaction between demand and supply Demand p, Price p 0 D 3 = α βp p 1 D 2 D 1 0 1, Vol. Short-run change in demand due to change in price
Project 06-06, Phase 2 June 2011
 ASSESSING AND INTERPRETING THE BENEFITS DERIVED FROM IMPLEMENTING AND USING ASSET MANAGEMENT SYSTEMS Project 06-06, Phase 2 June 2011 Midwest Regional University Transportation Center College of Engineering
I-44/US-75 Interchange and Related Improvements on I-44 in Tulsa County
 I-44/US-75 Interchange and Related Improvements on I-44 in Tulsa County Cost-Effectiveness Analysis Supplementary Documentation FASTLANE Discretionary Grant Program I-44/US-75 Interchange and Related Improvements
Strategic Performance measures
 Strategic Performance measures 2012 RepoRt background In 2007, the RTA worked with CTA, Pace, and Metra as well as other community stakeholders to develop a Regional Transportation Strategic Plan. This
MEMORANDUM OF AGREEMENT
 MEMORANDUM OF AGREEMENT made as of the 9 th day of June 2006 BETWEEN: HER MAJESTY THE QUEEN, in right of Alberta ( Alberta ), as represented by the Minister of Infrastructure and Transportation ( Minister
METRO. Fiscal Year 2017 Monthly Performance Report. Revenue Expense Ridership Performance. October 2016
 METRO Fiscal Year 2017 Monthly Performance Report Revenue Expense Ridership Performance 11/18/2016 Table of Contents Section A Section B Section C Section D Section E Section F Section G Section H Section
February 2016 Financial Report
 2016 February 2016 Financial Report Capital Metropolitan Transportation Authority 4/13/2016 Table of Contents SUMMARY REPORT Budgetary Performance - Revenue 2 - Sales Tax Revenue 5 - Operating Expenses
METRO. Fiscal Year Monthly Performance Report. Revenue Expense Ridership Performance. November 2018 (Third Quarter Fiscal Year-to Date)
") METRO Fiscal Year 2019 Monthly Performance Report Revenue Expense Ridership Performance (Third Quarter Fiscal Year-to Date) 12/12/2018 Table of Contents Section A Section B Section C Section D Section
METRO Fiscal Year 2019 Monthly Performance Report Revenue Expense Ridership Performance (Third Quarter Fiscal Year-to Date) 12/12/2018 Table of Contents Section A Section B Section C Section D Section
House Bill 20 Implementation. House Select Committee on Transportation Planning Tuesday, August 30, 2016, 1:00 P.M. Capitol Extension E2.
 House Bill 20 Implementation Tuesday,, 1:00 P.M. Capitol Extension E2.020 INTRODUCTION In response to House Bill 20 (HB 20), 84 th Legislature, Regular Session, 2015, and as part of the implementation
April 30, 2016 Financial Report
 2016 April 30, 2016 Financial Report Capital Metropolitan Transportation Authority 6/15/2016 Table of Contents SUMMARY REPORT Budgetary Performance - Revenue 2 - Sales Tax Revenue 6 - Operating Expenses
2018 Schedule M1UE, Unreimbursed Employee Business Expenses
 2018 Schedule M1UE, Unreimbursed Employee Business Expenses *181641* Before you complete this schedule, read the instructions to see if you are eligible. Your First Name and Initial Last Name Your Social
Journey Risk Management for Pune City
 Journey Risk Management for Pune City By: Shubham S. Bannore & Ashlesha S. Ithape in association with The Automotive Research Association of India (ARAI) What is Journey Risk Management? Journey risk management
Top Incorrect Problems
 What is the z-score for scores in the bottom 5%? a) -1.645 b) 1.645 c).4801 d) The score is not listed in the table. A professor grades 120 research papers and reports that the average score was an 80%.
CIRCULAR STATE OF NEW JERSEY DEPARTMENT OF THE TREASURY
 CIRCULAR STATE OF NEW JERSEY DEPARTMENT OF THE TREASURY ORIGINATING NO.: 17-05-ADM AGENCY: DIVISION OF ADMINISTRATION PAGE 1 OF 7 EFFECTIVE EXPIRATION SUPERSEDES: 12-11-ADM DATE: 10-03-16 DATE: INDEFINITE
CHAPTER 2 Describing Data: Numerical
 CHAPTER Multiple-Choice Questions 1. A scatter plot can illustrate all of the following except: A) the median of each of the two variables B) the range of each of the two variables C) an indication of
Operating Budget. Third Quarter Financial Report (July 2005 March 2006)
") Third Quarter Financial Report (July 2005 March 2006) INDEX A. Executive Summary...page 2 B. Revenue and Expense Analysis...page 3 C. Budget Variance Reports...page 14 D. Ridership and Performance Measures...page
Third Quarter Financial Report (July 2005 March 2006) INDEX A. Executive Summary...page 2 B. Revenue and Expense Analysis...page 3 C. Budget Variance Reports...page 14 D. Ridership and Performance Measures...page
Streamline Bus Five-Year Business Plan Community Conversations. Lisa Ballard, P.E. November 13, 2012
 Streamline Bus Five-Year Business Plan Community Conversations Lisa Ballard, P.E. November 13, 2012 Streamline Daytime Latenight Bridger Bowl Livingston Saturdays Galavan Reach $1.4 million per year Ride
ECONOMIC ANALYSIS. A. Introduction
 Bridge Replacement for Improved Rural Access Sector Project (RRP PNG 43200) ECONOMIC ANALYSIS A. Introduction 1. The economic analysis of the proposed project has been carried out in accordance with ADB
Impacts of Socio-Demographic Changes on the New Zealand Land Transport System
 Impacts of Socio-Demographic Changes on the New Zealand Land Transport System Adolf Stroombergen, Infometrics Michael Bealing & Eilya Torshizian, NZIER Jacques Poot, Waikato University Presentation to:
MoDOT Dashboard. Measurements of Performance
 MoDOT Dashboard Measurements of Performance 1997 1998 1999 2000 2001 2002 MoDOT Dashboard Executive Summary Performance measurement is not new to MoDOT. In July 2001, MoDOT staff began completing quarterly
Emilia Istrate, Senior Research Analyst. July 28, 2009 Washington DC
 National Surface Transportation Legislation: Metropolitan Outlook Government Research Association Annual Conference Emilia Istrate, Senior Research Analyst July 28, 2009 Washington DC 1 2 3 The Background:
Texas Department of Transportation 1
 Texas Department of Transportation 1 TABLE OF CONTENTS A Note on Data Collection and Analysis 3 CTTS Executive Summary 4 Revenue Comparison 5 Average Weekday Transaction Comparison 6 Transactions by Type
15,790. Bryan Waco Region. Do you own or lease a personal vehicle? What is your primary means of transportation?
 Bryan Waco Region 1 Houston 2 Dallas 3 Fort Worth 4 San Antonio 5 Austin 6 Laredo Pharr 7 Corpus Christi Yoakum 8 Bryan Waco 9 Atlanta Beaumont Lufkin Paris Tyler 10 Amarillo Childress Lubbock Wichita
2018 Benchmarking Survey Report Astor Ballroom I & II 10:30 AM - 12:00 #NCSFA2018
 2018 Benchmarking Survey Report Astor Ballroom I & II 10:30 AM - 12:00 PM NCSFA Survey Objectives Inform and educate NCSFA members and other fleet professionals about industry conditions, practices, and
17,321 13,351. Overall Statewide Results. How was the survey taken? Do you own or lease a personal vehicle?
 10 Overall Statewide Results 3 2 How was the survey taken? 1 Houston 2 Dallas 3 Fort Worth 4 San Antonio 5 Austin 6 Laredo / Pharr 7 Corpus Christi / Yoakum 12 11 5 4 7 8 1 9 Internet Mail Phone 35% 61%
Other ongoing research activities
 Go look at the posters during lunch! Other ongoing research activities Pre Catherine Morency, ing., Ph.D. Head of Chaire Mobilité Hubert Verreault, ing. jr., M.Sc.A. 5 e Annual Meeting, Polytechnique Montréal,
Mass Transit Return on Investment
 Mass Transit Return on Investment Twin Cities Case Study presented to presented to: ITED 2014 presented by by: Cambridge Systematics, Inc. Paula Dowell, Ph.D. Cambridge Systematics, Inc. April 2014 2030
TechnoMetrica Auto Demand Index
 TechnoMetrica Auto Demand Index October 217 7 Hilltop Road, Ramsey, NJ 7446 Pho:21-986-1288 Fax:21-986-119 www.technometrica.com Table Of Contents I. Methodology 3 II. Auto Demand Index 4-12 A. Auto Demand
2/28/2017. The evolution of home and auto insurance. Agenda. Home & Auto Insurance Evolution Timeline. 1. Home & Auto Insurance Evolution Timeline
 The evolution of home and auto insurance Sheri Scott, FCAS, MAAA March 2016 Agenda 1. Home & Auto Insurance Evolution Timeline 2. Millennial Needs Driving Use of Technology and Shared Economy 3. Vehicle
Traffic Impact Analysis Guidelines Methodology
 York County Government Traffic Impact Analysis Guidelines Methodology Implementation Guide for Section 154.037 Traffic Impact Analysis of the York County Code of Ordinances 11/1/2017 TABLE OF CONTENTS
Driver Performance Solutions from CNA RISK CONTROL
 Driver Performance Solutions from CNA RISK CONTROL Manage your commercial auto risk by driving the desired behaviors Driver behavior affects your commercial auto fleet s performance and your bottom line
GGraph. Males Only. Premium. Experience. GGraph. Gender. 1 0: R 2 Linear = : R 2 Linear = Page 1
 GGraph 9 Gender : R Linear =.43 : R Linear =.769 8 7 6 5 4 3 5 5 Males Only GGraph Page R Linear =.43 R Loess 9 8 7 6 5 4 5 5 Explore Case Processing Summary Cases Valid Missing Total N Percent N Percent
METRO. Fiscal Year Monthly Performance Report. Revenue Expense Ridership Performance. February 2018 (First Quarter Fiscal Year-to Date)
") METRO Fiscal Year 2018 Monthly Performance Report Revenue Expense Ridership Performance (First Quarter Fiscal Year-to Date) 3/12/2018 Table of Contents Section A Section B Section C Section D Section E
METRO Fiscal Year 2018 Monthly Performance Report Revenue Expense Ridership Performance (First Quarter Fiscal Year-to Date) 3/12/2018 Table of Contents Section A Section B Section C Section D Section E
Project Summary Project Name: Route 37 Corridor Safety Sweep Project Number:
 Project Summary This project summary page details the benefit cost analysis (BCA) for the Route 37 Corridor Safety Sweep Project. A BCA provides estimates of the anticipated benefits that are expected
Performance Management Accountability Meeting Data as of October, 2012
 Performance Management Accountability Meeting Data as of October, 2012 Richard A. Davey, Secretary & CEO Office of Performance Management and Innovation Celia J. Blue, Assistant Secretary November 27,
Southern California Association of Governments (SCAG) Metropolitan Planning Organization (AMPO) Annual Conference. Prepared for
 Metropolitan Planning Organization (AMPO) Annual Conference. Prepared for") Congestion Pricing Modeling and Results for Express Travel Choices Study Kazem Oryani and Cissy Kulakowski, CDM Smith Portland, Oregon, October 22 25, 2013 Prepared for Southern California Association
Congestion Pricing Modeling and Results for Express Travel Choices Study Kazem Oryani and Cissy Kulakowski, CDM Smith Portland, Oregon, October 22 25, 2013 Prepared for Southern California Association
Virginia Department of Education
 Virginia Department of Education Module Ten Transparencies Driver Responsibilities: Making Informed Choices Topic 1 -- Insuring Vehicle Topic 2 -- Purchasing Vehicle Topic 3 -- Trip Planning Topic 4 Virginia
COMPANY TARIFF FOR THE MOTOR VEHICLE LIABILITY INSURANCE Tariff Provisions (ITALY)
") COMPANY TARIFF FOR THE MOTOR VEHICLE LIABILITY INSURANCE Tariff Provisions (ITALY) 1. Scope of Application For insurance contracts in Motor Vehicle Liability Insurance of private motor vehicles admitted
COMPANY TARIFF FOR THE MOTOR VEHICLE LIABILITY INSURANCE Tariff Provisions (ITALY) 1. Scope of Application For insurance contracts in Motor Vehicle Liability Insurance of private motor vehicles admitted
Insurance and Location Intelligence
 Insurance and Location Intelligence Are We Ready Usage Based Insurance and Telematics for Motor Insurance Rajendra Tamhane Genesys International Indian Insurance Industry - Scenario India ranked 11th among
Benefit Cost Analysis for the San Juan Multi-Modal Transportation System: Infrastructure and Safety Improvements
 Benefit Cost Analysis for the San Juan Multi-Modal Transportation System: Infrastructure and Safety Improvements Final Submitted to: April 24, 2014 TABLE OF CONTENTS EXECUTIVE SUMMARY...3 INTRODUCTION...5
In addition to embarking on a new dialogue on Ohio s transportation priorities,
 Strategic Initiatives for 2008-2009 ODOT Action to Answer the Challenges of Today In addition to embarking on a new dialogue on Ohio s transportation priorities, the Strategic Initiatives set forth by
Monograph. Competitive Intelligence An Insurance Policy for Pricing Kathryn A. Walker, FCAS, MAAA, CPCU ABOUT THE AUTHOR KEY POINT
 Commitment Beyond Numbers Monograph pinnacleactuaries.com ABOUT THE AUTHOR Kathryn A. Walker FCAS, MAAA, CPCU Katey Walker is a Consulting Actuary with Pinnacle Actuarial Resources, Inc. in the firm s
METRO. Fiscal Year Monthly Performance Report. Revenue Expense Ridership Performance. May 2018 (Second Quarter Fiscal Year-to Date)
") METRO Fiscal Year 2018 Monthly Performance Report Revenue Expense Ridership Performance (Second Quarter Fiscal Year-to Date) 6/12/2018 Table of Contents Section A Section B Section C Section D Section
METRO Fiscal Year 2018 Monthly Performance Report Revenue Expense Ridership Performance (Second Quarter Fiscal Year-to Date) 6/12/2018 Table of Contents Section A Section B Section C Section D Section
ECONOMIC USE PATTERNS FOR ATLANTA S HOT LANES
 ECONOMIC USE PATTERNS FOR ATLANTA S HOT LANES A REPORT BY THE SOUTHERN ENVIRONMENTAL LAW CENTER The Southern Environmental Law Center (SELC) is a regional nonprofit organization engaged in environmental
APPENDIX E: ATM MODEL TECH MEMORANDUM. Metropolitan Council Parsons Brinckerhoff
 APPENDIX E: ATM MODEL TECH MEMORANDUM Metropolitan Council Parsons Brinckerhoff Metropolitan Highway System Investment Study Evaluation of Active Traffic Management Strategies Prepared by: Parsons Brinckerhoff
Identifying Driving Risk Factors to Support Usage-Based Insurance using Smartphone Personalized Driving Data
 Identifying Driving Risk Factors to Support Usage-Based Insurance using Smartphone Personalized Driving Data Yi-Chang Chiu 1, Yu-Luen Ma 2, Xianbiao Hu 3* 1 Associate Professor, Department of Civil Engineering
Topic Understanding Insurance
 UNIT 7 Making Major Financial Decisions Topic Understanding Insurance LEARNING OBJECTIVE(S) Students will: identify different types of insurance. explain factors that influence the price people pay for
KEY MARKET TRENDS F O R J A N U A R Y 1 7,
 KEY MARKET TRENDS F O R 2 0 1 8 J A N U A R Y 1 7, 2 0 1 8 While economic growth has been anemic in this expansion, momentum is picking up 1948 1949 1950 1951 1952 1953 1954 1955 1956 1957 1958 1959 1960
Older Workers and the Gig Economy
 Older Workers and the Gig Economy By Cody Cook, Rebecca Diamond, and Paul Oyer Given the serious demographic challenges pending in most developed countries, keeping older people working longer seems likely
BUSINESS POLICIES AND PROCEDURES MANUAL Revised Motor Pool
 BUSINESS POLICIES AND PROCEDURES MANUAL TRAVEL 95.35.1 OVERVIEW provides vehicles to authorized WSU faculty, staff, and students who travel on WSU business. provides vehicles for WSU Pullman and some non-pullman
Examples of Vehicle Use Policies
 Municipal Technical Advisory Service Examples of Vehicle Use Policies August 20, 2013 Option 1 USE OF CITY PROPERTY/CITY VEHICLES It is the policy of the City that certain positions require employee access
Wednesday, June 6, 2018
 Wednesday, June 6, 2018 Excellence in Program Administration Award 2018 AASHTO Civil Rights Training Symposium Excellence in Program Administration Award Joanna McFadden EEO/DBE Section Head APRIL 2017-2018
Requirements for Driving Vehicles for University Business
 7.10.1 OVERVIEW This section provides policies and procedures on the following topics regarding the use of vehicles for official University business: Authorization Definitions Requirements for use of all
August 31, 2016 Financial Report
 August 31, 2016 Financial Report Capital Metropolitan Transportation Authority 10/14/2016 Table of Contents SUMMARY REPORTS Budgetary Performance - Revenue 2 - Sales Tax Revenue 6 - Operating Expenses
Regional Travel Study
 PSRC S Regional Travel Study 1999 KEY COMPARISONS OF 1999,, AND TRAVEL SURVEY FINDINGS Puget Sound Regional Council JUNE 2015 PSRC S Regional Travel Study / JUNE 2015 Funding for this document provided
SEMA INDUSTRY INDICATORS
 SEMA INDUSTRY INDICATORS SEPTEMBER 2018 The U.S. economy is looking good as we head into September. August brought another solid month of job gains - adding 201,000 new jobs during the month. The economy
SEMA INDUSTRY INDICATORS
 SEMA INDUSTRY INDICATORS Economic data strengthened over the last month. The employment report led the way, but across the board incoming economic data was firm, setting up what could be an extremely strong
FY 2015 SECOND QUARTER REVENUE UPDATE, CURRENT ECONOMIC OUTLOOK & FY GENERAL REVENUE FORECAST
 FY 2015 SECOND QUARTER REVENUE UPDATE, CURRENT ECONOMIC OUTLOOK & FY 2016-2020 GENERAL REVENUE FORECAST Michelle L. Attreed Director of Finance February 17, 2015 Proposed FY2016-2020 General Revenue Forecast-
95 Express Monthly Operations Report January 2018
 95 Express Operations Report January 218 95 Express currently has three dynamicallypriced tolling segments in each direction. Segment 1 is in MiamiDade County from just north of SR 836 to the Golden Glades
Guidelines for Car Rentals
 Guidelines for Car Rentals Policy In accordance with Disbursement Policy #5.10 travelers may rent vehicles for advancement purposes, as necessary to accomplish the missions of UFF or UFAA. Enterprise and
BUDGETWATCH April 2019 Flash Report
 April 2019 Flash Report Overall Latest Condition (reporting on operations through March and subsidies through April): Due to the early scheduling of the Finance Committee meeting, first-close preliminary
Pendragon Vehicle Management Tax Guide
 Pendragon Vehicle Management Tax Guide W2667 10.2017 2 Pendragon Vehicle Management Tax Guide. The team at Pendragon Vehicle Management have put together this comprehensive tax guide, pulling personal
Strategic Plan Progress Report Goal 2 Focus. July 2015 San Francisco, California
 Strategic Plan Progress Report Goal 2 Focus July 2015 San Francisco, California 1 Goal 2 focus Make transit, walking, bicycling, taxi, ridesharing and carsharing the preferred means of travel Objective
Aviva Telematics Car Insurance Terms and Conditions.
 Aviva Telematics Car Insurance Terms and Conditions. Overview The purpose of this document is to provide you with an overview of your telematics smart box including data collection and processing. You
The Value of Metrorail and Virginia Railway Express to the Commonwealth of Virginia
 The Value of Metrorail and Virginia Railway Express to the Commonwealth of Virginia Dan Goldfarb, PE Mid-Colonial District Annual Conference Philadelphia, PA April, 17, 2018 The Commission NVTC Jurisdictions:
SEMA INDUSTRY INDICATORS
 SEMA INDUSTRY INDICATORS FEB 2018 The overall economy clocked growth of 2.6 percent in the final quarter of 2017. While this is below growth realized in the prior two quarters of 2017, the year closed
Quarterly Financial Review
 First Quarter 2014 Quarterly Financial Review Norfolk Southern Corporation Finance Department Three Commercial Place Norfolk, Virginia 23510.2191 Norfolk Southern Railway System Contents Consolidated Statements
SEMA INDUSTRY INDICATORS
 SEMA INDUSTRY INDICATORS JULY 2018 The first half of 2018 is now in the books and the economy has shown resilience in the face of a myriad of concerns. These fears have included low overall economic growth
TRAVEL FORM NOTICE: Page 1
 TRAVEL FORM NOTICE: Airline tickets are non-refundable/non-transferable. Any changes to tickets, which result in any additional cost is your responsibility. Please plan your trip accordingly, and ensure
Instructions for Form 2106
 2013 Instructions for Form 2106 Employee Business Expenses Department of the Treasury Internal Revenue Service Section references are to the Internal Revenue Code unless otherwise noted. Future Developments
Don t Let Your Fleet Fleece You! The elements of an effective fleet program
 Don t Let Your Fleet Fleece You! The elements of an effective fleet program Who is on the Panel? Steve Heckle Director, Risk Management LKQ Corporation James O Dell, CPCU Senior Vice President Willis Why
Government Policy Statement on land transport 2018 release for public engagement
 In Confidence Office of the Minister of Transport Chair, Cabinet Economic Development Committee Government Policy Statement on land transport 2018 release for public engagement Proposal 1. This paper seeks
Roundtable on Income Equality, Social Inclusion and Mobility OECD Paris
 National Issues in the USA in Economic Development, Mobility and Income Inequality Roundtable on Income Equality, Social Inclusion and Mobility OECD Paris April 4,5 2016 Intent of this Paper This paper
Private Passenger Auto Insurance Trends in Georgia
 Private Passenger Auto Insurance Trends in Georgia Frequency & Severity on the Rise Georgia House Insurance Committee Atlanta, GA January 11, 2017 Download at www.iii.org/presentations Robert P. Hartwig,
METRO. Fiscal Year 2015 Monthly Board Report. February 2015
 METRO Fiscal Year 2015 Monthly Board Report Revenue Expense Ridership Performance 4/2/2015 Table of Contents Section A Section B Section C Section D Section E Section F Section G Section H Section I Section