SP500 GICS Level 1 Sectors verses SP500 - Data from Bloomberg
|
|
|
- Prosper Baker
- 6 years ago
- Views:
Transcription


1 AUTHOR

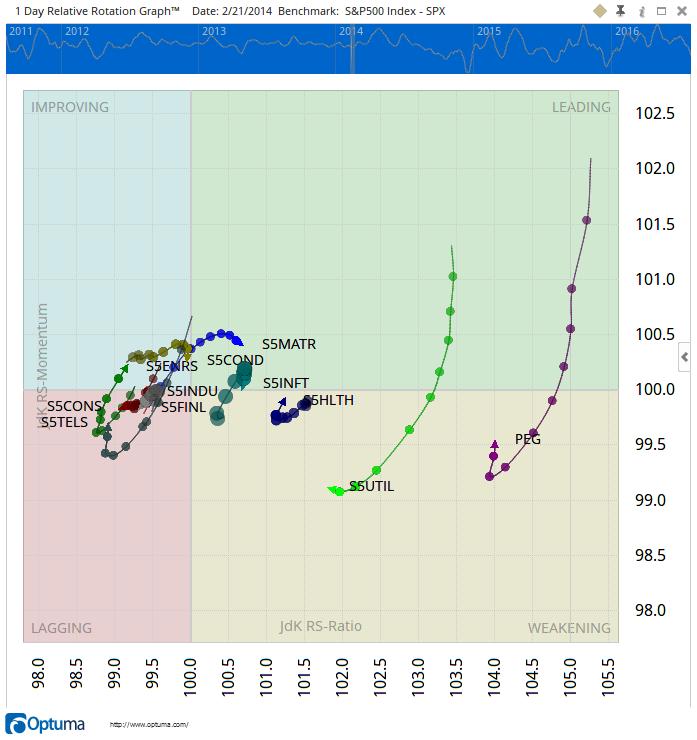
2 Since I was introduced to Relative Rotation Graphs, I have been constantly playing with them and trying to see how they can give me insights into what is happening in the market. I love looking at different Asset Classes, Currencies and Portfolios. My favourite group however will always be the SP500 GICS Level 1 sectors with the SP500 as the benchmark, because I know that the total of the ten sectors must be fully encompassed by the benchmark. The ten sectors embody all the elements that can contribute to the SP500 itself. When I look at the RRG, which measures trends in relative performance of each Sector against the Index, there has to be balance in each of the axis. SP500 GICS Level 1 Sectors verses SP500 - Data from Bloomberg Consider Figure 1; we can see the ten sectors based on their relative strength against the SP500. An immediate stand out is the Utilities (S5UTIL) way out on its own on the right (the tail shows us where it has been) while there is a group of 2


 and the positive distances and we")
3 sectors clustering on the left. Based on what I was saying before, if these ten embody all that contributes to the Index, and we consider the Index to be the very centre of the chart, we can theorise that all the sectors have to be balanced around that point. If that is true, it has to follow mathematical rules as we are dealing with what can only be described as a closed universe (no other stocks are contributing to the index). We can see that there is a group of six sectors on the left side of the vertical 100 line, that s like a group of children on one side of a seesaw while less are sitting on the right side. Figure 2 shows that to have balance it is only possible if the bigger group of children is closer to the apex than the lone child (L2 is smaller than Lend). If we are to have balance in the RRG, then we should see something similar. As an exercise to check that we have balance, we can sum up all the negative distances from the apex (100) and the positive distances and we would expect them to be equal if it is a balanced universe. I ve done this in a Watchlist in Figure 3. We list the RRG Ratio and then the distance that ratio is from 100. By adding groups to the Watchlist based on the Sign of the From 100 column, the totals we get for the left side (negative numbers) is 4.1 and on the right side (positive numbers) 4.4! Hang on, that s not balanced, we have a 7.3% discrepancy between the left and the right sides! 3
.")

4 SP500 Sectors with RRG Ratio and distance from 100 There is another aspect to the seesaw example that I have not been considering and I believe that it is a fundamental oversight in some Intermarket Analysis theories based on sectors (I ll come back to that later on). The missing element may be obvious to you, but it took me a little bit of thinking to work out why the two sides were not matching. The issue was that I had always considered the ten sectors to be equal weighted, but obviously that is not the case. Again in our seesaw example, have a look at Figure 2, you can see that the one child on his own is bigger than the 2, so not only do we need to factor in the distance from the apex but also the weight of each child (sector). How do we do that? Fortunately, if you are using a data source like Bloomberg, we can fuse in the fundamental Market Cap of each Sector as an External Data Field and then put that into a formula to get the weight of each. Here is the formula I used to work out the sector weight as a percentage of the Sector Market Cap verses the total SP500 Market Cap. 4

; (MC1 / MCBM1)")


5 MC1=DATAFIELD(FIELD=CUR_MKT_CAP); MCBM1 = DATAFIELD(GETDATA(CODE=SPX:BLMB), FIELD=CUR_MKT_CAP); (MC1 / MCBM1) * 100 Let s have a look at this on the RRG Chart by setting our script to define the size of the Bubbles on the RRG. See Figure 4, bigger bubbles means bigger weight. 5
 and Information Technology (S5INFT) are the 300 pound gorillas of the SP500.")
6 We can see that Utilities is a featherweight, making up just 2.9% of the total index. It can get a long way from the origin since it is so light. This chart also shows that Financials (S5FINL in the cluster on the left) and Information Technology (S5INFT) are the 300 pound gorillas of the SP500. Now we need to include the weights in all of our calculations. All we need to do is simply add up the product of the weight with the distance to get a variable that we will call Force. Let s do that in the Watchlist. SP500 Sectors with weight and force. In Figure 5, you can see the weights of each sector. The last column in Figure 5 is Force which is the product of the Weight of the Sector with the distance of the RRG Ratio from the 100 apex. The sums for this become on the left side and on the right. Now that s more like it! That s a variance of 0.18% compared to 7.3% in the unweighted case. The script for the Force column is: MC1=DATAFIELD(FIELD=CUR_MKT_CAP); MCBM1 = DATAFIELD(GETDATA(CODE=SPX:BLMB), FIELD=CUR_MKT_CAP); RRG1 = JDKRS(INDEX=SPX:BLMB) 100; ((MC1 / MCBM1) * 100) * RRG1 6


7 The result of this is that we have been able to show that the GICS Level 1 sectors are balanced in a RRG but only when we consider their relative weights. Yahoo, high 5 s all around! That s great from a theoretical point of view, but how can we use that information? For the most part there are a couple of key lessons that we can take away from this: First, when we do Intermarket Analysis based on sectors, we cannot consider all the sectors to be equal because clearly they are not. The heavier sectors will exert more torque the further away from the apex they are (now that will make an interesting study). In fact, examining historical sector rotations and extrapolating to today can actually be dangerous because the environment is so different. It s like believing that you can throw your twenty-two year old son in the air because you did it when he was two! Let s look at the situation twenty years ago as an example. 7
8 In Figure 6 we can see that Industrials and Consumer Discretionary are the biggest at 15% and 16% respectively. In fact, the spread between all the sectors is more evenly spread, with the smallest sector being Utilities at 6%. So at that time, with a smaller difference between Sectors, we could almost ignore the weights and treat them as equals and apply all the theories and see them hold. Today I don t think we have that luxury. Am I saying that Intermarket Analysis should be thrown out? Not at all! It is still extremely important, in particular in determining when a sector will cease to be the outperformer. I am simply suggesting that there is another dimension that needs to be considered as part of the analysis. There is more research that will need to be undertaken in this area. The other big take away that impacts Portfolio Selection is that if my goal is to gain alpha over the Index, then I simply must consider the weights as part of my selections. Back to the seesaw, by virtue of his weight, to have balance the largest child cannot move too far away from the apex of the seesaw. In the same way, the largest sector (or equity in a portfolio) cannot move far from an Index (average of the portfolio) that it is contributing to. The further it moves away, the more it effects the value of the Index, dragging the Index with it. The only exception to this is when one large sector is moving in one direction and there is another large sector moving the opposite direction, maintaining the balance across the chart. That in itself presents a fantastic pairs trading opportunity, but I digress. If I want to achieve alpha, I need a base of the heaviest sectors at weight, and then layer in the lighter sectors that are improving by going overweight on them. Since securities in the RRG tend to rotate in a clockwise fashion, when we are looking for Long-only opportunities, we are looking for securities in the chart that are moving from the negative quadrants with enough velocity to break through (watch for another Optuma Whitepaper on the Physics parallels of RRG). Now that we are considering weight too, we can make some decisions on position sizing by going overweight on the lighter sectors since we know that they have the greatest capacity to move a long way from the index without dragging the index along. Obviously that can happen in both positive and negative directions, so they do present the greatest risk too. On the 16 th Jan 2014, Utilities (The only item showing the arrow in the RRG chart) was in one of the perfect RRG positions. At this point the trend of its relative performance is improving and the trajectory is showing a lot of promise. The space 8

.")


9 between the observations (the dots) being wide shows good velocity which gives confidence that it will continue on that path. The chart on the right of Figure 7 has a vertical black line corresponding to the selected date of the RRG chart (January 16 th ). We have identified the sector that we are interested in, the next step is to drill into the Utilities to see what selections we can make from the sector. When we do this we need to make a choice if we are going to keep SP500 as the benchmark, or now look at each of the stocks compared to the Utilities sector Index. I prefer the latter as I am still interested in the weights of each stock as a percentage of that sector s index and to take that same selection philosophy into the Sector. By doing this I can look for low weighted stocks that have the greatest ability to give me significant gains over the index. 9


10 Figure 9 shows the results with weights of each stock compared to the weight of the Sector. Utilities Sector Members When I look at Figure 9, the best opportunity that I see is PEG, it is in the top left quadrant, and even though there was a bit of a wobble, it is heading in the right direction and has low weight (3.3%). It is at this point that I would be opening up the chart of PEG and confirming with my other analysis techniques if I am satisfied. Figure 10 shows the performance of the stock since the 16 th (Black Line). 10


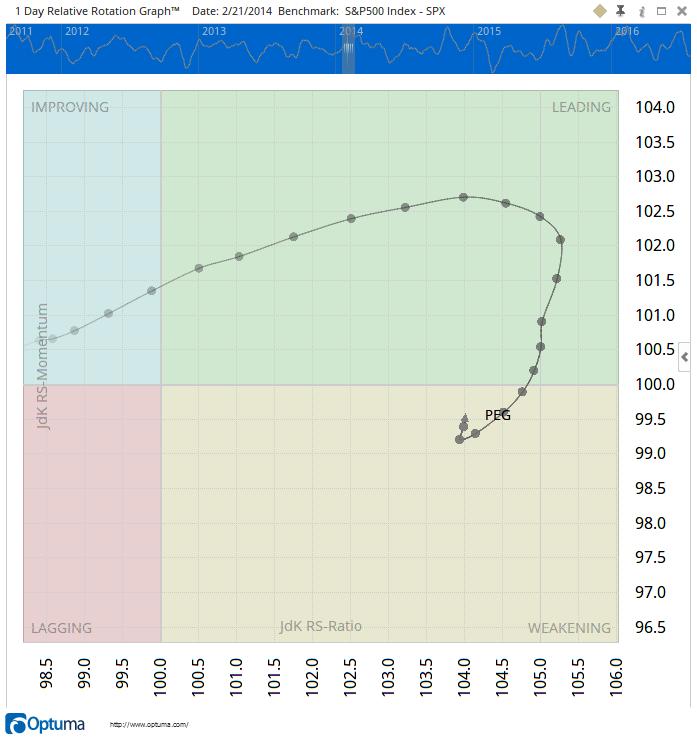
11 If we fast forward to today (21 st Feb 2014) and then remove all the other securities from the RRG, let s have a look at PEG in Figure 11. I have also increased the tail length of PEG so I can see the path that it took through the RRG. PEG out-performed as expected and even though the trend is starting to weaken, it is still very positive compared to S5UTIL Index. The little hook tells me that there may be more in store. The RRG successfully assisted me in finding a great trade. It is always interesting to bring this back to the SP500 and see how the performance has been against the Index (particularly if the SP500 is my Benchmark). Remember in Figure 1 that Utilities was out on its own? Let s contrast that to PEG by adding PEG to that same RRG in Figure 12. We can see that PEG outperformed the SP500 by more than the Utilities Sector but it has the same general shape as the Utilities. This makes sense since PEG was the best relative trending stock in the best relative trending Sector. The ability to drill in and make these selections is a powerful advantage for anyone who needs to make selections like these. We need to see how this performed on an absolute basis, so let s open the three (SPX, S5UTIL & PEG) in a Relative Comparison Chart (see Figure 13). 11


12 12


13 We can see in absolute terms that PEG out performed S5UTIL which in turn out performed the SPX. All of this was anticipated by finding the sector with the highest probability of outperforming and then within that sector finding the stock that has the highest probability of outperforming. As with all strategies in the market, you need to test these for yourself to have confidence in them. No technique is a guarantee of success and standard trade management rules must be employed. This paper is merely presenting that RRG coupled with weights can give a different perspective in understanding both Intermarket Analysis and Portfolio Selection. If you do not have access to these charts and would like to try them for yourself, contact one of our Optuma offices and we d be happy to help you set up a trial account so you can experiment with these charts. About Optuma We are passionate about financial analysis using all techniques and models. Optuma has been designed to be the ultimate analysis solution for anyone who wants to gain insights into financial markets. RRGs in Optuma have capabilities not found anywhere else including real time RRG, FX RRG and the ability to link price charts to RRGs. More Information at 13
Portfolio Alpha from Relative Strength An Introduction to Relative Rotation Graphs By Mathew Verdouw, CMT
 Portfolio Alpha from Relative Strength An Introduction to Relative Rotation Graphs By Disclaimer NO FINANCIAL ADVICE - The Information in this presentation is provided for education and informational purposes
Relative Rotation Graphs (RRG Charts)
") Relative Rotation Graphs (RRG Charts) Introduction Relative Rotation Graphs or RRGs, as they are commonly called, are a unique visualization tool for relative strength analysis. Chartists can use RRGs
Relative Rotation Graphs (RRG Charts) Introduction Relative Rotation Graphs or RRGs, as they are commonly called, are a unique visualization tool for relative strength analysis. Chartists can use RRGs
Buying out performers is too late
 Buying out performers is too late Mathew Verdouw, CMT, CFTe August 2016 ABSTRACT We are told two rules in finance: Buy Low and Sell High and also Past Performance is not a guarantee of Future Returns.
Benchmarking. Club Fund. We like to think about being in an investment club as a group of people running a little business.
 Benchmarking What Is It? Why Do You Want To Do It? We like to think about being in an investment club as a group of people running a little business. Club Fund In fact, we are a group of people managing
I Always Come Back To This One Method
 I Always Come Back To This One Method I can attribute my largest and most consistent gains to this very method of trading, It always work and never fails although I ve been known to still screw it up once
Chapter 6: Supply and Demand with Income in the Form of Endowments
 Chapter 6: Supply and Demand with Income in the Form of Endowments 6.1: Introduction This chapter and the next contain almost identical analyses concerning the supply and demand implied by different kinds
Square Timer v3.5.x Users Guide
 Square Timer v3.5.x Users Guide The Square Timer program, also called SQT, is a very useful program for the purpose of time/price squaring. W. D. Gann determined decades ago that there was a mathematical
On one of the feet? 1 2. On red? 1 4. Within 1 of the vertical black line at the top?( 1 to 1 2
 Continuous Random Variable If I spin a spinner, what is the probability the pointer lands... On one of the feet? 1 2. On red? 1 4. Within 1 of the vertical black line at the top?( 1 to 1 2 )? 360 = 1 180.
Terminology. Organizer of a race An institution, organization or any other form of association that hosts a racing event and handles its financials.
 Summary The first official insurance was signed in the year 1347 in Italy. At that time it didn t bear such meaning, but as time passed, this kind of dealing with risks became very popular, because in
Active or passive? Tips for building a portfolio
 Active or passive? Tips for building a portfolio Jim Nelson: Actively managed funds or passive index funds? It s a common question that many investors and their advisors confront during portfolio construction.
Hedge Fund Returns: You Can Make Them Yourself!
 ALTERNATIVE INVESTMENT RESEARCH CENTRE WORKING PAPER SERIES Working Paper # 0023 Hedge Fund Returns: You Can Make Them Yourself! Harry M. Kat Professor of Risk Management, Cass Business School Helder P.
If you are over age 50, you get another $5,500 in catch-up contributions. Are you taking advantage of that additional amount?
 Let s start this off with the obvious. I am not a certified financial planner. I am not a certified investment counselor. Anything I know about investing, I ve learned by making mistakes, not by taking
PennyStockProphet.com:
 PennyStockProphet.com: Everything You Need To Know Before Investing In Micro Cap Stocks By James Connelly A.K.A. The Penny Stock Prophet www.pennystockprophet.com Getting Started Investing In Micro-Cap
ECO155L19.doc 1 OKAY SO WHAT WE WANT TO DO IS WE WANT TO DISTINGUISH BETWEEN NOMINAL AND REAL GROSS DOMESTIC PRODUCT. WE SORT OF
 ECO155L19.doc 1 OKAY SO WHAT WE WANT TO DO IS WE WANT TO DISTINGUISH BETWEEN NOMINAL AND REAL GROSS DOMESTIC PRODUCT. WE SORT OF GOT A LITTLE BIT OF A MATHEMATICAL CALCULATION TO GO THROUGH HERE. THESE
Lecture 16: Estimating Parameters (Confidence Interval Estimates of the Mean)
") Statistics 16_est_parameters.pdf Michael Hallstone, Ph.D. hallston@hawaii.edu Lecture 16: Estimating Parameters (Confidence Interval Estimates of the Mean) Some Common Sense Assumptions for Interval Estimates
Statistics 16_est_parameters.pdf Michael Hallstone, Ph.D. hallston@hawaii.edu Lecture 16: Estimating Parameters (Confidence Interval Estimates of the Mean) Some Common Sense Assumptions for Interval Estimates
27PercentWeekly. By Ryan Jones. Part II in the Series Start Small and Retire Early Trading Weekly Options
 By Ryan Jones Part II in the Series Start Small and Retire Early Trading Weekly Options Important My 27% Option Strategy is one of the best option trading opportunities you will come across. When you see
Section 7C Finding the Equation of a Line
 Section 7C Finding the Equation of a Line When we discover a linear relationship between two variables, we often try to discover a formula that relates the two variables and allows us to use one variable
Introduction to the Gann Analysis Techniques
 Introduction to the Gann Analysis Techniques A Member of the Investment Data Services group of companies Bank House Chambers 44 Stockport Road Romiley Stockport SK6 3AG Telephone: 0161 285 4488 Fax: 0161
An Intro to Sharpe and Information Ratios
 An Intro to Sharpe and Information Ratios CHART OF THE WEEK SEPTEMBER 4, 2012 In this post-great Recession/Financial Crisis environment in which investment risk awareness has been heightened, return expectations
Portfolio Analysis with Random Portfolios
 pjb25 Portfolio Analysis with Random Portfolios Patrick Burns http://www.burns-stat.com stat.com September 2006 filename 1 1 Slide 1 pjb25 This was presented in London on 5 September 2006 at an event sponsored
Insights from Morningstar COPYRIGHTED MATERIAL
 Insights from Morningstar COPYRIGHTED MATERIAL Lesson 301: The Fat-Pitch Strategy All I can tell them is pick a good one and sock it. Babe Ruth In baseball, a batter who watches three pitches go past
Compiled by Timon Rossolimos
 Compiled by Timon Rossolimos - 2 - The Seven Best Forex Indicators -All yours! Dear new Forex trader, Everything we do in life, we do for a reason. Why have you taken time out of your day to read this
Developmental Math An Open Program Unit 12 Factoring First Edition
 Developmental Math An Open Program Unit 12 Factoring First Edition Lesson 1 Introduction to Factoring TOPICS 12.1.1 Greatest Common Factor 1 Find the greatest common factor (GCF) of monomials. 2 Factor
VARIABILITY: Range Variance Standard Deviation
 VARIABILITY: Range Variance Standard Deviation Measures of Variability Describe the extent to which scores in a distribution differ from each other. Distance Between the Locations of Scores in Three Distributions
Should Physicians REPAYE?
 Should Physicians REPAYE? [Editor s Note: This is a guest post from blog advertiser and student loan expert Jan Miller, President of Student Loan Consultant. He offers fee-only advice about your student
TABLE OF CONTENTS C ORRELATION EXPLAINED INTRODUCTION...2 CORRELATION DEFINED...3 LENGTH OF DATA...5 CORRELATION IN MICROSOFT EXCEL...
 Margined Forex trading is a risky form of investment. As such, it is only suitable for individuals aware of and capable of handling the associated risks. Funds in an account traded at maximum leverage
Explaining risk, return and volatility. An Octopus guide
 Explaining risk, return and volatility An Octopus guide Important information The value of an investment, and any income from it, can fall as well as rise. You may not get back the full amount they invest.
The figures in the left (debit) column are all either ASSETS or EXPENSES.
 column are all either ASSETS or EXPENSES.") Correction of Errors & Suspense Accounts. 2008 Question 7. Correction of Errors & Suspense Accounts is pretty much the only topic in Leaving Cert Accounting that requires some knowledge of how T Accounts
Correction of Errors & Suspense Accounts. 2008 Question 7. Correction of Errors & Suspense Accounts is pretty much the only topic in Leaving Cert Accounting that requires some knowledge of how T Accounts
10 Errors to Avoid When Refinancing
 10 Errors to Avoid When Refinancing I just refinanced from a 3.625% to a 3.375% 15 year fixed mortgage with Rate One (No financial relationship, but highly recommended.) If you are paying above 4% and
Key Takeaways. Global Investment Strategy Technical Strategy Briefing. U.S. Dollar Index. S&P 500 Index. Chart of the Week. Crude Oil.
 Global Investment Strategy Technical Strategy Briefing July 10, 2017 Sameer Samana, CFA Global Quantitative and Technical Strategist Key Takeaways S&P 500 Index The S&P 500 Index has broken out and remains
Intro to Trading Volatility
 Intro to Trading Volatility Before reading, please see our Terms of Use, Privacy Policy, and Disclaimer. Overview Volatility has many characteristics that make it a unique asset class, and that have recently
GRAPHS IN ECONOMICS. Appendix. Key Concepts. Graphing Data
 Appendix GRAPHS IN ECONOMICS Key Concepts Graphing Data Graphs represent quantity as a distance on a line. On a graph, the horizontal scale line is the x-axis, the vertical scale line is the y-axis, and
RESPs and Other Ways to Save
 for Indigenous Peoples Workbook 4 RESPs and Other Ways to Save Copyright 2017 ABC Life Literacy Canada First published in 2016 by ABC Life Literacy Canada All rights reserved. ABC Life Literacy Canada
Spring Budget IFS Director Paul Johnson s opening remarks
 Spring Budget 2017 IFS Director Paul Johnson s opening remarks Spring Budgets seem to be going out with something of a whimper. Yesterday s was one of the smallest I can remember in pretty much every dimension
The Dollar And Prospective Treasury Returns
 The Dollar And Prospective Treasury Returns The philosopher George Santayana once said something profound, but who can remember it anymore with all the blogging, texting and tweeting? The author wrote
spin-free guide to bonds Investing Risk Equities Bonds Property Income
 spin-free guide to bonds Investing Risk Equities Bonds Property Income Contents Explaining the world of bonds 3 Understanding how bond prices can rise or fall 5 The different types of bonds 8 Bonds compared
Forex Scalping CHEAT SHEETS. By Jason Fielder
 Forex Scalping CHEAT SHEETS By Jason Fielder 1 Fellow trader, If you are currently scalping FX markets (or are planning to), there are certain universal rules that you simply need to know to survive. Beyond
The purpose of this paper is to briefly review some key tools used in the. The Basics of Performance Reporting An Investor s Guide
 Briefing The Basics of Performance Reporting An Investor s Guide Performance reporting is a critical part of any investment program. Accurate, timely information can help investors better evaluate the
MA 1125 Lecture 05 - Measures of Spread. Wednesday, September 6, Objectives: Introduce variance, standard deviation, range.
 MA 115 Lecture 05 - Measures of Spread Wednesday, September 6, 017 Objectives: Introduce variance, standard deviation, range. 1. Measures of Spread In Lecture 04, we looked at several measures of central
How To Win With Money
 By: Joseph Sangl We re passionate about helping YOU win with your money. In this series, we are going to be talking about a practical, step-by-step plan that you can use to take your finances to the stratosphere!
HPLR Cash Machine. By A.J. Brown.
 By A.J. Brown www.secretoftrading.com RISK DISCLOSURE STATEMENT / DISCLAIMER AGREEMENT Trading any financial market involves risk. This report and all and any of its contents are neither a solicitation
JOHN MORIKIS: SEAN HENNESSY:
 JOHN MORIKIS: You ll be hearing from Jay Davisson, our president of the Americas Group, Cheri Pfeiffer, our president of our Diversified Brands Division, Joel Baxter, our president of our Global Supply
Club Accounts - David Wilson Question 6.
 Club Accounts - David Wilson. 2011 Question 6. Anyone familiar with Farm Accounts or Service Firms (notes for both topics are back on the webpage you found this on), will have no trouble with Club Accounts.
Now You Can Have These Trading Gems- Free!
 Presents Killer Patterns Now You Can Have These Trading Gems- Free! The Trading Info Revealed Here is not the Same as the Proven WizardTrader.com Methods But Works Well With Them 1 Copyright Information
Theory of Consumer Behavior First, we need to define the agents' goals and limitations (if any) in their ability to achieve those goals.
 in their ability to achieve those goals.") Theory of Consumer Behavior First, we need to define the agents' goals and limitations (if any) in their ability to achieve those goals. We will deal with a particular set of assumptions, but we can modify
Theory of Consumer Behavior First, we need to define the agents' goals and limitations (if any) in their ability to achieve those goals. We will deal with a particular set of assumptions, but we can modify
Short Selling Stocks For Large And Fast Profits. By Jack Carter
 Short Selling Stocks For Large And Fast Profits By Jack Carter 2017 Disclaimer: No financial advice is given or implied. Publisher is not registered investment advisor or stockbroker. Information provided
Math 1526 Summer 2000 Session 1
 Math 1526 Summer 2 Session 1 Lab #2 Part #1 Rate of Change This lab will investigate the relationship between the average rate of change, the slope of a secant line, the instantaneous rate change and the
Finance 527: Lecture 35, Psychology of Investing V2
 Finance 527: Lecture 35, Psychology of Investing V2 [John Nofsinger]: Welcome to the second video for the psychology of investing. In this one, we re going to talk about overconfidence. Like this little
Contents: Top 40 Chart ; Currency ; Charts of Interest ; Scatter Graph ; Relative Rotation Graph ; Stats. Top 40 Chart
 Contents: Top 40 Chart ; Currency ; Charts of Interest ; Scatter Graph ; Relative Rotation Graph ; Stats Top 40 Chart 1 Last week we saw the Top 40 approaching some moving average resistances, we have
Risk-Based Performance Attribution
 Risk-Based Performance Attribution Research Paper 004 September 18, 2015 Risk-Based Performance Attribution Traditional performance attribution may work well for long-only strategies, but it can be inaccurate
Magic Line Trading System. A Simple, Easy-To-Learn Price-Action Trading Strategy
 Magic Line Trading System A Simple, Easy-To-Learn Price-Action Trading Strategy 1. Disclaimer... 3 2. Introduction... 4 3. Trading as a career... 6 4. Getting started... 8 5. Setting up your charts...
Seven Trading Mistakes to Say Goodbye To. By Mark Kelly KNISPO Solutions Inc.
 Seven Trading Mistakes to Say Goodbye To By Mark Kelly KNISPO Solutions Inc. www.knispo.com Bob Proctor asks people this question - What do you want, what do you really want? In regards to stock trading,
Characterization of the Optimum
 ECO 317 Economics of Uncertainty Fall Term 2009 Notes for lectures 5. Portfolio Allocation with One Riskless, One Risky Asset Characterization of the Optimum Consider a risk-averse, expected-utility-maximizing
SIMPLE SCAN FOR STOCKS: FINDING BUY AND SELL SIGNALS
 : The Simple Scan is The Wizard s easiest tool for investing in stocks. If you re new to investing or only have a little experience, the Simple Scan is ideal for you. This tutorial will cover how to find
Top Down Analysis Success Demands Singleness of Purpose
 Chapter 9 Top Down Analysis Success Demands Singleness of Purpose Armed with a little knowledge about the stock and options market as well as a desire to trade, many new traders are faced with the daunting
Chris Capre, Founder - Second Skies
 Getting an Edge Learn What to Pay Attention to and How Things Work in the Forex Market If you've read Jack Schwager's 'The New Market Wizards,' he finds there are three things the best of the best traders
Exploiting the Inefficiencies of Leveraged ETFs
 Exploiting the Inefficiencies of Leveraged ETFs [Editor s Note: Here at WCI we try to keep things as simple as possible, most of the time. Not today though. Today we re going to be discussing leveraged
2.0. Learning to Profit from Futures Trading with an Unfair Advantage! Income Generating Strategies Essential Trading Tips & Market Insights
 2.0 Learning to Profit from Futures Trading with an Unfair Advantage! Income Generating Strategies Essential Trading Tips & Market Insights Income Generating Strategies Essential Trading Tips & Market
How Much Profits You Should Expect from Trading Forex
 How Much Profits You Should Expect from Trading Roman Sadowski Trading forex is full of misconceptions indeed. Many novice s come into trading forex through very smart marketing techniques. These techniques
Maybe you can see through my eyes well, maybe I can try to show you what I see through my eyes.
 Tips for Traders 12/8/2008 11:07:00 AM Seeing Through the Eyes of a Professional Trader I have been a professional trader now for more than 37 years. I think I have seen just about everything there is
Math 1314 Week 6 Session Notes
 Math 1314 Week 6 Session Notes A few remaining examples from Lesson 7: 0.15 Example 17: The model Nt ( ) = 34.4(1 +.315 t) gives the number of people in the US who are between the ages of 45 and 55. Note,
RELATIVE ROTATION GRAPHS USER GUIDE
 RELATIVE ROTATION GRAPHS USER GUIDE RELATIVE ROTATION GRAPHS USER GUIDE A Relative Rotation Graph (RRG TM ) provides a visual presentation of how a group of securities are performing relative to a selected
2c Tax Incidence : General Equilibrium
 2c Tax Incidence : General Equilibrium Partial equilibrium tax incidence misses out on a lot of important aspects of economic activity. Among those aspects : markets are interrelated, so that prices of
You know when I first got into trading his was the question that plagued me most. What direction is the trend really in????
 The trend the trend oh where art thow trend? You know when I first got into trading his was the question that plagued me most. What direction is the trend really in???? I mean let s face it; we pull up
Risk and Return and Portfolio Theory
 Risk and Return and Portfolio Theory Intro: Last week we learned how to calculate cash flows, now we want to learn how to discount these cash flows. This will take the next several weeks. We know discount
This is the complete: Fibonacci Golden Zone Strategy Guide
 This is the complete: Fibonacci Golden Zone Strategy Guide In this strategy report, we are going to share with you a simple Fibonacci Trading Strategy that uses the golden ratio which is a special mathematical
TRADING ADDICTS. Lesson 3: Timing and Technical Indicators. Timing the Market. Copyright 2010, Trading Addicts, LLC. All Rights Reserved
 Lesson 3: Timing and Technical Indicators In this chapter, we will be focusing on the timing of the trade, from each individual angle. Timing plays a critical role in a Covered Call strategy, as it can
The Hard Lessons of Stock Market History
 The Hard Lessons of Stock Market History The Lessons of Stock Market History If you re like most people, you believe there s a great deal of truth in the old adage that history tends to repeats itself
Script Raising Private Money from People You Know. For Students Just Getting Started in Real Estate Investing
 (Page 1 of 6) FFA = Friends, Family members, or Associate(s) Your FFA Answers the Phone Live: FFA: Hi, (Name of FFA), this is (Student Name). Did I catch you at a good time? I wanted to run something by
Probability. An intro for calculus students P= Figure 1: A normal integral
 Probability An intro for calculus students.8.6.4.2 P=.87 2 3 4 Figure : A normal integral Suppose we flip a coin 2 times; what is the probability that we get more than 2 heads? Suppose we roll a six-sided
An Interview with Renaud Laplanche. Renaud Laplanche, CEO, Lending Club, speaks with Growthink University s Dave Lavinsky
 An Interview with Renaud Laplanche Renaud Laplanche, CEO, Lending Club, speaks with Growthink University s Dave Lavinsky Dave Lavinsky: Hello everyone. This is Dave Lavinsky from Growthink. Today I am
INVESTMENTS. The M&G guide to. bonds. Investing Bonds Property Equities Risk Multi-asset investing Income
 INVESTMENTS The M&G guide to bonds Investing Bonds Property Equities Risk Multi-asset investing Income Contents Explaining the world of bonds 3 Understanding how bond prices can rise or fall 5 The different
How to buy a home EDINBURGH THE LOTHIANS FIFE
 How to buy a home EDINBURGH THE LOTHIANS FIFE Feel at home with ESPC Buying a home is exciting, satisfying and also pretty daunting. There s a lot to get your head around, but if you break it into bite-size
Biostatistics and Design of Experiments Prof. Mukesh Doble Department of Biotechnology Indian Institute of Technology, Madras
 Biostatistics and Design of Experiments Prof. Mukesh Doble Department of Biotechnology Indian Institute of Technology, Madras Lecture - 05 Normal Distribution So far we have looked at discrete distributions
1. Remortgaging: The Basics
 Remortgage Guide There are many reasons why you might want to remortgage your home, but have been hesitant to do it. We ve created this remortgage guide to show you that remortgaging your home can actually
Management and Operations 340: Exponential Smoothing Forecasting Methods
 Management and Operations 340: Exponential Smoothing Forecasting Methods [Chuck Munson]: Hello, this is Chuck Munson. In this clip today we re going to talk about forecasting, in particular exponential
Lesson Description. Texas Essential Knowledge and Skills (Target standards) Texas Essential Knowledge and Skills (Prerequisite standards)
 Texas Essential Knowledge and Skills (Prerequisite standards)") Lesson Description Students learn how to compare various small loans including easy access loans. Through the use of an online calculator, students determine the total repayment as well as the total interest
Lesson Description Students learn how to compare various small loans including easy access loans. Through the use of an online calculator, students determine the total repayment as well as the total interest
CYCLE INDICATORS. The Theory and Techniques of using Cycle analysis for Forex Trading
 CYCLE INDICATORS The Theory and Techniques of using Cycle analysis for Forex Trading The study of Forex cycles is the most important part of this course. When you learn to read cycles you ll know what
STAB22 section 1.3 and Chapter 1 exercises
 STAB22 section 1.3 and Chapter 1 exercises 1.101 Go up and down two times the standard deviation from the mean. So 95% of scores will be between 572 (2)(51) = 470 and 572 + (2)(51) = 674. 1.102 Same idea
Key Takeaways. Global Investment Strategy Technical Strategy Briefing. U.S. Dollar Index. S&P 500 Index. Chart of the Week.
 Global Investment Strategy Technical Strategy Briefing January 2, 2018 Sameer Samana, CFA Global Equity and Technical Strategist Key Takeaways S&P 500 Index The S&P 500 Index has broken out and remains
In a moment, we will look at a simple example involving the function f(x) = 100 x
 = 100 x") Rates of Change Calculus is the study of the way that functions change. There are two types of rates of change: 1. Average rate of change. Instantaneous rate of change In a moment, we will look at a simple
Rates of Change Calculus is the study of the way that functions change. There are two types of rates of change: 1. Average rate of change. Instantaneous rate of change In a moment, we will look at a simple
Chapter 2. An Introduction to Forwards and Options. Question 2.1
 Chapter 2 An Introduction to Forwards and Options Question 2.1 The payoff diagram of the stock is just a graph of the stock price as a function of the stock price: In order to obtain the profit diagram
Absolute Alpha by Beta Manipulations
 Absolute Alpha by Beta Manipulations Yiqiao Yin Simon Business School October 2014, revised in 2015 Abstract This paper describes a method of achieving an absolute positive alpha by manipulating beta.
charts to also be in the overbought area before taking the trade. If I took the trade right away, you can see on the M1 chart stochastics that the
 When you get the signal, you first want to pull up the chart for that pair and time frame of the signal in the Web Analyzer. First, I check to see if the candles are near the outer edge of the Bollinger
Risk Disclosure and Liability Disclaimer:
 Risk Disclosure and Liability Disclaimer: The author and the publisher of the information contained herein are not responsible for any actions that you undertake and will not be held accountable for any
How safe are banks in Singapore and Hong Kong?
 How safe are banks in Singapore and Hong Kong? With increasing financial calamity around the world and a heightened likelihood of a global recession and another financial crisis, it s crucial to re-examine
3.36pt. Karl Whelan (UCD) Term Structure of Interest Rates Spring / 36
 Term Structure of Interest Rates Spring / 36") 3.36pt Karl Whelan (UCD) Term Structure of Interest Rates Spring 2018 1 / 36 International Money and Banking: 12. The Term Structure of Interest Rates Karl Whelan School of Economics, UCD Spring 2018 Karl
3.36pt Karl Whelan (UCD) Term Structure of Interest Rates Spring 2018 1 / 36 International Money and Banking: 12. The Term Structure of Interest Rates Karl Whelan School of Economics, UCD Spring 2018 Karl
An Introduction to Factor Investing: Understanding the increasingly popular strategy
 A quarterly publication of CLS Investments FALL 2015 An Introduction to Factor Investing: Understanding the increasingly popular strategy Factors have engrossed the investing world in recent years. Strategies
Adjusting Nominal Values to
 Adjusting Nominal Values to Real Values By: OpenStaxCollege When examining economic statistics, there is a crucial distinction worth emphasizing. The distinction is between nominal and real measurements,
Popular Exit Strategies The Good, the Bad, and the Ugly
 Popular Exit Strategies The Good, the Bad, and the Ugly A webcast presentation for the Market Technicians Association Presented by Chuck LeBeau Director of Analytics www.smartstops.net What we intend to
1. f(x) = x2 + x 12 x 2 4 Let s run through the steps.
 = x2 + x 12 x 2 4 Let s run through the steps.") Math 121 (Lesieutre); 4.3; September 6, 2017 The steps for graphing a rational function: 1. Factor the numerator and denominator, and write the function in lowest terms. 2. Set the numerator equal to zero
Math 121 (Lesieutre); 4.3; September 6, 2017 The steps for graphing a rational function: 1. Factor the numerator and denominator, and write the function in lowest terms. 2. Set the numerator equal to zero
Option Volatility "The market can remain irrational longer than you can remain solvent"
 Chapter 15 Option Volatility "The market can remain irrational longer than you can remain solvent" The word volatility, particularly to newcomers, conjures up images of wild price swings in stocks (most
Dot Plot: A graph for displaying a set of data. Each numerical value is represented by a dot placed above a horizontal number line.
 Introduction We continue our study of descriptive statistics with measures of dispersion, such as dot plots, stem and leaf displays, quartiles, percentiles, and box plots. Dot plots, a stem-and-leaf display,
Scenic Video Transcript Dividends, Closing Entries, and Record-Keeping and Reporting Map Topics. Entries: o Dividends entries- Declaring and paying
 Income Statements» What s Behind?» Statements of Changes in Owners Equity» Scenic Video www.navigatingaccounting.com/video/scenic-dividends-closing-entries-and-record-keeping-and-reporting-map Scenic Video
Intermediate Outlook July 13-20, 2009 Jim Curry, Publisher
 Intermediate Outlook July 13-20, 2009 Jim Curry, Publisher S&P 500 CASH S&P 500 Cash Index - 07/17/09 Close - 940.38 SPX CASH: 5-Day Projected Support and Resistance levels: High - 976; Low - 908 SEPT
Your helpful life insurance guide: Life insurance claims
 Your helpful life insurance guide: Life insurance claims You may have some questions about what your loved ones would need to do in the event of making a life insurance claim. At Amica Life, we believe
Survey of Math: Chapter 21: Consumer Finance Savings (Lecture 1) Page 1
 Page 1") Survey of Math: Chapter 21: Consumer Finance Savings (Lecture 1) Page 1 The mathematical concepts we use to describe finance are also used to describe how populations of organisms vary over time, how disease
Survey of Math: Chapter 21: Consumer Finance Savings (Lecture 1) Page 1 The mathematical concepts we use to describe finance are also used to describe how populations of organisms vary over time, how disease
Macroeconomic conditions and equity market volatility. Benn Eifert, PhD February 28, 2016
 Macroeconomic conditions and equity market volatility Benn Eifert, PhD February 28, 2016 beifert@berkeley.edu Overview Much of the volatility of the last six months has been driven by concerns about the
Buyer's Guide To Fixed Deferred Annuities
 Buyer's Guide To Fixed Deferred Annuities Prepared By The National Association of Insurance Commissioners The National Association of Insurance Commissioners is an association of state insurance regulatory