Financing Overview & 2017 GO Bond Capacity Update. Department of Finance April 2017
|
|
|
- Steven Byrd
- 5 years ago
- Views:
Transcription
1 Financing Overview & 2017 GO Bond Capacity Update Department of Finance April
2 Municipal Bond Overview What is a Municipal Bond? A debt obligation issued by state and local governments to fund public purpose capital improvements such as roads and public facilities. Bonds constitute a formal agreement to pay between borrower (issuer) and lender (investor). Generally issued as tax-exempt obligations because of the public purpose nature of the projects being financed. Why do governments issue bonds? Allows the City to leverage its limited resources and acquire or improve assets without waiting for sufficient upfront cash. Spreads the cost of acquiring assets to those who benefit from it both today and in the future. Who buys municipal bonds? Buyers include large institutional investors such as mutual funds, insurance companies, trust departments, etc. as well as retail investors. 2
3 General Obligation Bonds Millions Backed by the full faith and credit of the City and payable from dedicated property tax mill levies. Must be voter authorized (TABOR): Last GO bond initiative was 2007 Better Denver Bond Program which authorized $550M to fund capital improvements throughout the City GO Bond authorization to be presented to voters in November Approximately $716 million principal amount of GO Bonds currently outstanding. City Charter limits GO debt to 3% of actual real and personal property value ($3B as of 2016). $90 $80 $70 $60 $50 $40 $30 $20 $10 Existing General Obligation Debt Service $ Other GO Programs Justice System Bonds Better Denver Bonds 3
4 Key Factors Median valuation growth estimate Residential Valuation 25.9% Commercial Valuation 20% Gallagher 7.96% v. 7.2% residential valuation rate Citywide Post Gallagher (7.2%) - 21% 2A vs. debt mills v. DPS and Urban Drainage Mills 2A mills are estimated to float down FYI 1 mill = $26/yr = $360,000 median home 4
5 2017 GO Bonding Capacity Key Assumptions No tax increase (existing debt mill levy unchanged) 21% growth in assessed property valuation in 2017 (2018 collection year), 2% growth every other year thereafter Term of bonds: 20 years, with 10-year call option, generally level debt service Multiple issuances over time Interest Rate: Current rates + buffer for rising interest rates Includes strategic actions taken to maximize 2017 GO capacity Bonding capacity is based on preliminary assumptions and subject to change. Size and timing of bond issuances will be driven by the final project list, phasing of the overall 2017 GO Program and ultimate project readiness, and market conditions at the time of planned issuances. 5
6 GO Bonding Capacity Revised bond capacity $800m 900m assuming no tax increase Tax increase is still a topic of deliberation for the executive bond committee Considerations Financial responsibility: debt burden and bond rating What can the city deliver? $550m in BDB GO over 9 years City agencies Construction industry Maintenance v. new projects Property valuation growth CIP needs for maintenance and demand based projects Guidance to subcommittees Maintain the prioritization process that each group has utilized to date Exec committee will recommend target to the Mayor for his consideration along with project options 6

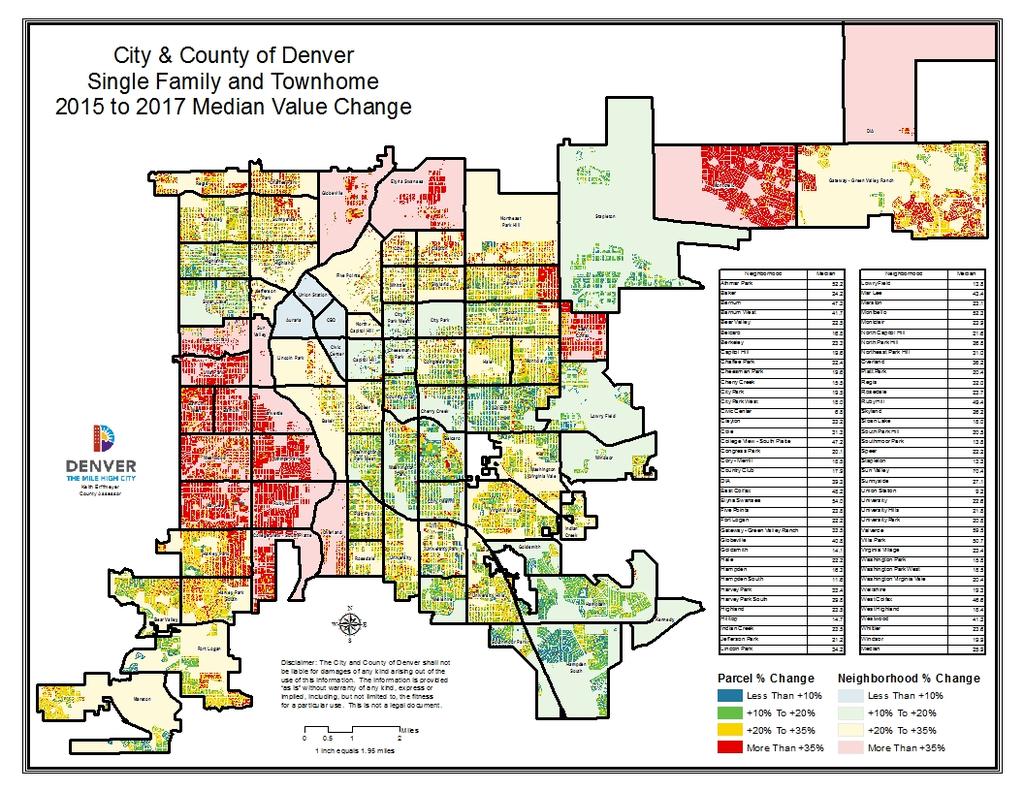
7 2017 Reassessment Impact 7
8 Residential Home Prices In 2016, Denver-area home prices increased by an average of 9.2% year-over-year. Nationally, home prices grew by 5.2%. 20% Year-Over-Year % Change in Home Prices 15% 10% 5% 0% Mar-01 Aug-01 Jan-02 Jun-02 Nov-02 Apr-03 Sep-03 Feb-04 Jul-04 Dec-04 May-05 Oct-05 Mar-06 Aug-06 Jan-07 Jun-07 Nov-07 Apr-08 Sep-08 Feb-09 Jul-09 Dec-09 May-10 Oct-10 Mar-11 Aug-11 Jan-12 Jun-12 Nov-12 Apr-13 Sep-13 Feb-14 Jul-14 Dec-14 May-15 Oct-15 Mar-16 Aug-16 Jan-17-5% -10% -15% -20% CO-Denver 20-City Composite 8
9 Property Tax Bill Median Home: $360,000 Total before 2A credits for a $360k house: $2,113 Estimated after credits: $2,057 Urban Drainage & Flood, $16.07, 1% Post 2A 2018 Property Tax Costs DPS, $1,306.26, 63% General Fund, $204.33, 10% Bond P&I, $218.58, 11% Social Services, $87.62, 4% Developmentally Disabled, $26.18, 1% Police and Fire Pension, $67.38, 3% Capital Maintenance (GF), $53.30, 3% Capital Maintenance (2007), $65.53, 3% Affordable Housing, $11.42, 1% Impact of DPS, Urban Drainage and Abatement/Refunds TBD 9
10 Better Denver Bond Spend Down $140,000,000 Better Denver Bond Amount Expended Per Year (Projects) $120,000,000 $100,000,000 $80,000,000 $60,000,000 $40,000,000 $20,000,000 $
11 Annual Maintenance Annual capital program balances the demand of maintaining $8B in assets with needed capacity projects. Capital maintenance is a priority - 70% of the City s Annual Capital Improvement Program budget is dedicated to maintaining our existing assets (approximately $59M annually). Denver capital program challenges Population growth resulting in increased asset wear and tear Saturated construction market Construction pricing escalation Decreased buying power 11
 2007 Better Denver Bond New Projects v.")
12 Bond History City has issued over $1.6B in GO bonds since 1989 to address major rehabilitation and construct new projects. GO Bond Funding by Asset Category ( ) 2007 Better Denver Bond New Projects v. Deferred Maintenance $ Health and Human Services 13% Parks 12% Cultural Facilities 13% Public Works 18% Deferred 47% New 53% Arts and Venues 4% Library 9% Safety 29% Public Facilities 2% 12
HUD NSP-1 Reporting Apr 2010 Grantee Report - New Mexico State Program
 HUD NSP-1 Reporting Apr 2010 Grantee Report - State Program State Program NSP-1 Grant Amount is $19,600,000 $9,355,381 (47.7%) has been committed $4,010,874 (20.5%) has been expended Grant Number HUD Region
Executive Summary. July 17, 2015
 Executive Summary July 17, 2015 The Revenue Estimating Conference adopted interest rates for use in the state budgeting process. The adopted interest rates take into consideration current benchmark rates
XML Publisher Balance Sheet Vision Operations (USA) Feb-02
 Feb-02") Page:1 Apr-01 May-01 Jun-01 Jul-01 ASSETS Current Assets Cash and Short Term Investments 15,862,304 51,998,607 9,198,226 Accounts Receivable - Net of Allowance 2,560,786
Page:1 Apr-01 May-01 Jun-01 Jul-01 ASSETS Current Assets Cash and Short Term Investments 15,862,304 51,998,607 9,198,226 Accounts Receivable - Net of Allowance 2,560,786
LOAN MARKET DATA AND ANALYTICS BY THOMSON REUTERS LPC
 LOAN MARKET DATA AND ANALYTICS BY THOMSON REUTERS LPC GLOBAL LOAN MARKET DATA AND ANALYTICS BY THOMSON REUTERS LPC Secondary Market Bid Levels: Europe Slide 2 European CLO New Issue Volume Monthly Slide
2009 Reassessment As Impacted by Senate Bill 711
 Saint Louis County 2009 Reassessment As Impacted by Senate Bill 711 Impacts of SB711 on the 2009 Reassessment Plan The County must notify property owners of changes in the projected tax liability resulting
City of Joliet 2014 Revenue Review. October 2013
 City of Joliet 2014 Revenue Review October 2013 General Fund 2014 Est. Revenues = $163.6 M Licenses, Permits, Fees Gaming Taxes 5% 12% Sales Taxes 27% Income Taxes 9% Charges for Services 14% Other Taxes
Mortgage Trends Update
 Mortgage Trends Update UK Finance: Mortgage Trends Update December 218 of first-time reaches 12-year high in 218 Key data highlights: There were 37, new first-time buyer mortgages completed in 218, some
$180 $160 $140 $120 $100 $80 $60 $40 $20 $ Single Fam -New Apts -New
 2012 REVENUE FORECAST Presented by Brian Henshaw September 26, 2011 1 Economic Conditions Housing starts Federal & State deficits Sovereign-debt crisis Bankruptcies Unemployment Stock Market volatility
Spheria Australian Smaller Companies Fund
 29-Jun-18 $ 2.7686 $ 2.7603 $ 2.7520 28-Jun-18 $ 2.7764 $ 2.7681 $ 2.7598 27-Jun-18 $ 2.7804 $ 2.7721 $ 2.7638 26-Jun-18 $ 2.7857 $ 2.7774 $ 2.7690 25-Jun-18 $ 2.7931 $ 2.7848 $ 2.7764 22-Jun-18 $ 2.7771
Release date: 14 August 2018
 Release date: 14 August 218 UK Finance: Mortgage Trends Update June 218 House purchase activity slows in June but remortgaging activity remains high Key data highlights: There were 34,9 new first-time
Financial & Business Highlights For the Year Ended June 30, 2017
 Financial & Business Highlights For the Year Ended June, 17 17 16 15 14 13 12 Profit and Loss Account Operating Revenue 858 590 648 415 172 174 Investment gains net 5 162 909 825 322 516 Other 262 146
Release date: 12 July 2018
 Release date: 12 July 218 UK Finance: Mortgage Trends Update May 218 Mortgage market sees pre-summer boost as remortgaging continues strong upward trend Key data highlights: There were 32,2 new first-time
Fiscal Responsibility to Further Invest in the Future. Executive Committee Department of Finance May 4, 2017
 Fiscal Responsibility to Further Invest in the Future Executive Committee Department of Finance May 4, 2017 1 Asset Inventory Denver s Assets Parks and Recreation $1.8B Transportation $4.7B Buildings $1.9B
Big Walnut Local School District
 Big Walnut Local School District Monthly Financial Report for the month ended September 30, 2012 Prepared By: Felicia Drummey Treasurer BIG WALNUT LOCAL SCHOOL DISTRICT SUMMARY OF YEAR-TO-DATE FINANCIAL
WESTWOOD LUTHERAN CHURCH Summary Financial Statement YEAR TO DATE - February 28, Over(Under) Budget WECC Fund Actual Budget
 Budget WECC Fund Actual Budget") WESTWOOD LUTHERAN CHURCH Summary Financial Statement YEAR TO DATE - February 28, 2018 General Fund Actual A B C D E F WECC Fund Actual Revenue Revenue - Faith Giving 1 $ 213 $ 234 $ (22) - Tuition $ 226
WESTWOOD LUTHERAN CHURCH Summary Financial Statement YEAR TO DATE - February 28, 2018 General Fund Actual A B C D E F WECC Fund Actual Revenue Revenue - Faith Giving 1 $ 213 $ 234 $ (22) - Tuition $ 226
THE B E A CH TO WN S O F P ALM B EA CH
 THE B E A CH TO WN S O F P ALM B EA CH C OU N T Y F LO R I D A August www.luxuryhomemarketing.com PALM BEACH TOWNS SINGLE-FAMILY HOMES LUXURY INVENTORY VS. SALES JULY Sales Luxury Benchmark Price : 7,
TERMS OF REFERENCE FOR THE INVESTMENT COMMITTEE
 I. PURPOSE The purpose of the Investment Committee (the Committee ) is to recommend to the Board the investment policy, including the asset mix policy and the appropriate benchmark for both ICBC and any
City of Justin NOVEMBER
 City of Justin MONTHLY FINANCIAL REPORT NOVEMBER - 2018 1 Revenues: Sales tax revenue is up 14.5% from this time prior year and November s sales tax collections increased 2.4% from November 2017. The City
Review of Registered Charites Compliance Rates with Annual Reporting Requirements 2016
 Review of Registered Charites Compliance Rates with Annual Reporting Requirements 2016 October 2017 The Charities Regulator, in accordance with the provisions of section 14 of the Charities Act 2009, carried
Division of Bond Finance Interest Rate Calculations. Revenue Estimating Conference Interest Rates Used for Appropriations, including PECO Bond Rates
 Division of Bond Finance Interest Rate Calculations Revenue Estimating Conference Interest Rates Used for Appropriations, including PECO Bond Rates November 16, 2018 Division of Bond Finance Calculation
QUESTION 2. QUESTION 3 Which one of the following is most indicative of a flexible short-term financial policy?
 QUESTION 1 Compute the cash cycle based on the following information: Average Collection Period = 47 Accounts Payable Period = 40 Average Age of Inventory = 55 QUESTION 2 Jan 41,700 July 39,182 Feb 18,921
REPORT TO THE CITY COUNCIL rd Avenue NE, Woodinville, WA
 To: Honorable City Council From: Richard A. Leahy, City Manager CITY OF WOODINVILLE, WA REPORT TO THE CITY COUNCIL 17301 133rd Avenue NE, Woodinville, WA 98072 WWW.CI.WOODINVILLE.WA.US By: Alexandra Sheeks,
GENERAL FUND AT A GLANCE Category Budget YTD Actual % % Year Passed Resources 50.00% Uses 50.00% $0 $1,928,600
 City of Edmond Monthly Financial Report FY 2007/2008 Through the Month Ended Unaudited - Intended for Management Purposes Only The following is a summary of the City's financial results for operating funds.
Performance Report October 2018
 Structured Investments Indicative Report October 2018 This report illustrates the indicative performance of all Structured Investment Strategies from inception to 31 October 2018 Matured Investment Strategies
PRESS RELEASE. Securities issued by Hungarian residents and breakdown by holding sectors. October 2018
 PRESS RELEASE 10 December 2018 Securities issued by Hungarian residents and breakdown by holding sectors October 2018 According to securities statistics, the amount outstanding of equity securities and
HIPIOWA - IOWA COMPREHENSIVE HEALTH ASSOCIATION Unaudited Balance Sheet As of July 31
 Unaudited Balance Sheet As of July 31 Total Enrollment: 407 Assets: Cash $ 9,541,661 $ 1,237,950 Invested Cash 781,689 8,630,624 Premiums Receivable 16,445 299,134 Prepaid 32,930 34,403 Assessments Receivable
HIPIOWA - IOWA COMPREHENSIVE HEALTH ASSOCIATION Unaudited Balance Sheet As of January 31
 Unaudited Balance Sheet As of January 31 Total Enrollment: 371 Assets: Cash $ 1,408,868 $ 1,375,117 Invested Cash 4,664,286 4,136,167 Premiums Receivable 94,152 91,261 Prepaid 32,270 33,421 Assessments
GENERAL FUND AT A GLANCE Category Budget YTD Actual % % Year Passed Resources 8.33% Uses 8.33% $0 $1,330,750
 City of Edmond Monthly Financial Report FY 2008/2009 Through the Month Ended Unaudited - Intended for Management Purposes Only The following is a summary of the City's financial results for operating funds.
Business & Financial Services December 2017
 Business & Financial Services December 217 Completed Procurement Transactions by Month 2 4 175 15 125 1 75 5 2 1 Business Days to Complete 25 Jan Feb Mar Apr May Jun Jul Aug Sep Oct Nov Dec 217 Procurement
Looking at a Variety of Municipal Valuation Metrics
 Looking at a Variety of Municipal Valuation Metrics Muni vs. Treasuries, Corporates YEAR MUNI - TREASURY RATIO YEAR MUNI - CORPORATE RATIO 200% 80% 175% 150% 75% 70% 65% 125% Average Ratio 0% 75% 50% 60%
2018 Financial Management Classes
 2018 Financial Management Classes MONEY MANAGEMENT CLASS/BANKING OPERATONS (1ST & 3RD FRIDAY) INVESTING BASICS (2ND FRIDAY) CREDIT MANAGEMENT BLENDED RETIREMENT SYSTEM/THRIFT SAVINGS PLAN (4TH FRIDAY)
Big Walnut Local School District
 Big Walnut Local School District Monthly Financial Report for the month ended September 30, 2013 Prepared By: Felicia Drummey Treasurer BIG WALNUT LOCAL SCHOOL DISTRICT SUMMARY OF YEAR TO DATE FINANCIAL
RULE 15c2-12 FILING COVER SHEET
 RULE 15c2-12 FILING COVER SHEET This cover sheet is sent with all submissions to the Municipal Securities Rulemaking Board (the Nationally Recognized Municipal Securities Information Repository) and any
Orange Unified School District
 Orange Unified School District Financing Information Ron Lebs Assistant Superintendent, Facilities and Planning Orange Unified School District Tel: 714.628.4500 rlebs@orangeusd.org Adam Bauer Chief Executive
Release date: 16 May 2018
 Release date: 16 May 218 UK Finance: Mortgage Trends Update March 218 Remortgaging market softens in March after busy start to year Key data highlights: There was 51bn of new lending to first-time in the
Capital Overview. Capital projects also include purchase of infrastructure, plant, and equipment that meet the following thresholds:
 Capital Overview The capital budget consists of capital projects, which are a set of activities that maintain or improve a city asset, often referred to as infrastructure-from buildings, to park trails,
Historical Pricing PJM COMED, Around the Clock. Cal '15 Cal '16 Cal '17 Cal '18 Cal '19 Cal '20 Cal '21 Cal '22
 $50 Historical Pricing PJM COMED, Around the Clock $48 $46 $44 $42 $40 $38 $36 $34 $32 $30 $28 $26 Cal '15 Cal '16 Cal '17 Cal '18 Cal '19 Cal '20 Cal '21 Cal '22 The information presented above was gathered
Ohlone Community College District
 Ohlone Community College District General Obligation Bond Refinancing Overview June 8, 2016 Outstanding General Obligation Bonds Issue Date Issue Amount Description Call Date Maturity Outstanding 6/19/2002
REFUNDING OPPORTUNITIES IN A RISING RATE ENVIRONMENT
 REFUNDING OPPORTUNITIES IN A RISING RATE ENVIRONMENT CALIFORNIA SOCIETY OF MUNICIPAL FINANCE OFFICERS 2016 Conference Anaheim, California Thursday, March 3, 2016 (4:00 5:30 p.m.) 2016 Panelists Nadia Sesay,
Rent vs. Own Analysis
 Rent vs. Own Analysis Initial Assumptions After-tax rate of return on investments Marginal Federal tax rate Estimated annual appreciation of home Estimated purchase price of home 5% Down payment on home
Cost Estimation of a Manufacturing Company
 Cost Estimation of a Manufacturing Company Name: Business: Date: Economics of One Unit: Manufacturing Company (Only complete if you are making a product, such as a bracelet or beauty product) Economics
2018 Budget Kick-Off. March 21, Theresa Wilson, Budget Manager Matt Elliott, Senior Budget Analyst
 2018 Budget Kick-Off March 21, 2017 Theresa Wilson, Budget Manager Matt Elliott, Senior Budget Analyst Agenda 2 Review key factors of initial 2018 budget development with City Council Economic trends Recession
PRESS RELEASE. Securities issued by Hungarian residents and breakdown by holding sectors. January 2019
 7 March 2019 PRESS RELEASE Securities issued by Hungarian residents and breakdown by holding sectors January 2019 According to securities statistics, the amount outstanding of equity securities and debt
Perspective on Colorado s Budget and Economy
 Perspective on Colorado s Budget and Economy November 2012 Office of State Planning and Budgeting Henry Sobanet, Director Erick Scheminske, Deputy Director www.colorado.gov/ospb Comparison of Change in
Development of Economy and Financial Markets of Kazakhstan
 Development of Economy and Financial Markets of Kazakhstan National Bank of Kazakhstan Macroeconomic development GDP, real growth, % 116 112 18 14 1 113,5 11,7 216,7223,8226,5 19,8 19,8 19,3 19,619,7 199,
Japan Securities Finance Co.,Ltd
 Japan Securities Finance Co.,Ltd \ mil ( )ratio of OR Mar-13 Mar-14 Securities Finance Bussiness 14,093 16,363 Margin Loan Business 6,625 9,240 (37.5%) (47.2%) Interest on Loans 1,760 4,012 Interest
11 May Report.xls Office of Budget & Fiscal Planning
 Education and General Fund Actual Revenues and s by Month MTD YTD Change Revenue Jul Aug Sep Oct Nov Dec Jan Feb Mar Apr May Jun Per 14 Total over FY06 Enrollment Fees $ 8,211 $ 219 $ 41,952 ($ 818) $
May 2016 MLS Statistical ReportREALTORS
 May 216 MLS Statistical ReportREALTORS 3 Year over Year Sales Comparison - Total Sales 25 2 15 1 5 213 214 215 216 Jan Feb Mar Apr May Jun Jul Aug Sep Oct Nov Dec Summary Overall Since the beginning of
PRESS RELEASE. Securities issued by Hungarian residents and breakdown by holding sectors. April 2016
 10 June 2016 PRESS RELEASE Securities issued by Hungarian residents and breakdown by holding sectors April 2016 According to securities statistics data, the amount outstanding of equity securities and
Transparency in the U.S. Repo Market
 Transparency in the U.S. Repo Market Antoine Martin Federal Reserve Bank of New York October 11, 2013 The views expressed in this presentation are my own and may not represent the views of the Federal
City of Loveland, Colorado City Limits
 City of Loveland, Colorado City Limits Larger map can be found at http://logic.ci.loveland.co.us/maps/citylimits2000scale.pdf City of Loveland, Colorado Budget Book 2012 Page 1-1 City Organizational Structure
Investing for now and the future. Co-opTrust Investment Services Presentation by Lydia Muchiri 26 June 2010
 Investing for now and the future Co-opTrust Investment Services Presentation by Lydia Muchiri 26 June 2010 Outline Saving vs Investing Key Considerations before starting Stages of life and investing Set
Historical Pricing PJM PSEG, Around the Clock. Cal '15 Cal '16 Cal '17 Cal '18 Cal '19 Cal '20 Cal '21 Cal '22
 $70 Historical Pricing PJM PSEG, Around the Clock $65 $60 $55 $50 $45 $40 $35 $30 $25 Cal '15 Cal '16 Cal '17 Cal '18 Cal '19 Cal '20 Cal '21 Cal '22 The information presented above was gathered and compiled
PHOENIX ENERGY MARKETING CONSULTANTS INC. HISTORICAL NATURAL GAS & CRUDE OIL PRICES UPDATED TO July, 2018
 Jan-01 $12.9112 $10.4754 $9.7870 $1.5032 $29.2595 $275.39 $43.78 $159.32 $25.33 Feb-01 $10.4670 $7.8378 $6.9397 $1.5218 $29.6447 $279.78 $44.48 $165.68 $26.34 Mar-01 $7.6303 $7.3271 $5.0903 $1.5585 $27.2714
Consumer Price Index (Base year 2014) Consumer Price Index
 Consumer Price Index") Consumer Price Index December 2017 (Base year 2014) Consumer Price Index 1 Release Date: January 2018 Detailed by: Expenditure groups Household welfare levels Household type Regions Briefing This publication
Consumer Price Index December 2017 (Base year 2014) Consumer Price Index 1 Release Date: January 2018 Detailed by: Expenditure groups Household welfare levels Household type Regions Briefing This publication
Portola Valley School District
 Portola Valley School District September 6, 2017 Board Presentation: Bond Program Overview & Illustrative 2018 Bond Measure Keygent LLC 999 N. Sepulveda Blvd., Ste. 500 El Segundo, CA 90245 (310) 322 4222
1.2 The purpose of the Finance Committee is to assist the Board in fulfilling its oversight responsibilities related to:
 Category: BOARD PROCESS Title: Terms of Reference for the Finance Committee Reference Number: AB-331 Last Approved: February 22, 2018 Last Reviewed: February 22, 2018 1. PURPOSE 1.1 Primary responsibility
Common stock prices 1. New York Stock Exchange indexes (Dec. 31,1965=50)2. Transportation. Utility 3. Finance
2. Transportation. Utility 3. Finance") Digitized for FRASER http://fraser.stlouisfed.org/ Federal Reserve Bank of St. Louis 000 97 98 99 I90 9 9 9 9 9 9 97 98 99 970 97 97 ""..".'..'.."... 97 97 97 97 977 978 979 980 98 98 98 98 98 98 987 988
Digitized for FRASER http://fraser.stlouisfed.org/ Federal Reserve Bank of St. Louis 000 97 98 99 I90 9 9 9 9 9 9 97 98 99 970 97 97 ""..".'..'.."... 97 97 97 97 977 978 979 980 98 98 98 98 98 98 987 988
Factor Leave Accruals. Accruing Vacation and Sick Leave
 Factor Leave Accruals Accruing Vacation and Sick Leave Factor Leave Accruals As part of the transition of non-exempt employees to biweekly pay, the UC Office of the President also requires standardization
Key IRS Interest Rates After PPA
 Key IRS Rates - After PPA - thru 2011 Page 1 of 10 Key IRS Interest Rates After PPA (updated upon release of figures in IRS Notice usually by the end of the first full business week of the month) Below
Consumer Price Index (Base year 2014) Consumer Price Index
 Consumer Price Index") Consumer Price Index December 2016 (Base year 2014) Consumer Price Index 1 Release Date: January 2017 Detailed by: Expenditure groups Household welfare levels Household type Regions Briefing This publication
Consumer Price Index December 2016 (Base year 2014) Consumer Price Index 1 Release Date: January 2017 Detailed by: Expenditure groups Household welfare levels Household type Regions Briefing This publication
Cash & Liquidity The chart below highlights CTA s cash position at March 2017 compared to March 2016.
 To: Chicago Transit Authority Board From: Jeremy Fine, Chief Financial Officer Re: Financial Results for March 2017 Date: May 10, 2017 I. Summary CTA s financial results are $0.6 million favorable to budget
Budget Manager Meeting. February 20, 2018
 Budget Manager Meeting February 20, 2018 Meeting Agenda DISCUSSION DRAFT NOT FOR DISTRIBUTION Budget Office Current Year Forecast Process Endowment Payout Control Charts FY19 Target Meetings Delphi Project
FERC EL Settlement Agreement
 FERC EL05-121-009 Settlement Agreement Ray Fernandez Manager, Market Settlements Development Market Settlements Subcommittee June 14, 2018 Settlement Agreement Details Settlement Agreement Details FERC
Constructing a Cash Flow Forecast
 Constructing a Cash Flow Forecast Method and Worked Example A cash flow forecast shows the estimates of the timing and amounts of cash inflows and outflows over a period of time. The sections of a cash
Tooele County. Financial Recovery Plan 3rd Quarter 2014 Update
 Tooele County Financial Recovery Plan 3rd Quarter 2014 Update Original Projection 14,000,000 Tooele County Cash 2009-2015 12,000,000 10,000,000 8,000,000 6,000,000 4,000,000 2,000,000 - Ahead of Projection
OTHER DEPOSITS FINANCIAL INSTITUTIONS DEPOSIT BARKAT SAVING ACCOUNT
 WEIGHTAGES JAN FEB MAR APR MAY JUN JUL AUG SEPT OCT NOV DEC ANNOUNCEMENT DATE 19.Dez.14 27.Jän.15 24.Feb.15 26.Mär.15 27.Apr.15 26.Mai.15 25.Jun.15 28.Jul.15 26.Aug.15 23.Sep.15 27.Okt.15 25.Nov.15 MUDARIB
Informed Storage: Understanding the Risks and Opportunities
 Art Informed Storage: Understanding the Risks and Opportunities Randy Fortenbery School of Economic Sciences College of Agricultural, Human, and Natural Resource Sciences Washington State University The
Choosing a Cell Phone Plan-Verizon Investigating Linear Equations
 Choosing a Cell Phone Plan-Verizon Investigating Linear Equations I n 2008, Verizon offered the following cell phone plans to consumers. (Source: www.verizon.com) Verizon: Nationwide Basic Monthly Anytime
Town of Cary. Capital Budgeting. What We ll Talk About Today. Where Are You From? Authority School System Municipality County Other
 C A Y, N A Town of Cary N O R T H C A R O R L I 1871 Capital Budgeting 1 What We ll Talk About Today 1. You, Me and the Town of Cary 2. We re Budget People There Has to be a Process! 3. Keeping it Real
2018 PRELIMINARY CORPORATE BUSINESS PLAN & BUDGET Governance & Priorities Committee (GPC) October 16, 2017 Presentation By Murray Totland City
 October 16, 2017 Presentation By Murray Totland City") 2018 PRELIMINARY CORPORATE BUSINESS PLAN & BUDGET Governance & Priorities Committee (GPC) October 16, 2017 Presentation By Murray Totland City Manager OVERVIEW What s the challenge(s)? What s the response(s)?
2018 PRELIMINARY CORPORATE BUSINESS PLAN & BUDGET Governance & Priorities Committee (GPC) October 16, 2017 Presentation By Murray Totland City Manager OVERVIEW What s the challenge(s)? What s the response(s)?
LOUISVILLE GAS AND ELECTRIC COMPANY Gas Rates 2018 Monthly Billing Adjustments
 2018 Monthly Billing Adjustments GAS LINE TRACKER CHARGES GAS LINE TRACKER CHARGES DSM (2) PER MONTH PER METER PER MONTH PER CCF TAX CUTS AND JOBS ACT $ Per CCF Firm Trans. SURCREDIT ($ per ccf) (3) GAS
NEWS RELEASE. R&I Upgrades to AA-/a-1+, Stable: Mitsui Fudosan Co., Ltd.
 R&I Upgrades to AA-/a-1+, Stable: Mitsui Fudosan Co., Ltd. Jun 13, 2018 Rating and Investment Information, Inc. (R&I) has announced the following: ISSUER: RATIONALE: Mitsui Fudosan Co., Ltd. Issuer Rating:
Consumer Price Index (Base year 2014) Consumer Price Index
 Consumer Price Index") Consumer Price Index July 207 (Base year 204) Consumer Price Index Release Date: Augest 207 Detailed by: Expenditure groups Household welfare levels Household type Regions Briefing This publication provides
Consumer Price Index July 207 (Base year 204) Consumer Price Index Release Date: Augest 207 Detailed by: Expenditure groups Household welfare levels Household type Regions Briefing This publication provides
Computation of the General Obligation Debt Margin ($ in thousands) TOTAL ESTIMATED ACTUAL PROPERTY VALUATION $134,976,735
 TOTAL ESTIMATED ACTUAL PROPERTY VALUATION $134,976,735") Debt Service Funds Long Term Debt and Lease Obligations Provided herein is an overview of long-term debt and lease obligations, which addresses the methods used by the City and County of Denver to finance
Debt Service Funds Long Term Debt and Lease Obligations Provided herein is an overview of long-term debt and lease obligations, which addresses the methods used by the City and County of Denver to finance
AGENDA ITEM SUMMARY January 2, 2018 City Council
 Agenda Item 20 AGENDA ITEM SUMMARY January 2, 2018 City Council STAFF Mike Beckstead, Chief Financial Officer John Duval, Legal Cyril Vidergar, Legal SUBJECT Items Relating to Broadband Facilities and
February 2016 MLS Statistical Report
 February 216 MLS Statistical Report 3 Year over Year Sales Comparison - Total Sales 2 1 213 214 21 216 Jan Feb Mar Apr May Jun Jul Aug Sep Oct Nov Dec Summary Overall Sales have slowed during February
Investment Tips & Techniques
 Investment Tips & Techniques Ohio Association of Public Treasurers June 15, 2017 Presented by Jason Click President, Public Funds Meeder Investment Management Jason Headings Sr. Vice President, Director
Department of Education s budget background and process for the Fiscal Biennium
 UPDATE Department of Education s budget background and process for the 2017-2019 Fiscal Biennium BOARD OF EDUCATION Finance and Infrastructure Committee August 16, 2016 Education breeds confidence. Confidence
Six good reasons for choosing DNB in the new banking environment
 Six good reasons for choosing DNB in the new banking environment Bank of America Merrill Lynch, 18th Annual Banking & Insurance CEO Conference 2013 24 September, London Rune Bjerke, CEO of DNB 1 Reason
Capturing equity gains whilst protecting portfolios
 Capturing equity gains whilst protecting portfolios Edward Park Q2 2018 MSCI North America Total Return in USD (2017 Discrete Calendar Months) 4.00% 3.50% 3.00% 2.50% 2.00% 1.50% 1.00% 0% 0.00% Jan-17
August 2017 MLS Statistical Report. Median Sale Price
 August 217 MLS Statistical Report Median Sale Price $4, $3, $2, $1, $ 212 213 214 2 216 217 Summary Median Home Price: Over the last years, median home prices have risen by 23%; however, much of the increase
PRESS RELEASE. Securities issued by Hungarian residents and breakdown by holding sectors. October 2017
 11 December 2017 PRESS RELEASE Securities issued by Hungarian residents and breakdown by holding sectors October 2017 According to securities statistics, the amount outstanding of equity securities and
4th - Asian Fixed Income Summit Investing in Asia s Fixed Income Market
 4th - Asian Fixed Income Summit Investing in Asia s Fixed Income Market September 217 Derek Armstrong Credit Suisse Head of Debt Capital Markets, Asia Pacific These materials may not be used or relied
Unrestricted Cash / Board Designated Cash & Investments December 2014
 Unrestricted Cash / Board Designated Cash & Investments December 2014 25.0 20.0 21.0 20.8 18.9 19.9 15.0 10.0 11.5 12.8 11.6 9.1 10.4 9.8 11.1 10.2 9.8 17.0 16.8 15.4 14.7 14.2 14.1 13.6 13.0 12.0 10.2
FINANCIAL MANAGEMENT STRATEGY REPORT ON OUTCOMES FOR THE YEAR ENDED MARCH 31, 2016
 FINANCIAL MANAGEMENT STRATEGY REPORT ON OUTCOMES FOR THE YEAR ENDED MARCH 31, 2016 Manitoba Finance General Inquiries: Room 109, Legislative Building Winnipeg, Manitoba R3C 0V8 Phone: 204-945-5343 Fax:
September 2016 MLS Statistical Report
 September 216 MLS Statistical Report Year over Year Sales Comparison - Total Sales 3 2 1 Jan Feb Mar Apr May Jun Jul Aug Sep 216 215 214 213 Oct Nov Dec Summary Overall When looking at the sales figures
MEDICAID FEDERAL SHARE OF MATCHING FUNDS
 MEDICAID FEDERAL SHARE OF MATCHING FUNDS revised by EDR based on FFIS Estimated for FFY 2019 August 3, 2017 Effective State Budget Year State adopted February 2017 State State FY real Difference in state
April 2017 MLS Statistical Report Year to Year Unit Sales Comparison - Total Sales
 April 217 MLS Statistical Report Year to Year Unit Sales Comparison - Total Sales 2 2 1 1 Jan Feb Mar Apr May Jun Jul Aug Sep Oct Nov Dec 214 21 216 217 Summary Total Existing-Home Sales: Existing home
1 Long Term Debt $ 9,298,554 $ (250,000) $ 9,048, Preferred Stock 30,450 30, % 5 Common Equity 250, %
 $ 9,048, Preferred Stock 30,450 30, % 5 Common Equity 250, %") SUMMARY SCHEDULE ($000'S) Schedule 1 Page 1 of 1 Line Capitalization HISTORICAL YEAR ENDED 12/31/16 Hybrid Percent Equity Adjusted of Total Cost of Cost of Amount Adjustment Amount Capitalization Capital
SUMMARY SCHEDULE ($000'S) Schedule 1 Page 1 of 1 Line Capitalization HISTORICAL YEAR ENDED 12/31/16 Hybrid Percent Equity Adjusted of Total Cost of Cost of Amount Adjustment Amount Capitalization Capital
SmallBizU WORKSHEET 1: REQUIRED START-UP FUNDS. Online elearning Classroom. Item Required Amount ($) Fixed Assets. 1 -Buildings $ 2 -Land $
 Fixed Assets. 1 -Buildings $ 2 -Land $") WORKSHEET 1: REQUIRED START-UP FUNDS Item Required Amount () Fixed Assets 1 -Buildings 2 -Land 3 -Initial Inventory 4 -Equipment 5 -Furniture and Fixtures 6 -Vehicles 7 Total Fixed Assets Working Capital
WORKSHEET 1: REQUIRED START-UP FUNDS Item Required Amount () Fixed Assets 1 -Buildings 2 -Land 3 -Initial Inventory 4 -Equipment 5 -Furniture and Fixtures 6 -Vehicles 7 Total Fixed Assets Working Capital
HOPE NOW. Snapshot Industry Extrapolations and HAMP Metrics
 Snapshot Industry Extrapolations and HAMP Metrics Three Month Q2-215 Q3-215 Q4-215 Q1-216 Q2-216 Jun-16 Jul-16 Aug-16 Total Completed Modifications 119,658 97,773 84,798 86,167 1,198 41,872 34,815 36,6
the city of moreno valley CALIFORNIA POPULAR ANNUAL FINANCIAL REPORT
 the city of moreno valley CALIFORNIA POPULAR ANNUAL FINANCIAL REPORT FISCAL YEAR ENDED JUNE 30,2015 Vision Statement To transform our young city into a mature community that offers its residents and businesses
BUDGET WORKSHOP May 21, 2018
 BUDGET WORKSHOP May 21, 2018 BUDGET ROLES SUMMARY Accounting prepares: Revenue estimates current and next year Expenditure estimate current year Forms for Directors to make budget requests Draft and final
Presentation to Chief Executive Officers of Commercial and Microfinance Banks Dr. Patrick Njoroge Governor, Central Bank of Kenya
 Presentation to Chief Executive Officers of Commercial and Microfinance Banks Dr. Patrick Njoroge Governor, Central Bank of Kenya August 6, 2015 Outline 1. The Information basis for the MPC meeting 2.
CITY OF RICHMOND MONTHLY FINANCE REPORT AS OF APRIL 30, 2017
 CITY OF RICHMOND MONTHLY FINANCE REPORT AS OF APRIL 30, 2017 CITY OF RICHMOND DEPARTMENT OF FINANCE TABLE OF CONTENTS Letter of Transmittal I General Fund - Budgetary Comparison Schedule - Revenues 1
Bulletin 16 of 2017 Inflation Rate Multiplier October 30, 2017
 5102 (Rev. 04-15) RICK SNYDER GOVERNOR STATE OF MICHIGAN DEPARTMENT OF TREASURY LANSING NICK A. KHOURI STATE TREASURER TO: FROM: Assessors and Equalization Directors State Tax Commission Bulletin 16 of
Capital Improvement Program Update
 Finance & Administration Committee Information Item III-A May 12, 2011 Capital Improvement Program Update Washington Metropolitan Area Transit Authority Board Action/Information Summary Action Information
THDA STIMULUS SECOND MORTGAGE PROGRAM REPORT
 January, 2011 STIMULUS SECOND MORTGE PROAM REPORT Hulya Arik, Ph.D., Research Coordinator DIVISION OF RESEARCH, PLANNING & TECHNICAL SERVICES Tennessee Housing Development Agency 404 James Robertson Parkway,
TRADING THROUGH THE VOLATILITY
 Connect to WiFi WiFi: Hilton Meeting Room Password: LSTAOPS19 Open Your Web Browser TRADING THROUGH THE VOLATILITY # LSTAOPS19 Go to slido.com Ted Basta, Executive Vice President Market Analytics & Investor