ESTABLISHING A CASH FLOW MODEL
|
|
|
- Lynette Wilkins
- 6 years ago
- Views:
Transcription

1 Government Finance Officers Association of Texas Fall Conference 2017 ESTABLISHING A CASH FLOW MODEL EMILY A. UPSHAW, CPA VALLEY VIEW CONSULTING, LLC
2 Objectives: Understand the importance of developing a cash flow model Discuss laddering of investments Learn approach to building a cash flow model for operating funds Discuss example cash flow model and various methods of analysis 2
3 Questions: Would you try to build a house without a plan? Would you try to drive to an address across the country without a map? Then why would you try to build an effective portfolio without a cash flow plan?? 3
4 Cash Flow Information is Important In most cases where portfolios imploded or caused financial duress, it was due to a failure to consider the cash flow needs of the organization. Cash flow models can set the portfolio on a firm foundation and should be the cornerstone for building the portfolio structure. 4
5 Cash Flow Information is Important How do Cash Flow Models Assist the Portfolio Manager? Historical Perspective to Cash Needs Identify Trends Tool for Enhancing Investment Income 5
6 Note: Important Distinction Operating funds Forecasting the use of historic data to determine the direction of future trends (Investopedia) Projectbased funds Draw schedule required for anticipated spending 6

7 Cash Flow Information is Important Use Cash Flow to Ladder the Portfolio Importance of Laddering Minimizes Impact of Changing Interest Rates Diversifies Risk Results in a More Dependable Return 7
8 Yield Curve Opportunities Rate Time Normal Yield Curve Offers Higher Rates for Longer Term Maturities Cash Flow Model Identifies Potential Maturities Along the Yield Curve 8
9 Where Do I Start? Data is All Around You Bank Statements Portfolio Reports Accounting Summary Reports How Much Time Will It Take? Set Up and First Entries might take a day Subsequent Maintenance should only take a few minutes/hours depending on the number of portfolios/accounts 9
10 Analysis One What is the History? Cash Flow from Cash/Investment Perspective Bank Statements Monthly Portfolio Reports Collect Statements/Reports for Last Three (or more) Years On a spreadsheet, record the monthend balances for each bank account and the portfolio ending book values 10
11 A AW AX AY AZ BA BB BC BD 1 Sample Client 2 Operating Fund 3 4 Feb16 Mar16 Apr16 May16 Jun16 Jul16 Aug16 Sep Depository Bank Ending Balance 84,502, ,804, ,080, ,030, ,395, ,511, ,835, ,561, Checking Fund 001 (ending) , Checking Compensating Balance (ending) 25,000, ,000, ,000, ,000, ,000, ,000, ,000, ,000, TexPool (ending) 10,003, ,007, ,011, ,015, ,020, ,024, ,028, ,031, TexStar (ending) 5,014, ,039, ,059, ,079, ,094, ,106, ,214, ,222, BankMMA (ending) 20,004, ,013, ,023, ,033, Securities Portfolio (ending) 35,849, ,900, ,800, ,526, ,978, ,610, ,457, ,016, Ending Totals: 160,369, ,751, ,952, ,652, ,494, ,635, ,559, ,865,157 Ending Totals = sum of each column Graph Row 15 11
12 Operating Fund Historical Portfolio Balances $180,000,000 $160,000,000 $140,000,000 $120,000,000 $100,000,000 $80,000,000 $60,000,000 $40,000,000 $20,000,000 $0 12
13 Analysis Two How Much? Portfolio Allocations Three Buckets 1. Longterm (Core) Maturity beyond 1year 2. Intermediate Maturity between 3months and 1year 3. Liquidity Maturity less than 3months 13
14 Operating Fund Historical Portfolio Balances $180,000,000 $160,000,000 $140,000,000 $120,000,000 $100,000,000 $80,000,000 $60,000,000 $40,000,000 $20,000,000 $0 14
15 A AW AX AY AZ BA BB BC BD 1 Sample Client 2 Operating Fund 3 4 Feb16 Mar16 Apr16 May16 Jun16 Jul16 Aug16 Sep Depository Bank Ending Balance 84,502, ,804, ,080, ,030, ,395, ,511, ,835, ,561, Checking Fund 001 (ending) , Checking Compensating Balance (ending) 25,000, ,000, ,000, ,000, ,000, ,000, ,000, ,000, TexPool (ending) 10,003, ,007, ,011, ,015, ,020, ,024, ,028, ,031, TexStar (ending) 5,014, ,039, ,059, ,079, ,094, ,106, ,214, ,222, BankMMA (ending) 20,004, ,013, ,023, ,033, Securities Portfolio (ending) 35,849, ,900, ,800, ,526, ,978, ,610, ,457, ,016, Ending Totals: 160,369, ,751, ,952, ,652, ,494, ,635, ,559, ,865, Portfolio Monthly Change 7,340,893 (1,617,976) (10,799,485) (1,299,870) (1,158,136) (858,474) (1,076,269) (2,694,480) 17 Portfolio Declines 0 1,617,976 10,799,485 1,299,870 1,158, ,474 1,076,269 2,694, Portfolio Increases 7,340, { Graph table: Feb16 Mar16 Apr16 May16 Jun16 Jul16 Aug16 Sep Core base 50,000 50,000 50,000 50,000 50,000 50,000 50,000 50, Portfolio Balance 86,314 84,939 75,760 74,655 73,670 72,941 72,026 69, Liquidity 15% 24,055 23,813 22,193 21,998 21,824 21,695 21,534 21, Liquidity Base 15% Build the Graph Table to begin to allocate the portfolio into maturity buckets 1. Core 2. Intermediate 3. Liquidity 15
 476.88 477.05 477.11 477.17 477.23 369,177.29 487.93 492.53 8 Checking Compensating Balance (ending) 25,000,000.")
16 A AW AX AY AZ BA BB BC BD 1 Sample Client 2 Operating Fund 3 4 Feb16 Mar16 Apr16 May16 Jun16 Jul16 Aug16 Sep Depository Bank Ending Balance 84,502, ,804, ,080, ,030, ,395, ,511, ,835, ,561, Checking Fund 001 (ending) , Checking Compensating Balance (ending) 25,000, ,000, ,000, ,000, ,000, ,000, ,000, ,000, TexPool (ending) 10,003, ,007, ,011, ,015, ,020, ,024, ,028, ,031, TexStar (ending) 5,014, ,039, ,059, ,079, ,094, ,106, ,214, ,222, BankMMA (ending) 20,004, ,013, ,023, ,033, Securities Portfolio (ending) 35,849, ,900, ,800, ,526, ,978, ,610, ,457, ,016, Ending Totals: 160,369, ,751, ,952, ,652, ,494, ,635, ,559, ,865, Portfolio Monthly Change 7,340,893 (1,617,976) (10,799,485) (1,299,870) (1,158,136) (858,474) (1,076,269) (2,694,480) 17 Portfolio Declines 0 1,617,976 10,799,485 1,299,870 1,158, ,474 1,076,269 2,694, Portfolio Increases 7,340, Graph table: Feb16 Mar16 Apr16 May16 Jun16 Jul16 Aug16 Sep16 20 Core base 50,000 50,000 50,000 50,000 50,000 50,000 50,000 50, Portfolio Balance 86,314 84,939 75,760 74,655 73,670 72,941 72,026 69, Liquidity 15% 24,055 23,813 22,193 21,998 21,824 21,695 21,534 21, Liquidity Base 15% 1. Core approximately 50% of the portfolio s lowest historic balance 16
17 Operating Fund Historical Portfolio Balances $180,000,000 $160,000,000 $140,000,000 $120,000,000 $100,000,000 $80,000,000 $60,000,000 $40,000,000 $20,000,000 $0 November 2013 was portfolio s lowest balance at $110MM 17
18 A AW AX AY AZ BA BB BC BD 1 Sample Client 2 Operating Fund 3 4 Feb16 Mar16 Apr16 May16 Jun16 Jul16 Aug16 Sep Depository Bank Ending Balance 84,502, ,804, ,080, ,030, ,395, ,511, ,835, ,561, Checking Fund 001 (ending) , Checking Compensating Balance (ending) 25,000, ,000, ,000, ,000, ,000, ,000, ,000, ,000, TexPool (ending) 10,003, ,007, ,011, ,015, ,020, ,024, ,028, ,031, TexStar (ending) 5,014, ,039, ,059, ,079, ,094, ,106, ,214, ,222, BankMMA (ending) 20,004, ,013, ,023, ,033, Securities Portfolio (ending) 35,849, ,900, ,800, ,526, ,978, ,610, ,457, ,016, Ending Totals: 160,369, ,751, ,952, ,652, ,494, ,635, ,559, ,865, Portfolio Monthly Change 7,340,893 (1,617,976) (10,799,485) (1,299,870) (1,158,136) (858,474) (1,076,269) (2,694,480) 17 Portfolio Declines 0 1,617,976 10,799,485 1,299,870 1,158, ,474 1,076,269 2,694, Portfolio Increases 7,340, Graph table: Feb16 Mar16 Apr16 May16 Jun16 Jul16 Aug16 Sep16 20 Core base 50,000 50,000 50,000 50,000 50,000 50,000 50,000 50, Portfolio Balance 86,314 84,939 75,760 74,655 73,670 72,941 72,026 69, Liquidity 15% 24,055 23,813 22,193 21,998 21,824 21,695 21,534 21, Liquidity Base 15% Core can be constant copy value across the row Formula: = $AW$20 18
19 A AW AX AY AZ BA BB BC BD 1 Sample Client 2 Operating Fund 3 4 Feb16 Mar16 Apr16 May16 Jun16 Jul16 Aug16 Sep Depository Bank Ending Balance 84,502, ,804, ,080, ,030, ,395, ,511, ,835, ,561, Checking Fund 001 (ending) , Checking Compensating Balance (ending) 25,000, ,000, ,000, ,000, ,000, ,000, ,000, ,000, TexPool (ending) 10,003, ,007, ,011, ,015, ,020, ,024, ,028, ,031, TexStar (ending) 5,014, ,039, ,059, ,079, ,094, ,106, ,214, ,222, BankMMA (ending) 20,004, ,013, ,023, ,033, Securities Portfolio (ending) 35,849, ,900, ,800, ,526, ,978, ,610, ,457, ,016, Ending Totals: 160,369, ,751, ,952, ,652, ,494, ,635, ,559, ,865, Portfolio Monthly Change 7,340,893 (1,617,976) (10,799,485) (1,299,870) (1,158,136) (858,474) (1,076,269) (2,694,480) 17 Portfolio Declines 0 1,617,976 10,799,485 1,299,870 1,158, ,474 1,076,269 2,694, Portfolio Increases 7,340, Graph table: Feb16 Mar16 Apr16 May16 Jun16 Jul16 Aug16 Sep16 20 Core base 50,000 50,000 50,000 50,000 50,000 50,000 50,000 50, Portfolio Balance 86,314 84,939 75,760 74,655 73,670 72,941 72,026 69, Liquidity 15% 24,055 23,813 22,193 21,998 21,824 21,695 21,534 21, Liquidity Base 15% 3. Liquidity target percentage of cash equivalents for the total portfolio Input target percentage in Cell AW24 19
20 A AW AX AY AZ BA BB BC BD 1 Sample Client 2 Operating Fund 3 4 Feb16 Mar16 Apr16 May16 Jun16 Jul16 Aug16 Sep Depository Bank Ending Balance 84,502, ,804, ,080, ,030, ,395, ,511, ,835, ,561, Checking Fund 001 (ending) , Checking Compensating Balance (ending) 25,000, ,000, ,000, ,000, ,000, ,000, ,000, ,000, TexPool (ending) 10,003, ,007, ,011, ,015, ,020, ,024, ,028, ,031, TexStar (ending) 5,014, ,039, ,059, ,079, ,094, ,106, ,214, ,222, BankMMA (ending) 20,004, ,013, ,023, ,033, Securities Portfolio (ending) 35,849, ,900, ,800, ,526, ,978, ,610, ,457, ,016, Ending Totals: 160,369, ,751, ,952, ,652, ,494, ,635, ,559, ,865, Portfolio Monthly Change 7,340,893 (1,617,976) (10,799,485) (1,299,870) (1,158,136) (858,474) (1,076,269) (2,694,480) 17 Portfolio Declines 0 1,617,976 10,799,485 1,299,870 1,158, ,474 1,076,269 2,694, Portfolio Increases 7,340, Graph table: Feb16 Mar16 Apr16 May16 Jun16 Jul16 Aug16 Sep16 20 Core base 50,000 50,000 50,000 50,000 50,000 50,000 50,000 50, Portfolio Balance 86,314 84,939 75,760 74,655 73,670 72,941 72,026 69, Liquidity 15% 24,055 23,813 22,193 21,998 21,824 21,695 21,534 21, Liquidity Base 15% Formula Cell AW22: = ( AW15 * $AW$24 ) / 1000 Copy across the row 20
 476.88 477.05 477.11 477.17 477.23 369,177.29 487.93 492.53 8 Checking Compensating Balance (ending) 25,000,000.")
21 A AW AX AY AZ BA BB BC BD 1 Sample Client 2 Operating Fund 3 4 Feb16 Mar16 Apr16 May16 Jun16 Jul16 Aug16 Sep Depository Bank Ending Balance 84,502, ,804, ,080, ,030, ,395, ,511, ,835, ,561, Checking Fund 001 (ending) , Checking Compensating Balance (ending) 25,000, ,000, ,000, ,000, ,000, ,000, ,000, ,000, TexPool (ending) 10,003, ,007, ,011, ,015, ,020, ,024, ,028, ,031, TexStar (ending) 5,014, ,039, ,059, ,079, ,094, ,106, ,214, ,222, BankMMA (ending) 20,004, ,013, ,023, ,033, Securities Portfolio (ending) 35,849, ,900, ,800, ,526, ,978, ,610, ,457, ,016, Ending Totals: 160,369, ,751, ,952, ,652, ,494, ,635, ,559, ,865, Portfolio Monthly Change 7,340,893 (1,617,976) (10,799,485) (1,299,870) (1,158,136) (858,474) (1,076,269) (2,694,480) 17 Portfolio Declines 0 1,617,976 10,799,485 1,299,870 1,158, ,474 1,076,269 2,694, Portfolio Increases 7,340, Graph table: Feb16 Mar16 Apr16 May16 Jun16 Jul16 Aug16 Sep16 20 Core base 50,000 50,000 50,000 50,000 50,000 50,000 50,000 50, Portfolio Balance 86,314 84,939 75,760 74,655 73,670 72,941 72,026 69, Liquidity 15% 24,055 23,813 22,193 21,998 21,824 21,695 21,534 21, Liquidity Base 15% 2. Intermediate remainder of the portfolio total Formula for AW21: = (AW15 / 1000) (AW20 + AW22) 21
22 A AW AX AY AZ BA BB BC BD 1 Sample Client 2 Operating Fund 3 4 Feb16 Mar16 Apr16 May16 Jun16 Jul16 Aug16 Sep Depository Bank Ending Balance 84,502, ,804, ,080, ,030, ,395, ,511, ,835, ,561, Checking Fund 001 (ending) , Checking Compensating Balance (ending) 25,000, ,000, ,000, ,000, ,000, ,000, ,000, ,000, TexPool (ending) 10,003, ,007, ,011, ,015, ,020, ,024, ,028, ,031, TexStar (ending) 5,014, ,039, ,059, ,079, ,094, ,106, ,214, ,222, BankMMA (ending) 20,004, ,013, ,023, ,033, Securities Portfolio (ending) 35,849, ,900, ,800, ,526, ,978, ,610, ,457, ,016, Ending Totals: 160,369, ,751, ,952, ,652, ,494, ,635, ,559, ,865, Portfolio Monthly Change 7,340,893 (1,617,976) (10,799,485) (1,299,870) (1,158,136) (858,474) (1,076,269) (2,694,480) 17 Portfolio Declines 0 1,617,976 10,799,485 1,299,870 1,158, ,474 1,076,269 2,694, Portfolio Increases 7,340, Graph table: Feb16 Mar16 Apr16 May16 Jun16 Jul16 Aug16 Sep16 20 Core base 50,000 50,000 50,000 50,000 50,000 50,000 50,000 50, Portfolio Balance 86,314 84,939 75,760 74,655 73,670 72,941 72,026 69, Liquidity 15% 24,055 23,813 22,193 21,998 21,824 21,695 21,534 21, Liquidity Base 15% Graph the entire table Stacked Area Chart 22
23 23
24 Using the Historical Balances Graph Completed Graph Shows Three Portfolio Divisions Liquidity Component the amount to deposit in Pools/MMA/MMMF to pay daytoday bills Intermediate Component the amount used to ladder to address projected obligations during the year Core Component The longerterm foundation of the portfolio 24
25 Analysis Three When? Targeting Maturity Needs Use a historical perspective Which Months Need Maturities and Which Do Not? 25
26 A AW AX AY AZ BA BB BC BD 1 Sample Client 2 Operating Fund 3 4 Feb16 Mar16 Apr16 May16 Jun16 Jul16 Aug16 Sep Depository Bank Ending Balance 84,502, ,804, ,080, ,030, ,395, ,511, ,835, ,561, Checking Fund 001 (ending) , Checking Compensating Balance (ending) 25,000, ,000, ,000, ,000, ,000, ,000, ,000, ,000, TexPool (ending) 10,003, ,007, ,011, ,015, ,020, ,024, ,028, ,031, TexStar (ending) 5,014, ,039, ,059, ,079, ,094, ,106, ,214, ,222, BankMMA (ending) 20,004, ,013, ,023, ,033, Securities Portfolio (ending) 35,849, ,900, ,800, ,526, ,978, ,610, ,457, ,016, Ending Totals: 160,369, ,751, ,952, ,652, ,494, ,635, ,559, ,865, Portfolio Monthly Change 7,340,893 (1,617,976) (10,799,485) (1,299,870) (1,158,136) (858,474) (1,076,269) (2,694,480) Formula Cell AX16: = AX15 AW15 Then copy formula across the row 26
 476.88 477.05 477.11 477.17 477.23 369,177.29 487.93 492.53 8 Checking Compensating Balance (ending) 25,000,000.")
27 A AW AX AY AZ BA BB BC BD 1 Sample Client 2 Operating Fund 3 4 Feb16 Mar16 Apr16 May16 Jun16 Jul16 Aug16 Sep Depository Bank Ending Balance 84,502, ,804, ,080, ,030, ,395, ,511, ,835, ,561, Checking Fund 001 (ending) , Checking Compensating Balance (ending) 25,000, ,000, ,000, ,000, ,000, ,000, ,000, ,000, TexPool (ending) 10,003, ,007, ,011, ,015, ,020, ,024, ,028, ,031, TexStar (ending) 5,014, ,039, ,059, ,079, ,094, ,106, ,214, ,222, BankMMA (ending) 20,004, ,013, ,023, ,033, Securities Portfolio (ending) 35,849, ,900, ,800, ,526, ,978, ,610, ,457, ,016, Ending Totals: 160,369, ,751, ,952, ,652, ,494, ,635, ,559, ,865, Portfolio Monthly Change 7,340,893 (1,617,976) (10,799,485) (1,299,870) (1,158,136) (858,474) (1,076,269) (2,694,480) 17 Portfolio Declines 0 1,617,976 10,799,485 1,299,870 1,158, ,474 1,076,269 2,694, Portfolio Increases 7,340, Formula Cell AX16: = AX15 AW15 Formula Cell AX17: = IF ( AX16>0, 0, AX16 ) Formula Cell AX18: = IF ( AX16<0, 0, AX16 ) Then copy formulas across the row 27
28 A AW AX AY AZ BA BB BC BD 1 Sample Client 2 Operating Fund 3 4 Feb16 Mar16 Apr16 May16 Jun16 Jul16 Aug16 Sep Depository Bank Ending Balance 84,502, ,804, ,080, ,030, ,395, ,511, ,835, ,561, Checking Fund 001 (ending) , Checking Compensating Balance (ending) 25,000, ,000, ,000, ,000, ,000, ,000, ,000, ,000, TexPool (ending) 10,003, ,007, ,011, ,015, ,020, ,024, ,028, ,031, TexStar (ending) 5,014, ,039, ,059, ,079, ,094, ,106, ,214, ,222, BankMMA (ending) 20,004, ,013, ,023, ,033, Securities Portfolio (ending) 35,849, ,900, ,800, ,526, ,978, ,610, ,457, ,016, Ending Totals: 160,369, ,751, ,952, ,652, ,494, ,635, ,559, ,865, Portfolio Monthly Change 7,340,893 (1,617,976) (10,799,485) (1,299,870) (1,158,136) (858,474) (1,076,269) (2,694,480) 17 Portfolio Declines 0 1,617,976 10,799,485 1,299,870 1,158, ,474 1,076,269 2,694, Portfolio Increases 7,340, Graph table: Feb16 Mar16 Apr16 May16 Jun16 Jul16 Aug16 Sep16 20 Core base 50,000 50,000 50,000 50,000 50,000 50,000 50,000 50, Portfolio Balance 86,314 84,939 75,760 74,655 73,670 72,941 72,026 69, Liquidity 15% 24,055 23,813 22,193 21,998 21,824 21,695 21,534 21, Liquidity Base 15% Graph Row 16 28
29 29
30 A AW AX AY AZ BA BB BC BD 1 Sample Client 2 Operating Fund 3 4 Feb16 Mar16 Apr16 May16 Jun16 Jul16 Aug16 Sep Depository Bank Ending Balance 84,502, ,804, ,080, ,030, ,395, ,511, ,835, ,561, Checking Fund 001 (ending) , Checking Compensating Balance (ending) 25,000, ,000, ,000, ,000, ,000, ,000, ,000, ,000, TexPool (ending) 10,003, ,007, ,011, ,015, ,020, ,024, ,028, ,031, TexStar (ending) 5,014, ,039, ,059, ,079, ,094, ,106, ,214, ,222, BankMMA (ending) 20,004, ,013, ,023, ,033, Securities Portfolio (ending) 35,849, ,900, ,800, ,526, ,978, ,610, ,457, ,016, Ending Totals: 160,369, ,751, ,952, ,652, ,494, ,635, ,559, ,865, Portfolio Monthly Change 7,340,893 (1,617,976) (10,799,485) (1,299,870) (1,158,136) (858,474) (1,076,269) (2,694,480) 17 Portfolio Declines 0 1,617,976 10,799,485 1,299,870 1,158, ,474 1,076,269 2,694, Portfolio Increases 7,340, Graph table: Feb16 Mar16 Apr16 May16 Jun16 Jul16 Aug16 Sep16 20 Core base 50,000 50,000 50,000 50,000 50,000 50,000 50,000 50, Portfolio Balance 86,314 84,939 75,760 74,655 73,670 72,941 72,026 69, Liquidity 15% 24,055 23,813 22,193 21,998 21,824 21,695 21,534 21, Liquidity Base 15% Graph Row 17 30
31 31

 32")
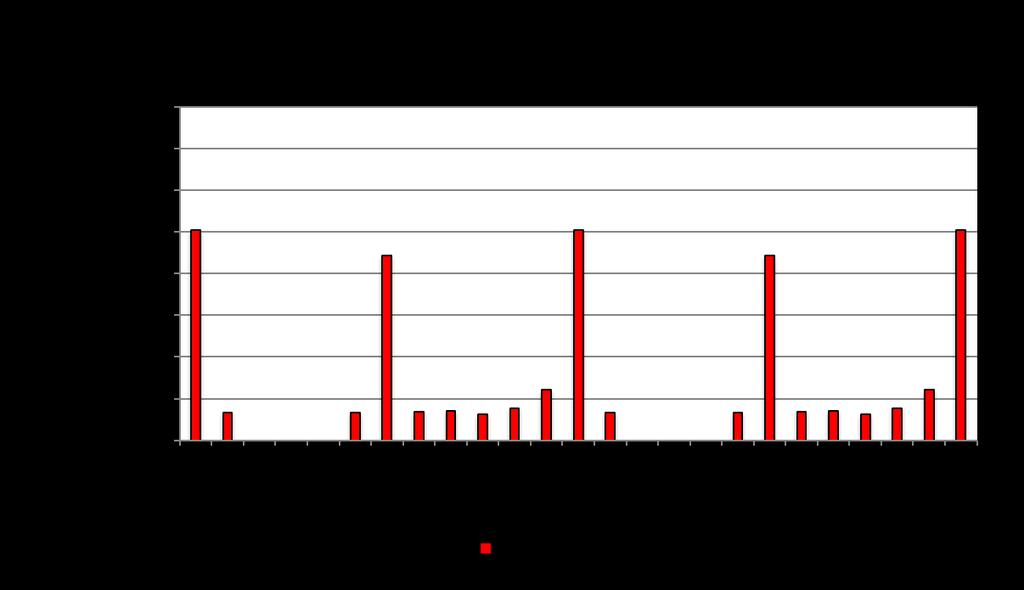
32 Operating Fund Historical Unfunded Obligations $14,000,000 $12,000,000 $10,000,000 $8,000,000 $6,000,000 $4,000,000 $2,000,000 $0 Look at the trends and evaluate each month relative to the same month in other years: 1. December, January and February are typically well funded 2. April and October are typically cash strapped (except when bond proceeds broke the trend, i.e. April 2015) 32
33 A B C D E F G H 1 Sample Client 2 Operating Fund 3 4 Mar12 Apr12 May12 Jun12 Jul12 Aug12 Sep Depository Bank Ending Balance 58,018,679 42,582,870 40,871,891 39,375,873 37,367,758 36,038,641 33,600,000 7 Checking Fund 001 (ending) 20,423 20,425 20, , Checking Compensating Balance (ending) 25,000,000 25,000,000 25,000,000 25,000,000 25,000,000 25,000,000 25,000,000 9 TexPool (ending) 39,545, ,066, ,089, ,111, ,133, ,158, ,178, TexStar (ending) 16,948, ,457, ,466, ,476, ,485, ,496, ,504, BankMMA (ending) 12 Securities Portfolio (ending) Ending Totals: 139,512, ,127, ,448, ,983, ,331, ,693, ,283, Portfolio Monthly Change (10,385,623) (1,678,681) (1,464,746) (1,652,590) (1,637,305) (2,410,416) 17 Portfolio Declines 10,385,623 1,678,681 1,464,746 1,652,590 1,637,305 2,410, Portfolio Increases Graph table: Mar12 Apr12 May12 Jun12 Jul12 Aug12 Sep12 20 Core base 50,000 50,000 50,000 50,000 50,000 50,000 50, Portfolio Balance 68,586 59,758 58,331 57,086 55,682 54,290 52, Liquidity 15% 20,927 19,369 19,117 18,898 18,650 18,404 18, Liquidity Base 15% Graph For Projections: 27 Mar Apr May Jun Jul Aug Sep 28 Average Change By Month $ (1,347,665) $ (8,862,078) $ (1,380,831) $ (1,419,521) $ (1,237,322) $ (1,550,443) $ (2,438,048) Formula Cell C28: = AVERAGE ( C16, O16, AA16, AM16, AY16 ) NOTE: These are the columns that contained April date across the years 33
34 Use a multiyear average to determine what is the typical monthly change. This could be used to develop a futureyear projection of maturity needs. 34
35 A B C D E F G H 1 Sample Client 2 Operating Fund 3 4 Mar12 Apr12 May12 Jun12 Jul12 Aug12 Sep Depository Bank Ending Balance 58,018,679 42,582,870 40,871,891 39,375,873 37,367,758 36,038,641 33,600,000 7 Checking Fund 001 (ending) 20,423 20,425 20, , Checking Compensating Balance (ending) 25,000,000 25,000,000 25,000,000 25,000,000 25,000,000 25,000,000 25,000,000 9 TexPool (ending) 39,545, ,066, ,089, ,111, ,133, ,158, ,178, TexStar (ending) 16,948, ,457, ,466, ,476, ,485, ,496, ,504, BankMMA (ending) 12 Securities Portfolio (ending) Ending Totals: 139,512, ,127, ,448, ,983, ,331, ,693, ,283, Portfolio Monthly Change (10,385,623) (1,678,681) (1,464,746) (1,652,590) (1,637,305) (2,410,416) 17 Portfolio Declines 10,385,623 1,678,681 1,464,746 1,652,590 1,637,305 2,410, Portfolio Increases Graph table: Mar12 Apr12 May12 Jun12 Jul12 Aug12 Sep12 20 Core base 50,000 50,000 50,000 50,000 50,000 50,000 50, Portfolio Balance 68,586 59,758 58,331 57,086 55,682 54,290 52, Liquidity 15% 20,927 19,369 19,117 18,898 18,650 18,404 18, Liquidity Base 15% Graph For Projections: 27 Mar Apr May Jun Jul Aug Sep 28 Average Change By Month $ (1,347,665) $ (8,862,078) $ (1,380,831) $ (1,419,521) $ (1,237,322) $ (1,550,443) $ (2,438,048) 29 Months with Average Shortfall $ 1,347,665 $ 8,862,078 $ 1,380,831 $ 1,419,521 $ 1,237,322 $ 1,550,443 $ 2,438,048 Formula Cell C29 = IF ( C28<0, C28, 0 ) Copy across the row Graph Row 29 35
36 Graph of the months with averages that are negative. 36
37 Various Methods of Analysis Based upon the Historical Perspective: Use the worst case scenario for each month Perform an averaging for each month over the historic period Use the last year as a benchmark Add a section to your spreadsheet to calculate, based on the preferred method 37
38 Sample Analysis and Benefits New Client Analysis Performed At Beginning of Fiscal Year ($141 MM total balance at 9/30/16) Core = $50 MM Intermediate = $70 MM Liquidity = $21 MM Used Historical Averages as the Monthly Targets (based on 4years of data) Overlay Current Portfolio Maturities Develop Proposed Maturities 38

39 39


40 Graph of the months with averages that are negative. 40
41 Analyze All Graphs to Project Future Liabilities Unfunded Current Proposed Obligations Cash Equivalent Investments Maturities Oct16 $ 10,101, Nov16 $ 1,323, Dec16 $ Jan17 $ Feb17 $ Mar17 $ 1,347, Apr17 $ 8,862, May17 $ 1,380, Jun17 $ 1,419, Jul17 $ 1,237, Aug17 $ 1,550, Sep17 $ 2,438, Oct17 $ 10,101, Nov17 $ 1,323, Dec17 $ Jan18 $ Feb18 $ Mar18 $ 1,347, Apr18 $ 8,862, May18 $ 1,380, Jun18 $ 1,419, Jul18 $ 1,237, Aug18 $ 1,550, Sep18 $ 2,438, Oct18 $ 10,101, Nov18 $ 1,323, Dec18 $ Maximum=2years 41
42 42
43 Unfunded Current Proposed Obligations Cash Equivalent Investments Maturities Oct16 $ 10,101, $ 70,848, Nov16 $ 1,323, $ 5,016, Dec16 $ Jan17 $ Feb17 $ Mar17 $ 1,347, Apr17 $ 8,862, $ 10,000, May17 $ 1,380, Jun17 $ 1,419, Jul17 $ 1,237, Aug17 $ 1,550, Sep17 $ 2,438, $ 10,000, Oct17 $ 10,101, $ 15,000, Nov17 $ 1,323, Dec17 $ Jan18 $ Feb18 $ Mar18 $ 1,347, Apr18 $ 8,862, May18 $ 1,380, Jun18 $ 1,419, Jul18 $ 1,237, Aug18 $ 1,550, Sep18 $ 2,438, Oct18 $ 10,101, Nov18 $ 1,323, Dec18 $ Maximum=2years 43
44 Actual Cash Balance = $71 MM 44
45 Unfunded Current Proposed Obligations Cash Equivalent Investments Maturities Oct16 $ 10,101, $ 25,848, Nov16 $ 1,323, $ 5,016, Dec16 $ Jan17 $ Feb17 $ Mar17 $ 1,347, Apr17 $ 8,862, $ 10,000, May17 $ 1,380, Jun17 $ 1,419, Jul17 $ 1,237, Aug17 $ 1,550, Sep17 $ 2,438, $ 10,000, Oct17 $ 10,101, $ 15,000, Nov17 $ 1,323, Dec17 $ Jan18 $ Feb18 $ Mar18 $ 1,347, Apr18 $ 8,862, $ 10,000, May18 $ 1,380, Jun18 $ 1,419, Jul18 $ 1,237, Aug18 $ 1,550, Sep18 $ 2,438, $ 10,000, Oct18 $ 10,101, Nov18 $ 1,323, Dec18 $ Maximum=2years 45

46 Cash Balance After New Investment = $26 MM 46
47 Unfunded Current Proposed Obligations Cash Equivalent Investments Maturities Oct16 $ 10,101, $ 25,848, Nov16 $ 1,323, $ 5,016, Dec16 $ Jan17 $ Feb17 $ Mar17 $ 1,347, Apr17 $ 8,862, $ 10,000, May17 $ 1,380, Jun17 $ 1,419, Jul17 $ 1,237, Aug17 $ 1,550, Sep17 $ 2,438, $ 10,000, Oct17 $ 10,101, $ 15,000, Nov17 $ 1,323, Dec17 $ Jan18 $ Feb18 $ Mar18 $ 1,347, Apr18 $ 8,862, $ 10,000, May18 $ 1,380, Jun18 $ 1,419, Jul18 $ 1,237, Aug18 $ 1,550, Sep18 $ 2,438, $ 10,000, Oct18 $ 10,101, Nov18 $ 1,323, Dec18 $ Orange Shaded Area Represents the Core Position = $50 MM Maximum=2years 47
48 Results of Sample Analysis Initially, Portfolio was excessively liquid and yield was only slightly higher than Pools New Portfolio addresses all maturity needs for at least a year and builds in a Core Component Portfolio remains significantly liquid to address any unanticipated needs As Portfolio matures, the Ladder will continue to roll 48
49 How Will Cash Flow Analysis Enhance Your Management? You will better understand your organization s cash flows You will be able to improve yields by not being too liquid You will be more comfortable with the investment strategy knowing that cash flow needs are covered for a longer period of time 49
50 Questions? Emily A. Upshaw, CPA (512) Office Susan K. Anderson (830) Office 50
Mechanics of Cash Flow Forecasting
 Texas Association Of State Senior College & University Business Officers July 13, 2015 Mechanics of Cash Flow Forecasting Susan K. Anderson, CEO Anderson Financial Management, L.L.C. 130 Pecan Creek Drive
Executive Summary. July 17, 2015
 Executive Summary July 17, 2015 The Revenue Estimating Conference adopted interest rates for use in the state budgeting process. The adopted interest rates take into consideration current benchmark rates
Key IRS Interest Rates After PPA
 Key IRS Interest After PPA (updated upon release of figures in IRS Notice usually by the end of the first full business week of the month) Below are Tables I, II, and III showing official interest rates
Key IRS Interest Rates After PPA
 Key IRS Rates - After PPA - thru 2011 Page 1 of 10 Key IRS Interest Rates After PPA (updated upon release of figures in IRS Notice usually by the end of the first full business week of the month) Below
XML Publisher Balance Sheet Vision Operations (USA) Feb-02
 Feb-02") Page:1 Apr-01 May-01 Jun-01 Jul-01 ASSETS Current Assets Cash and Short Term Investments 15,862,304 51,998,607 9,198,226 Accounts Receivable - Net of Allowance 2,560,786
Page:1 Apr-01 May-01 Jun-01 Jul-01 ASSETS Current Assets Cash and Short Term Investments 15,862,304 51,998,607 9,198,226 Accounts Receivable - Net of Allowance 2,560,786
TERMS OF REFERENCE FOR THE INVESTMENT COMMITTEE
 I. PURPOSE The purpose of the Investment Committee (the Committee ) is to recommend to the Board the investment policy, including the asset mix policy and the appropriate benchmark for both ICBC and any
Review of Registered Charites Compliance Rates with Annual Reporting Requirements 2016
 Review of Registered Charites Compliance Rates with Annual Reporting Requirements 2016 October 2017 The Charities Regulator, in accordance with the provisions of section 14 of the Charities Act 2009, carried
Spheria Australian Smaller Companies Fund
 29-Jun-18 $ 2.7686 $ 2.7603 $ 2.7520 28-Jun-18 $ 2.7764 $ 2.7681 $ 2.7598 27-Jun-18 $ 2.7804 $ 2.7721 $ 2.7638 26-Jun-18 $ 2.7857 $ 2.7774 $ 2.7690 25-Jun-18 $ 2.7931 $ 2.7848 $ 2.7764 22-Jun-18 $ 2.7771
Financial & Business Highlights For the Year Ended June 30, 2017
 Financial & Business Highlights For the Year Ended June, 17 17 16 15 14 13 12 Profit and Loss Account Operating Revenue 858 590 648 415 172 174 Investment gains net 5 162 909 825 322 516 Other 262 146
Interest Rates. Countrywide Building Society. Saving Data Sheet. Gross (% per annum)
") Interest Rates Gross (% per annum) Countrywide Building Society This is the rate of simple interest earned in a year (before deducting tax). Dividing by 12 gives a good estimate of the monthly rate of
Interest Rates Gross (% per annum) Countrywide Building Society This is the rate of simple interest earned in a year (before deducting tax). Dividing by 12 gives a good estimate of the monthly rate of
Department of Public Welfare (DPW)
") Department of Public Welfare (DPW) Office of Income Maintenance Electronic Benefits Transfer Card Risk Management Report Out-of-State Residency Review FISCAL YEAR 2014-2015 September 2014 (June, July and
Department of Public Welfare (DPW) Office of Income Maintenance Electronic Benefits Transfer Card Risk Management Report Out-of-State Residency Review FISCAL YEAR 2014-2015 September 2014 (June, July and
Annual Investment Report
 Annual Investment Report Snyder Independent School District As of August 31, 2013 Snyder Independent School District Annual Investment Report As of August 31, 2013 In addition to monthly investment reports
Annual Investment Review Alief Independent School District Board Meeting January 17, 2017
 Annual Investment Review Alief Independent School District Board Meeting January 17, 2017 Investment Policy Summary Public Funds Investment Act provides the framework for Board policies related to investments
Foundations of Investing
 www.edwardjones.com Member SIPC Foundations of Investing 1 5 HOW CAN I STAY ON TRACK? 4 HOW DO I GET THERE? 1 WHERE AM I TODAY? MY FINANCIAL NEEDS 3 CAN I GET THERE? 2 WHERE WOULD I LIKE TO BE? 2 Develop
Constructing a Cash Flow Forecast
 Constructing a Cash Flow Forecast Method and Worked Example A cash flow forecast shows the estimates of the timing and amounts of cash inflows and outflows over a period of time. The sections of a cash
QUESTION 2. QUESTION 3 Which one of the following is most indicative of a flexible short-term financial policy?
 QUESTION 1 Compute the cash cycle based on the following information: Average Collection Period = 47 Accounts Payable Period = 40 Average Age of Inventory = 55 QUESTION 2 Jan 41,700 July 39,182 Feb 18,921
Big Walnut Local School District
 Big Walnut Local School District Monthly Financial Report for the month ended September 30, 2013 Prepared By: Felicia Drummey Treasurer BIG WALNUT LOCAL SCHOOL DISTRICT SUMMARY OF YEAR TO DATE FINANCIAL
PRESS RELEASE. Securities issued by Hungarian residents and breakdown by holding sectors. October 2018
 PRESS RELEASE 10 December 2018 Securities issued by Hungarian residents and breakdown by holding sectors October 2018 According to securities statistics, the amount outstanding of equity securities and
Hypothetical Illustration
 Hypothetical Illustration February 17, 2003 Mutual Fund American Funds Balanced A American Funds Gr Fnd of America A American Funds Intm Bd Fd Amer A Index Thomson US: Aggressive Growth - MF Thomson US:
WESTWOOD LUTHERAN CHURCH Summary Financial Statement YEAR TO DATE - February 28, Over(Under) Budget WECC Fund Actual Budget
 Budget WECC Fund Actual Budget") WESTWOOD LUTHERAN CHURCH Summary Financial Statement YEAR TO DATE - February 28, 2018 General Fund Actual A B C D E F WECC Fund Actual Revenue Revenue - Faith Giving 1 $ 213 $ 234 $ (22) - Tuition $ 226
WESTWOOD LUTHERAN CHURCH Summary Financial Statement YEAR TO DATE - February 28, 2018 General Fund Actual A B C D E F WECC Fund Actual Revenue Revenue - Faith Giving 1 $ 213 $ 234 $ (22) - Tuition $ 226
Asset Manager Performance Comparison
 Cape Peninsula University of Technology Retirement Fund August 2017 DISCLAIMER AND WARNINGS: Towers Watson (Pty) Ltd, a Willis Towers Watson company, is an authorised financial services provider. Although
Orange Unified School District
 Orange Unified School District Financing Information Ron Lebs Assistant Superintendent, Facilities and Planning Orange Unified School District Tel: 714.628.4500 rlebs@orangeusd.org Adam Bauer Chief Executive
Asset Manager Performance Comparison
 Cape Peninsula University of Technology Retirement Fund September 2017 DISCLAIMER AND WARNINGS: Towers Watson (Pty) Ltd, a Willis Towers Watson company, is an authorised financial services provider. Although
Alief Independent School District Board Meeting January 23, Annual Investment Review
 Alief Independent School District Board Meeting January 23, 2018 Annual Investment Review Investment Policy Summary Public Funds Investment Act provides the framework for Board policies related to investments
Looking at a Variety of Municipal Valuation Metrics
 Looking at a Variety of Municipal Valuation Metrics Muni vs. Treasuries, Corporates YEAR MUNI - TREASURY RATIO YEAR MUNI - CORPORATE RATIO 200% 80% 175% 150% 75% 70% 65% 125% Average Ratio 0% 75% 50% 60%
Regional overview Gisborne
 Regional overview Purchasing intentions - additional income-related rent subsidy (IRRS) places Area District 1 2 3 4+ TOTAL 3 35 5 7 total 3 35 5 7 7 8 9 1 11 Purchasing intentions - change within the
Ohlone Community College District
 Ohlone Community College District General Obligation Bond Refinancing Overview June 8, 2016 Outstanding General Obligation Bonds Issue Date Issue Amount Description Call Date Maturity Outstanding 6/19/2002
What s new in LDI Expanding the toolkit
 Pensions Conference 2012 Steven Catchpole What s new in LDI Expanding the toolkit 1 June 2012 Introduction The LDI toolkit is expanding Several new tools are becoming more common: Swaptions Gilt total
Cost Estimation of a Manufacturing Company
 Cost Estimation of a Manufacturing Company Name: Business: Date: Economics of One Unit: Manufacturing Company (Only complete if you are making a product, such as a bracelet or beauty product) Economics
Regional overview Hawke's Bay
 Regional overview Purchasing intentions - additional income-related rent subsidy (IRRS) places Area Hastings Central 1 2 3 4+ TOTAL 5 5 25 125 3 3 1 7 total 8 8 35 195 7 8 9 1 11 Purchasing intentions
Section 6621 of the Internal Revenue Code establishes the interest rates on
 Part 1 Section 6621.--Determination of Rate of Interest 26 CFR 301.6621-1: Interest rate. Rev. Rul. -32 Section 6621 of the Internal Revenue Code establishes the interest rates on overpayments and underpayments
PRESS RELEASE. Securities issued by Hungarian residents and breakdown by holding sectors. January 2019
 7 March 2019 PRESS RELEASE Securities issued by Hungarian residents and breakdown by holding sectors January 2019 According to securities statistics, the amount outstanding of equity securities and debt
Section 6621(c) provides that for purposes of interest payable under 6601 on any large corporate underpayment, the underpayment
 provides that for purposes of interest payable under 6601 on any large corporate underpayment, the underpayment") Section 6621. Determination of Interest Rate 26 CFR 301.6621 1: Interest rate. Interest rates; underpayments and overpayments. The rate of interest determined under section 6621 of the Code for the calendar
Section 6621. Determination of Interest Rate 26 CFR 301.6621 1: Interest rate. Interest rates; underpayments and overpayments. The rate of interest determined under section 6621 of the Code for the calendar
CITI Bank Bangkok branch. Set B Capital Item1 Capital Structure Table 2 Capital of Foreign Banks Branchs Unit : THB. Item June 30, 2009
 CITI Bank Bangkok branch Set B Capital Item1 Capital Structure Table 2 Capital of Foreign Banks Branchs Unit : THB Item June 30, 20 1 Assets required to be maintained under Section 32 17,753,449,882.45
Capturing equity gains whilst protecting portfolios
 Capturing equity gains whilst protecting portfolios Edward Park Q2 2018 MSCI North America Total Return in USD (2017 Discrete Calendar Months) 4.00% 3.50% 3.00% 2.50% 2.00% 1.50% 1.00% 0% 0.00% Jan-17
Development of Economy and Financial Markets of Kazakhstan
 Development of Economy and Financial Markets of Kazakhstan National Bank of Kazakhstan Macroeconomic development GDP, real growth, % 116 112 18 14 1 113,5 11,7 216,7223,8226,5 19,8 19,8 19,3 19,619,7 199,
Media Release 9 th March 2015
 Media Release 9 th March 2015 Index declines as positive feeling towards government policy on saving fades More than half of consumers dissatisfied with the amount they save The Nationwide UK (Ireland)
PHOENIX ENERGY MARKETING CONSULTANTS INC. HISTORICAL NATURAL GAS & CRUDE OIL PRICES UPDATED TO July, 2018
 Jan-01 $12.9112 $10.4754 $9.7870 $1.5032 $29.2595 $275.39 $43.78 $159.32 $25.33 Feb-01 $10.4670 $7.8378 $6.9397 $1.5218 $29.6447 $279.78 $44.48 $165.68 $26.34 Mar-01 $7.6303 $7.3271 $5.0903 $1.5585 $27.2714
Division of Bond Finance Interest Rate Calculations. Revenue Estimating Conference Interest Rates Used for Appropriations, including PECO Bond Rates
 Division of Bond Finance Interest Rate Calculations Revenue Estimating Conference Interest Rates Used for Appropriations, including PECO Bond Rates November 16, 2018 Division of Bond Finance Calculation
Choosing a Cell Phone Plan-Verizon Investigating Linear Equations
 Choosing a Cell Phone Plan-Verizon Investigating Linear Equations I n 2008, Verizon offered the following cell phone plans to consumers. (Source: www.verizon.com) Verizon: Nationwide Basic Monthly Anytime
Investing for Small Governments
 Tuesday MAY, 23 2017 10:20AM 12PM Investing for Small Governments MODERATOR SPEAKERS Al Rolek Finance Director, River Falls, WI John Grady Managing Director, Public Trust Advisors Darrel Thomas Assistant
Affordable Care Act Implementation Alert
 CONTENTS > What is the PCORI Fee? What is the purpose of the PCORI fee? > What are the reporting and payment requirements? > How is the PCORI fee calculated? > What is the role of AmeriHealth Administrators?
PRESS RELEASE. Securities issued by Hungarian residents and breakdown by holding sectors. April 2016
 10 June 2016 PRESS RELEASE Securities issued by Hungarian residents and breakdown by holding sectors April 2016 According to securities statistics data, the amount outstanding of equity securities and
Factor Leave Accruals. Accruing Vacation and Sick Leave
 Factor Leave Accruals Accruing Vacation and Sick Leave Factor Leave Accruals As part of the transition of non-exempt employees to biweekly pay, the UC Office of the President also requires standardization
CITY OF LAGUNA NIGUEL ANNUAL INVESTMENT REPORT
 CITY OF LAGUNA NIGUEL ANNUAL INVESTMENT REPORT Fiscal Year Ended June 30, 2017 Prepared by: Stephen Erlandson Director of Finance/City Treasurer Annual Investment Report Table of Contents Portfolio Performance
Common stock prices 1. New York Stock Exchange indexes (Dec. 31,1965=50)2. Transportation. Utility 3. Finance
2. Transportation. Utility 3. Finance") Digitized for FRASER http://fraser.stlouisfed.org/ Federal Reserve Bank of St. Louis 000 97 98 99 I90 9 9 9 9 9 9 97 98 99 970 97 97 ""..".'..'.."... 97 97 97 97 977 978 979 980 98 98 98 98 98 98 987 988
Digitized for FRASER http://fraser.stlouisfed.org/ Federal Reserve Bank of St. Louis 000 97 98 99 I90 9 9 9 9 9 9 97 98 99 970 97 97 ""..".'..'.."... 97 97 97 97 977 978 979 980 98 98 98 98 98 98 987 988
1.2 The purpose of the Finance Committee is to assist the Board in fulfilling its oversight responsibilities related to:
 Category: BOARD PROCESS Title: Terms of Reference for the Finance Committee Reference Number: AB-331 Last Approved: February 22, 2018 Last Reviewed: February 22, 2018 1. PURPOSE 1.1 Primary responsibility
OTHER DEPOSITS FINANCIAL INSTITUTIONS DEPOSIT BARKAT SAVING ACCOUNT
 WEIGHTAGES JAN FEB MAR APR MAY JUN JUL AUG SEPT OCT NOV DEC ANNOUNCEMENT DATE 19.Dez.14 27.Jän.15 24.Feb.15 26.Mär.15 27.Apr.15 26.Mai.15 25.Jun.15 28.Jul.15 26.Aug.15 23.Sep.15 27.Okt.15 25.Nov.15 MUDARIB
Beginning Date: January 2016 End Date: June Managers in Zephyr: Benchmark: Morningstar Short-Term Bond
 Beginning Date: January 2016 End Date: June 2018 Managers in Zephyr: Benchmark: Manager Performance January 2016 - June 2018 (Single Computation) 11200 11000 10800 10600 10400 10200 10000 9800 Dec 2015
HUD NSP-1 Reporting Apr 2010 Grantee Report - New Mexico State Program
 HUD NSP-1 Reporting Apr 2010 Grantee Report - State Program State Program NSP-1 Grant Amount is $19,600,000 $9,355,381 (47.7%) has been committed $4,010,874 (20.5%) has been expended Grant Number HUD Region
QUARTERLY REPORT AND CERTIFICATION OF THE COUNTY TREASURER For Quarter Ending June 30, 2009 COMPLIANCE CERTIFICATION
 QUARTERLY REPORT AND CERTIFICATION OF THE COUNTY TREASURER For Quarter Ending June 30, 2009 The Government Code requires the County Treasurer to render a Quarterly Report to the County Administrator, the
Beginning Date: January 2016 End Date: September Managers in Zephyr: Benchmark: Morningstar Short-Term Bond
 Beginning Date: January 2016 End Date: September 2018 Managers in Zephyr: Benchmark: Manager Performance January 2016 - September 2018 (Single Computation) 11400 - Yorktown Funds 11200 11000 10800 10600
Performance Report October 2018
 Structured Investments Indicative Report October 2018 This report illustrates the indicative performance of all Structured Investment Strategies from inception to 31 October 2018 Matured Investment Strategies
Asset Liability Management Report 4 Q 2018
 Asset Liability Management Report 4 Q 2018 Performance Indicators and Key Measures Cash, Investment and Debt Balances Book Value ($M) Restricted Cash and Investments 529.8 Unrestricted Cash and Investments
HIPIOWA - IOWA COMPREHENSIVE HEALTH ASSOCIATION Unaudited Balance Sheet As of July 31
 Unaudited Balance Sheet As of July 31 Total Enrollment: 407 Assets: Cash $ 9,541,661 $ 1,237,950 Invested Cash 781,689 8,630,624 Premiums Receivable 16,445 299,134 Prepaid 32,930 34,403 Assessments Receivable
Nonfarm Payroll Employment
 PRESIDENT'S REPORT TO THE BOARD OF DIRECTORS, FEDERAL RESERVE BANK OF BOSTON Current Economic Developments - June 10, 2004 Data released since your last Directors' meeting show the economy continues to
HIPIOWA - IOWA COMPREHENSIVE HEALTH ASSOCIATION Unaudited Balance Sheet As of January 31
 Unaudited Balance Sheet As of January 31 Total Enrollment: 371 Assets: Cash $ 1,408,868 $ 1,375,117 Invested Cash 4,664,286 4,136,167 Premiums Receivable 94,152 91,261 Prepaid 32,270 33,421 Assessments
TD Securities 2011 Calgary Unconventional Energy Conference July 7, Dawn Farrell Chief Operating Officer
 TD Securities 2011 Calgary Unconventional Energy Conference July 7, 2011 Dawn Farrell Chief Operating Officer 1 Forward looking statements This presentation may contain forward looking statements, including
FERC EL Settlement Agreement
 FERC EL05-121-009 Settlement Agreement Ray Fernandez Manager, Market Settlements Development Market Settlements Subcommittee June 14, 2018 Settlement Agreement Details Settlement Agreement Details FERC
Business & Financial Services December 2017
 Business & Financial Services December 217 Completed Procurement Transactions by Month 2 4 175 15 125 1 75 5 2 1 Business Days to Complete 25 Jan Feb Mar Apr May Jun Jul Aug Sep Oct Nov Dec 217 Procurement
BUTTE COUNTY TREASURY OVERSIGHT COMMITTEE
 BUTTE COUNTY TREASURY OVERSIGHT COMMITTEE 25 County Center Drive, Ste 125 Oroville, CA 95965 Lisa Anderson, BCOE Director of Fiscal Services, Superintendent of Schools Representative David A. Houser, Butte
City of El Segundo Office of the City Treasurer
 City of El Segundo Office of the City Treasurer Date: September 15, 2015 From: Office of the City Treasurer To: El Segundo City Council RE: Investment Portfolio Report As of June 30, 2015 Introduction:
Investit Software Inc. INVESTOR PRO CANADA 20 UNIT CONDOMINIUM DEVELOPMENT EXAMPLE
 INVESTOR PRO CANADA 20 UNIT CONDOMINIUM DEVELOPMENT EXAMPLE INTRODUCTION This example uses the Development Condominium template. This practice example consists of two Sections; 1. The input information
Voya Indexed Universal Life-Protector
 calculation examples Values as of 07/28/2018 Voya ed Universal Life-Protector Issued by Security Life of Denver Insurance Company Required training! VFA Registered Representatives must review the Required
1 Long Term Debt $ 9,298,554 $ (250,000) $ 9,048, Preferred Stock 30,450 30, % 5 Common Equity 250, %
 $ 9,048, Preferred Stock 30,450 30, % 5 Common Equity 250, %") SUMMARY SCHEDULE ($000'S) Schedule 1 Page 1 of 1 Line Capitalization HISTORICAL YEAR ENDED 12/31/16 Hybrid Percent Equity Adjusted of Total Cost of Cost of Amount Adjustment Amount Capitalization Capital
SUMMARY SCHEDULE ($000'S) Schedule 1 Page 1 of 1 Line Capitalization HISTORICAL YEAR ENDED 12/31/16 Hybrid Percent Equity Adjusted of Total Cost of Cost of Amount Adjustment Amount Capitalization Capital
PRESS RELEASE. Securities issued by Hungarian residents and breakdown by holding sectors. October 2017
 11 December 2017 PRESS RELEASE Securities issued by Hungarian residents and breakdown by holding sectors October 2017 According to securities statistics, the amount outstanding of equity securities and
City of Justin NOVEMBER
 City of Justin MONTHLY FINANCIAL REPORT NOVEMBER - 2018 1 Revenues: Sales tax revenue is up 14.5% from this time prior year and November s sales tax collections increased 2.4% from November 2017. The City
Savings Index maintains momentum in January
 Media Release Tuesday 10 th February 2015 Savings Index maintains momentum in January The Nationwide UK (Ireland) / ESRI Savings Index, which measures overall sentiment towards saving in Ireland, increased
Regional overview Auckland
 Regional overview Purchasing intentions - additional income-related rent subsidy (IRRS) places Area North West Central South 1 2 3 4+ TOTAL 8 4 5 125 16 2 9 7 52 25 185 8 3 545 2 28 13 1 71 total 69 75
2009 Reassessment As Impacted by Senate Bill 711
 Saint Louis County 2009 Reassessment As Impacted by Senate Bill 711 Impacts of SB711 on the 2009 Reassessment Plan The County must notify property owners of changes in the projected tax liability resulting
THE B E A CH TO WN S O F P ALM B EA CH
 THE B E A CH TO WN S O F P ALM B EA CH C OU N T Y F LO R I D A August www.luxuryhomemarketing.com PALM BEACH TOWNS SINGLE-FAMILY HOMES LUXURY INVENTORY VS. SALES JULY Sales Luxury Benchmark Price : 7,
Security Analysis: Performance
 Security Analysis: Performance Independent Variable: 1 Yr. Mean ROR: 8.72% STD: 16.76% Time Horizon: 2/1993-6/2003 Holding Period: 12 months Risk-free ROR: 1.53% Ticker Name Beta Alpha Correlation Sharpe
TR-1: Standard form for notification of major holdings
 TR-1: Standard form for notification of major holdings NOTIFICATION OF MAJOR HOLDINGS (to be sent to the relevant issuer and to the FCA in Microsoft Word format if possible) i 1a. Identity of the issuer
CITY OF CORINTH QUARTERLY INVESTMENT REPORT For Quarter Ending March 31, 2017
 CITY OF CORINTH QUARTERLY INVESTMENT REPORT For Quarter March 31, 2017 % of Security Type Mkt to Book Par Value U. S. Federal Agency-Coupon 99.85% $ 7,092,000 $ 7,097,785 $ 7,086,910 U.S. Federal Agency
Balance-of-Period TCC Auction
 Balance-of-Period TCC Auction Proposed Credit Policy Sheri Prevratil Manager, Corporate Credit New York Independent System Operator Credit Policy Working Group May 29, 2015 2000-2015 New York Independent
TR-1: Standard form for notification of major holdings
 TR-1: Standard form for notification of major holdings NOTIFICATION OF MAJOR HOLDINGS (to be sent to the relevant issuer and to the FCA in Microsoft Word format if possible) i 1a. Identity of the issuer
TR-1: Standard form for notification of major holdings
 TR-1: Standard form for notification of major holdings NOTIFICATION OF MAJOR HOLDINGS (to be sent to the relevant issuer and to the FCA in Microsoft Word format if possible) i 1a. Identity of the issuer
Mitchell Electric Charitable Fund PO Box 409 Camilla, GA (229) or FAX:
 or FAX:") Mitchell Electric Charitable Fund PO Box 409 Camilla, GA 31730 (229) 336-5221 or 1-800-479-6034 FAX: 229-336-7088 For Office use only: Agency / Organization Application All attached sheets, including financial
Mitchell Electric Charitable Fund PO Box 409 Camilla, GA 31730 (229) 336-5221 or 1-800-479-6034 FAX: 229-336-7088 For Office use only: Agency / Organization Application All attached sheets, including financial
ANNUAL INVESTMENT REPORT
 NORTH EAST I.S.D. ANNUAL INVESTMENT REPORT for the year ended June 30, 2010 2009-2010 ANNUAL INVESTMENT REPORT Tab: Title Revised 9/9/2010 i TABLE OF CONTENTS Review of Activities 1 Investment Controls
Big Walnut Local School District
 Big Walnut Local School District Monthly Financial Report for the month ended September 30, 2012 Prepared By: Felicia Drummey Treasurer BIG WALNUT LOCAL SCHOOL DISTRICT SUMMARY OF YEAR-TO-DATE FINANCIAL
FINANCIAL MANAGEMENT STRATEGY REPORT ON OUTCOMES FOR THE YEAR ENDED MARCH 31, 2016
 FINANCIAL MANAGEMENT STRATEGY REPORT ON OUTCOMES FOR THE YEAR ENDED MARCH 31, 2016 Manitoba Finance General Inquiries: Room 109, Legislative Building Winnipeg, Manitoba R3C 0V8 Phone: 204-945-5343 Fax:
Analyze the Market for a Seasonal Bias. It is recommended never to buck the seasonal nature of a market. What is a Seasonal Trend?
 The seasonal trend in a market is our way of taking the fundamental price action of a market...and then chart it year-by-year. Analyze the Market for a Seasonal Bias STEP 5 Using Track n Trade Pro charting
Using a Market Value Concept to Facilitate Negotiation of Alternative Price Formulas. 6 December 2006 Kaoru Kawamoto Osaka Gas Co.
 Using a Market Value Concept to Facilitate Negotiation of Alternative Price Formulas 6 December 2006 Kaoru Kawamoto Osaka Gas Co., Ltd Table of Contents 1. Background 2. Definition and Methodology Defining
MEDICAID FEDERAL SHARE OF MATCHING FUNDS
 MEDICAID FEDERAL SHARE OF MATCHING FUNDS revised by EDR based on FFIS Estimated for FFY 2019 August 3, 2017 Effective State Budget Year State adopted February 2017 State State FY real Difference in state
Isle Of Wight half year business confidence report
 half year business confidence report half year report contents new company registrations closed companies (dissolved) net company growth uk company share director age director gender naming trends sic
Absolute Return Fixed Income: Taking A Different Approach
 August 2015 Absolute Return Fixed Income: Taking A Different Approach Executive Summary Historically low global fixed income yield levels present a conundrum for today s fixed income investors. Increasing
TR-1: Standard form for notification of major holdings
 TR-1: Standard form for notification of major holdings NOTIFICATION OF MAJOR HOLDINGS (to be sent to the relevant issuer and to the FCA in Microsoft Word format if possible) i 1a. Identity of the issuer
Looking to the medium term
 Looking to the medium term Issued: 4 September 2013 Legal notice This presentation has been prepared to inform investors and prospective investors in the secondary markets about the Group and does not
TR-1: Standard form for notification of major holdings
 TR-1: Standard form for notification of major holdings NOTIFICATION OF MAJOR HOLDINGS (to be sent to the relevant issuer and to the FCA in Microsoft Word format if possible) i 1a. Identity of the issuer
Algo Trading System RTM
 Year Return 2016 15,17% 2015 29,57% 2014 18,57% 2013 15,64% 2012 13,97% 2011 55,41% 2010 50,98% 2009 48,29% Algo Trading System RTM 89000 79000 69000 59000 49000 39000 29000 19000 9000 2-Jan-09 2-Jan-10
Aon Hewitt. Facts & Figures. December 2014 Update. Risk. Reinsurance. Human Resources. Empower Results
 Aon Hewitt Facts & Figures Risk. Reinsurance. Human Resources. Empower Results In this document... Facts & Figures Contents Financial Markets 3 6 > jump to Earnings and Inflation 7 > jump to Miscellaneous
Aon Hewitt. Facts & Figures. July 2017 Update. Risk. Reinsurance. Human Resources. Empower Results
 Aon Hewitt Facts & Figures Risk. Reinsurance. Human Resources. Empower Results Facts & Figures Contents In this document... This button normally prints the whole document. If you want to print just the
Egg Entrepreneurship Records
 Egg Entrepreneurship Records Name 4-H Program Year PROJECT GOAL Setting goals and then checking progress on the attainment of those goals is an important part of 4-H. Complete the boxes 1-3 at the beginning
- Victor Haghani, Founder Elm. Watch the full talk here
 "After more than 20 years in finance, from the LSE to Salomon Brothers to LTCM, you d have thought that I d have figured out how to invest my family s savings. Well, it was 2002, I just turned 40, and
Palm Beach County School District
 Palm Beach County School District Investment Performance Review Quarter Ended March 31, 2008 Investment Advisors Steven Alexander, CTP, CGFO, Managing Director 300 S. Orange Avenue, Suite 1170 Orlando,
Cash & Liquidity The chart below highlights CTA s cash position at December 2017 compared to December 2016.
 To: Chicago Transit Authority Board From: Jeremy Fine, Chief Financial Officer Re: Financial Results for December 2017 Date: February 14, 2018 I. Summary CTA s financial results are $4.7 million favorable
Cash & Liquidity The chart below highlights CTA s cash position at March 2017 compared to March 2016.
 To: Chicago Transit Authority Board From: Jeremy Fine, Chief Financial Officer Re: Financial Results for March 2017 Date: May 10, 2017 I. Summary CTA s financial results are $0.6 million favorable to budget
Investing for now and the future. Co-opTrust Investment Services Presentation by Lydia Muchiri 26 June 2010
 Investing for now and the future Co-opTrust Investment Services Presentation by Lydia Muchiri 26 June 2010 Outline Saving vs Investing Key Considerations before starting Stages of life and investing Set
Cash & Liquidity The chart below highlights CTA s cash position at September 2017 compared to September 2016.
 To: Chicago Transit Authority Board From: Jeremy Fine, Chief Financial Officer Re: Financial Results for September 2017 Date: November 15, 2017 I. Summary CTA s financial results are $7.7 million favorable
LPFA Monthly Solvency Report as at 29 September 2017 Final Month End Data
 LPFA Monthly Solvency Report as at 29 September 2017 Final Month End Data Purpose and summary This report is prepared for the LPFA Board. It provides an up to date estimate of funding level and sets out