Investor day -12 November 2015-
|
|
|
- Jade Wood
- 6 years ago
- Views:
Transcription


1 Investor day -12 November 2015-
2 1 UPDATE Q3


3 In many ways 2015 marks a turning point After six years of negative revaluations, half year results 2015 finally showed a positive valuation in the Dutch offices market Partial divestment of IOW freed up funds and turned focus fully on the Netherlands Turning into investment mode with recently announced high quality acquistions Strong take-up continued Ready for next phase in financing strategy The overall Dutch economic climate is improving and economic growth is projected to strengthen further Increased EPS outlook 3
4 Strong operational performance continued Offices NL* HNK Retail Q Q Q Q Q Q Q Occupancy rate 72.1% 71.7% 72.4% 67.6% 62.3% 86.6% 87.1% Take-up (sqm) 16,226 12,987 8,733 7,898 2,782 1,643 1,738 Take up/ supply rate 33% 25% 17% 44% 32% 19% 19% Effective Rent new leases (12 months) Effective Rent total portfolio WAULT 3.7 years 3.6 years 3.6 years 2.7 years 2.8 years 4.6 years 4.4 years * Including HNK 4
5 2 ASSET ROTATION UPDATE
6 (I) ACQUISITION OFFICE PROPERTIES IN 2015 COBRA PORTFOLIO: In October 2015 NSI acquired the Cobra portfolio for million on a gross yield K.K of approx. 8%; The Cobra portfolio consists of 7 office properties with 56,509 sqm s (occupancy 97%) and a WAULT of approx. 7 years; 4 assets in Amsterdam; 2 assets in Rotterdam; 1 asset in Den Bosch. LEIDEN BSC: In October 2015 NSI also acquired a office building in Leiden on Leiden Bio Science Park for 15.4 million on a gross yield K.K. of approx. 10%; 9,418 sq m, occupancy 100% and a WAULT (break date) of 4.2 years.

 14.4 Occupancy: 100% WAULT (yrs) 7.")

 4.8 WAULT (yrs) 6.0 Occupancy: 98.")
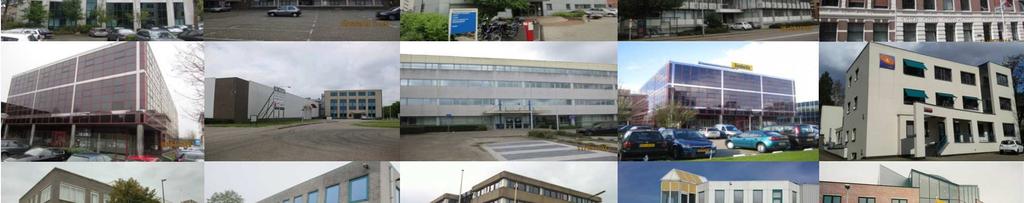
7 (I) ACQUISITION OFFICE PROPERTIES IN Vivaldi 1 2 Vivaldi 2 Location: Amsterdam South-Axis Location: Amsterdam South-Axis Total size: 9,592 sq m Total size: 8,687 sq m Passing rent: 2.4 mio Passing rent: 2.3 mio WAULT (yrs) 14.4 Occupancy: 100% WAULT (yrs) 7.1 Occupancy: 100% Tenure Single tenant Tenure Single tenant 3 Centerpoint 1 4 Centerpoint 2 Location: Amsterdam South-East Location: Amsterdam South-East Total size: 9,011 sq m Total size: 6,249 sq m Passing rent: 1.9 mio Passing rent: 1.3 mio WAULT (yrs) 4.8 WAULT (yrs) 6.0 Occupancy: 98.9% Occupancy: 100% Tenure Multi tenant Tenure Single tenant 4 assets in Amsterdam

 3.")

 5.9 WAULT (yrs) 4.5 (break-date) Occupancy: 90.")
8 (I) ACQUISITION OFFICE PROPERTIES IN Alexanderpoort 6 Alexanderhof Location: Rotterdam Alexander Location: Rotterdam Alexander Total size: 9,408 sq m Total size: 3,120 sq m Passing rent: 1.5 mio Passing rent: 0.5 mio WAULT (yrs) 3.1 Occupancy: 88.5% WAULT (yrs) 3.0 Occupancy: 94% Tenure Multi tenant Tenure Multi tenant 7 het Binnenhof 8 Ypsilon Location: Den Bosch, Paleiskwartier Location: Leiden, Bio Science Park Total size: 10,442 sq m Total size: 9,418 sq m Passing rent: 1.5 mio Passing rent: 1.6 mio WAULT (yrs) 5.9 WAULT (yrs) 4.5 (break-date) Occupancy: 90.6% Occupancy: 100% Tenure Multi tenant Tenure Single tenant 2 assets in Rotterdam 1 asset in Den Bosch 1 asset in Leiden


9 (II) SOLD 22 ASSETS IN 2015
10 (II) SOLD 22 ASSETS IN 2015 leased occ. Sold & deliverd in 2015 sq m sq m ( in %) Uraniumweg 23, Amersfoort 6,658-0% Hettenheuvelweg 12, Amsterdam 2,347-0% Hettenheuvelweg 14, Amsterdam 2, % Paasheuvelweg 15, Amsterdam 1, % Rivium Boulevard , Capelle a/d Ijssel 1, % Keulenstraat 6, Deventer 3,571 1,579 44% Snipperlingsdijk, Deventer 1, % Hanzeweg 5, Gouda 5,855-0% Adelbert van Scharnlaan , Maastricht 3, % Touwslagerstraat 17, Ridderkerk 1,711-0% Volmerlaan 7, Rijswijk 5,499-0% Van Houten Industriepark 23, Weesp 1, % Zaagmolenlaan 12, Woerden 1, % Engelanlaan , Zoetermeer 2,681 1,315 53% Bovendonk, Roosendaal 3,361 3, % Villawal, Nieuwegein 5,783 2,455 52% Nieuwe Steen 27, Hoorn 1,747-0% Karel du Jardinstraat 65, Amsterdam 6,107-0% Cairostraat, Rotterdam 2,550-0% Hardwareweg, Amersfoort 5,858-0% Kanaalweg 95, Utrecht % Montaubanstraat 1, Zeist 1, % Total of 22 assets 70,524 25%


11 (III) ASSET ROTATION OFFICES IN 2015 Date: 1 November 2015
12 (III) ASSET ROTATION OFFICES IN 2015 ASSET ROTATION NSI Offices Acquisitions Dispositions NSI Offices ( ) ( ) Transaction price k.k. 158,925,000 Real estate investments 561,300, ,600,000 35,536, ,689,000 Passing rent (in p.y.) 54,659,000 12,987,554 1,712,490 65,934,064 Yield on Passing rental income 9.7% 8.2% 4.8% 9.5% Nr. of assets Total Sq m 596,459 65,927 70, ,862 Average size per assets 4,003 8,241 3,206 4,384 Occupancy ( in %) 71.8% 97.1% 25.0% 75.7% NSI active in nr cities
13 (III) ASSET ROTATION OFFICES IN 2015 Allocation NSI Office port. (% of real estate investments) 60% 50% 18 Target cities in NL, minus G4 40% 30% 20% 10% 0% 13% 25% 10% 8% 16% 16% G4: Amsterdam G4: Den Haag G4: Rotterdam G4: Utrecht G4 Target cities (-G4) 3% 3% 43% % 27% 27% 30% 21% Other

14 Progressing towards 2016 targets Dutch offices 41% 52% 65% 70% 56% 48% 35% 30% Target 2016 Financial Occupancy 72.1% 71.5% 75.7% >80% # HNK JLL prop. quality score 49.0% 49.3% 57.5% >55% 14
15 15 3 FINANCE
16 Funding strategy Envisioned development of NSI s funding structure Starting point (13Q3) Current (15Q3) Next steps Secured bilateral and syndicated asset-based bank financing Secured syndicated corporate bank financing ~ 70% Unsecured syndicated corporate bank financing ~ 70% Unsecured syndicated corporate bank financing Secured bilateral assetbased bank financing Conv. bond ~ 15 35% ~ 15% EUPP ~ 15% EUPP ~ 15% USPP Secured bilateral assetbased bank financing ~ 15% Secured bilateral assetbased bank financing ~ 15% EUPP Schuldschein Other ~ 50 70% # Banks # Facilities Including institutional investors. Banks may be lender in multiple facilities 16
17 Development of main treasury KPI s Group Loan-to-Value (LTV) (%) Total Dutch cost of debt and swap interest (%) 70% 65% 60% 55% 50% 45% 40% 0% 59.6% 13Q3-24% Equity issue 45.4% 44.9% 47.8% 47.8% 48.9% 47.7% IOW sale -26% +23% 35.1% 36.6% 14Q1 14Q3 15Q1 15Q3 LTV since Q3-13: -15% (-25%) Cobra <45.0% 15Q3 Adj 4 6,0% 5,5% 5,0% 4,5% 4,0% 3,5% 3,0% 2,5% 2,0% 5.4% 13Q1 5.7% 3.3% 3.2% 5.2% 3.2% 13Q3 5.2% 3.2% 5.1% 3.2% 14Q1 Total swap interest 1 Total cost of debt 2 4.9% 3.4% 4.8% 3.5% 14Q Target cost of debt 5.1% 5.2% 4.9% 4.8% 3.5% 3.4% 15Q1 3.0% Cost of debt since Q2-13: -1.6% (-28%) 3.3% 15Q3 4.1% 3.1% 15Q3 Adj 4 Average Dutch debt maturity (yrs) Total Dutch net debt and LTM interest expenses 3 ( m) 7,0 6,0 5,0 4,0 3,0 2,0 1,0 0, Target average debt maturity +227% Refinancing Q3 14Q1 14Q3 15Q1 15Q3 Average maturity since Q3-13: +1.6 yrs (+60%) 1, Q Q Q Q Q1 Total debt LTM interest expenses Q Q Q3 Total net debt since Q1-13: - 310m (-36%) Interest expense since Q3-13: - 7m (-55%) Q3 Adj Based on swap notional 2. Finance costs on loans and swaps 3. Excluding interest-bearing debt of Intervest Offices / Warehouses 4. Pro forma 13Q3 after acquisitions of Cobra portfolio and Ypsilon building in BioScience Park Leiden 17
18 Next steps in funding KPI 13Q3 Current (15Q3) Target 2017 Loan to Value 45% Approx. 45% 1 40 <50% Average debt maturity 2.6yrs 4.3yrs > 3yrs Cost of debt 4.8% 4.1% 1 < 4.0% Headroom 2 25% > 10% % Due to its improved funding profile, NSI has a number of strategic financing options Strategic financing aims Div Cost Refi Mat Unsec I Move from secured to unsecured financing for 2015 facility II Optimise secured package (Pfandbriefe) III Increase current facility and draw accordion IV Issue of private placement V Issue of convertible bonds Div = Diversification and availability of capital, Cost = Reducing financing cost, Refi = Refinancing risk, Cov = Covenants, Mat = Debt maturity, Unsec = Move to unsecured financing 1. Pro forma 13Q3 after acquisitions of Cobra portfolio and Ypsilon building in BioScience Park Leiden 2. Available firepower at present: 120m. Approx. 70m committed headroom on current RCF and 50m accordion 18
19 4 REDEFINING THE MAP OF THE NETHERLAND
20 INVESTORS DAY Peter Savelberg


21 Netherlands well positioned
22 CITIES G TARGET CITIES 36 JANUARI


23 +2 CITIES G TARGET CITIES NOVEMBER 2015 OTHER CITIES 20%
24 5 NAVIGATING DUTCH FLEXIBLE OFFICE DEMAND

25 Strengthening Decision-making with data Case Which Office building in the portfolio of NSI is most suitable for a HNK location in Eindhoven? Important criteria Market: Size of city / Competition / Vacancy / Take-up volume / Potential tenants Location: Geographical location / Accessibility with public transport & car / Parking facilities / Quality of surroundings / Presence of facilities in de surroundings Building: Size of building / Identity of the building / Quality of the Building
26 RESEARCH DESIGN Research HNK EINDHOVEN? Yes / No Advise Data criteria HNK Importance criteria tenant groups HNK Development data portal Questionnaire HNK Conclusion Analysis


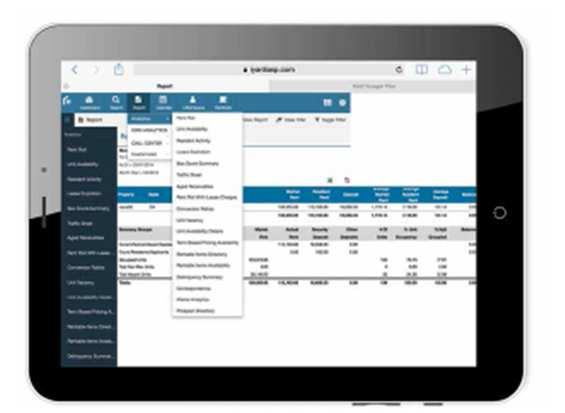
27 Demonstration dataportal External data Market information: DTZ Zadelhoff Company.info KvK, Chamber of Commerce CBS, Statistics Netherlands Internal data Building data portolio NSI hnk.nsi.nl
28 Conclusion HNK Eindhoven Beukenlaan HNK Eindhoven Hooghuisstraat Flex workers Managed Office / startups Tailor made office / mature companies Own floor / large companies 0 HNK Average HNK Eindhoven HNK Eindhoven Beukenlaan Hooghuisstraat


29 Conclusion Beukenlaan Hooghuisstraat Location for mature companies (10+) Close to Strijp S hotspot Good location close to highway and airport Excellent parking possibilities More vacancy Location for young start-ups Many facilities in the surroundings More competition Good location close to the Central train station Excellent parking possibilities Less vacancy
30 HNK Eindhoven next phase investment decision process


31 Business Intelligence: enhancing our commercial effectiveness by using data analytics 31
32 Evolution of our CRM. back in early 2011 datum 10 augustus 2011 aantal contracten 79 Lead Generation: aantal m resultaat Phase I The Demand Phase II From Demand Tour 67% 100% Aantal % Kans 100%, aantal huurcontracten naar soort N 22 27,8 U 6 7,6 V 35 44,3 AV 16 V 20,3 Totaal 79 44% AV 20% 100,0 N 28% U 8% N U V AV Kans 100%, aantal huurcontracten naar soort Kans 100%, totaal aantal huurcontracten AV V U N Phase III From Tour Negotiating Phase IV From Negotiating Result 50% 30% To lease out 10,000 sqm requires 100,000 initial market interest N U V AV


33 CRM always and everywhere connected to our customers and our ERP Lead Generation: 33
34 6 GAME CHANGERS AT THE WORKPLACE


35 A place to be: inspiring meeting place to work, connect and meet Tailored offices Connected Meeting rooms Managed Offices Co working & members space + Cafe = social heart Higher take up Higher effective rent Quicker re-lettings Higher retention Additional income stream Customer satisfaction 35


36 Nation wide network 36


37 Servicing the millennials and corporates (smart professionals) 37


38 Flexible workplace concepts in the Netherlands 38


39 Overview of the Dutch flexible office landscape Flex desks Managed Offices Tailored Office Meeting rooms Corporates Large floor plates # Locations Owner Spaces 5 No Tribes 5 Mixed HNK 10 Yes The Office Operators 13 No Colors BC 18 No Igluu 3 No Regus 29 No Tauro 10 Yes FlexOffiz 19 Yes Atoomclub 2 Yes WeWork 2 No Seats2Meat 62 No Impact Hub 2 No B.Amsterdam 1 No Ovvice 3 Yes Aristo 4 No Van der Valk 63 Yes Functional Professional experience Experience 39

40 HNK investment process HNK brand strongly established and recognisable in the market Though: every investments case has its very own merites; one size doens t fit all IRR is the validating metric for the investment case Small Medium Large competition Size G4 Market rent Targeted cities Market vacancy Environmen t Region Non targeted cities %Tailored Offices Opportunistic %Managed Offices %Membership Offering mix Investment rationale Defensive Offensive % Meeting rooms Required level initial investment High Medium Low 40
41 Facts so far 10 HNK properties; half way to roll out to 20 90,000 sqm space so far HNK gross rental income grew to 7.6 million (annualized 2015) in only 3 years time 19.8 mio invested up till now; Continued high retention rates Tenants using multiple HNK locations is growing HNK Q Q Occupancy rate 67.6% 62.3% Take-up (sqm) 7,898 2,782 Take up/ supply rate 44% 32% Retention rate 70% 75% Effective Rent (total portfolio) WAULT 2.7 years 2.8 years 41


42 Roadmap to a full service online platform 42


43 HNK s online presence Through website & online media Traffic is key: traffic website doubled in 2015 vs 2014 increasing visitors, leads & conversions SEO/ SEA optimization 43


44 HNK s online presence Increasing returning visitors, to book through the website Reservations in top 10 page views Continuously monitoring clicks to further improve effectiveness 44


45 HNK Social Media Dashboard


46 Creative marketing drives social media presence and commercial success 46
Preliminary results 2015
 Preliminary results 2015 Increase in direct result in 2015 ` Highlights Update strategy Significant improvement in quality of portfolio through asset rotation in 2015: Share of region Randstad increased
ING Small Cap conference Frankfurt -15 June 2016-
 ING Small Cap conference Frankfurt -15 June 2016- 1 NSI COPE WITH A CHANGING ENVIRONMENT NSI at a glance Description Entrepreneurial Real Estate management company, founded in the Netherlands in 1993 by
Preliminary results 2014
 Preliminary results 2014 Significant steps in execution strategy: - All non-core office assets sold - Refinancing of 550 million in renewed structure NSI N.V. Highlights 2014 Quality improvement by asset
US Roadshow 1-2 October 2014
 US Roadshow 1-2 October 2014 Contents 1 Introduction 2 Market 3 Portfolio strategy 4 Strategic and operational update 5 Financial 6 Conclusion 7 Appendix 2 1 INTRODUCTION 3 NSI at a glance Description
Interim Results Half Year July 2018
 Interim Results Half Year 2018 July 2018 NSI will be the leading specialist in the Dutch office market, with a strong and efficient platform that will drive returns through pro-active asset management,
Kempen conference. Amsterdam 30 May 2013
 Kempen conference Amsterdam 30 May 2013 Company snapshot Description Dutch REIT: NSI is a real estate asset management company and qualifies as fiscal investment institution under Dutch law (REIT) Full
NSI Strategy update and full year results. Roadshow Tel Aviv 7 & 8 April
 NSI Strategy update and full year results Roadshow Tel Aviv 7 & 8 April Equity issue: full focus on operations Successful equity issue 300 million equity raised in a private placement to qualified investors
Kempen European Property Seminar 30 May 2012 in Amsterdam
 Kempen European Property Seminar 30 May 2012 in Amsterdam Profile Top 3 listed Dutch mixed real estate fund Dutch REIT / Listed on Amsterdam Euronext (Midkap AMx) Portfolio: 2.29bn TRI: 203m Outstanding
NSI PRELIMINARY FULL YEAR RESULTS 2018 PRELIMINARY RESULTS FULL YEAR 2018
 PRELIMINARY RESULTS FULL YEAR 2018 Execution of strategy fully on track - strongly positioned for multiple opportunities ahead Vacancy rate of 13.8% (down 4.6% versus year-end 2017) EPRA NAV of 39.75 per
Triodos Vastgoedfonds
 Quarterly Report Q3 2018 Profile Triodos Vastgoedfonds is an active impact investor making real estate more sustainable. It aims to lead the Dutch office market forward by enhancing environmental performance
Interim report per 30 June 2013
 Interim report per 30 June 2013 NSI N.V. Report of the Management Board NSI: investing in operational performance Results Direct investment result for the 1 st half-year of 2013 amounted to 25.5 million
Press release. Annual figures 2008
 Press release Annual figures 2008 VASTNED RETAIL: DIRECT INVESTMENT RESULT 2008 3.71 PER SHARE ( 3.85 BEFORE ONE-OFF COSTS); PROPERTY VALUE DECREASES RESULT IN NEGATIVE INDIRECT INVESTMENT RESULT OF 6.82
Triodos Vastgoedfonds
 Objective Triodos Vastgoedfonds was established in 2004 and is the first sustainable real estate fund in the Netherlands. The fund takes a broad view of sustainability, focusing on climate objectives and
Hansteen. Full Year Results to 31 December Tilburg, Netherlands
 Hansteen Full Year Results to 31 December 2016 Tilburg, Netherlands Contents Introduction Hansteen 2016 results Sale announcement Sale of German and Dutch Portfolio 2016 Annual Results 2016 Property Performance
FULL YEAR RESULTS 2018
 FULL YEAR RESULTS 2018 Peter Oosterveer CEO Sarah Kuijlaars CFO Amsterdam, 14 February 2019 DISCLAIMER Statements included in this presentation that are not historical facts (including any statements concerning
Triodos Vastgoedfonds
 Quarterly Report Q1 2018 Profile Triodos Vastgoedfonds is an active impact investor making real estate more sustainable. It aims to lead the Dutch office market forward by enhancing environmental performance
Annual figures February 2016 Board of Directors Heijmans N.V.
 Annual figures 2015 25 February 2016 Board of Directors Heijmans N.V. Heijmans 2015: negative result, improvement visible second half of the year Improvement result remains top priority Bert van der Els
2017 HALF YEAR 25 JULY 2017
 2017 HALF YEAR RESULTS 25 JULY 2017 Strong financial results and robust balance sheet Driving performance through operational excellence and disciplined capital allocation High quality pipeline of growth
PRESS & ANALYST MEETING
 BEYOND REAL ESTATE PRESS & ANALYST MEETING 2 HALF YEAR RESULTS 31 July 2018 3 Agenda 1. Nature of the portfolio 2. Important activities & developments in 2018 3. Financial results 30 June 2018 4. Property
Hansteen. Half Year Results to 30 June Castrop-Rauxel, Germany
 Hansteen Half Year Results to 30 June 2016 Castrop-Rauxel, Germany Introduction Hansteen - Pan European Real Estate Investment Trust (REIT) Pan European REIT Five countries Regional teams in 15 offices
SGX-REITAS Education Series
 SGX-REITAS Education Series 23 February 2016 16 International Business Park 2 Executive Summary Singapore Industrial Real Estate Sector Overview Role of Regulators in the Industrial Sector Overview of
The Hertz Corporation. May 30, 2017
 The Hertz Corporation May 30, 2017 Forward-Looking Statements Certain statements contained in this presentation are forward-looking statements within the meaning of the Private Securities Litigation Reform
Investor presentation 9M 2012 results
 Investor presentation 9M 2012 results Key results: stabilising in Q3 Direct result p/s: 3.05 (-17.6% yoy) Q3: + 0.01 vs Q2 Revaluation portfolio: -4.75% Q3: -0.25% NAV p/s: 63.72 (-12.9% yoy) Q3: +0.4%
DREAM GLOBAL REIT ANNOUNCES TRANSFORMATIONAL ACQUISITION IN THE NETHERLANDS FOR $903 MILLION AND $300 MILLION PUBLIC OFFERING OF UNITS
 DREAM GLOBAL REIT ANNOUNCES TRANSFORMATIONAL ACQUISITION IN THE NETHERLANDS FOR $903 MILLION AND $300 MILLION PUBLIC OFFERING OF UNITS NOT FOR DISTRIBUTION TO U.S. NEWS WIRE SERVICES OR DISSEMINATION IN
/ Investment portfolio 2.418,2 mln 2.646,0 mln Shareholders equity 3) 1.686,5 mln 1.
 1.686,5 mln 1.") Results 2009 Key items Direct result per share stable at 4.93 (2008: 4.92) Property revaluation -9.1% (until Q3 2009: -8.3%) Net asset value 73.77 per share (2008: 83.74) Solvency stable at 70% (2008:
Results 2009 Key items Direct result per share stable at 4.93 (2008: 4.92) Property revaluation -9.1% (until Q3 2009: -8.3%) Net asset value 73.77 per share (2008: 83.74) Solvency stable at 70% (2008:
Strategy update Vastned: Focus on growth in selected European cities
 Strategy update Vastned: Focus on growth in selected European cities Divestment of the Turkish portfolio and announcement of share buy-back Strategy update: Focus on growth in selected European cities
Half-year results 2015 of Geneba Properties N.V.
 Half-year results 2015 of Geneba Properties N.V. Amsterdam, 25 August 2015, Geneba Properties N.V. ( Geneba ) presents its interim financial results. In the first six months Geneba realised a positive,
Dutch Property Tour April 15, 2014
 Dutch Property Tour April 5, 204 Today s schedule Introduction, Wereldhave Schiphol Ronald van der Mark, CEO Action Dirk Anbeek, CEO Wereldhave Belinde Bakker, Managing Director NL De Eggert, Purmerend
Annual General Meeting of Shareholders of NSI NV
 Annual General Meeting of Shareholders of NSI NV (Investment company with variable capital) website: www.nsi.nl to be held on Friday 25 April 2014 at 10:30 am at Schouwburg Het Park, Westerdijk 4, Hoorn,
543 South 850 East American Fork, UT 84003
 Property Report 543 South 850 East American Fork, UT 84003 Presented by: Fourplex Investment Group Re/Max Equity 295 West Center Street Provo, UT 84501 FIG is not a company, but a marketing platform. All
FINANCIAL RESULTS Q3 2018
 FINANCIAL RESULTS Q3 2018 November 14, 2018 OVERVIEW & INVESTMENT HIGHLIGHTS Chapter 01 Kapitel Titel ADO THE PURE PLAY BERLIN RESIDENTIAL SPECIALIST Investment highlights 1 Berlin residential pure play
Vastned raises estimated direct result 2014 to 2.35 per share
 PRESS RELEASE 3 November 2014 Q3 2014 TRADING UPDATE Vastned raises estimated direct result 2014 to 2.35 per share Key points Q3 2014: - Occupancy rate stable at 96.5% (30 June 2014: 96.6%) - Acquisitions
Press release nine months results 2010 VASTNED RETAIL REALISES STABLE DIRECT INVESTMENT RESULT AND POSITIVE VALUE MOVEMENTS IN PROPERTY PORTFOLIO
 Press release nine months results VASTNED RETAIL REALISES STABLE DIRECT INVESTMENT RESULT AND POSITIVE VALUE MOVEMENTS IN PROPERTY PORTFOLIO Reinier van Gerrevink, CEO VastNed Retail: The letting market
VastNed Group. H results Analysts' meeting Okura Hotel Amsterdam August 10, :00AM
 VastNed Group H1 2007 results Analysts' meeting Okura Hotel Amsterdam August 10, 2007 11:00AM VastNed Retail: H1 2007 Key issues Property yields still go down and do not (yet) follow current capital markets
2018 HALF YEAR 26 JULY 2018
 2018 HALF YEAR RESULTS 26 JULY 2018 H1 2018 Another period of delivery Strong financial results and capital structure Disciplined capital allocation improving portfolio scale and quality, reducing risk
3Q2016 Financial Results Presentation 26 October Pioneer Crescent
 3Q2016 Financial Results Presentation 26 October 2016 25 Pioneer Crescent Content Executive Summary Real Estate Highlights Financial & Capital Management Highlights Appendix 2 3Q2016 Executive Summary
Interim results August 19, 2015 Executive Board Heijmans N.V.
 Interim results 2015 August 19, 2015 Executive Board Heijmans N.V. Welcome The Student Hotel Transformation Parool & Trouw Building Amsterdam Heijmans benefits from recovering housing market, negative
13 th Kepler Cheuvreux German Corporate Conference Frankfurt, 22 January 2014 Rolf Buch, CEO
 1 Syndicate Analyst Presentation May 2013 13 th Kepler Cheuvreux German Corporate Conference Frankfurt, 22 January 2014 Rolf Buch, CEO Deutsche Annington: Innovation leader based on a long-term vision,
72-sp Sun Terrace MHP For Sale
 70-sp MHP plus 2 Apartments City Water & Sewer Gross Revenue = 508K NOI = $305K 10% Cap Rate Minutes from Down Town, Clearwater Beach and International Airport Presented by benny@crescorpllc.com CRES Corp
LondonMetric Property Investor Presentation September
 LondonMetric Property Investor Presentation September 2018 www.londonmetric.com Agenda Overview & Strategy Property Finance & Outlook Appendices 2 Overview Our sector calls and income focus are delivering
PRESS RELEASE INTERIM FINANCIAL REPORT OF THE STATUTORY MANAGER
 PRESS RELEASE INTERIM FINANCIAL REPORT OF THE STATUTORY MANAGER UNDER EMBARGO UNTIL 05/11/2015 08:30 AM NET OPERATING RESULT OF EUR 5.33 MILLION (EUR 0.58 PER SHARE), GROWTH OF 40.3% COMPARED WITH THE
72-sp Sun Terrace MHP For Sale
 70-sp MHP (66 POM's)plus 2 Apartments City Water & Sewer Gross Revenue = 529K NOI = $317K 10.23% Cap Rate at Asking Price Minutes from Down Town, Clearwater Beach and International Airport Presented by
Hong Kong Non-Deal Roadshow Hong Kong, 4 March International Business Park
 Hong Kong Non-Deal Roadshow Hong Kong, 4 March 2016 16 International Business Park 2 Content CIT FY2015 Results Executive Summary Financial Summary Real Estate Highlights Financial & Capital Management
CLSA Asean Forum Bangkok, March International Business Park
 CLSA Asean Forum Bangkok, March 2016 16 International Business Park 2 Content Overview of CIT CIT FY2015 Financial Results Overview Financial & Capital Management Highlights Real Estate Highlights Singapore
Bank and Bondholder presentation
 Bank and Bondholder presentation 19 September 2013 0 Geopost, Enfield Agenda Welcome and strategic overview (David Sleath, CEO) Operational and financial performance (Justin Read, Group Finance Director)
UBS Australasia Conference
 UBS Australasia Conference 13 November 2017 Martin Earp, CEO Josée Lemoine, CFO Market / InvoCare > IVC is the largest funeral, cemetery and crematorium operator in Australia, New Zealand and Singapore
Equity Fund Raising and Acquisitions. 21 October 2010
 Equity Fund Raising and Acquisitions 21 October 2010 important notice The value of units in CIT ( Units ) and the income derived from them may fall as well as rise. Units are not investments, liabilities
Credit Opinion: Ascendas Real Estate Investment Trust
 Credit Opinion: Ascendas Real Estate Investment Trust Global Credit Research - 28 May 2012 Singapore Ratings Category Outlook Corporate Family Rating Senior Unsecured Moody's Rating Stable A3 Baa1 Contacts
results Jan de Kreij (CEO) Jan Haars (CFO) Gerard Groener (CEO CNR) Amsterdam, 29 February 2008
 Jan Haars (CFO) Gerard Groener (CEO CNR) Amsterdam, 29 February 2008") 1 2007 results Jan de Kreij (CEO) Jan Haars (CFO) Gerard Groener (CEO CNR) Amsterdam, 29 February 2008 2 Financial highlights 2007 2007 compared to 2006 Net profit 801.5 m / +25.1% 12.10 per share Direct
1 2007 results Jan de Kreij (CEO) Jan Haars (CFO) Gerard Groener (CEO CNR) Amsterdam, 29 February 2008 2 Financial highlights 2007 2007 compared to 2006 Net profit 801.5 m / +25.1% 12.10 per share Direct
Investor Presentation August 2017
 Investor Presentation August 2017 Important Notice This presentation shall be read in conjunction with Mapletree Industrial Trust s ( MIT ) financial results for First Quarter Financial Year 2017/2018
Wereldhave Dutch Property Tour. December 6 th, 2011
 Wereldhave Dutch Property Tour December 6 th, 2011 1 Program 8.30-10.15 Presentations on Wereldhave NL, Leasing & Development Bus transfer to Purmerend 11.00 11.45 Visit Shopping Centre Eggert in Purmerend
AIMS AMP CAPITAL INDUSTRIAL REIT
 AIMS AMP CAPITAL INDUSTRIAL REIT FY2018: Fourth Quarter Financial Results Ended 31 March 2018 Results Presentation 25 April 2018 1 Important notice Disclaimer This Presentation is focused on comparing
Axis REIT Managers Bhd Q Results Presentation. 4 th August 2015
 Q2 Axis REIT Managers Bhd Q2 2015 Results Presentation 4 th August 2015 2015 1 Q2 2015 Highlights 2 Axis-REIT turns 10! Axis-REIT was listed on the 3 rd August 2005 3 Our 10 year milestones - briefly Assets
ING Office Fund. European acquisition Prague, Czech Republic Budejovicka Alej
 ING Office Fund European acquisition Prague, Czech Republic Budejovicka Alej 3 July 2006 Transaction summary Key benefits Improves the Fund s earnings and growth prospects New, fully leased, high quality
AMVEST RESIDENTIAL CORE FUND
 AMVEST RESIDENTIAL CORE FUND FUND FACT SHEET AMVEST RESIDENTIAL CORE FUND Almere FOCUS AREAS Groningen The Fund has selected four focus areas that score well above average on economic growth, the development
Welcome to Kungsleden First quarter Thomas Erséus, Chief Executive Johan Risberg, CFO
 Welcome to Kungsleden First quarter 2012 Thomas Erséus, Chief Executive Johan Risberg, CFO Owning and managing properties with satisfied customers Always open to new opportunities regardless of property
ASCENDAS INDIA TRUST. 7. Blueridge Special Economic Zone Phase II, Pune ( BlueRidge 2 ).
.") ASCENDAS INDIA TRUST Corporate Profile Ascendas India Trust ( a-itrust or the Trust ) is a Singapore-listed business trust established with the principal objective of owning income-producing real estate
ASCENDAS INDIA TRUST Corporate Profile Ascendas India Trust ( a-itrust or the Trust ) is a Singapore-listed business trust established with the principal objective of owning income-producing real estate
This presentation is dated July 17, A final base shelf prospectus containing important information relating to the securities described in this
 This presentation is dated July 17, 2017. A final base shelf prospectus containing important information relating to the securities described in this document has been filed with the securities regulatory
Threats and opportunities in Dutch Office Investment Market
 9th April 213 Threats and opportunities in Dutch Office Investment Market Alphons Spaninks Local Head of Asset Management Benelux & Nordics Real Estate Investment Seminar 213 Dutch Real Estate: Office
Refresco Gerber reports solid 2015 results and delivers on strategic goals
 Press release March 10, 2016 Refresco Gerber reports solid 2015 results and delivers on strategic goals Key indicators: Volume in full year 2015 increased 2.1% to 6,095.5 million liters (FY 2014: 5,968.9
Investor Day. Corporate Overview. Henry Buckley, President & CEO and Eric Bussières, CFO November 28, 2017
 Investor Day Corporate Overview Henry Buckley, President & CEO and Eric Bussières, CFO November 28, 2017 Preliminary Comments Forward-looking statements: The information provided in this presentation contains
4QFY2013 and 2HFY2013 Results Presentation. January 2014
 4QFY2013 and 2HFY2013 Results Presentation January 2014 1 Disclaimer This presentation should be read in conjunction with the financial statements of Soilbuild Business Space REIT for the period from 1
3Q 2017 Earnings Call November 10, :00am ET
 2017 Earnings Call November 10, 2017 8:00am ET 1 Safe Harbor Statement Certain statements made within this presentation contain forward-looking statements, within the meaning of the Private Securities
Frontier Travel Park
 Frontier Travel Park MHP - 62 spaces w/36 Trailers Also Includes 16 Cottages and 2 Stores Current Occupancy 80% Zoned PD- Commercial Seller Financing Available 20% Down Presented by CRES Corp International,
NET OPERATING RESULT OF EUR 3.54 MILLION GROWTH OF 6.3% COMPARED WITH Q1 2013
 REGULATED INFORMATION INTERIM STATEMENT UNDER EMBARGO UNTIL 15/05/2014 8.45 AM NET OPERATING RESULT OF EUR 3.54 MILLION GROWTH OF 6.3% COMPARED WITH Q1 2013 OCCUPANCY RATE OF 95% AVERAGE LEASE TERM UNTIL
INVESTOR PRESENTATION
 INVESTOR PRESENTATION Table of Contents Introduction to SEGRO 3 Market drivers 10 High quality development pipeline 15 Balance sheet and financing 21 Operating performance 26 Portfolio overview 30 APP
Foxtons Preliminary results presentation For the year ended December 2018
 Foxtons Preliminary results presentation For the year ended December 2018 Important information This presentation includes statements that are, or may be deemed to be, forward-looking statements. These
AIMS AMP CAPITAL INDUSTRIAL REIT
 AIMS AMP CAPITAL INDUSTRIAL REIT FY2018: Second Quarter Financial Results Ended 30 September 2017 Results Presentation 26 October 2017 1 Important notice Disclaimer This Presentation is focused on comparing
Deepening Seattle Footprint with Maiden Acquisition of Westpark Portfolio in Redmond, Washington
 Deepening Seattle Footprint with Maiden Acquisition of Westpark Portfolio in Redmond, Washington 24 September 2018 Important Notice This presentation is for information purposes only and does not constitute
SGX REIT & BT SEMINAR Tokyo, 30 June Pioneer Crescent
 SGX REIT & BT SEMINAR Tokyo, 30 June 3016 25 Pioneer Crescent Singapore Industrial REITs (S-REITs) 3 Key Features Bond-like listed security ( Dividend Play ) that provides steady income distribution stream
NINE MONTHS FINANCIAL RESULTS NOVEMBER 19, 2015
 NINE MONTHS FINANCIAL RESULTS NOVEMBER 19, 2015 01 ADO OVERVIEW AND INVESTMENT HIGHLIGHTS Overview ADO the pure play Berlin residential specialist Investment highlights 1 2 3 Berlin residential pure play
UBS Global Real Estate CEO/CFO Conference. December 1/2, 2015
 UBS Global Real Estate CEO/CFO Conference December 1/2, 2015 01 ADO OVERVIEW AND INVESTMENT HIGHLIGHTS Overview ADO the pure play Berlin residential specialist Investment highlights 1 2 3 Berlin residential
Cache Logistics Trust Reports Income Available for Distribution of S$15.2 million in 2Q FY18
 CACHE LOGISTICS TRUST (Constituted in the Republic of Singapore pursuant to a Trust Deed dated 11 February 2010 as amended and restated) Press Release Cache Logistics Trust Reports Income Available for
FIRST SPONSOR GROUP LIMITED (Incorporated in the Cayman Islands) (Company Registration No.: AT )
 (Company Registration No.: AT )") 5 February 2015 FIRST SPONSOR GROUP LIMITED (Incorporated in the Cayman Islands) (Company Registration No.: AT-195714) ANNOUNCEMENT OF ACQUISITION 1. INTRODUCTION 1.1 The Board of Directors (the "Board")
5 February 2015 FIRST SPONSOR GROUP LIMITED (Incorporated in the Cayman Islands) (Company Registration No.: AT-195714) ANNOUNCEMENT OF ACQUISITION 1. INTRODUCTION 1.1 The Board of Directors (the "Board")
Heijmans: annual results 2016, adjustment strategy and new financing agreements
 Heijmans: annual results 2016, adjustment strategy and new financing agreements 23 February 2017 Board of directors Heijmans N.V. Wijnhavenkwartier Den Haag Heijmans: annual results 2016, adjustment strategy
HIGHLIGHTS PROPERTY FOR INDUSTRY 2017 ANNUAL RESULTS BRIEFING
 HIGHLIGHTS Significant acquisition activity: $84.3 million of property acquired, improving portfolio metrics and providing significant medium to long-term development potential Transition of the Penrose
AUDIOCAST PRESENTATION Q3/2017
 19.10.2017 AUDIOCAST PRESENTATION Q3/2017 Q3/2017: GOOD OPERATIONAL RESULTS IN SWEDEN AND NORWAY HIGHLIGHTS Q3/2017 4.7% INCREASE IN EPRA EPS TO EUR 0.133 - Overall net rental income growth and lower administrative
AIMS AMP CAPITAL INDUSTRIAL REIT
 AIMS AMP CAPITAL INDUSTRIAL REIT FY2018: First Quarter Financial Results Ended 30 June 2017 Results Presentation 27 July 2017 1 Important notice Disclaimer This Presentation is focused on comparing actual
Corporate. Presentation March 2017
 Corporate www.larespana.com Presentation March 2017 Snapshot 2 First IPO of a Spanish REIT listed on the Spanish Stock Exchange Shareholder Structure Focused on creating both sustainable income and strong
FINANCIAL STATEMENTS Stockmann Group 14 February 2018
 FINANCIAL STATEMENTS 2017 Stockmann Group 14 February 2018 HIGHLIGHTS IN 2017 Group s gross margin 55.8% (55.7) Group s adjusted operating result, EUR mill. 12.3 (30.9) Fair value of properties, EUR mill.
Vesteda Residential Fund FGR
 Summary: Vesteda Residential Fund FGR Primary Credit Analyst: Nicole Reinhardt, Frankfurt (44) 020 7176 3587; nicole.reinhardt@standardandpoors.com Secondary Contact: Marie-Aude Vialle, London +44 (0)20
Chief Executive - Neil Sinclair Finance Director - Stephen Silvester Executive Director - Richard Starr INVESTOR PRESENTATION FEBRUARY 2017
 Chief Executive - Neil Sinclair Finance Director - Stephen Silvester Executive Director - Richard Starr INVESTOR PRESENTATION FEBRUARY 2017 CONTENTS Introduction & Highlights NEIL SINCLAIR, CHIEF EXECUTIVE
ASX/Media Announcement
 ASX/Media Announcement 13 February 2018 Propertylink delivers a strong HY18 result, well positioned to deliver FY18 guidance Propertylink Group (ASX:PLG) today announces strong financial and operational
CHAMPIONING A PROSPEROUS, DIVERSE AND CONNECTED REGIONAL ECONOMY
 CHAMPIONING A PROSPEROUS, DIVERSE AND CONNECTED REGIONAL ECONOMY 2016 2017 ACTION PLAN WWW.LVGEA.ORG UPDATED FOR FY 2017 TABLE OF CONTENTS Message from the Chairman & CEO... Planning Process... Mission,
Aberdeen Standard European Logistics Income PLC
 Aberdeen Standard European Logistics Income PLC A new investment trust to be listed on the premium segment of the London Stock Exchange offering a focused long term income strategy exploiting the demand-supply
Property Acquisitions
 Property Acquisitions 7 november 2013 Overview Property Acquisitions I 7 November 2013 I page 1 Strategic acquisitions of quality assets in core locations with value add potential Mirvac has entered into
Another quarter of strong revenues and net profit growth
 Third quarter 2005 Another quarter of strong revenues and net profit growth Financial highlights: Revenue of 250.0 million, up 373% on the prior year and 118% on the previous quarter 538,000 integrated
As at 31 March 2016, a-itrust has a diversified portfolio of six IT Parks ( Properties ) across the primary IT centres of India, comprising:
 across the primary IT centres of India, comprising:") ASCENDAS INDIA TRUST Corporate Profile Ascendas India Trust ( a-itrust or the Trust ) is a Singapore-listed business trust established with the principal objective of owning income-producing real estate
ASCENDAS INDIA TRUST Corporate Profile Ascendas India Trust ( a-itrust or the Trust ) is a Singapore-listed business trust established with the principal objective of owning income-producing real estate
Company Presentation. January 2018
 Company Presentation January 2018 Disclaimer This document is for informational purposes only. This document is not intended to form the basis of any investment decision and should not be considered as
AIMS AMP CAPITAL INDUSTRIAL REIT
 AIMS AMP CAPITAL INDUSTRIAL REIT FY2014: Third Quarter ended 31 December 2013 Results Presentation 29 January 2014 Important notice Disclaimer This Presentation is focused on comparing actual results for
MILLION (+1.0%) VALUE INCREASE VASTNED RETAIL PROPERTY PORTFOLIO IN Q1 2011; DIRECT INVESTMENT RESULT MARGINALLY DOWN
 VALUE INCREASE VASTNED RETAIL PROPERTY PORTFOLIO IN Q1 2011; DIRECT INVESTMENT RESULT MARGINALLY DOWN") Press release first quarter figures 2011 20 MILLION (+1.0%) VALUE INCREASE VASTNED RETAIL PROPERTY PORTFOLIO IN 2011; DIRECT INVESTMENT RESULT MARGINALLY DOWN Reinier van Gerrevink, VastNed Retail CEO:
Press release first quarter figures 2011 20 MILLION (+1.0%) VALUE INCREASE VASTNED RETAIL PROPERTY PORTFOLIO IN 2011; DIRECT INVESTMENT RESULT MARGINALLY DOWN Reinier van Gerrevink, VastNed Retail CEO:
Delta Investment Group, Inc.
 Delta Investment Group, Inc. Real Estate Alternatives & Investments EXECUTIVE SUMMARY Note Banking For the purpose of this document Note Banking shall pertain to the process of acquiring, servicing, negotiating,
STEADY STRATEGY ROLLOUT
 Press release STEADY STRATEGY ROLLOUT Negative value movements mostly due to Spanish portfolio Key points 9M 2012 (in brackets: 9M 2011) Direct investment result 47.1 million ( 50.6 million) Values movements
PRESS RELEASE ANNUAL RESULTS Results underline strategic choice. 6 March 2014 HEADLINES
 PRESS RELEASE 6 March 2014 2013 ANNUAL RESULTS Results underline strategic choice HEADLINES - Vastned realises strategic objectives through active acquisition and divestment policy - Direct investment
ASTIN COLLOQUIUM 2013
 ASTIN COLLOQUIUM 2013 hosted by: Actuarieel Genootschap INTR0DUCTION ASTIN COLLOQUIUM 2013 On behalf of het Actuarieel Genootschap (AG), it is my pleasure to introduce the Colloquium of ASTIN 2013, which
First Sponsor Group Limited Investor Presentation 25 October Bilderberg Europa Hotel Scheveningen The Hague, The Netherlands
 First Sponsor Group Limited Investor Presentation 25 October 2017 Bilderberg Europa Hotel Scheveningen The Hague, The Netherlands Contents Page Section 1 Key Message 3 Section 2 Financial Highlights 6
Financial Value Creation. Stewart McCrone
 Financial Value Creation Stewart McCrone CFO Philips Lighting 7 3 Key takeaways We are a stronger company due to measures taken in the last two years; 21 expected be a record year for Lighting The Lighting
KUNGSLEDEN. FIRST QUARTER REPORT April Biljana Pehrsson, CEO Anders Kvist, Deputy CEO and CFO
 KUNGSLEDEN FIRST QUARTER REPORT 2015 23 April 2015 Biljana Pehrsson, CEO Anders Kvist, Deputy CEO and CFO AGENDA First quarter in summary Financial performance and key figures Business plan with growth
PROPOSED ACQUISITION OF 8 TUAS SOUTH LANE
 (Constituted in the Republic of Singapore pursuant to a trust deed dated 31 March 2006 (as amended)) PROPOSED ACQUISITION OF 8 TUAS SOUTH LANE 1. INTRODUCTION ESR Funds Management (S) Limited, as manager
FULL YEAR RESULTS Year Ended 31 March
 FULL YEAR RESULTS Year Ended 31 March 2018 www.londonmetric.com AGENDA Highlights & Strategy Financial performance Property & Investment Outlook Q&A 2 Key Highlights Our sector calls and income focus delivered