ING Small Cap conference Frankfurt -15 June 2016-
|
|
|
- Shanna Simpson
- 6 years ago
- Views:
Transcription

1 ING Small Cap conference Frankfurt -15 June 2016-
2 1 NSI COPE WITH A CHANGING ENVIRONMENT
3 NSI at a glance Description Entrepreneurial Real Estate management company, founded in the Netherlands in 1993 by private investors and listed on Euronext Amsterdam since 1998 Dutch REIT * status in 2000: exempted from corporate income tax on Dutch investment result Assets under management (per 1 April 2016) 1.1b A GRI of 114m over 2015 (Q1: 23.4m) Direct result of 51m per EoY 2015 Focus on Offices and Retail. Per 1 April 2016: Offices 717m: Offices and HNK Retail 425m: Retail and Large Scale retail and logistics Strong letting platform with in-house teams for asset management, marketing, development, business development and technical building management Key financials FY 2015 FY 2014 Portfolio value ( m) 1, ,668.1 Gross rental income ( m) Net rental income ( m) Direct investment result ( m) Occupancy (%) Loan-to-Value (%) * Interest cover ratio (x) (*) After disposals of remaining shares in IOW (Q1-2016) and the industrials portfolio ( ), LtV is per be 38.5% Dutch disclosure of major holdings and capital interest Cohen & Steers Capital Management, Inc. 12.3% 8.4% ICAMAP Investments S.à.r.l % CBRE Clarion Securities, LLC 5.0% 5.0% BNP Paribas Investment Partners SA 4.9% 4.6% Phoenix Insurance Company Ltd. 3.7% 3.7% BlackRock, Inc. 3.0% 3.0% Asset portfolio 100% yearly externally appraised (50% per June and 50% per December) Norges Bank 3.0% 3.0% Voya Financial, Inc. 3.0% 3.0% * Fiscal Investment Institution 2
4 Focus on NSI s portfolio Portfolio summary per Q Segment break down on contractual rent per Q1-16 # properties Lettable sqm Contractual Rent Occupancy Rate % Market Value (x 1,000) Value per sqm Offices (*) ,991 51, ,892 1,308 54% HNK (*) ,508 11, , % 66% Retail (**) ,924 26, ,934 1,973 LSR (**) 6 89,996 6, , % Total ,419 95, ,144,027 (***) 1,334 18% of Office rent * Approximately 1.2% of office market (49.5 million sqm) ** Approximately 0.9% of market *** Excluding EUR 54.2m held for sale and development Retail Offices HNK Occupancy rates (%) Effective rent * development Dutch portfolio ( /sqm) 100% 90% 80% 70% 77,0% 95,0% 93,0% 87,0% 88,0% 71,0% 72,0% 72,0% 85,0% 85,3% 74,0% 74,3% % 50% 40% 30% 20% 10% % Q Offcies Retail 130 Q Q Q Q Offices Q Retail Q Q Q * Effective rent = contractual rent including incentives 3
, Netherlands Bureau for Economic Policy Analysis (CPB),")
5 Dutch economy in a nutshell Economic growth Unemployment rate Consumer confidence Sources: Statistics Netherlands (CBS), Netherlands Bureau for Economic Policy Analysis (CPB), Rabobank 4

6 Changing behaviour office tenants Changing tenant needs New way of working Flexibility Services Less space per employee # desks < # employees Changing tenant profile SME growth engine of Dutch economy Variety in type of organizational models Downsizing of large corporates Changing scene of business activity Greater concentration of economic activity Dutch office market is a micro market requiring in-depth understanding Changing negotiation position Adequate choice available (16% average vacancy) Distinctive product 5
 Non-food: Ordering online and delivery at location of choice 3.")
7 Trends in the Dutch shopping 1. One-stop shop Complete range of shops, good access (incl. parking), 24/7, value-for-money, meeting place 2. Supermarkets remain anchor tenants for shopping centres Food: focus on fresh and experience (e.g. Jumbo Breda) Non-food: Ordering online and delivery at location of choice 3. Scope of retail offering back-to-basics Offering focused on food, personal care and services Meeting place with facilities for education, health and culture Experience Convenience Fun shopping : Shopping for leisure Daily needs : efficient shopping + meet (locally) City centre ( Downtown ) Regional Local ( Neighbourhood ) 7,500 12,000sqm Achmea Dutch Retail Property Fund 6
8 Defining NSI s strategy and focus Asset management Segmentation Client focus Investment Asset rotation Maximise total return Improve portfolio quality Improve operational performance 7
9 NSI well positioned to benefit from market opportunities Turning point in revaluations Positive revaluation office portfolio sustained for 2 nd reporting period, after a long period of negative revaluations Dutch economy strong performer in European landscape Full focus on core markets and asset classes Divestment of IOW Disposal of Industrial portfolio Acquisition of 8 high quality office assets ( million) (in 2015) Significantly improved quality in office portfolio Share of core properties grew from 54% to 65% Share of Randstad increased from 42.5% to 52.5% Average quality (according to JLL ranking) improved from 49.3% to 57.8% Strong balance sheet LtV approx. 38.5% at present (Q1 2016: 40.1%) 8
10 Highlights Q Strategy: portfolio focus further increased Sale of almost entire industrial portfolio ( 48.1 million) Sale of the remaining interest (15.2%) in IOW Agreement to release securities related to bank funding ( 450 million) as per 1 September 2016 LtV, after asset sales and dividend distribution, to approx. 38.5% at present Operational Occupancy rate of total portfolio increases to 78.1% (31 December: 77.3%) Occupancy rate total office portfolio increased to 74.3% (Q1 2015: 71.4%, Q4 2015: 73.6%) Rental income Dutch office portfolio grew slightly compared with Q Quality improvement and focus on HNK start to pay off HNK continues to perform strongly Retail remains challenging; occupancy level increased over stable development of rent levels 9
11 2a STRATEGY - ASSET ROTATION

12 Combined strenght of the Netherlands, Belgian Flemish Diamond and German Rhein/Ruhr area


13 The Netherlands is fundamentally strong positioned 30 million inhabitants 150 billion internal Trade European manufacturing industry Gateway to Europe Largest port of Europe Best airport of Western-Europe European political and governing centre Strong universities GATEWAY TO EUROPE RHEIN/RUHR BRABANT RANDSTAD GATEWAY TO EUROPE EU-CAPITAL BRUSSELS EUROPEAN CAPITAL BRUSSELS TECH ZONE RHEIN/RUHR MANUFACTURING EINDHOVEN BRAINPORT

14 To be successful.. Understand the specific market dynamics Randstad, university cities and specific growth sectors/regions» Business intelligence embedded in asset management» Tenant management strongly rooted in local networks Offer an unrivalled tenant focused letting platform Knowing your customer and pro-actively anticipate his needs Tap into potential customer base» Strong commercial organization supported by CRM system» Seamless cooperation technical and commercial teams Have Operational Excellence Flawless execution» Full spectrum in-house asset management capabilities» ERP / strong ERP system base Anticipate market trends» New concepts and business development: HNK» Redevelopment and rebranding Ability to invest» To deliver upon tenants needs» Distinctive product Investing in real estate has become: Creating value through active management and operational excellence 13

: 1,618 million (including Vastned) 50,000 m 2 offices transformation 2014 2016 / 50,000 m 2 future transformation 20% Non target cities 28%")
15 Ongoing asset rotation Focus on growth areas in the Netherlands Divesting non-core assets and assets of which the value potential under NSI s management has been optimised is part of NSI s strategy to create value in its portfolio Investment focus on Dutch office market, migrating to a higher quality: Demographic growth Healthy economic environment University centres Proven asset management skills Cumulative divestment volume : 630 million, including divestment IOW shares ( 165 million) Cumulative acquisition volume ( ): 1,618 million (including Vastned) 50,000 m 2 offices transformation / 50,000 m 2 future transformation 20% Non target cities 28% 52% 14
16 2b STRATEGY ANTICIPATING CHANGING MARKET DYNAMICS
17 HNK servicing a growing market with higher earnings potential Demand for full service and flexible housing is growing in Dutch market Increasing number of self employed workers Changing housing needs due to new way of working ICT enables to work anywhere working, meeting and living have become more fluid Flexibility and services result in higher rental income while tenant is able to optimize their costs as they lease exactly the required space and services GRI from HNK rose to18.6% as % of GRI total office portfolio A distinctive brand in an otherwise oversupplied office market with emphasize on service instead of competing on price Full range of leasing propositions to accommodate every type of tenant looking for service. For example Tenant with focus on flexibility (sqm, price, term, etc) Corporate contracts to offer national coverage Traditional tenant with focus on location Proven track record of outperforming traditional office leases Substantial higher rent per sqm Significant higher lease up pace Strong take up/ supply ratio Consistent high retention rate Double digit like for like growth 16


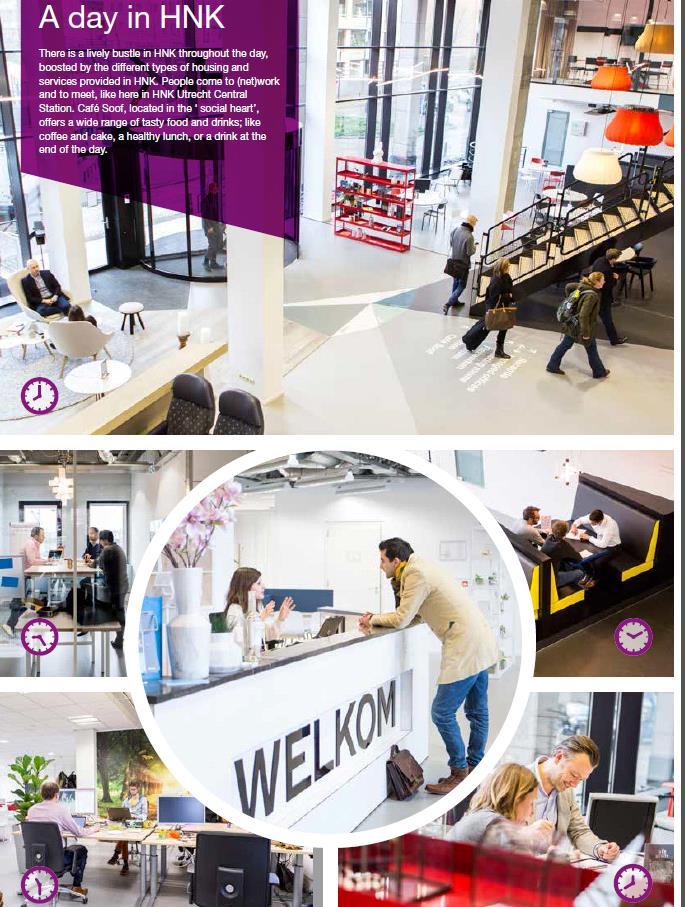
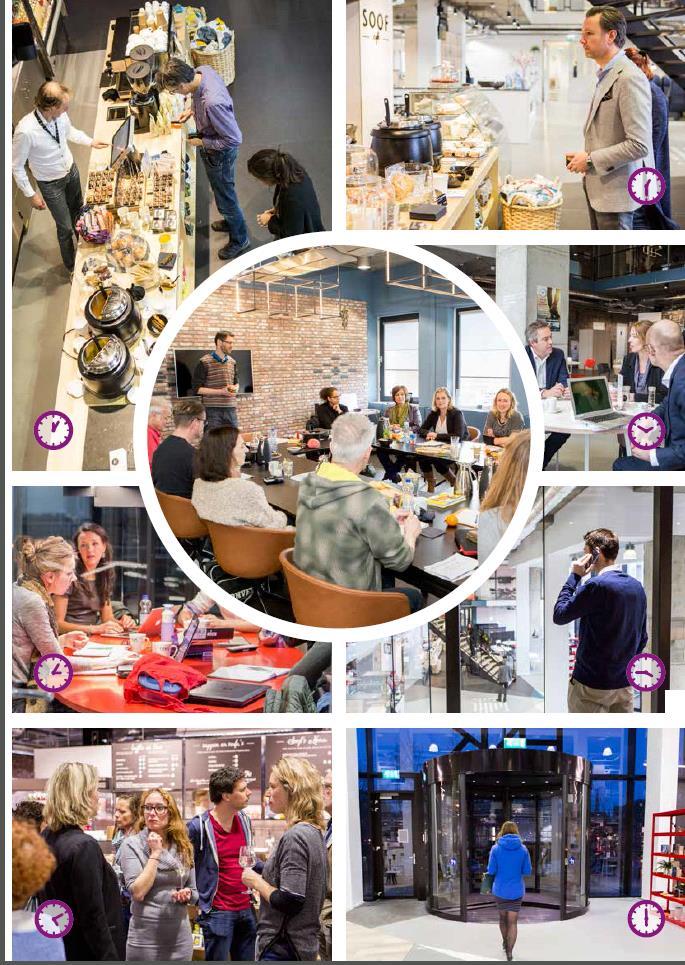
18 HNK - a place to be: inspiring meeting place to work, connect and meet Tailored offices Connected Meeting rooms Managed Offices Co working & members space + Cafe = social heart Higher take up Higher effective rent Quicker re-lettings Higher retention Additional income stream Customer satisfaction 17
 2013 2014 2015 2016 target Investment 3.")
19 Roll out to nation wide network Year Openings Locations Rotterdam Hoofddorp, Utrecht, Groningen Amsterdam, Den Haag, Apeldoorn Den Bosch, Ede-Wageningen, Utrecht Opened: Dordrecht Planned: Rotterdam, Amsterdam To be acquired: several locations in NSI s target cities Initial targets vs reported HNK highlights ( million) target Investment GRI # HNK s % portfolio (sqm) 3% 12% 12% 25% * annualized 18
20 Next phase in offices focus on performance After big step up in ; asset rotation is continuous part of strategy Focus on improving performance Full focus on Dutch high quality multi tenant offices in selected regions and neighbourhood shopping centers Non strategic: Large Scale Retail, 2 remaining Industrial assets NSI leasing platform allows for further growth in offices More focused portfolio and organisation Leveraging gross to net Roll out HNK from 11 at present to 20 HNKs by year end 2016 Currently under construction: HNK Rotterdam Blaak (2 nd HNK in Rotterdam) HNK Amsterdam Arena (2 nd HNK in Amsterdam) Selective acquisitions to optimise nation-wide network 19


")
21 Clear focus on daily shopping centers in Retail NSI focus on daily / convenience shopping centers Add services and experience (Easy Shopping) Focus on centers where NSI holds controlling ownership Focus on a mix of strong supermarket chains and local entrepreneurship LSR: non strategic Experience Fun shopping : Shopping for leisure Daily needs : efficient shopping + meet (locally) Services 20
 services Intensify relationship retailer - consumer Enlarge reach through")
 Roll out to shopping centres in Rotterdam")
22 Easyshopping adds extra dimension to daily shopping centre: Connect: Creating communities Offering (online) services Intensify relationship retailer - consumer Enlarge reach through active (online) marketing Increase dynamics: through activities in shopping centre Added Value Launched in shopping centre Zevenkamp (Rotterdam) Roll out to shopping centres in Rotterdam region 21
23 22 3a OPERATIONAL PERFORMANCE - OFFICES
24 Operational highlights offices Offices (Excluding HNK) Q Q Q Gross Rental income ( million) Occupancy rate in % Take up in sqm 2,925 4,615 4, Take up / supply ratio (12 months rolling in %) Effective rent level new leases (12 months rolling) in per sqm Effective rent level per sqm total portfolio ( / sqm) Like-for-like growth gross rental income in % -9, WAULT Occupancy rate positively impacted by reclassifications; underlying stable development Q4 vs Q1 Negative l-f-l growth largely due to expired contracts in last 12 months; Q1/16 vs Q4/15 shows improving trend Stable development effective rent level new leases 7% of office contracts expire in
25 24 3b OPERATIONAL PERFORMANCE HNK
26
 39 45 36 45 26 Effective rent level new leases (12 months rolling) in per sqm 166 165 167 165 169")
27 Operational highlights HNK HNK (excluding Offices) Q Q Q Gross Rental income ( million) Occupancy rate in % 57.0 * Take up in sqm 3,414 6,167 4,250 21,139 4,855 Take up / supply ratio (12 months rolling in %) Effective rent level new leases (12 months rolling) in per sqm Effective rent level per sqm total portfolio ( / sqm) Like-for-like growth gross rental income in % WAULT * 62% excluding recently added *(vacant) properties HNK is winner of the Best office landlord 2016 award All product categories show positive trend GRI HNK as % of GRI total offices rose to18.6% in Q from 14.7% in Q Net margin (2015: 40%) should evolve to 75-80% when fully leased up (occupancy 85-90%) Occupancy rate continuously impacted by inflow of new HNK properties in semi vacant state All other individual HNKs showed increasing occupancy rates, except for HNK Rotterdam due to legacy tenant that left in Q L-f-l growth in HNK expected to largely compensate negative l-f-l growth in traditional offices 26
28 Operational highlights total offices Offices ((Including HNK) Q Q Q Gross Rental income ( million) Occupancy rate in % Effective rent level new leases (12 months rolling) in per sqm Effective rent level per sqm total portfolio ( / sqm) Like-for-like growth gross rental income in % Occupancy rate total offices increased, in combination with stable rental levels of new leases GRI total office portfolio shows slightly improving trend 27
29 28 3c OPERATIONAL PERFORMANCE - RETAIL
30 Operational highlights Retail Retail Local Convenience Q Q Q Gross Rental Income ( million) Occupancy rate in % Effective rent level new leases (12 months rolling) in per sqm Effective rent level per sqm total portfolio ( / sqm) Like-for-like growth gross rental income in % WAULT Valuation development: Overall Retail: - 2.5% Specific local convenience: + 1.0% Retail market remains challenging despite improving consumer confidence & spending Negative l-f-l growth largely explained by one-off receipts in % of retail contracts expire in
31 30 4 FINANCIAL
32 Development Treasury KPI s Loan-to-Value (LTV) (%) Total costs of debt and swaps (%) 60% 59,6% 5,5% 5,7% Loans + Swaps 55% 5,0% 50% 45% 45,4% 44,9% 47,8% 47,8% 48,9% 44,9% 47,8% 43,3% 4,5% 4,0% 3,5% 2017 Target Financing costs Interest swaps 3,7% 40% 35% 36,6% 38,5% 3,0% 2,5% 2,0% interest loans 30% Q Q Q Q Q ,5% Q Q Q Q Q Q Average maturity financing (in years) Total net debt and financing costs ( m) 5, ,0 14,0 4, ,0 12,8 12,0 3,00 800,0 Net Debt 10,0 2,00 1,00 2,7 2,3 2,2 2,1 1,9 1,7 1,4 4,6 4,3 3,9 600,0 400,0 200,0 Financing costs 8,0 6,0 5,5 4,0 2,0 - Q Q Q Q Q ,0 Q Q Q Q Q Q Q Q ,0 31
33 Financing options KPI 13Q3 16Q1 Target 2017 Loan to Value 45% 40.1% (38.5% per April 2016) 40 <50% Average maturity financing 2.6yrs 3.7yrs > 3yrs Financing costs 4.8% 3.8% < 4.0% Available financing 25% 28% 10 20% Diversification 8% 18.4% 40 <50% Secured / unsecured 100% <100% <35 - >65% Due to the improved financing structure, NSI has multiple strategic financing alternatives Strategic financing alternatives Div Cost Refi Mat Unsec I II III IV V Conversion to unsecured financing Optimalisation of secured funding (Pandbrieffinancierung) Alternative funding with institutionals Issue convertible bond Increase current facilities and draw on accordeon Div = Diversification and availability of capital, Cost = Decrease financing costs, Refi = Refinancing risk, Cov = Covenants, Mat = Maturity loans, Unsec = unsecured funding 32
34 Financial highlights x 1,000 FY 2015 FY 2014 HY HY Gross rental income 113, ,599 45,703 68,132 Service costs not recharged to tenants -5,796-5,828-2,453-3,343 Operating costs -16,715-18,611-8,660-8, mln improvement year on year Deconsolidation IOW, asset rotation and negative L-f-l of - 2,6mln, Divestment non-core and cost control Enlargement portfolio, mln one-off in BE Letting costs (Deloitte) in HY1 Net rental income 91, ,160 34,590 56,734 Administrative costs -6,914-7,711-3,075-3,839 Financing income 2, , Financing costs -30,777-42,391-10,913-19,864 Result minority interests 2,377-2, mln one-off from settlement withholding tax Belgian Authority IOW, Lower debt, improved conditions in refinancing agreement, changes in swap portfolio IOW result after deconsolidation Direct investment result before tax 58,511 59,234 25,433 33,078 Corporate income tax Direct result att. to minorities -7,811-10, ,811 Minority share before sale to minority Direct investment result 50,575 48,451 25,426 25,149 Indirect investment result 13, ,348-4,032 17,251 Total result 63, ,897 21,394 42,400 Significant improvement on all elements: valuations, asset sales, IOW sale, value of derivatives 33
35 Financial highlights - Netherlands x 1,000 FY 2015 FY 2014 Gross rental income 90,796 93,333 Service costs not recharged to tenants - 5,216-5,027 Operating costs -17,377-16,253 Net rental income 68,203 72,053 L-f-l in offices Roll out HNK, sale non core and cost control Maintenance and one-off higher contribution to associations of owners Q1-16: IFRIC 21 Levies/property taxes Administrative costs -6,018-5,833 Financing income 2, Financing costs -24,694-30,509 Direct investment result before tax 40,031 35,832 Corporate income tax 18-7 Direct result att. to minorities - - Direct investment result 40,048 35,816 Indirect investment result 10, ,894 Total result 10, ,078 34
, asset sales ( 43,3mln), acquisitions ( 169 mln), investments ( 16,8 mln) and revaluations ( 1,4 mln).")
36 Balance sheet highlights x 1,000 31/12/15 30/6/15 31/12/14 Real estate investments 1,203,465 1,048,940 1,668,176 Total shareholders equity 660, , ,302 Shareholders equity of NSI 660, , Deconsolidation of IOW ( 636 mln), asset sales ( 43,3mln), acquisitions ( 169 mln), investments ( 16,8 mln) and revaluations ( 1,4 mln). Industrial portfolio ( 61,2 mln) classified as held for sale Minority stake mln Positive result ( 63,8 mln) - dividend payments ( 35.8 mln), value 15.2% stake IOW ( 51.4 million) Debt to credit institutions (excl. derivatives) 542, , ,483 Deconsolidation of net Belgian debt and net investment Average cost of debt (%) Net loan to value (%) Average debt maturity (years) As result of improved conditions in refinancing agreement, changes in derivative portfolio LtV, after asset sales and dividend distribution, 38.5% at present Fixed interest debt (%) ,7 Interest coverage ratio NAV ( /share) EPRA NAV ( /share) Minimum coverage policy = 70% Minimum ICR is 2 First increase in NAV since
37 36 5 CONCLUSION
38 Outlook NSI expects to improve the overall occupancy rate of the total portfolio; Improvement of the occupancy rate of office portfolio Relatively stable development of the occupancy rate in retail portfolio. GRI of Dutch portfolio (excluding sold industrial portfolio) will show a slightly improving trend HNK expected to largely compensate for negative l-f-l growth in traditional office portfolio Impact divestment IOW in 2016 vs 2015 amounts to approx mln in GRI and approx. 8.5 mln in direct result Impact divestment industrial portfolio in 2016 vs 2015 amounts to approx. 3.7 mln in GRI and approx. 2.5 mln in direct result Impact IFRIC 21 directive on operating costs in HY1 37
39 APPENDIX
40 Recognition of IOW stake in 2015 Recognition of NSI s remaining 15,2% share in IOW Impact on Balance sheet as per 31 December 2015: million Balance sheet total decreased by million Debt to credit institutions decreased by million 15.2% share classified as minority interest at 51.4 million: 20,75/share Impact on P&L Total DR HY1-15: 7,8 Million (incl one-off) Total DR HY2-15: 2,3 Million + reduction Interest DR 2015:10,2 million (2014: 12,6 million) Reinvestment after 1 quarter 39
41 2015: Turning point in Dutch revaluations HY1 15 HY In millions 2015 Bookvalue 31/121/15 Offices Retail LSR Industrial LSR Retail Offices Industrial Total 1.4 1,203.5 Positive revaluation of the office portfolio sustained for second reporting period, after a long period of negative revaluations ( 630 million since 2008, of which 75% in offices) - to 9.1 million in total in driven by slight decrease in market yields and market rents - Includes transaction costs of acquisitions (cobra portfolio) of approx. 9 million Offset by negative revaluations in the retail portfolio - to 9.4 million in total in driven by increasing market yields The value of the large scale retail portfolio saw an increase of 4.3 million in total in 2015, the industrial portfolio decreased by 2.6 million in total in
42 Investment highlights Year Development Acquisition of portfolio Philips Pension fund and Swiss assets Merger with VastNed O/I Redevelopment of "De Rode Olifant" resulted in Spaces as tenant Start of HNK with launching property in Rotterdam Exit from Switzerland >90% completed Divesting non core asset portfolio Divesting 35% of outstanding shares IOW (listed in Belgium) Acquisition 8 high quality office assets No negative valuations of assets ( 630 million since 2008) Q Divesting remaining part of outstanding shares IOW Divesting Industrials portfolio 41

 7.1 Amsterdam South-Axis 8,687 sq m 2.")
 4.")
 6.")


43 1 Vivaldi 1 2 Vivaldi 2 Location: Total size: Passing rent: WAULT (yrs) 14.4 Amsterdam South-Axis 9,592 sq m 2.4 mio Occupancy: 100% Tenure Multi tenant (leased to operator) Location: Total size: Passing rent: WAULT (yrs) 7.1 Amsterdam South-Axis 8,687 sq m 2.3 mio Occupancy: 100% Tenure Multi tenant, leased to operator 3 Centerpoint 1 4 Centerpoint 2 Location: Total size: Passing rent: WAULT (yrs) 4.8 Amsterdam South-East 9,011 sq m 1.9 mio Occupancy: 98.9% Tenure Multi tenant Location: Total size: Passing rent: WAULT (yrs) 6.0 Amsterdam South-East 6,249 sq m 1.3 mio Occupancy: 100% Tenure Single tenant 5 Alexanderpoort 6 Alexanderhof Location: Rotterdam Alexander Location: Rotterdam Alexander Total size: 9,408 sq m Total size: 3,120 sq m Passing rent: 1.5 mio Passing rent: 0.5 mio WAULT (yrs) 3.1 Occupancy: 88.5% WAULT (yrs) 3.0 Occupancy: 94% Tenure Multi tenant Tenure Multi tenant 7 het Binnenhof 8 Ypsilon Location: Den Bosch, Paleiskwartier Location: Leiden, Bio Science Park Total size: 10,442 sq m Total size: 9,418 sq m Passing rent: 1.5 mio Passing rent: 1.6 mio WAULT (yrs) 5.9 WAULT (yrs) 4.5 (break-date) Occupancy: 90.6% Occupancy: 100% Tenure Multi tenant Tenure Single tenant


44 Transformations Office Portfolio REALIZED ( ) IN PROGRESS (2016) City Address m² Type of use 1. Amsterdam Koningen Wilhelminaplein 5,019 Residential 2. Amsterdam Arlandaweg 4,257 School 3. Utrecht Reactorweg/Kobaltweg* 10,009 Industrial 4. Zeist Montaubanstraat* 1,539 Residential 5. Amsterdam Karel du Jardinstraat* 6,107 Residential 6. Amersfoort Hardwareweg* 5,858 School 7. Nieuwegein Villawal* 5,783 Residential 8. Amsterdam Delflandlaan* 7,440 Hotel 9. Den Haag Ln Copes v Cattenburgh* 1,705 Residential 10. Velp Arnhemsestraatweg* 2,155 Residential City m² (ca.) Potential type of use Eindhoven 22,650 Residential/ Hotel Amsterdam 1,250 Residential Den Haag 3,000 Residential Utrecht 3,300 Residential/ Social Breda 5,000 Residential Gouda 10,000 Industrial Zoetermeer 3,000 Residential Total realized ca. 50,000 m² Total in pipeline ca. 48,000 m² * = sold assets
Kempen conference. Amsterdam 30 May 2013
 Kempen conference Amsterdam 30 May 2013 Company snapshot Description Dutch REIT: NSI is a real estate asset management company and qualifies as fiscal investment institution under Dutch law (REIT) Full
US Roadshow 1-2 October 2014
 US Roadshow 1-2 October 2014 Contents 1 Introduction 2 Market 3 Portfolio strategy 4 Strategic and operational update 5 Financial 6 Conclusion 7 Appendix 2 1 INTRODUCTION 3 NSI at a glance Description
Investor day -12 November 2015-
 Investor day -12 November 2015- 1 UPDATE Q3 In many ways 2015 marks a turning point After six years of negative revaluations, half year results 2015 finally showed a positive valuation in the Dutch offices
NSI Strategy update and full year results. Roadshow Tel Aviv 7 & 8 April
 NSI Strategy update and full year results Roadshow Tel Aviv 7 & 8 April Equity issue: full focus on operations Successful equity issue 300 million equity raised in a private placement to qualified investors
Preliminary results 2015
 Preliminary results 2015 Increase in direct result in 2015 ` Highlights Update strategy Significant improvement in quality of portfolio through asset rotation in 2015: Share of region Randstad increased
Kempen European Property Seminar 30 May 2012 in Amsterdam
 Kempen European Property Seminar 30 May 2012 in Amsterdam Profile Top 3 listed Dutch mixed real estate fund Dutch REIT / Listed on Amsterdam Euronext (Midkap AMx) Portfolio: 2.29bn TRI: 203m Outstanding
Interim Results Half Year July 2018
 Interim Results Half Year 2018 July 2018 NSI will be the leading specialist in the Dutch office market, with a strong and efficient platform that will drive returns through pro-active asset management,
Interim report per 30 June 2013
 Interim report per 30 June 2013 NSI N.V. Report of the Management Board NSI: investing in operational performance Results Direct investment result for the 1 st half-year of 2013 amounted to 25.5 million
Preliminary results 2014
 Preliminary results 2014 Significant steps in execution strategy: - All non-core office assets sold - Refinancing of 550 million in renewed structure NSI N.V. Highlights 2014 Quality improvement by asset
Triodos Vastgoedfonds
 Quarterly Report Q3 2018 Profile Triodos Vastgoedfonds is an active impact investor making real estate more sustainable. It aims to lead the Dutch office market forward by enhancing environmental performance
Triodos Vastgoedfonds
 Objective Triodos Vastgoedfonds was established in 2004 and is the first sustainable real estate fund in the Netherlands. The fund takes a broad view of sustainability, focusing on climate objectives and
Strategy update Vastned: Focus on growth in selected European cities
 Strategy update Vastned: Focus on growth in selected European cities Divestment of the Turkish portfolio and announcement of share buy-back Strategy update: Focus on growth in selected European cities
Semi-annual report
 Semi-annual report 2018 www.alteravastgoed.nl Contents Contents Institutional investment in Dutch property 3 Results for the first half of 2018 4 Residential 5 Portfolio developments 6 Results 6 Retail
NSI PRELIMINARY FULL YEAR RESULTS 2018 PRELIMINARY RESULTS FULL YEAR 2018
 PRELIMINARY RESULTS FULL YEAR 2018 Execution of strategy fully on track - strongly positioned for multiple opportunities ahead Vacancy rate of 13.8% (down 4.6% versus year-end 2017) EPRA NAV of 39.75 per
Hansteen. Full Year Results to 31 December Tilburg, Netherlands
 Hansteen Full Year Results to 31 December 2016 Tilburg, Netherlands Contents Introduction Hansteen 2016 results Sale announcement Sale of German and Dutch Portfolio 2016 Annual Results 2016 Property Performance
Vesteda Review 2017: further optimisation of investment portfolio and expansion of acquisition pipeline
 Vesteda Review 2017: further optimisation of investment portfolio and expansion of acquisition pipeline Amsterdam, 11 April 2018 In 2017, the Dutch housing market was again in full swing. The number of
2011 first-half earnings
 2011 first-half earnings Bernard Michel Non-executive chairman Christophe Clamageran Chief executive officer Gilles Bonnier Chief financial officer Paris, July 27, 2011 H1 2011 snapshot in mn June 30,
2017 HALF YEAR 25 JULY 2017
 2017 HALF YEAR RESULTS 25 JULY 2017 Strong financial results and robust balance sheet Driving performance through operational excellence and disciplined capital allocation High quality pipeline of growth
Triodos Vastgoedfonds
 Quarterly Report Q1 2018 Profile Triodos Vastgoedfonds is an active impact investor making real estate more sustainable. It aims to lead the Dutch office market forward by enhancing environmental performance
Q HIGHLIGHTS MEUR MEUR % MEUR MEUR 48.4 MEUR 94.8 MEUR % 1.87% +2.2% +1.9 PP +3.5% +73.8% + >100% +19.9% +81.
 Q1-2 2018 HIGHLIGHTS STRENGTHENED OPERATING PERFORMANCE Occupancy rate 94.7% Rental income MEUR 119.0 Rental income lfl MEUR 98.2 +1.9 PP +3.5% +2.2% KPIs SIGNIFICANTLY IMPROVED Results of AM MEUR 94.8
> Financing costs sharply down by 38.6% or MEUR 10.3 to MEUR due to successful refinancing measures undertaken in FY 2017
 Q1 - HIGHLIGHTS PORTFOLIO EFFICIENCY ON VERY ROBUST LEVEL COST SAVINGS AND IMPROVED KPIs > Occupancy rate stable at record level of 94.2% > Adjusted rental income (like-for-like) rose 3.7% > Overall rental
STEADY STRATEGY ROLLOUT
 Press release STEADY STRATEGY ROLLOUT Negative value movements mostly due to Spanish portfolio Key points 9M 2012 (in brackets: 9M 2011) Direct investment result 47.1 million ( 50.6 million) Values movements
VASTNED RETAIL REALISES LOWER DIRECT INVESTMENT RESULT, BUT PROPERTY VALUES UP FOR SECOND CONSECUTIVE QUARTER
 Interim report VASTNED RETAIL REALISES LOWER DIRECT INVESTMENT RESULT, BUT PROPERTY VALUES UP FOR SECOND CONSECUTIVE QUARTER Reinier van Gerrevink, CEO VastNed Retail: Lease negotiations provide us with
Investor presentation H results
 Investor presentation H1 2011 results Recent highlights New lettings in Belgian and US office portfolio. Occupancy rate improving Heads of terms agreed for hotel in Eilan-project: 20 yr fixed lease, operator
PRESS & ANALYST MEETING
 BEYOND REAL ESTATE PRESS & ANALYST MEETING 2 HALF YEAR RESULTS 31 July 2018 3 Agenda 1. Nature of the portfolio 2. Important activities & developments in 2018 3. Financial results 30 June 2018 4. Property
Threats and opportunities in Dutch Office Investment Market
 9th April 213 Threats and opportunities in Dutch Office Investment Market Alphons Spaninks Local Head of Asset Management Benelux & Nordics Real Estate Investment Seminar 213 Dutch Real Estate: Office
Interim results August 19, 2015 Executive Board Heijmans N.V.
 Interim results 2015 August 19, 2015 Executive Board Heijmans N.V. Welcome The Student Hotel Transformation Parool & Trouw Building Amsterdam Heijmans benefits from recovering housing market, negative
HALF-YEAR 2018 RESULTS IR-PRESENTATION 30 AUGUST 2018
 HALF-YEAR 2018 RESULTS IR-PRESENTATION 30 AUGUST 2018 1 Disclaimer This communication contains specific forward-looking statements, beliefs or opinions, including statements with respect to objectives,
Dutch Property Tour April 15, 2014
 Dutch Property Tour April 5, 204 Today s schedule Introduction, Wereldhave Schiphol Ronald van der Mark, CEO Action Dirk Anbeek, CEO Wereldhave Belinde Bakker, Managing Director NL De Eggert, Purmerend
CONTENT. 01 Highlights. 02 Portfolio Performance. 03 Optimisation of Financing Structure. 04 FY 2017 Results. 05 Outlook FY
 CONTENT 01 Highlights 02 Portfolio Performance 03 Optimisation of Financing Structure 04 FY 2017 Results 05 Outlook FY 2017 2 IMMOFINANZ RESTRUCTURING 5/2015 12/2017 Sale of logistics asset class - focus
/ Investment portfolio 2.418,2 mln 2.646,0 mln Shareholders equity 3) 1.686,5 mln 1.
 1.686,5 mln 1.") Results 2009 Key items Direct result per share stable at 4.93 (2008: 4.92) Property revaluation -9.1% (until Q3 2009: -8.3%) Net asset value 73.77 per share (2008: 83.74) Solvency stable at 70% (2008:
Results 2009 Key items Direct result per share stable at 4.93 (2008: 4.92) Property revaluation -9.1% (until Q3 2009: -8.3%) Net asset value 73.77 per share (2008: 83.74) Solvency stable at 70% (2008:
AUDIOCAST PRESENTATION Q3/2017
 19.10.2017 AUDIOCAST PRESENTATION Q3/2017 Q3/2017: GOOD OPERATIONAL RESULTS IN SWEDEN AND NORWAY HIGHLIGHTS Q3/2017 4.7% INCREASE IN EPRA EPS TO EUR 0.133 - Overall net rental income growth and lower administrative
Hansteen. Half Year Results to 30 June Castrop-Rauxel, Germany
 Hansteen Half Year Results to 30 June 2016 Castrop-Rauxel, Germany Introduction Hansteen - Pan European Real Estate Investment Trust (REIT) Pan European REIT Five countries Regional teams in 15 offices
Financial Results for 3 rd Quarter November 2017
 Financial Results for 3 rd Quarter 2017 2 November 2017 Important Notice This presentation shall be read in conjunction with OUE Commercial REIT s Financial Results announcement for 3Q 2017 dated 2 November
Financial Results for 4 th Quarter and Year Ended 31 December January 2019
 Financial Results for 4 th Quarter and Year Ended 31 December 2018 30 January 2019 Important Notice This presentation should be read in conjunction with the announcements released by OUE Commercial REIT
Press release nine months results 2010 VASTNED RETAIL REALISES STABLE DIRECT INVESTMENT RESULT AND POSITIVE VALUE MOVEMENTS IN PROPERTY PORTFOLIO
 Press release nine months results VASTNED RETAIL REALISES STABLE DIRECT INVESTMENT RESULT AND POSITIVE VALUE MOVEMENTS IN PROPERTY PORTFOLIO Reinier van Gerrevink, CEO VastNed Retail: The letting market
Vastned results in line with expectations
 HALF YEAR REPORT 2 AUGUST 2016 2016 HALF-YEAR RESULTS Vastned results in line with expectations Highlights HY1 2016: - Vastned attracts strong and distinctive retailers for several premium city high street
Summary 1-2. Chairman's and Managing Director's report 3-9. Independent auditor s review report 10
 REPORT AND ACCOUNTS June 2018 INDEX Page Summary 1-2 Chairman's and Managing Director's report 3-9 Independent auditor s review report 10 Condensed Consolidated Statements of Financial Position 11-12 Condensed
Sustained growth from continued development, construction and marketing efforts in core market segments
 Ghelamco Invest NV (Previously denominated as International Real Estate Construction NV) Half year results 30.06.2014 Sustained growth from continued development, construction and marketing efforts in
Corporate. Presentation September 2017
 Corporate www.larespana.com Presentation September 2017 Snapshot 2 First IPO of a Spanish REIT listed on the Spanish Stock Exchange Shareholder Structure Focused on creating both sustainable income and
Q1 Q4 Q1 Q4. Full Year Results. Audiocast presentation. CEO Marcel Kokkeel CFO, Exec. VP Eero Sihvonen
 Full Year Results Audiocast presentation CEO Marcel Kokkeel CFO, Exec. VP Eero Sihvonen 2 : A YEAR OF ACTION WITH SOLID PERFORMANCE AND A MUCH STRONGER BALANCE SHEET : A year of action EUR 200 million
2018 HALF YEAR 26 JULY 2018
 2018 HALF YEAR RESULTS 26 JULY 2018 H1 2018 Another period of delivery Strong financial results and capital structure Disciplined capital allocation improving portfolio scale and quality, reducing risk
Press release. Annual figures 2008
 Press release Annual figures 2008 VASTNED RETAIL: DIRECT INVESTMENT RESULT 2008 3.71 PER SHARE ( 3.85 BEFORE ONE-OFF COSTS); PROPERTY VALUE DECREASES RESULT IN NEGATIVE INDIRECT INVESTMENT RESULT OF 6.82
PRESS RELEASE ANNUAL RESULTS Results underline strategic choice. 6 March 2014 HEADLINES
 PRESS RELEASE 6 March 2014 2013 ANNUAL RESULTS Results underline strategic choice HEADLINES - Vastned realises strategic objectives through active acquisition and divestment policy - Direct investment
DREAM GLOBAL REIT ANNOUNCES TRANSFORMATIONAL ACQUISITION IN THE NETHERLANDS FOR $903 MILLION AND $300 MILLION PUBLIC OFFERING OF UNITS
 DREAM GLOBAL REIT ANNOUNCES TRANSFORMATIONAL ACQUISITION IN THE NETHERLANDS FOR $903 MILLION AND $300 MILLION PUBLIC OFFERING OF UNITS NOT FOR DISTRIBUTION TO U.S. NEWS WIRE SERVICES OR DISSEMINATION IN
PRESS RELEASE INTERIM FINANCIAL REPORT OF THE STATUTORY MANAGER
 PRESS RELEASE INTERIM FINANCIAL REPORT OF THE STATUTORY MANAGER UNDER EMBARGO UNTIL 05/11/2015 08:30 AM NET OPERATING RESULT OF EUR 5.33 MILLION (EUR 0.58 PER SHARE), GROWTH OF 40.3% COMPARED WITH THE
THE NETHERLANDS INDUSTRIAL PROPERTY MARKET
 March 214 Contents 1. Take-up of industrial space 2. Supply of industrial space STATE OF AFFAIRS THE NETHERLANDS INDUSTRIAL PROPERTY MARKET 3. Industrial property prices 4. Industrial property investments
Financial Results Q August 2012
 Financial Results Q2 2012 3 August 2012 Agenda 1. Performance highlights and our priorities Kari Inkinen 2. Market Update Kari Inkinen 3. Financials Erik Hjelt 4. Business Update Kari Inkinen 2 1. Performance
Financial Results Q Kari Inkinen, President and CEO Erik Hjelt, CFO Pia Arrhenius, SVP, IR
 Financial Results Q2 2009 Kari Inkinen, President and CEO Erik Hjelt, CFO Pia Arrhenius, SVP, IR Introduction Market review Business overview Financial overview Appendix 2 Overview of reporting segments
Ghelamco Invest NV Half year results
 Ghelamco Invest NV Half year results 30.06.2017 Sound financials resulting from continued efforts in development, construction and marketing efforts in core market segments - Net profit for the period
FINANCIALS. Arnaud Laviolette Group CFO. Investor day 13 December 2017
 FINANCIALS Arnaud Laviolette Group CFO ACTIVITIES ARE FINANCED INDEPENDENTLY EUR million 30 June 2017 AUTO BELRON MOLESKINE GROUP Loans & borrowings 189.9 708.8 189.6 1,088.3 Inter-group -330.2 180.5 149.7
COMPANY PRESENTATION MARCH 2018 (AS PER )
") COMPANY PRESENTATION MARCH 2018 (AS PER 31.12.2017) DIC ASSET AG KEY STRENGTHS INVESTMENT HIGHLIGHTS S-DAX listed player in the commercial real estate market in Germany, fully complying to highest market
COMPANY PRESENTATION MARCH 2018 (AS PER 31.12.2017) DIC ASSET AG KEY STRENGTHS INVESTMENT HIGHLIGHTS S-DAX listed player in the commercial real estate market in Germany, fully complying to highest market
9M 2018 RESULTS 09 NOVEMBER 2018 TLG IMMOBILIEN AG 9M 2018 RESULTS
 TLG IMMOBILIEN AG 9M 208 RESULTS DISCLAIMER This presentation includes statements, estimates, opinions and projections with respect to anticipated future performance of TLG IMMOBILIEN ("Forward-Looking
Deutsche Wohnen SE.» 9M 2017 results. Conference Call, 14 November 2017
 Deutsche Wohnen SE» 9M 2017 results Conference Call, 14 November 2017 1 » Agenda 1 Highlights 9M 2017 2 Portfolio 3 Financials 4 Appendix 2 » Highlights 9M 2017 Strong operating business L-f-l rental growth
Amsterdam Schiphol 25 July Half-year results 2014
 Amsterdam Schiphol 25 July 2014 Half-year results 2014 Highlights Financial performance H1 2014 H1 2013 Direct result per share 1.73 1.76 Indirect result per share (1.50) (1.15) EPRA NAV per share 62.48
Interest Rates, Cap Rates, and the Real Estate Cycle
 Interest Rates, Cap Rates, and the Real Estate Cycle Stephen Hester, Chief Executive We are real estate investors and create value by actively managing, financing and developing prime commercial property
MILLION (+1.0%) VALUE INCREASE VASTNED RETAIL PROPERTY PORTFOLIO IN Q1 2011; DIRECT INVESTMENT RESULT MARGINALLY DOWN
 VALUE INCREASE VASTNED RETAIL PROPERTY PORTFOLIO IN Q1 2011; DIRECT INVESTMENT RESULT MARGINALLY DOWN") Press release first quarter figures 2011 20 MILLION (+1.0%) VALUE INCREASE VASTNED RETAIL PROPERTY PORTFOLIO IN 2011; DIRECT INVESTMENT RESULT MARGINALLY DOWN Reinier van Gerrevink, VastNed Retail CEO:
Press release first quarter figures 2011 20 MILLION (+1.0%) VALUE INCREASE VASTNED RETAIL PROPERTY PORTFOLIO IN 2011; DIRECT INVESTMENT RESULT MARGINALLY DOWN Reinier van Gerrevink, VastNed Retail CEO:
Autumn Presentation. la foncière parisienne
 Autumn 2017 Presentation I. Background II. Portfolio centered on Paris Central Business District III. Key aspects of TERREÏS Model IV. H1 2017 Results 2 TERREÏS at a glance Property investment company
AMVEST RESIDENTIAL CORE FUND
 AMVEST RESIDENTIAL CORE FUND FUND FACT SHEET AMVEST RESIDENTIAL CORE FUND Almere FOCUS AREAS Groningen The Fund has selected four focus areas that score well above average on economic growth, the development
INVESTOR PRESENTATION
 INVESTOR PRESENTATION Table of Contents Introduction to SEGRO 3 Market drivers 10 High quality development pipeline 15 Balance sheet and financing 21 Operating performance 26 Portfolio overview 30 APP
Citi-REITAS-SGX C-Suite Singapore REITs and Sponsors Forum
 Citi-REITAS-SGX C-Suite Singapore REITs and Sponsors Forum 23 August 2018 Important Notice This presentation shall be read in conjunction with OUE Commercial REIT s Financial Results announcement for 2Q
Report of the Executive Board for Annual General Meeting - Accelerate Ralph Hamers, CEO ING Group Amsterdam 8 May 2017
 Report of the Executive Board for 2016 Annual General Meeting - Accelerate Ralph Hamers, CEO ING Group Amsterdam 8 May 2017 Think Forward: creating a differentiating customer experience 2 35.8 million
Financial Results for 4 th Quarter 2017 and Year Ended 31 December 2017
 Financial Results for 4 th Quarter 2017 and Year Ended 31 December 2017 31 January 2018 Important Notice This presentation shall be read in conjunction with OUE Commercial REIT s Financial Results announcement
Agenda. About IREIT Global. Key Highlights. Portfolio Summary. Economy & Real Estate Review. Looking Ahead. Appendix : Overview of Tikehau Capital
 4Q 2017 and FY 2017 Results Presentation 14 February 2018 Agenda About IREIT Global Key Highlights Portfolio Summary Economy & Real Estate Review Looking Ahead Appendix : Overview of Tikehau Capital 2
FY2017 Annual General Meeting 19 April 2018
 FY2017 Annual General Meeting 19 April 2018 Agenda Key Highlights About Tikehau Capital European Market Review Portfolio Overview Financial Highlights Conclusion 2 Key Highlights FY2017 Key Highlights
Annual figures February 2016 Board of Directors Heijmans N.V.
 Annual figures 2015 25 February 2016 Board of Directors Heijmans N.V. Heijmans 2015: negative result, improvement visible second half of the year Improvement result remains top priority Bert van der Els
Investor presentation Q results
 Investor presentation Q1 2011 results Recent highlights Successful issue of US$ 300m senior notes (US private placement) Sale non-strategic assets in UK of 15.1m, 7% above latest valuation Sale of a further
AIMS AMP CAPITAL INDUSTRIAL REIT
 AIMS AMP CAPITAL INDUSTRIAL REIT FY2013: 2 nd Quarter Ended 30 September 2012 Results Presentation 24 October 2012 Important Notice Disclaimer This Presentation is focused on comparing actual results for
Agenda. About IREIT Global. Key Highlights. Portfolio Summary. European Market Overview. Looking Ahead. Appendix : Overview of Tikehau Capital
 2Q2018 Results Presentation 8 August 2018 Agenda About IREIT Global Key Highlights Portfolio Summary European Market Overview Looking Ahead Appendix : Overview of Tikehau Capital 2 About IREIT Global About
FULL YEAR RESULTS FY 2013/14. Press Conference 04 August 2014
 FULL YEAR RESULTS FY 2013/14 Press Conference 04 August 2014 1 CONTENT 01 Financial Year 2013/14: Full Year Results 02 Financial Year 2013/14: Major Achievements 03 Financial Year 2014/15: Outlook 04 Appendix
Financial Results Year February 2013
 Financial Results Year 2012 1 February 2013 Agenda 1. Performance highlights and our priorities Kari Inkinen 2. Market Update Kari Inkinen 3. Financials Erik Hjelt 4. Business Update Kari Inkinen 2 Performance
Investor presentation 9M 2012 results
 Investor presentation 9M 2012 results Key results: stabilising in Q3 Direct result p/s: 3.05 (-17.6% yoy) Q3: + 0.01 vs Q2 Revaluation portfolio: -4.75% Q3: -0.25% NAV p/s: 63.72 (-12.9% yoy) Q3: +0.4%
Financial Targets & Strategic Priorities
 Financial Targets & Strategic Priorities A G E A S I N V E S T O R D AY 6 TH O F J U N E 2 0 17 I LISBON PORTUGAL Ageas... Continuing the growth journey FY 2015 FY 2016 Insurance excl. UG/L without Hong
INTERIM FINANCIAL REPORT 30 JUNE 2017 LEADER IN SHOPPING CENTRES IN CENTRAL AND EASTERN EUROPE
 INTERIM FINANCIAL REPORT 30 JUNE 2017 LEADER IN SHOPPING CENTRES IN CENTRAL AND EASTERN EUROPE 02 I Our Vision OUR VISION Atrium s vision is to remain one of the leading owners and managers of food, fashion
An Unique Way to invest in Apartments
 An Unique Way to invest in Apartments Topics 1. Company profile & key figures 2. Belgian residential market 3. Our responses to the world s evolutions 4. Stock performance & return 2 Topics 1. Company
Bank and Bondholder presentation
 Bank and Bondholder presentation 19 September 2013 0 Geopost, Enfield Agenda Welcome and strategic overview (David Sleath, CEO) Operational and financial performance (Justin Read, Group Finance Director)
10th Annual General Meeting. Vienna, 20 May 2011
 10th Annual General Meeting Vienna, 20 May 2011 Market overview and company development 2010 Earnings performance and balance sheet indicators 2010 Implementation of strategy Overview 1 st Quarter 2011
ENCORE+ DIVERSIFIED AND BALANCED CORE+ PROPERTY FUND
 ENCORE+ DIVERSIFIED AND BALANCED CORE+ PROPERTY FUND Q1 2017. This document is for professional clients and institutional/qualified investors only. It is not to be distributed to or relied on by retail
3Q 2017 and 9M 2017 Results Presentation 9 November 2017
 3Q 2017 and 9M 2017 Results Presentation 9 November 2017 Agenda About IREIT Global Key Results Highlights Portfolio Summary Economy & Real Estate Review Looking Ahead Appendix : Overview of Tikehau Capital
Financial Results for 3 rd Quarter 2016
 Financial Results for 3 rd Quarter 2016 1 November 2016 Important Notice This presentation shall be read in conjunction with OUE Commercial REIT s Financial Results announcement for 3Q 2016 dated 1 November
BERLINSIDERS HALF YEAR FINANCIAL REPORT
 2 0 1 7 BERLINSIDERS HALF YEAR FINANCIAL REPORT 2017 KEY FIGURES HALF YEAR FINANCIAL REPORT 2017 KEY FIGURES KEY BALANCE SHEET FIGURES In EUR thousand Jun 30, 2017 Dec 31, 2016 Fair value of properties
AIMS AMP CAPITAL INDUSTRIAL REIT
 AIMS AMP CAPITAL INDUSTRIAL REIT FY2014: Third Quarter ended 31 December 2013 Results Presentation 29 January 2014 Important notice Disclaimer This Presentation is focused on comparing actual results for
Agenda. About IREIT Global. Key Highlights. Portfolio Summary. Economy & Real Estate Review. Looking Ahead. Appendix : Overview of Tikehau Capital
 2Q 2017 and 1H 2017 Results Presentation 10 August 2017 Agenda About IREIT Global Key Highlights Portfolio Summary Economy & Real Estate Review Looking Ahead Appendix : Overview of Tikehau Capital 2 About
NINE MONTHS FINANCIAL RESULTS NOVEMBER 19, 2015
 NINE MONTHS FINANCIAL RESULTS NOVEMBER 19, 2015 01 ADO OVERVIEW AND INVESTMENT HIGHLIGHTS Overview ADO the pure play Berlin residential specialist Investment highlights 1 2 3 Berlin residential pure play
2017 Annual Results. 12 March la foncière parisienne
 2017 Annual Results 12 March 2018 Content I. Introduction II. Portfolio III. Rental business IV. Financial results V. Outlook 2 2017 key figures EPRA liquidation NAV Rental income strategic assets (Offices
FINANCIAL STATEMENTS Stockmann Group 14 February 2018
 FINANCIAL STATEMENTS 2017 Stockmann Group 14 February 2018 HIGHLIGHTS IN 2017 Group s gross margin 55.8% (55.7) Group s adjusted operating result, EUR mill. 12.3 (30.9) Fair value of properties, EUR mill.
UBS Global Real Estate CEO/CFO Conference. December 1/2, 2015
 UBS Global Real Estate CEO/CFO Conference December 1/2, 2015 01 ADO OVERVIEW AND INVESTMENT HIGHLIGHTS Overview ADO the pure play Berlin residential specialist Investment highlights 1 2 3 Berlin residential
ACQUISITION OF FOUR FLEXIBLE LONDON OFFICES VALUED AT MILLION. - Live webcast today at 9:30am (UK time) -
 -") RDI REIT P.L.C. (formerly Redefine International P.L.C.) (Incorporated in the Isle of Man) (Registered number 010534V) LSE share code: RDI JSE share code: RPL LEI: 2138006NHZUMMRYQ1745 ISIN: IM00B8BV8G91
RDI REIT P.L.C. (formerly Redefine International P.L.C.) (Incorporated in the Isle of Man) (Registered number 010534V) LSE share code: RDI JSE share code: RPL LEI: 2138006NHZUMMRYQ1745 ISIN: IM00B8BV8G91
H results. August Unique investment gateway to emerging markets
 H1 2012 results August 2012 markets We initiate, develop and manage long term cash flow generating assets, mainly in Real Estate and Water Infrastructure in promising Emerging Markets. markets Kardan in
HIAG Immobilien Half-Year Results September HIAG Immobilien, 5 September
 Half-Year Results 206 5 September 206, 5 September 206 Disclaimer The financial data as well as the other information presented herein constitute selected information. The information in this presentation
VastNed Group. H results Analysts' meeting Okura Hotel Amsterdam August 10, :00AM
 VastNed Group H1 2007 results Analysts' meeting Okura Hotel Amsterdam August 10, 2007 11:00AM VastNed Retail: H1 2007 Key issues Property yields still go down and do not (yet) follow current capital markets
Park Street Nordicom. Strategy Day April 2018
 Park Street Nordicom Strategy Day April 2018 Park Street Nordicom An Overview Park Street Nordicom owns 60 assets with 250,000 SqM across Denmark valued at DKK 2.5 billion. The Portfolio generates around
Results Presentation. Half Year Results ending 28 February 2013
 Results Presentation Half Year Results ending 28 February 2013 Contents Page Introduction 03 06 Financial Results 07 11 Operations 12 19 Asset Management 20 26 Looking Forward 27 28 Additional Information
CONFERENCE CALL FY2016 PRELIMINARY RESULTS 8 MARCH 2017
 CONFERENCE CALL FY2016 PRELIMINARY RESULTS 8 MARCH 2017 RETAIL TURNOVER 2016 1 RETAILERS Retail sector % change in 2016 rent-to-sales ratio in % % of sales % of space Department stores -0.8 6.1 7.8 13.5
ING Challengers & Growth Markets
 ING Challengers & Growth Markets Goldman Sachs European Financials Conference Aris Bogdaneris, Head of Challengers & Growth Markets Paris 9 June 2016 Key points Think Forward strategy at work in Challengers
H Results July H Results - Lar España Real Estate. July 27 th,
 H1 2018 www.larespana.com Results July 2018 July 27 th, 2018 Agenda 01 02 03 04 05 H1 2018 Highlights Corporate Activity H1 2018 Financial Results Business Performance Closing Remarks 01 H1 2018 Highlights
Half yearly financial statement 2014
 Half yearly financial statement 2014 Vilvoorde, 24 July 2014 Contents 1. Overall summary real estate markets 1 2. Interim report Key figures 3 Profit 3 Direct result 4 Indirect result 4 Shareholders equity
NET OPERATING RESULT OF EUR 3.54 MILLION GROWTH OF 6.3% COMPARED WITH Q1 2013
 REGULATED INFORMATION INTERIM STATEMENT UNDER EMBARGO UNTIL 15/05/2014 8.45 AM NET OPERATING RESULT OF EUR 3.54 MILLION GROWTH OF 6.3% COMPARED WITH Q1 2013 OCCUPANCY RATE OF 95% AVERAGE LEASE TERM UNTIL
Oosterhamrikkade Groningen 180 units Annual results 2017 Xior Stu d ent Hou sin g 9 Feb r u ar y 2018
 Oosterhamrikkade Groningen 180 units Annual results 2017 Xior Student Housing 9 February 2018 Disclaimer This presentation has been prepared by the management of XIOR STUDENT HOUSING NV (the "Company")
FACTS&FIGURES
 2013-2014 FACTS&FIGURES We are in a changing environment and by combining each other s strengths we can make the impossible possible The Eurapco Alliance is a unique and strong partnership of leading European