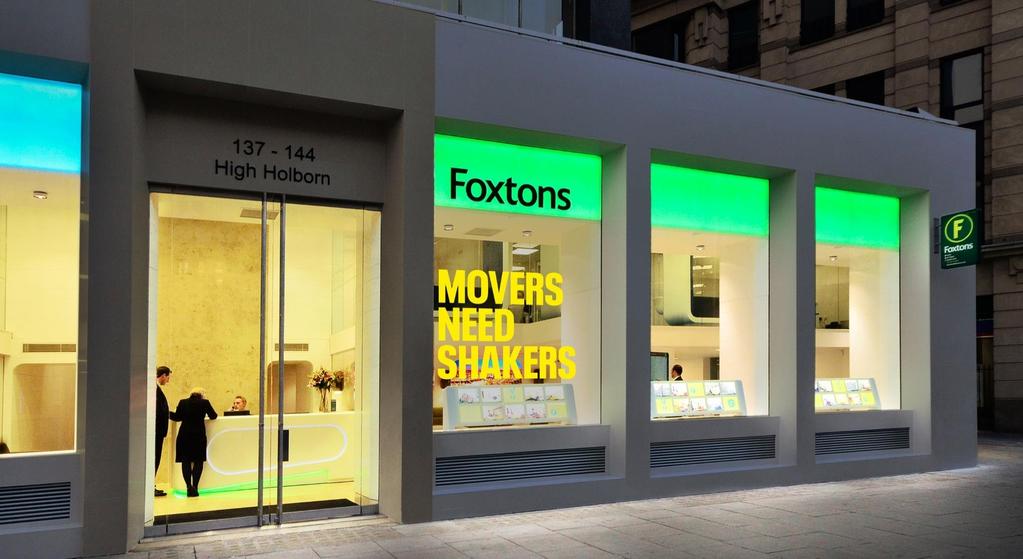
Foxtons Preliminary results presentation For the year ended December 2018
|
|
|
- Nickolas Sullivan
- 5 years ago
- Views:
Transcription

1 Foxtons Preliminary results presentation For the year ended December 2018
2 Important information This presentation includes statements that are, or may be deemed to be, forward-looking statements. These forward-looking statements can be identified by the use of forward-looking terminology, including the terms believe, estimates, plans, projects, anticipates, expects, intends, may, will, or should or, in each case, their negative or other variations or comparable terminology. These forward-looking statements include matters that are not historical facts and include statements regarding the Company s intentions, beliefs or current expectations. Any forward-looking statements in this presentation reflect the Company s current expectations and projections about future events. By their nature, forwardlooking statements involve a number of risks, uncertainties and assumptions that could cause actual results or events to differ materially from those expressed or implied by the forward-looking statements. These risks, uncertainties and assumptions could adversely affect the outcome and financial effects of the plans and events described herein. Forward-looking statements contained in this presentation regarding past trends or activities should not be taken as a representation that such trends or activities will continue in the future. You should not place undue reliance on forward-looking statements, which speak only as of the date of this presentation. No representations or warranties are made as to the accuracy of such statements, estimates or projections. 2

3 Overview Nic Budden, Chief Executive Officer 3
4 GROUP OVERVIEW FINANCIAL PERFORMANCE Group revenue in the year 111.5m delivering 3.6m EBITDA Decline in profitability driven by lower revenue in the sales business and 4m investments in people, brand and technology Lettings revenue 67.0m (+1%). Volumes broadly flat with higher revenue per deal. Remains a resilient, recurring revenue stream Sales revenue 36.2m (-15%). Impacted by continued market weakness causing lower transaction volumes Mortgage broking revenue 8.3m (-6%). Solid performance in a constrained sales market Adjusted items charge of 15.7m, 12.5m of which is non cash. Relates to write down of the goodwill in the sales segment and closure of six branches in Q4. Cash costs will be incurred over 3 years Continued cash generation supporting strong balance sheet with no debt. 17.9m net cash at period end STRATEGY AND OPERATIONAL FOCUS Maintain number 1 London market position in listings and brand awareness by providing exceptional service and results for our customers (1) Ongoing improvements to My Foxtons including tenants issue tracker and app have been well received Took action to align cost base with market conditions by closing six branches largely in the network s periphery Continued focus on efficiency with marketing spend refocused towards digital channels, reducing cost of acquisition Note: Throughout this presentation EBITDA refers to Adjusted EBITDA. Operating cash flow refers to adjusted operating cash flow. 1) Source: Rightmove, Zoopla, YouGov 4
5 Jan-16 Mar-16 May-16 Jul-16 Sep-16 Nov-16 Jan-17 Mar-17 May-17 Jul-17 Sep-17 Nov-17 Jan-18 Mar-18 May-18 Jul-18 Sep-18 Nov-18 Dec-18 LETTINGS MARKET UPDATE 1,000, , , , , , , , , ,000 0 Number of privately rented homes in London (Number of households) (1) % 6% 4% 2% 0% -2% -4% -6% -8% Change in rental prices (1 year change) (2) Market fundamentals remain strong with 30% of households in London in private rentals (1m), nearly double the proportion in rest of UK (3) Rental prices generally reversed the downward trends seen since Q reflecting; (i) decrease in supply of rental properties mirroring the reduction in buy-to-let transactions due to regulatory and lending changes, and (ii) wage growth since average rent 2.5% higher than prior year, bringing rents back to levels seen in 2015 (2018: 455 per week, 2017: 444 per week) (4) Increasing complexity for landlords - with additional regulatory, legislative and tax changes introduced in the last couple of years - driving flight to higher quality agents better able to safeguard landlord interests Strong tenant take-up of Institutional PRS as high-quality, professionally managed schemes reach completion. However majority of developments still at planning or build stage (c.75%) (5) 1) Source: Department for Communities and Local Government 2) Source: Foxtons research. 3m moving average 3) Source: Department for Communities and Local Government 4) Source: Foxtons research 5) Source: Molior 5
6 London annual transaction volumes England & Wales annual transaction volumes Price / earnings ratio SALES MARKET UPDATE 140, , ,000 80,000 Residential property sales transaction volumes (1) London (LHS) England & Wales (ex. London) (RHS) 900, , , , , Affordability key driver of low volumes (House price / earnings ratio) (2) London England & Wales 60,000 40,000 20, , , , , F Sales market continues to be negatively weighed upon by political and macroeconomic uncertainty In addition, rapid London house price inflation post-2009 has not been matched by corresponding wage growth leading to reduced affordability further exacerbated by tighter mortgage lending criteria London house prices inflation slowed in 2018 with average prices broadly flat (3) These combined factors resulted in extremely constrained transaction volumes in London volumes were at levels similar to those seen in 2009 and c.50% below 2007 (4) Foxtons remains number 1 agent in London despite intense competition as market listings levels decrease (5) Note: London defined as the Greater London administrative area. Central London defined as TFL Zone 1 1) Source: Land Registry, Foxtons research. Annualised Jan-Oct ) Source: ONS, Land Registry, Foxtons research 3) Source: Land Registry 4) Source: Land Registry, Foxtons Research. Annualised Jan-Oct ) Source: Rightmove and Zoopla listings 6

7 Financial review Mark Berry, Chief Financial Officer 7
8 A BALANCED BUSINESS THROUGH THE CYCLE Sales Lettings 15% Revenue decrease 1% Revenue increase 15% Volume decrease 1% Volume decrease 0% Revenue per unit flat 2% Revenue per tenancy increase Revenue: 36.2m (2017: 42.6m) Contribution margin 53% preallocation of shared costs (2017: 59%) Sales volumes: 2,529 (2017: 2,962). H1: 1,188; H2: 1,341 Revenue per unit 14.3k (2017: 14.4k) Average Foxtons sales price: 581k (2017: 580k) 36.2m (32% of revenue) 67.0m (60% of revenue) Revenues resilient at 67.0m (2017: 66.3m) Volumes 1% lower at 19,621 (2017: 19,806) Increased revenue per tenancy driven by longer tenancy lengths and some increase in rental prices Contribution margin marginally lower than prior year at 71% (2017: 73%) 33% of portfolio with Foxtons Property Management (2017: 32%) which generally attracts higher renewal rates Mortgage broking Tenant fee ban expected to be implemented in June 2019 Revenue 8.3m (2017: 8.7m) Good performance driven by remortgages in a challenging sales market Revenue per unit 1.9k (2017: 2.1k) 8
9 INCOME STATEMENT Income statement m Change Revenue (5%) Revenue decrease driven by sales business down 15% Lettings revenue 1% higher with 2% increase in revenue per deal partially offset by 1% decrease in units Operating costs (107.9) (102.5) 5% EBITDA (76%) Depreciation, amortisation, LTIP & other gains (5.1) (6.3) (18%) Adjusted items (15.7) (2.3) (Loss) / profit before tax (17.2) 6.5 Selective revenue investments in lettings, technology, brand and digital marketing to drive company growth and position business to capture any future market recovery Continue to proactively review cost base. Further 3m savings expected in FY19 as a result of actions taken Comprised of: ( 9.8m) ( 2.7m) ( 12.5m) Impairment of sales goodwill Branch asset write-down Total non-cash Tax - (1.2) (Loss) / profit after tax (17.2) 5.3 ( 3.2m) ( 15.7m) Onerous lease and exit costs Cash cost to be incurred over next 3 years Total Adjusted items Basic EPS (6.3p) 1.9p Adjusted EPS (1) (0.8p) 2.6p Note: Adjusted EBITDA is defined as profit before tax, finance costs, finance income, depreciation, amortisation, profit on disposal of assets, share-based payments and Adjusted items 1) Excludes Adjusted items 9

10 PRO-ACTIVE COST REDUCTION PROGRAMME Pro-active cost reduction programme since June 2016 has delivered 11m cost savings and supported targeted FY 18 investments ( m) 14m cost reduction programme has delivered 11m cost savings since 2016, allowing us to invest 4m in new initiatives and offset significant inflationary pressure: 11m cost savings implemented since Brexit vote 4m invested into 2018 cost base in retention, commissions, marketing and branding campaign 6 branches closed Q Network of 61 branches with no plans for further closures. Further 3m savings in the FY18 exit rate FY16 cost run rate (as at June 2016) Cost savings FY16-FY18 Inflation FY16-FY18 FY18 investments FY18 cost base FY19 savings FY19F cost base (assuming flat revenues) 10
 Other ( 0.1m) (1.3) Change in cash ( 0.7m) Cash at end of period 17.9m EBITDA Working capital Other gains Capex Cash cost Adj.")
11 CONTINUED CASH GENERATION EBITDA to free cash flow conversion Operating cash flow: 4.3m / 117% conversion ratio Opening cash Uses of cash flow 18.6m Free cash flow 0.1m 2017 Final dividend paid ( 0.7m) Other ( 0.1m) (1.3) Change in cash ( 0.7m) Cash at end of period 17.9m EBITDA Working capital Other gains Capex Cash cost Adj. items Tax Underlying free cash flow Proptech investments Free cash flow Cash generative before dividends paid in respect of 2017: 117% operating cash conversion 1.4m underlying free cash flow before investments in Zero Deposits and Propoly FY19 capex guidance c. 1.0m, depreciation, amortisation and LTIPS c. 5.0m 11
12 FREE CASH FLOW PRIORITIES FREE CASH FLOW PRIORITES Fund investment in the future development of the business Maintain a strong balance sheet Return excess cash to shareholders CORE DIVIDEND POLICY Return 35% - 40% of profit after tax as an ordinary dividend No final dividend to be paid for m returned to shareholders since IPO (1) EXCESS CASH RETURNS POLICY Excess cash after operational needs distributed to shareholders as special dividend The Board remains committed to returning excess cash when appropriate 1) Includes share buy-backs 12
13 FINANCIAL SUMMARY BALANCED BUSINESS BUILT TO WITHSTAND THE CYCLE Resilient lettings performance Subdued sales volumes throughout the year FOCUS ON EFFICIENCY Current infrastructure is integral to maintaining customer service and experience levels Selective investments in marketing and brand, people, tech and data completed in the year Strong underlying cost control maintained in 2018 and continue to review and align cost base with market conditions 11m savings since 2016 and further 3m savings expected in 2019 CASH GENERATIVE WITH NO DEBT Continued cash generation before prior year dividends Year end net cash position of 17.9m and no debt No 2018 dividend in line with Group policy 13

14 Strategy and operational update NicBudden, Chief Executive Officer 14
15 INVESTING IN PEOPLE, TECHNOLOGY AND BRAND TO DELIVER SUPERIOR SERVICE Strategy 2018 Investments 1. Service and brand Continue to deliver premium customer service and results to substantiate our price premium Leverage strong single brand which drives market leading listings Enhanced account management for largest landlords, and launched Foxtons Prime for high value properties and high net wealth customers Enhanced resourcing of lettings service centre to drive landlord and tenant retention After extensive customer research launched new brand campaign articulating Foxtons value proposition and the results we achieve for customers 2. Our people 3. Technology Attract, develop and retain the best people to drive superior service for our customers Prioritise lettings and align sales business to market conditions whilst positioning for growth Use technology to save costs and increase the reach of each branch Innovate with enhanced product delivery Select complimentary investments Restructured pay and commission schemes to attract and keep the best talent in the industry Hired experienced staff to complement existing workforce and launched dedicated China desk Maintained core sales capability to capture any upside from sales market recovery Further investment in digital marketing programme leveraging our brand awareness and data Further upgrades to My Foxtons portal incorporating enhanced property management capabilities Investments in external prop tech companies 4. Lettings Operate in high value London markets Prioritise resource allocation to lettings New retention and loyalty initiatives for existing landlords Launched new products including Zero Deposits for tenants Continue to grow institutional PRS offering 15


16 INVESTING FOR FUTURE GROWTH: GET FOXTONS ON IT BRAND CAMPAIGN Get Foxtons on it brand campaign across digital, public transport, static advertising and branches: 16


 +8% Direct mail efficiency (3) +33% Front")
 Source Google Analytics. H2 2018 vs.")
17 INVESTING FOR FUTURE GROWTH: GET FOXTONS ON IT BRAND CAMPAIGN Get Foxtons on it brand campaign across digital, public transport, static advertising and branches: Strong initial public response: Metric: Net change TrustPilot score: Brand consideration (1) +284% Purchase intent (1) +433% Direct website traffic (2) +8% Direct mail efficiency (3) +33% Front office calls (3) +8% 1) Source YouGov. Dec vs. Jul ) Source Google Analytics. H vs. H ) Source: Foxtons research. H vs. H
18 SUMMARY AND OUTLOOK LONDON S LEADING AGENT Tech-enabled, centralised business with strong single brand and culture of exceptional service and results for all our customers Number 1 market position and brand awareness in London estate agency Well positioned in current environment business remains cash generative, debt free and supports a strong balance sheet Six branches closed in 2018 as we took action to align the cost base with market conditions OUTLOOK Sales business is transactional with limited forward visibility. Pipeline currently slightly below 2018 levels Pleased with progress and momentum in lettings business Continued focus on efficiency, maintaining cash balance and preserving culture 18
19 Appendices 19
20 BALANCE SHEET NET CASH POSITION Goodwill & intangibles m goodwill-write down of sales business Property, plant & equipment Investments Net working capital 0.2 (0.2) Low working capital requirements Net deferred tax (15.7) (15.8) Provisions and deferred revenue (7.5) (5.8) Net cash Net cash position. Expect to replace existing Revolving Credit Facility which expires in July 2019 Net assets
21 SEGMENTAL EBITDA AND KPIs H1 18 H2 18 FY 18 H1 17 H2 17 FY 17 Sales revenue ( m) Sales EBITDA ( m) (3.6) (0.9) (4.5) 1.4 (0.2) 1.2 Sales units 1,188 1,341 2,529 1,544 1,418 2,962 Lettings revenue ( m) Lettings EBITDA ( m) Lettings units 9,430 10,191 19,621 9,435 10,371 19,806 Mortgage broking revenue ( m) Mortgage broking EBITDA ( m) Mortgage broking units 2,120 2,198 4,318 1,992 2,251 4,243 21
22 EARNINGS PER SHARE AND EFFECTIVE TAX RATE Basic earnings ( 17.2m) 5.3m Weighted average number of shares* Basic earnings per share (6.3p) 1.9p Earnings excluding Adjusted items ( 2.1m) 7.3m Adjusted earnings per share (0.8p) 2.6p *Number of shares used for EPS calculation purposes excludes shares held in Treasury Taxation Effective tax rate 0.2% 18.0% Drivers leading to taxable income on the reported loss are the impairment on goodwill, depreciation on leasehold improvements and branch asset write downs that are non-qualifying for capital allowance purposes, and share option charges 22
23 IFRS 16 LEASE ACCOUNTING: FY19 OUTLINE IMPACT (NON-CASH) Right of use assets Balance sheet 62.0m Lease liabilities Net balance sheet impact ( 62.5m) ( 0.5m) Income statement Decrease in operating expenses Increase in depreciation charge Interest charge Net reduction in profit before tax 11.0m ( 10.0m) ( 2.5m) ( 1.5m) 23
24 FOXTONS MID MARKET SALES POSITION MIRRORS LONDON London Volumes (%) Foxtons Volumes (%) London and Foxtons sales distribution by price (2018) 38% 34% 33% 32% 14% 13% 4% 2% 6% 6% 3% 3% 2% 2% 1% 1% 1% 1% 1% 1% 3% 2% Source: Land Registry, Foxtons research 24
25 BEST IN THE SECTOR TECHNOLOGY PLATFORM Foxtons unique technology underpins every aspect of the business and provides a significant competitive advantage Leading database and CRM system Internally integrated and externally connected Delivering outcomes to drive growth Single digital platform BOS Property records Internal Automated workflows Linked to MyFoxtons portal External Embedded with aggregators 1 2 Operational effectiveness Best customer service Vendor, landlord, buyer and tenant contacts Management information Operational intelligence Online search capabilities Social media and digital marketing 3 Digitally-enabled staff and customers The best service to customers: vendors, landlords, buyers and tenants 25
26 WE OPERATE A UNIQUE CENTRALISED ESTATE AGENCY MODEL SINGLE BRAND BRANCH NETWORK FOCUSED SOLELY ON SALES & CUSTOMER SERVICE New business & lead generation team Lettings management team OUR SCALEABLE CENTRE IS A KEY DIFFERENTIATOR Web, Portal & IT development teams Support services Marketing Protography Compliance Training Recruitment Fleet services 26
Foxtons Interim results presentation For the period ended 30 June 2018
 Foxtons Interim results presentation For the period ended 30 June 2018 Important information This presentation includes statements that are, or may be deemed to be, forward-looking statements. These forward-looking
Foxtons Interim results presentation For the period ended June 2017
 Foxtons Interim results presentation For the period ended June 2017 Important information This presentation includes statements that are, or may be deemed to be, forward-looking statements. These forward-looking
Foxtons Interim results presentation For the six months ended 30 June 2016
 Foxtons Interim results presentation For the six months ended 30 June 2016 2 Important information This presentation includes statements that are, or may be deemed to be, forward-looking statements. These
27 July 2018 Interim Results
 27 July 2018 Interim Results for the half year ended 30 June 2018 Disclaimer This presentation may contain forward-looking statements, including forward-looking statements within the meaning of the United
Foxtons Group plc FINAL RESULTS FOR THE FULL YEAR ENDED 31 DECEMBER FEBRUARY 2019
 Foxtons Group plc FINAL RESULTS FOR THE FULL YEAR ENDED 31 DECEMBER 2018 28 FEBRUARY 2019 Foxtons Group plc, London s leading estate agent, today announces its financial results for the year ended 31 December
Preliminary Results. 22nd February 2018
 Preliminary Results 22nd February 2018 Mark Lewis Chief Executive Officer Matthew Price Chief Financial Officer Full year themes Diversified business delivering stable returns Doing a great job for our
Commenting on today s statement, Nic Budden, Chief Executive Officer said:
 Foxtons Group plc INTERIM RESULTS FOR THE HALF YEAR ENDED 30 JUNE 2017 27 JULY 2017 Foxtons Group plc, London s leading estate agent, today announces its financial results for the half year ended 30 June
H1 16 interim results. 22 September 2015
 H1 16 interim results 22 September 2015 Important notice 2 This presentation may include certain forward-looking statements, beliefs or opinions, including statements with respect to the Company s business,
Interim Results. 19 July 2018
 Interim Results 19 July 2018 Mark Lewis Chief Executive Officer Trading in line with expectations, good progress on strategy Trading in line with expectations Helped households save 1.1bn Continued strong
2016 Full Year Results. 3 March 2017
 2016 Full Year Results 3 March 2017 1 NON-STANDARD FINANCE 2016 FULL YEAR RESULTS John van Kuffeler Founder and Group Chief Executive 2 NON-STANDARD FINANCE 2016 FULL YEAR RESULTS Overview In 2016 we achieved
FY16 YEAR END RESULTS 5 APRIL 2016
 FY16 YEAR END RESULTS 5 APRIL 2016 DEFINITIONS AND IMPORTANT NOTICE The following definitions apply throughout Trading EBITDA (earnings before interest, tax, depreciation and amortisation): excludes exceptional
FY12 Results 22 May 2012
 FY12 Results 22 May 2012 DISCLAIMER --- Important Notice This presentation has been prepared by Thorn Group Limited (Thorn). This presentation is not a financial product or investment advice or recommendation,
FY2015 Annual Results August Brett McKeon - CEO David Bailey - CFO
 FY2015 Annual Results August 27 2015 Brett McKeon - CEO David Bailey - CFO FY2015 Financial Results Highlights Delivery on FY15 Prospectus forecasts Pro forma NPAT $19.3 million up 8.4% against IPO forecast
Financial results & business update. Quarter and year ended 31 December February 2016
 Financial results & business update Quarter and year ended 31 December 2015 11 February 2016 Disclaimer 3 Any remarks that we may make about future expectations, plans and prospects for the company constitute
1H 19 Investor Presentation February 2019
 1H 19 Investor Presentation February 2019 1 About Raiz Raiz (formerly Acorns) is a mobile first micro-investing platform via mobile phone or web app, which allows customers to invest in a portfolio of
Annual Report and Accounts. Foxtons Group plc
 2016 Annual Report and Accounts Foxtons Group plc CONTENTS STRATEGIC REPORT 01 Financial summary 02 Chairman s statement 03 Chief Executive s review 05 Overview 06 Market overview 08 Strategy 10 Business
Financial Year 1H19 Results
 Financial Year 1H19 Results Investor presentation 20 November 2018 1 Agenda 1. 1H19 Summary 2. 1H19 Financial results 3. FY19 Outlook 4. Q&A 5. Appendix 2 1H19 Summary Skander Malcolm Chief Executive Officer
FY18 Results Presentation 31 July Thomas Beregi, CEO Michael Eadie, CFO
 FY18 Results Presentation 31 July 2018 Thomas Beregi, CEO Michael Eadie, CFO Leadership in the credit impaired consumer segment ANALYTICS & DISCIPLINE OPERATIONAL EXCELLENCE SUSTAINABILITY & COMPLIANCE
Aldermore Banking as it should be UK Challenger Bank Day
 Aldermore Banking as it should be UK Challenger Bank Day 09 June 2015 Banking as it should be SME focused bank Customer loans 1 22% Asset Finance Track record of accelerating profitability Invoice Finance
Financial results & business update. Quarter ended 30 September October 2016
 Financial results & business update Quarter ended 30 September 2016 19 October 2016 Disclaimer 3 Any remarks that we may make about future expectations, plans and prospects for the company constitute forward-looking
Aldermore Group PLC. Investor presentation. Full Year Results 2015
 Aldermore Group PLC Investor presentation Full Year Results 2015 A year on from IPO. 1 Delivered another excellent set of financial results 2 Generating attractive and sustainable returns 3 Strong balance
ANNOUNCEMENT OF PRELIMINARY RESULTS
 The leading high service distributor to engineers worldwide ANNOUNCEMENT OF PRELIMINARY RESULTS YEAR ENDED 31 MARCH 2009 29 May 2009 Agenda Overview and current trading Ian Mason Financial performance
31 March 2018 Audited Preliminary Results. 6 June 2018
 31 March 2018 Audited Preliminary Results 6 June 2018 1 Presentation Team Euan Fraser Chief Executive Officer Stuart McNulty UK Chief Executive Officer John Paton Chief Financial Officer Has led Alpha
Vita Group (VTG)! Results Presentation!
! Results Presentation!") Vita Group (VTG) Results Presentation First half FY14 Group highlights Sustained trend of strong profit, dividend growth Underlying EBITDA 1 +18%, underlying NPAT 2 +56%, dividend +66% Areas of strategic
Vita Group (VTG) Results Presentation First half FY14 Group highlights Sustained trend of strong profit, dividend growth Underlying EBITDA 1 +18%, underlying NPAT 2 +56%, dividend +66% Areas of strategic
2015 Half Year Results Presentation 25 November 2014
 05 Half Year Results Presentation 5 November 04 Disclaimer This presentation includes statements that are, or may be deemed to be, forward-looking statements. These forward-looking statements can be identified
Results presentation. Highlights. For the year-ended 31 March A distinctive specialist banking group
 Results presentation For the year-ended 31 March 26 A distinctive specialist banking group Highlights Constant pursuit of a sustainable, distinctive growth strategy Strong results 25 Investec plc relative
M Winkworth Plc. Interim Results for the six months ended 30 June 2016
 M Winkworth Plc Interim Results for the six months ended 30 June 2016 M Winkworth Plc ( Winkworth or the Company ), the leading franchisor of real estate agencies, is pleased to announce its Interim Results
Hero Acquisitions Ltd
 Hero Acquisitions Ltd (subsidiary of HSS Hire Group plc) FY17 Results APRIL 5 th 2018 Important notice By reading or reviewing this presentation, you agree to be bound by the following limitations: This
CABOT CREDIT MANAGEMENT Financial Results. For the nine months ended 30 September 2018
 CABOT CREDIT MANAGEMENT Financial Results For the nine months ended 30 September 2018 8 November 2018 DISCLAIMER This presentation has been prepared by Cabot Credit Management ( the Company ) solely for
Analyst & Investor Presentation
 Analyst & Investor Presentation Final results for the 12 months ended 28 February 2018 9 May 2018 Strong balance sheet to drive growth and take advantage of tougher trading environment Overview Adjusted
Half Year Results. for the six months ended 30 November January Chairman Chris Stone CEO Adam Palser CFO Brian Tenner
 Half Year Results for the six months ended 30 November 2017 16 January 2018 Chairman Chris Stone CEO Adam Palser CFO Brian Tenner Agenda Overview and strategy update Financial highlights Financial performance
Preliminary Results. 19 May 2015
 Preliminary Results 19 May 2015 Group returns to profit growth plus strong customer growth Adjusted profit before tax 1 ( m) Profit growth combined with significant extra investment in USA Group delivers
Investor Presentation. February 2015
 Investor Presentation February 2015 Safe Harbor Statement Cautionary Statement Regarding Risks and Uncertainties That May Affect Future Results This presentation may contain forward-looking statements
Paragon Banking Group PLC. Financial Results for twelve months ended 30 September 2018
 Paragon Banking Group PLC Financial Results for twelve months ended 3 September 218 218 results highlights 2 Strong financial performance and further strategic progress Strong operational performance New
2017/18 Half Year Results De La Rue plc 21 November 2017
 2017/18 Half Year Results De La Rue plc 21 November 2017 Page 1 Agenda Overview Martin Sutherland Financial performance Jitesh Sodha Strategic update Martin Sutherland Operational review Martin Sutherland
2017 Results. 27 February 2018
 2017 Results 27 February 2018 FY17 Financial Performance 37.8p EPS 1 +29% 192.1m Stat profit 2 +37% RoTE of 14% up from 12.4% in FY16 13.8% CET1 Ratio 6.0p Total dividend +18% 297p TNAV +9% Note: (1) Basic
The Property Franchise Group. Half Year Results September 2016
 The Property Franchise Group Half Year Results September 2016 Agenda 2 Overview Ian Wilson, Chief Executive Officer Financial performance David Raggett, Chief Financial Officer Operational performance
Half year results 31 December Jon Macdonald Caroline Rawlinson
 Half year results 31 December 2016 Jon Macdonald Caroline Rawlinson CEO CFO Overview H1 YoY Revenue $115m +9% Expenses $40m +5% EBITDA 1 $74m +12% EBIT 1 $64m +12% Operating NPAT 1 $45m +16% Dividend 8.5cps
Bank of Queensland Full year results 31 August Bank of Queensland Limited ABN AFSL No
 Bank of Queensland Full year results 31 August 2013 Bank of Queensland Limited ABN 32 009 656 740. AFSL No 244616. Agenda Result overview Stuart Grimshaw Managing Director and CEO Financial detail Anthony
For personal use only
 Full Year 2017 Results Presentation February 2018 A leading player in the global online classifieds industry FY2017 was another year of strong profitable growth for Mitula Revenue +20% A$33.6m Visits 807m
Investor Presentation
 Investor Presentation (NASDAQ: TRIP) Q2 2013 Safe Harbor Statement Forward-Looking Statements. Our presentation today, including the slides contained herein, contains "forward-looking statements" within
Preliminary Results. 1 March 2016
 Preliminary Results 1 March 2016 1 Matthew Price 1 March 2016 2 Our diversified business traded well and we continued to invest in technology Adjusted 282m 14% Operating EPS (adjusted) Profit 15% 14.5p
Siemens Gamesa Renewable Energy Q Results
 Siemens Gamesa Renewable Energy Q2 208 Results 04 May 208 Disclaimer This material has been prepared by Siemens Gamesa Renewable Energy, and is disclosed solely for information purposes. This document
Q Results presentation
 Q1 2016 Results presentation 12 May 2016 1 Disclaimer This presentation (the "Presentation") has been prepared and is issued by, and is the sole responsibility of Telepizza Group, S.A. ( Telepizza" or
End of Year Results Presentation. 29th June 2017
 End of Year Results Presentation 29th June 2017 Today s agenda Purplebricks realising the opportunity 1. Business Highlights - Michael Bruce 2. Financial Highlights - James Davies 3. Strategic Overview
Investor Presentation. November 2015
 Investor Presentation November 2015 Safe Harbor Statement Cautionary Statement Regarding Risks and Uncertainties That May Affect Future Results This presentation contains forward-looking statements within
Financial Results - Year Ended 31 March 2018 Investor Presentation
 Financial Results - Year Ended 31 March 2018 Investor Presentation Agenda Overview of FY18 Page 4 FY18 Financial Results: Segment Results Centre Metrics Impairments Balance sheet and funding Driving Performance
Mitie Group plc. The UK s leading Facilities Management business. Analyst Presentation H1 18/19 22 November 2018
 Mitie Group plc The UK s leading Facilities Management business Analyst Presentation H1 18/19 22 November 2018 Disclaimer This presentation may contain certain forward-looking statements, beliefs or opinions,
2017 Quarter 1 Financial Results. For the quarter ended 29 March 2017
 2017 Quarter 1 Financial Results For the quarter ended 29 March 2017 Release: 25 May 2017 Disclaimer You must read the following before continuing This presentation has been prepared by Thame and London
YEAR END RESULTS 31 MARCH Russell Down, Chief Executive Chris Morgan, Group Finance Director
 YEAR END RESULTS 31 MARCH 2018 Russell Down, Chief Executive Chris Morgan, Group Finance Director Customer service strategy improving performance Revenue (excluding disposals) 371.6m 6.4% FY17: 349.1m
For personal use only
 FY16 FULL YEAR RESULTS REVIEW Agenda GROUP RESULTS OVERVIEW BUSINESS UNIT REVIEW OUTLOOK Eastlands Shopping Centre BSA completed the mechanical services upgrade and extension to one 29/08/2016 BSA Limited
For personal use only
 Affinity Education Group Full Year 2014 Results 27 February 2015 2014 Highlights FY 2014 Earnings Growth Underlying EBITDA of $17.9m (1) and underlying NPAT of $11.4m (1) Underlying EPS of 8.1 cents (1)
Interim Results: 31 March
 Interim Results: 31 March 2018 www.eigroupplc.com Introduction Robert Walker Chairman Overview Simon Townsend Chief Executive Officer Highlights Trading performance Pubs Average annualised net income per
Preliminary Results. 4 March Saving UK Households 1bn
 Preliminary Results 4 March 2014 Saving UK Households 1bn Results Summary Gerald Corbett Chairman Chairman s Summary Another good year Revenue +10% to 225.6m Adjusted EBITDA +26% to 84.0m Excellent first
Westpac Banking Corporation
 Westpac Banking Corporation David Morgan Chief Executive Officer March 2007 Westpac Banking Corporation at a glance Australia s first bank est. 1817 Top 50 bank globally 1 Consistent earnings growth Strong
Full Year Results Presentation For the year ended 31 March May 2017
 Full Year Results Presentation For the year ended 31 March 2017 30 May 2017 Important information EROAD Limited ( EROAD ) registered a prospectus in July 2014 ( Prospectus ) in relation to an initial public
The following table sets forth, for the periods indicated, the Company s results of operations:
 Schneider National, Inc. Reports Fourth Quarter 2017 Results Broad portfolio of services delivers revenue growth and earnings Operating Revenues of $1.2 billion, an increase of 11% compared to fourth quarter
Interim Results. 3 August 2016
 Interim Results 3 August 2016 1 Matthew Price 3 August 2016 2 Interim themes Headroom: Headroom exists across all of our markets Very low price comparison penetration within money and energy Delivering
Full year results presentation Year ended 31 March June 2018
 Full year results presentation Year ended 31 March 2018 7 June 2018 Disclaimer Not for publication, transmission, distribution or release, directly or indirectly, in or into any jurisdiction in which the
INTERIM RESULTS. Interim Results.
 INTERIM RESULTS. RESULTS. 2017 Interim Results. Results. 2017 1 Agenda Chairman s introduction Financial review Operational update Plumbing & Heating transformation Robert Walker Alan Williams John Carter
Macquarie Connections Conference 6 May Simon Swanson Managing Director
 Macquarie Connections Conference 6 May 2016 Simon Swanson Managing Director ClearView Strategic Rationale 2 Growing and Profitable Business ClearView is a growing and profitable integrated life insurance
Hürriyet Investor Presentation. July 2007
 Hürriyet Investor Presentation July 2007 1 Notice This presentation does not constitute an offer or invitation to purchase or subscription for any securities and no part of it shall form the basis of or
Investor Presentation
 Investor Presentation (NASDAQ: TRIP) Q4 2012 Safe Harbor Statement Forward-Looking Statements. Our presentation today, including the slides contained herein, contains "forward-looking statements" within
Dreamscape Networks Limited (ASX: DN8) First Half FY18 Results Presentation 22 February 2018
 First Half FY18 Results Presentation 22 February 2018") Dreamscape Networks Limited (ASX: DN8) First Half FY18 Results Presentation 22 February 2018 1 H1 FY18 overview: a busy 6 months Revenue up 30% to $29.3m Bookings up 17% to $29.9m Adjusted EBITDA down
Dreamscape Networks Limited (ASX: DN8) First Half FY18 Results Presentation 22 February 2018 1 H1 FY18 overview: a busy 6 months Revenue up 30% to $29.3m Bookings up 17% to $29.9m Adjusted EBITDA down
INDEPENDENT NEWS & MEDIA PLC 2011 PRELIMINARY RESULTS
 INDEPENDENT NEWS & MEDIA PLC 2011 PRELIMINARY RESULTS 2012 INM PLC www.inmplc.com Page 1 PRELIMINARY RESULTS FOR 2011 OVERVIEW EBIT of 75.5m in line with market guidance Results reflect continuing economic
Forward-looking Statements
 2016 Annual Results Forward-looking Statements This presentation and subsequent discussion may contain certain forward-looking statements with respect to the financial condition, results of operations
Financial Results Presentation. For the 39 weeks ended 26 September 2018
 Financial Results Presentation For the 39 weeks ended 26 September 2018 Release: 20 November 2018 Disclaimer You must read the following before continuing This presentation has been prepared by Thame and
Flow Traders N.V. 1Q 2016 AMSTERDA M - NEW YORK - SINGAP O R E - CLUJ
 Flow Traders N.V. 1Q 2016 AMSTERDA M - NEW YORK - SINGAP O R E - CLUJ Disclaimer This presentation is prepared by Flow Traders N.V. and is for information purposes only. It is not a recommendation to engage
Westpac 2008 Full year results
 Westpac 2008 Full year results 30 October 2008 Westpac 2008 Full year results Gail Kelly Chief Executive Officer Key messages Performed well in a challenging environment, delivering a robust financial
Financial Results Presentation. For the period ended 28 June 2017
 Financial Results Presentation For the period ended 28 June 2017 Release: 22 August 2017 Disclaimer You must read the following before continuing This presentation has been prepared by Thame and London
2017 Interim Results. 14 September 2017
 2017 Interim Results 14 September 2017 1 Disclaimer NOT FOR PUBLICATION OR DISTRIBUTION IN WHOLE OR IN PART IN, INTO OR FROM ANY JURISDICTION WHERE TO DO SO WOULD CONSTITUTE A VIOLATION OF THE RELEVANT
Financial Year 2016 Results. 17 May 2016
 Financial Year 2016 Results 17 May 2016 Agenda CEO update Financial update Outlook Strategy Update Q&A CEO Update Richard Kimber Chief Executive Officer Delivering on the Accelerate Strategy A 3 year ACCELERATE
Interim Results 2018/19
 Interim Results 2018/19 Martin Morgan, Executive Chairman Richard Amos, Chief Financial Officer London, 21 February 2019 Safe Harbour Statement This presentation and the subsequent question and answer
Savills plc. Preliminary results for the year ended. 31 December 2010
 Savills plc Preliminary results for the year ended 31 December 2010 1 Disclaimer Forward-looking statements These slides contain certain forward-looking statements including the Group s financial condition,
FINANCIAL RESULTS FOR THE QUARTER TO 30 JUNE 2018
 FINANCIAL RESULTS FOR THE QUARTER TO 30 JUNE 2018 Disclaimer This presentation has been prepared by Amigo Holdings PLC ( the Company ) and includes the results of Amigo Loans Group Ltd ( ALGL ) solely
Looking to the medium term
 Looking to the medium term Issued: 4 September 2013 Legal notice This presentation has been prepared to inform investors and prospective investors in the secondary markets about the Group and does not
Agenda. Results Presentation 27 February Appendices 1 to
 Results Presentation 27 February 2018 51 Agenda Results Presentation 27 February 2018 Page Presented by Overview 1 Jeff Fairburn Review of operations 3 Jeff Fairburn Outlook 13 Jeff Fairburn Financial
AO World Plc. Interim Results to 30 September November AO World Plc
 Interim Results to 30 September 2016 22 November 2016 Agenda Overview & Economic landscape Operations Financials Summary Q&A John Roberts Steve Caunce Mark Higgins John Roberts 2 Introduction John Roberts
Moneysupermarket.com Group PLC 2009 Interim Results Presentation. 4 August 2009
 Moneysupermarket.com Group PLC 2009 Interim Results Presentation 4 August 2009 1 Agenda Introduction: Gerald Corbett Financial Review: Paul Doughty Business Review and Marketing: Peter Plumb/David Osborne
Commenting on the performance, Bill Winters, Group Chief Executive, said:
 31 October 2018 Standard Chartered PLC - Interim Management Statement Standard Chartered PLC (the Group) today releases its Interim Management Statement for the period 30 September 2018. All figures are
Results for the first quarter to 31 March 2013
 Results for the first quarter to 31 March 2013 Key messages Progress towards delivering financial targets 32.9% improvement in operating profit 1 98.0% combined operating ratio 1 RoTE of 12.3% 2 Competitive
Investor Presentation JUNE 2018
 Investor Presentation JUNE 2018 Forward Looking Statements & Other Disclosure Matters Forward-Looking Statements - This presentation contains forward-looking statements within the meaning of the federal
rhipe Limited (ASX code RHP) FY16 Full Year Results Presentation & FY 2017 Outlook
 FY16 Full Year Results Presentation & FY 2017 Outlook") rhipe Limited (ASX code RHP) FY16 Full Year Results Presentation & FY 2017 Outlook Dominic O Hanlon, CEO & Managing Director Mike Hill, Executive Chairman 1 This presentation has been prepared by rhipe
rhipe Limited (ASX code RHP) FY16 Full Year Results Presentation & FY 2017 Outlook Dominic O Hanlon, CEO & Managing Director Mike Hill, Executive Chairman 1 This presentation has been prepared by rhipe
Direct Line Insurance Group plc Trading Update for the first quarter of May 2017
 Direct Line Insurance Group plc Trading Update for the first quarter of 3 May Direct Line Group s Trading Update relates to the first quarter ended 31 March, and contains information to the date of publication.
Lloyds TSB Group plc. Results for half-year to 30 June 2007
 Lloyds TSB Group plc Results for half-year to 2007 CONTENTS Page Key operating highlights 1 Summary of results 2 Profit analysis by division 3 Group Chief Executive s statement 4 Group Finance Director
Full Year Results. 4 October 2018
 Full Year Results 4 October 2018 Highlights Ian Filby Good strategic progress in a challenging market KEY FINANCIALS 1,125.6m +13.6% 76.1m -7.6% 38.3m -23.7% Gross sales Underlying EBITDA Underlying PBT
Building a better AA Putting Service, Innovation and Data at the heart of the AA
 LEI: 213800DTPE4O5OI17349 This announcement contains inside information Building a better AA Putting Service, Innovation and Data at the heart of the AA The AA is today presenting our new business strategy
Ontex H1 2018: Solid progress against 2018 priorities
 Ontex H1 2018: Solid progress against 2018 priorities Growing share in core markets with our robust portfolio: LFL ex Brazil +2.2% Actions to drive margin improvement coming through: price/mix +1% Execution
Cameron Judson, CEO Glynn Wright, CFO. McGrath Limited (ASX: MEA) Results for the 6 months ended 31 December February 2018
 Results for the 6 months ended 31 December February 2018") Cameron Judson, CEO Glynn Wright, CFO McGrath Limited (ASX: MEA) Results for the 6 months ended 31 December 2017 15 February 2018 1H18 A SNAPSHOT REVENUE DOWN 23% TO $51.6M GOODWILL IMPAIRMENT ($21.8)
Cameron Judson, CEO Glynn Wright, CFO McGrath Limited (ASX: MEA) Results for the 6 months ended 31 December 2017 15 February 2018 1H18 A SNAPSHOT REVENUE DOWN 23% TO $51.6M GOODWILL IMPAIRMENT ($21.8)
OneVue Holdings Limited (OVH)
") OneVue Holdings Limited (OVH) FY 2017 results presentation 28 August 2017 Regulators, fund managers and investors are calling for greater transparency of platform costs and revenue drivers Platform differentiation
OneVue Holdings Limited (OVH) FY 2017 results presentation 28 August 2017 Regulators, fund managers and investors are calling for greater transparency of platform costs and revenue drivers Platform differentiation
For personal use only
 FY16 RESULTS BRIEFING H U G H M A R K S C H I E F E X E C U T I V E O F F I C E R G R E G B A R N E S C H I E F F I N A N C I A L O F F I C E R M I C H A E L S T E P H E N S O N C H I E F S A L E S O F
1H18 Results Presentation Sid Takla Interim Chief Executive Officer Lyndal York Chief Financial Officer
 1H18 Results Presentation Sid Takla Interim Chief Executive Officer Lyndal York Chief Financial Officer 21 August 2018 Important Notice and Disclaimer This presentation has been prepared by Asaleo Care
Interim Results Interim Results. for the half-year ended 30 June Allied Irish Banks, p.l.c.
 Interim Results 2006 Interim Results for the half-year ended 30 June 2006 Allied Irish Banks, p.l.c. 1 Forward looking statements A number of statements we will be making in our presentation and in the
Responsible investment in growth
 Responsible investment in growth Issued: 1 March 2016 Legal notice This presentation has been prepared to inform investors and prospective investors in the secondary markets about the Group and does not
Full year and Q results March 15, 2017
 Full year and Q4 2016 results March 15, 2017 Disclaimer This document and its related communication ( Presentation ) have been issued by windeln.de SE and its subsidiaries ( Company ) and do not constitute
Northgate plc. Return to growth. Preliminary results Year ended 30 April June Northgate plc
 Northgate plc Return to growth Preliminary results for the year ended 30 April 2014 Northgate plc Preliminary results Year ended 30 April 2013 June 2013 Agenda Group summary Financial review Depreciation
Interim Results for the period ending 30 th September 2015
 Interim Results for the period ending 30 th September 2015 10 th Nov 2015 Russell Down, Chief Executive Overview Challenging and disappointing start to the year Review identified: Poor execution of business
Year-end results. 18 May
 Year-end results 18 May Highlights for the year Strong operational performance Good performance across all areas of activity Deepened our core franchise Sound levels of corporate client and private client
FY18 $109.6m up $113.3m on FY17 GROUP UNDERLYING Delivered despite $45.0m fuel (net of FX) headwind
 headwind") FY18 GROUP OUTCOMES FY18 $109.6m up $113.3m on FY17 GROUP UNDERLYING PROFIT BEFORE TAX (PBT) 1 Highest underlying result since FY08 Delivered despite $45.0m fuel (net of FX) headwind X VA DOMESTIC RECORD
FY18 GROUP OUTCOMES FY18 $109.6m up $113.3m on FY17 GROUP UNDERLYING PROFIT BEFORE TAX (PBT) 1 Highest underlying result since FY08 Delivered despite $45.0m fuel (net of FX) headwind X VA DOMESTIC RECORD
Investor pre-close briefing. 14 March
 Investor pre-close briefing 14 March Proviso Please note that matters discussed in today s presentation may contain forward looking statements which are subject to various risks and uncertainties and other