Summary of Information from Recapitulation Report Submittals (DR-489 series, DR-493, Central Assessment, Agricultural Schedule):
|
|
|
- Maria Hodges
- 5 years ago
- Views:
Transcription
1 County: Martin Study Type: In-Depth The department approved your preliminary assessment roll for Roll approval statistical summary reports and graphics for 2014 are attached for additional feedback. As an in-depth review county, individual strata as well as the entire roll must be in substantial compliance with the law. The attached LOA Summary Statistics Report includes the overall level of assessment for your county and the levels of assessment for individual strata. Summary of Information from Post Audit Review (PAR): No significant issues were identified. Summary of Information from Recapitulation Report Submittals (DR-489 series, DR-493, Central Assessment, Agricultural Schedule): If your county is working on a CAMA conversion project, please contact our Research & Analysis staff if you have questions about recapitulation (DR-489/403) field definitions or data mapping. Time Trend Factors for 2014 are included in this report. The monthly factors for Improved Residential (Stratum 1) and Vacant Residential Property (Stratum 4) are included if the strata are studied in the county. If you have any questions about the factors please contact Andrew Collins, Resource Management Process Manager (collinan@dor.state.fl.us). Attachments: LOA Summary Statistics Official Ratio Summary Report Statistical Analysis Glossary, Definitions and Interpreting Statistical Analysis Output Statistical Analysis Output Time Trend Factors
2 In-Depth Date of Review: 7/16/2014 3:28 PM Martin In-Depth Study Results Previous Year Blended In-Depth Review Results Stratum PA Growth Ratio Alt Ratio COD PRD Study Type Stratum LOA* nid Alt Ratio 1 5.8% Time Trended Sales % Untrended Sales Overall 5.6% Overall /22/201411:05 AM
3 REPORT: FF09 DEPARTMENT OF REVENUE LOAD DATE: 7/1/2014 COUNTY: Martin Property Tax Oversight Preliminary Level of Assessment - Official Blended Ratio Study Value Group Analysis Excluding Untested Group Totals STR GRP LOW HIGH #SAMP COV P.A SAMP VAL DOR SAMP VAL RATIO TOT PAR P.A JUST VAL RATIO DOR JUST VAL 1 12m 1 70, , ,676,550 61,509, ,264 1,148,574, ,203,956, m 2 119, , ,345, ,022, ,262 1,879,263, ,976,091, m 3 187, , ,684, ,864, ,262 2,822,657, ,977,487, m 4 282,560 45,505, ,730, ,297, ,258 8,580,795, ,226,661, ,460 70,410 17, ,038,380untested Stratum Total: 2, ,436, ,694,102 49,046 14,431,290,800 15,384,196,926 COD: 8.7 PRD: % Conf Intvl Stratum Ratio: 93.8 STR GRP LOW HIGH #SAMP COV P.A SAMP VAL DOR SAMP VAL RATIO TOT PAR P.A JUST VAL RATIO DOR JUST VAL 6 May 1 180, , ,265,960 2,312, ,636, ,710,836 6 May 2 302, , ,673,080 2,844, ,697, ,593,234 6 May 3 509,860 1,112, ,905,340 5,671, ,286, ,671,604 6 May 4 1,112,550 61,953, ,967,780 39,998, ,493,010, ,573,246, , ,540 1, ,590,640untested Stratum Total: ,812,160 50,827,790 1,728 2,085,630,858 2,166,221,678 COD: 7.7 PRD: % Conf Intvl Stratum Ratio: /19/2014 Page 1
4 REPORT: FF09 DEPARTMENT OF REVENUE LOAD DATE: 7/1/2014 COUNTY: Martin Property Tax Oversight Preliminary Level of Assessment - Official Blended Ratio Study Value Group Analysis Including Untested Group Totals STR GRP LOW HIGH #SAMP COV P.A SAMP VAL DOR SAMP VAL RATIO TOT PAR P.A JUST VAL RATIO DOR JUST VAL 1 12m 1 70, , ,676,550 61,509, ,264 1,148,574, ,203,956, m 2 119, , ,345, ,022, ,262 1,879,263, ,976,091, m 3 187, , ,684, ,864, ,262 2,822,657, ,977,487, m 4 282,560 45,505, ,730, ,297, ,258 8,580,795, ,226,661, ,460 70,410 17, ,038, ,407,654 Stratum Total: 2, ,436, ,694,102 66,162 15,193,329,180 16,196,604,580 COD: 8.7 PRD: % Conf Intvl Stratum Ratio: 93.8 STR GRP LOW HIGH #SAMP COV P.A SAMP VAL DOR SAMP VAL RATIO TOT PAR P.A JUST VAL RATIO DOR JUST VAL 6 May 1 180, , ,265,960 2,312, ,636, ,710,836 6 May 2 302, , ,673,080 2,844, ,697, ,593,234 6 May 3 509,860 1,112, ,905,340 5,671, ,286, ,671,604 6 May 4 1,112,550 61,953, ,967,780 39,998, ,493,010, ,573,246, , ,540 1, ,590, ,801,287 Stratum Total: ,812,160 50,827,790 2,831 2,195,221,498 2,280,022,965 COD: 7.7 PRD: % Conf Intvl Stratum Ratio: /19/2014 Page 2
5 REPORT: FF09 DEPARTMENT OF REVENUE LOAD DATE: 7/1/2014 COUNTY: Martin Property Tax Oversight Preliminary Level of Assessment - Official Blended Ratio Study County Overall Level of Assessment and Group Level Statistics Stratum TOT PAR P.A.JUST VAL RATIO DOR JUST VAL 1 66,162 15,193,329, ,196,604, ,831 2,195,221, ,280,022,965 Total 68,993 17,388,550, ,476,627,545 Group Level Statistics Stratum Group N Median Mean COD PRD WgtMean Total Total % Confidence Intervals STRATUM 1 6 Lower Upper Lower Upper MEAN WEIGHTED MEAN MEDIAN /19/2014 Page 3
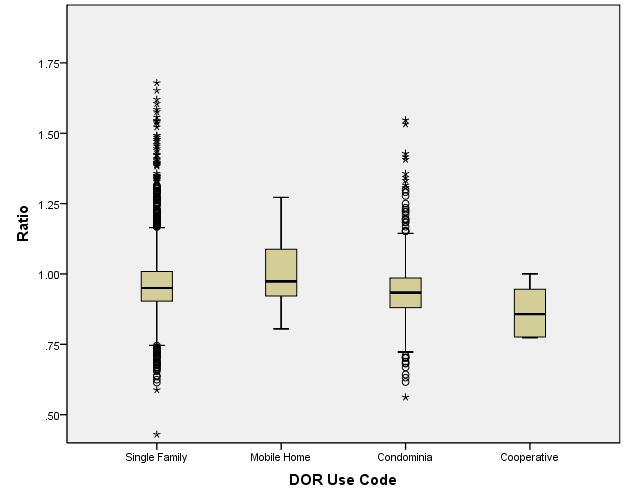
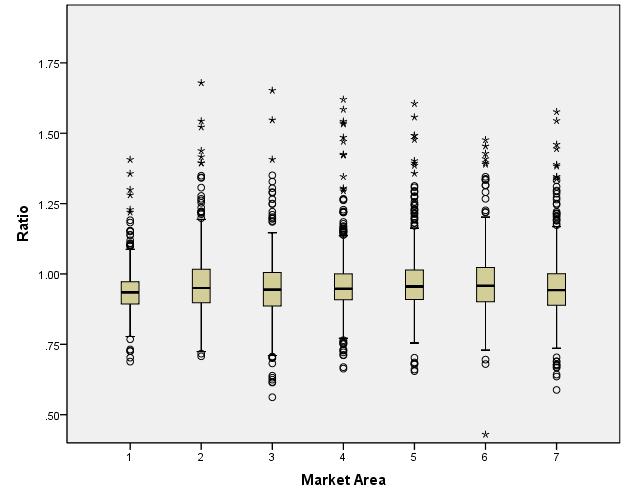
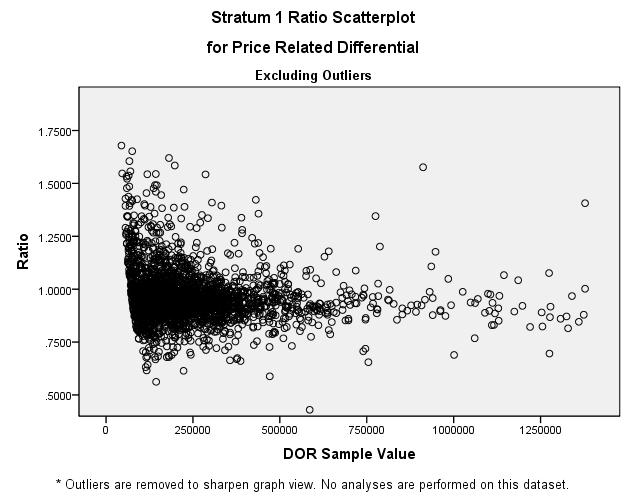
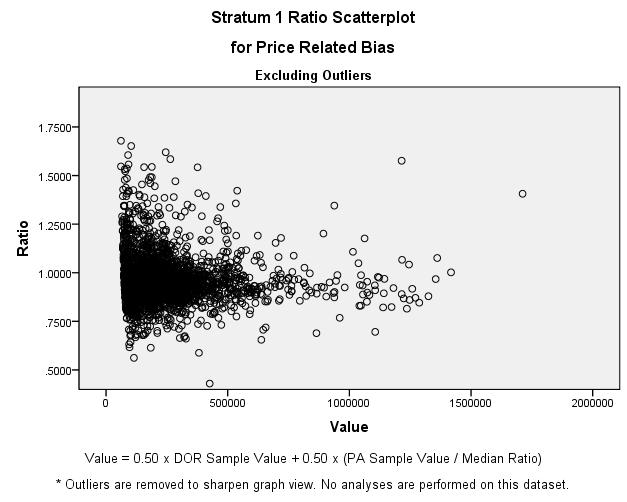
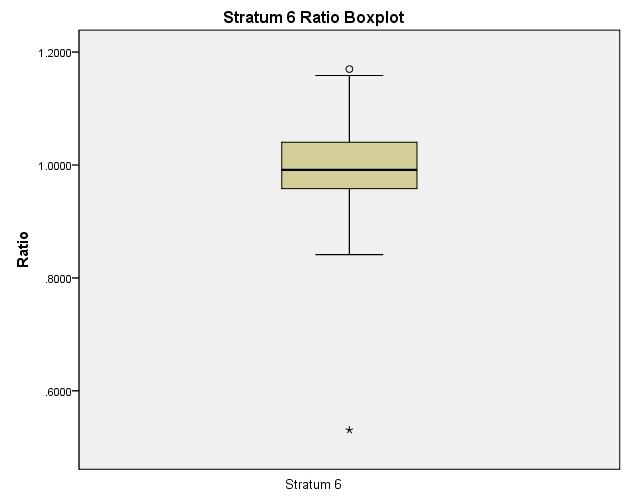
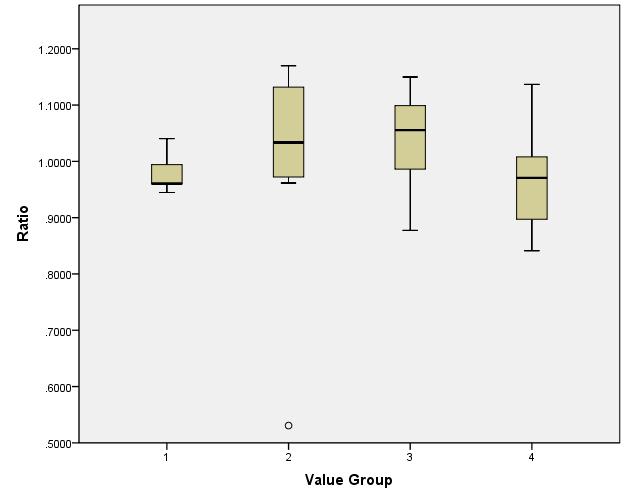
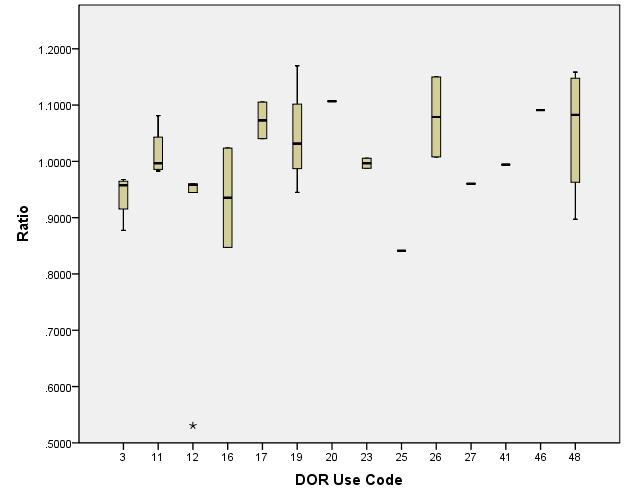
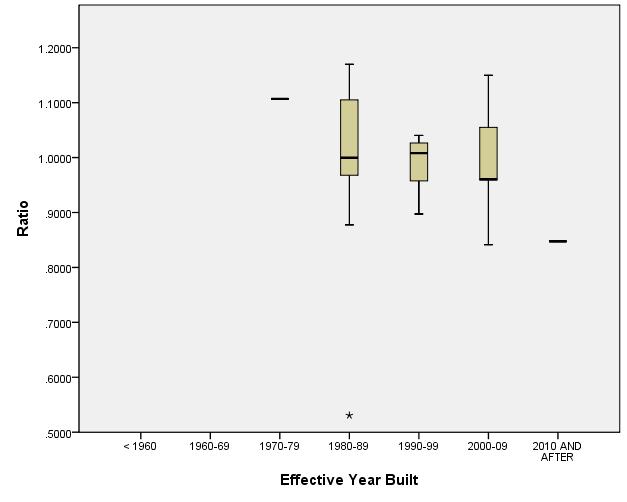
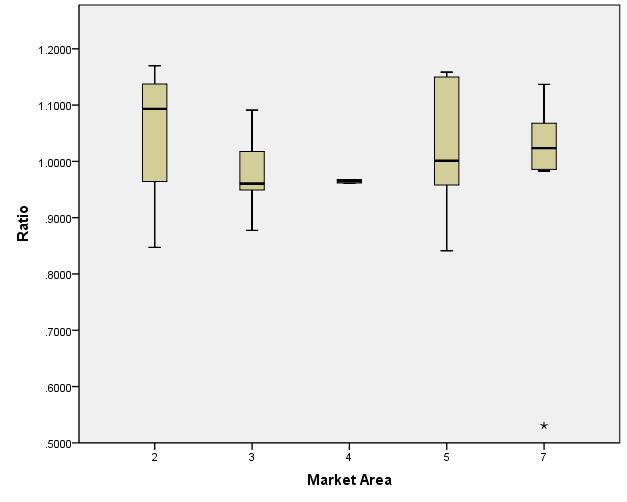
6 Statistical Analysis Glossary and Definitions You can use this glossary of terms for assistance in reviewing the attached statistical analysis of the official blended (sales or appraisal) ratio study data set. This glossary lists the terms in the order in which they appear. 1. Frequencies (Frequency Distribution): This table shows the number and percentage of observations (sample sales or DOR appraisals) falling in each studied stratum and value group. The percent and valid percent columns should be the same when no missing data are missing. 2. Histogram: A bar chart of a continuous variable. The heights of the bars represent the percentage of cases in each interval. The histograms illustrate the distribution of the frequency percentage of the sample ratios in each studied stratum. The distribution includes a normal curve to help evaluate normality of the ratio data. The top right corner of the graph shows the mean, standard deviation, and number of ratios for the overall stratum. 3. Boxplots: Boxplots graphically show the distribution of a continuous and discrete variable. The boxes represent the first to third quartile (interquartile range or middle 50%) of the data. The horizontal lines in the boxes represent the medians. The vertical alignment of the medians and their surrounding boxes indicates horizontal equity. The whiskers above and below the boxes represent the ratios closest to, but not more than 1.5 box lengths from, the ends of the box. Ratios beyond the whiskers are termed outliers (represented by circles) and extremes (represented by asterisks). You should identify and research outlier and extreme ratios. The boxplot for each studied stratum uses the ratio as the continuous variable and the following qualitative (discrete) variables: value groups, DOR use codes, market areas, and effective year built (for improved strata). 4. Scatterplots: Scatterplots show the relationship between two continuous variables. The independent variable is on the horizontal, or x, axis, and the dependent variable is on the vertical, or y, axis. A horizontal pattern indicates assessment uniformity over the range of the independent variable. An upward or downward sloping pattern may indicate a vertical inequity in assessment levels (progressivity or regressivity). The scatterplot for each studied stratum uses the ratio for the dependent variable and the DOR Sample Value (adjusted sale prices or adjusted DOR appraisal values) or a value proxy for the independent variable.
7 Definitions: COD: Continuous variable: Discrete variable: Frequency: Inter-quartile range: Mean: Median: Normal Distribution: Outlier: PRB: PRD: Progressivity: Quartile: Abbreviation for coefficient of dispersion; in ratio studies, the average percent deviation from the median ratio; a measure of appraisal uniformity Data that can take any value in a given range; quantitative data based on size or measurement (e.g., sale price, total living area) A variable with specific, pre-defined categories (e.g., use code, market area, neighborhood code) Number of observations falling within certain various groups, classes, or intervals The result of subtracting the first quartile from the third quartile A measure of central tendency; the result of adding values and dividing by the number of values; also known as average or arithmetic mean; may be influenced or skewed by extreme values A measure of central tendency; the result of finding the middle number when data is arrayed by size and the number of items are odd or taking the mean of the middle two numbers if the number of items are even; not influenced by extreme values A symmetrical, bell-shaped distribution of observations or values. Sixty-eight percent of observations occur within one standard deviation of the mean, 95 percent occur within two standard deviations, and 99.7 percent occur within three standard deviations. Observations that differ significantly from a measure of central tendency and are unusual compared to other observations Abbreviation for price-related bias, a measure of vertical inequity; an index obtained by regressing 1) percentage differences from the median assessment ratio on 2) percentage differences from a proxy of the median value, which is obtained by giving equal weight to assessments and sales prices; coefficients below and above 0.05 with a sufficiently high t-value supporting a 95 percent confidence level are considered regressive and progressive, respectively; the dependent variable is (ratio median ratio) / median ratio; the independent variable is LN (value proxy) / 0.693, where LN means natural log and equals the natural log of 2; calculated in Excel by using the linear regression function = LINEST(known_y's, known_x's, const, stats) Abbreviation for price-related differential; the mean divided by the weighted mean; a measure of vertical inequity; values above 1.03 are considered regressive and below 0.98 are considered progressive Low-value parcels are under-assessed in comparison to high value parcels. The values that divide a data set into four equal parts when data is arrayed in ascending order. The second quartile is equal to the median.
8 Ratio (A/S): Regressivity: Standard Deviation: Stratum: t-value: Value Group: Value Proxy: X-axis: Y-axis: The assessed value divided by the sale price High-value parcels are under-assessed in comparison to low value parcels. A measure of the dispersion of the data from the mean. When expressed as a percentage, it is known as a coefficient of variation (COV). A class or type of property separated from other types of property for the purpose of analyses A measure of the significance of a regression variable in explaining differences in the dependent variable; the ratio of the regression coefficient divided by the standard error Property arrayed and grouped by value, from low to high, for the purpose of analyses Half of the assessed value plus half of the sale price The horizontal axis on a graph; independent variable (e.g., living area, use code, market area) The vertical axis on a graph; dependent variable (e.g., sales ratios)
9 1 How to Read Your Statistical Analysis of Ratio Study Sample In-Depth Report All Studied Strata Ratio Sample Study Active_Stratum N % of Total N Sum % of Total Sum 1. Improved Residential % $213,347, % 2. Multi-family % $157,052, % 6. Improved Commercial % $72,401, % and Industrial Total % $442,801, % Total # of sales used in ratio study (all studied strata) Ratio Sample Study Active_Stratum Minimum Maximum 1. Improved Residential $57,164 $869, Multi-family $103,485 $28,558, Improved Commercial $174,134 $10,233,470 and Industrial Total $57,164 $28,558,752 All properties included in sample (all studied strata) Ratio Statistics Ratio Statistics for PA Sample Value/DOR Sample Value Group Mean Median Weighted Mean Coefficient of Dispersion 1. Improved Residential Multi-family Improved Commercial and Industrial Overall Ratio Sample Study Stratum 1 Begin statistical analysis by studied stratum (frequencies and graphs) Value_Group N % of Total N Sum % of Total Sum Minimum Maximum % $40,869, % $57,164 $121, % $58,862, % $121,308 $176, % $54,171, % $177,220 $262, % $59,444, % $262,892 $869,908 Total % $213,347, % $57,164 $869,908
10 How to Read Your Statistical Analysis of Ratio Study Sample In-Depth Report Frequencies DOR_UC Frequency Percent Valid Percent Cumulative Percent Valid Single Family Mobile Home Total # of Stratum 1 sales used in ratio study by UC, EYB, and Market Area Condominia Total EFFECTIVE YEAR BUILT RANGE Frequency Percent Valid Percent Cumulative Percent Valid < AND AFTER Total Market Area Frequency Percent Valid Percent Cumulative Percent Valid Total
11 How to Read Your Statistical Analysis of Ratio Study Sample In-Depth Report Crosstabs SALE MONTH * SALE_YR1 Crosstabulation Count SALE_YR Total SALE MONTH Total # of sales used in Stratum 1 by sale month and year Total Measures of Central Tendency measures of the average and center of the sample data. Ratio Statistics Ratio Statistics for PA Sample Value/DOR Sample Value 95% Confidence Interval for Mean 95% Confidence Interval for Median Mean Lower Bound Upper Bound Median Lower Bound Upper Bound Actual Coverage % The confidence interval for the median is constructed without any distribution assumptions. The actual coverage level may be greater than the specified level. Other confidence intervals are constructed by assuming a Normal distribution for the ratios. Weighted Mean Ratio Statistics for PA Sample Value/DOR Sample Value 95% Confidence Interval for Weighted Mean Coefficient of Lower Bound Upper Bound Dispersion The confidence interval for the median is constructed without any distribution assumptions. The actual coverage level may be greater than the specified level. Other confidence intervals are constructed by assuming a Normal distribution for the ratios. COD: Avg. % deviation from the median
 Boxplot showing distribution (uniformity) of ratios within a stratum Outliers (Should be researched) Upper Outliers Max.")
12 How to Read Your Statistical Analysis of Ratio Study Sample In-Depth Report Histogram showing Most common ratio distribution (uniformity) of ratios within a stratum Normal (Bellshaped) Uniformity (The tighter the distribution, the better.) Boxplot showing distribution (uniformity) of ratios within a stratum Outliers (Should be researched) Upper Outliers Max. ratio not an outlier Third Quartile Median Ratio First Quartile Min. ratio not an outlier Lower Outliers

13 How to Read Your Statistical Analysis of Ratio Study Sample In-Depth Report Boxplots also show uniformity among groups of properties. Close alignment of the median ratios indicates good uniformity.


14 How to Read Your Statistical Analysis of Ratio Study Sample In-Depth Report
 is a measure of vertical equity (consistency of appraisal levels across the value range) <0.98 = Progressivity >1.03 = Regressivity Price-Related Differential 1.")
15 How to Read Your Statistical Analysis of Ratio Study Sample In-Depth Report PRD Ratio Statistics Ratio Statistics for PA Sample Value/DOR Sample Value Price-Related Differential (PRD) (mean ratio / weighted mean ratio) is a measure of vertical equity (consistency of appraisal levels across the value range) <0.98 = Progressivity >1.03 = Regressivity Price-Related Differential Scatterplots show the correlation between the dependent and independent variables. A horizontal pattern indicates equity over the range of the independent variable. An upward or downward pattern indicates inequities. Dependent Variable Independent Variable Ratio = PA Sample Value/DOR Sample Value DOR Sample Value = Sale Price x Time Adjustment Factor x % adjustment reported by the PA on the DR-493.

16 How to Read Your Statistical Analysis of Ratio Study Sample In-Depth Report PRB Regression Coefficients a Price-Related Bias (PRB)* provides a gauge of vertical equity obtained by regressing percentage differences from the median assessment ratio on percentage differences from the median value. Model Unstandardized Coefficients Standardized Coefficients B Std. Error Beta t Sig. 1 (Constant) Value_Proxy a. Dependent Variable: Ratio_Proxy PRB Note PRB when < (regressive) or > 0.05 (progressive) and Sig. < 0.05 Significance The value (independent variable) is weighted to minimize statistical bias that would overstate the degree of regressivity or progressivity. *For additional information on the PRB, please see IAAO s Fundamentals of Mass Appraisal (2011), Appendix B.
17 Martin Active Strata Ratio Study Sample Active Stratum N % of Total N Sum % of Total Sum 1. Improved Residential % $793,436, % 6. Improved Commercial and Industrial % $48,812, % Total % $842,248, % Ratio Study Sample Active Stratum Minimum Maximum 1. Improved Residential $70,570 $15,551, Improved Commercial and Industrial $204,060 $8,692,550 Total $70,570 $15,551,440 Ratio Statistics Ratio Statistics for Ratio Study Sample / DOR Sample Value Group Mean Median Weighted Mean Coefficient of Dispersion 1. Improved Residential Improved Commercial and Industrial Overall
18 Stratum 1 Ratio Study Sample Value Group N % of Total N Sum % of Total Sum Minimum Maximum % $58,676, % $70,570 $119, % $110,345, % $119,070 $187, % $167,684, % $183,740 $282, % $456,730, % $282,980 $15,551,440 Total % $793,436, % $70,570 $15,551,440 Frequencies DOR_UC Frequency Percent Valid Percent Cumulative Percent Valid Single Family Mobile Home Condominiums Cooperative Total EFFECTIVE YEAR BUILT RANGE Frequency Percent Valid Percent Cumulative Percent Valid < AND AFTER Total Missing System 2.1 Total
19 Market Area Frequency Percent Valid Percent Cumulative Percent Valid Total Missing System 13.5 Total Crosstabs SALE MONTH * SALE_YR1 Crosstabulation Count SALE_YR Total SALE MONTH Total
20 Ratio Statistics Ratio Statistics for Ratio Study Sample / DOR Sample Value 95% Confidence Interval for Mean 95% Confidence Interval for Median Mean Lower Bound Upper Bound Median Lower Bound Upper Bound Actual Coverage % The confidence interval for the median is constructed without any distribution assumptions. The actual coverage level may be greater than the specified level. Other confidence intervals are constructed by assuming a Normal distribution for the ratios. Ratio Statistics for Ratio Study Sample / DOR Sample Value 95% Confidence Interval for Weighted Mean Weighted Mean Lower Bound Upper Bound Coefficient of Dispersion The confidence interval for the median is constructed without any distribution assumptions. The actual coverage level may be greater than the specified level. Other confidence intervals are constructed by assuming a Normal distribution for the ratios.
21
22
23
24 PRD Ratio Statistics Ratio Statistics for Ratio Study Sample / DOR Sample Value Price Related Differential 1.027
25 PRB Regression Model Coefficients a Unstandardized Coefficients Standardized Coefficients B Std. Error Beta t Sig. 1 (Constant) Value_Proxy a. Dependent Variable: Ratio Proxy
26
27 Stratum 6 Ratio Study Sample Value Group N % of Total N Sum % of Total Sum Minimum Maximum % $2,265, % $204,060 $302, % $2,673, % $319,800 $493, % $5,905, % $514,110 $1,034, % $37,967, % $1,140,480 $8,692,550 Total % $48,812, % $204,060 $8,692,550 Frequencies DOR_UC Frequency Percent Valid Percent Cumulative Percent Valid Total
28 EFFECTIVE YEAR BUILT RANGE Frequency Percent Valid Percent Cumulative Percent Valid AND AFTER Total Market Area Frequency Percent Valid Percent Cumulative Percent Valid Total Crosstabs SALE MONTH * SALE_YR1 Crosstabulation Count SALE_YR Total SALE MONTH Total 34 34

29 Ratio Statistics Ratio Statistics for Ratio Study Sample / DOR Sample Value 95% Confidence Interval for Mean 95% Confidence Interval for Median Mean Lower Bound Upper Bound Median Lower Bound Upper Bound Actual Coverage % The confidence interval for the median is constructed without any distribution assumptions. The actual coverage level may be greater than the specified level. Other confidence intervals are constructed by assuming a Normal distribution for the ratios. Ratio Statistics for Ratio Study Sample / DOR Sample Value 95% Confidence Interval for Weighted Mean Weighted Mean Lower Bound Upper Bound Coefficient of Dispersion The confidence interval for the median is constructed without any distribution assumptions. The actual coverage level may be greater than the specified level. Other confidence intervals are constructed by assuming a Normal distribution for the ratios.
30
31
32
33 PRD Ratio Statistics Ratio Statistics for Ratio Study Sample / DOR Sample Value Price Related Differential 1.033
34 PRB Regression Model Coefficients a Unstandardized Coefficients Standardized Coefficients B Std. Error Beta t Sig. 1 (Constant) Value_Proxy a. Dependent Variable: Ratio Proxy

35
36 Time Trend Factors County Stratum Year Month Factor
DATA SUMMARIZATION AND VISUALIZATION
 APPENDIX DATA SUMMARIZATION AND VISUALIZATION PART 1 SUMMARIZATION 1: BUILDING BLOCKS OF DATA ANALYSIS 294 PART 2 PART 3 PART 4 VISUALIZATION: GRAPHS AND TABLES FOR SUMMARIZING AND ORGANIZING DATA 296
Math 2311 Bekki George Office Hours: MW 11am to 12:45pm in 639 PGH Online Thursdays 4-5:30pm And by appointment
 Math 2311 Bekki George bekki@math.uh.edu Office Hours: MW 11am to 12:45pm in 639 PGH Online Thursdays 4-5:30pm And by appointment Class webpage: http://www.math.uh.edu/~bekki/math2311.html Math 2311 Class
2 Exploring Univariate Data
 2 Exploring Univariate Data A good picture is worth more than a thousand words! Having the data collected we examine them to get a feel for they main messages and any surprising features, before attempting
Chapter 3. Numerical Descriptive Measures. Copyright 2016 Pearson Education, Ltd. Chapter 3, Slide 1
 Chapter 3 Numerical Descriptive Measures Copyright 2016 Pearson Education, Ltd. Chapter 3, Slide 1 Objectives In this chapter, you learn to: Describe the properties of central tendency, variation, and
Numerical Descriptions of Data
 Numerical Descriptions of Data Measures of Center Mean x = x i n Excel: = average ( ) Weighted mean x = (x i w i ) w i x = data values x i = i th data value w i = weight of the i th data value Median =
GGraph. Males Only. Premium. Experience. GGraph. Gender. 1 0: R 2 Linear = : R 2 Linear = Page 1
 GGraph 9 Gender : R Linear =.43 : R Linear =.769 8 7 6 5 4 3 5 5 Males Only GGraph Page R Linear =.43 R Loess 9 8 7 6 5 4 5 5 Explore Case Processing Summary Cases Valid Missing Total N Percent N Percent
Stat 101 Exam 1 - Embers Important Formulas and Concepts 1
 1 Chapter 1 1.1 Definitions Stat 101 Exam 1 - Embers Important Formulas and Concepts 1 1. Data Any collection of numbers, characters, images, or other items that provide information about something. 2.
1 Describing Distributions with numbers
 1 Describing Distributions with numbers Only for quantitative variables!! 1.1 Describing the center of a data set The mean of a set of numerical observation is the familiar arithmetic average. To write
Exploring Data and Graphics
 Exploring Data and Graphics Rick White Department of Statistics, UBC Graduate Pathways to Success Graduate & Postdoctoral Studies November 13, 2013 Outline Summarizing Data Types of Data Visualizing Data
Description of Data I
 Description of Data I (Summary and Variability measures) Objectives: Able to understand how to summarize the data Able to understand how to measure the variability of the data Able to use and interpret
9/17/2015. Basic Statistics for the Healthcare Professional. Relax.it won t be that bad! Purpose of Statistic. Objectives
 Basic Statistics for the Healthcare Professional 1 F R A N K C O H E N, M B B, M P A D I R E C T O R O F A N A L Y T I C S D O C T O R S M A N A G E M E N T, LLC Purpose of Statistic 2 Provide a numerical
AP STATISTICS FALL SEMESTSER FINAL EXAM STUDY GUIDE
 AP STATISTICS Name: FALL SEMESTSER FINAL EXAM STUDY GUIDE Period: *Go over Vocabulary Notecards! *This is not a comprehensive review you still should look over your past notes, homework/practice, Quizzes,
Data screening, transformations: MRC05
 Dale Berger Data screening, transformations: MRC05 This is a demonstration of data screening and transformations for a regression analysis. Our interest is in predicting current salary from education level
Lecture 2 Describing Data
 Lecture 2 Describing Data Thais Paiva STA 111 - Summer 2013 Term II July 2, 2013 Lecture Plan 1 Types of data 2 Describing the data with plots 3 Summary statistics for central tendency and spread 4 Histograms
Lecture 1: Review and Exploratory Data Analysis (EDA)
") Lecture 1: Review and Exploratory Data Analysis (EDA) Ani Manichaikul amanicha@jhsph.edu 16 April 2007 1 / 40 Course Information I Office hours For questions and help When? I ll announce this tomorrow
Lecture 1: Review and Exploratory Data Analysis (EDA) Ani Manichaikul amanicha@jhsph.edu 16 April 2007 1 / 40 Course Information I Office hours For questions and help When? I ll announce this tomorrow
appstats5.notebook September 07, 2016 Chapter 5
 Chapter 5 Describing Distributions Numerically Chapter 5 Objective: Students will be able to use statistics appropriate to the shape of the data distribution to compare of two or more different data sets.
STATISTICAL DISTRIBUTIONS AND THE CALCULATOR
 STATISTICAL DISTRIBUTIONS AND THE CALCULATOR 1. Basic data sets a. Measures of Center - Mean ( ): average of all values. Characteristic: non-resistant is affected by skew and outliers. - Median: Either
NOTES TO CONSIDER BEFORE ATTEMPTING EX 2C BOX PLOTS
 NOTES TO CONSIDER BEFORE ATTEMPTING EX 2C BOX PLOTS A box plot is a pictorial representation of the data and can be used to get a good idea and a clear picture about the distribution of the data. It shows
DATA HANDLING Five-Number Summary
 DATA HANDLING Five-Number Summary The five-number summary consists of the minimum and maximum values, the median, and the upper and lower quartiles. The minimum and the maximum are the smallest and greatest
Descriptive Statistics
 Petra Petrovics Descriptive Statistics 2 nd seminar DESCRIPTIVE STATISTICS Definition: Descriptive statistics is concerned only with collecting and describing data Methods: - statistical tables and graphs
STAT 113 Variability
 STAT 113 Variability Colin Reimer Dawson Oberlin College September 14, 2017 1 / 48 Outline Last Time: Shape and Center Variability Boxplots and the IQR Variance and Standard Deviaton Transformations 2
3.1 Measures of Central Tendency
 3.1 Measures of Central Tendency n Summation Notation x i or x Sum observation on the variable that appears to the right of the summation symbol. Example 1 Suppose the variable x i is used to represent
Describing Data: One Quantitative Variable
 STAT 250 Dr. Kari Lock Morgan The Big Picture Describing Data: One Quantitative Variable Population Sampling SECTIONS 2.2, 2.3 One quantitative variable (2.2, 2.3) Statistical Inference Sample Descriptive
starting on 5/1/1953 up until 2/1/2017.
 An Actuary s Guide to Financial Applications: Examples with EViews By William Bourgeois An actuary is a business professional who uses statistics to determine and analyze risks for companies. In this guide,
Putting Things Together Part 2
 Frequency Putting Things Together Part These exercise blend ideas from various graphs (histograms and boxplots), differing shapes of distributions, and values summarizing the data. Data for, and are in
Descriptive Statistics
 Chapter 3 Descriptive Statistics Chapter 2 presented graphical techniques for organizing and displaying data. Even though such graphical techniques allow the researcher to make some general observations
Frequency Distribution and Summary Statistics
 Frequency Distribution and Summary Statistics Dongmei Li Department of Public Health Sciences Office of Public Health Studies University of Hawai i at Mānoa Outline 1. Stemplot 2. Frequency table 3. Summary
STAT 157 HW1 Solutions
 STAT 157 HW1 Solutions http://www.stat.ucla.edu/~dinov/courses_students.dir/10/spring/stats157.dir/ Problem 1. 1.a: (6 points) Determine the Relative Frequency and the Cumulative Relative Frequency (fill
Overview/Outline. Moving beyond raw data. PSY 464 Advanced Experimental Design. Describing and Exploring Data The Normal Distribution
 PSY 464 Advanced Experimental Design Describing and Exploring Data The Normal Distribution 1 Overview/Outline Questions-problems? Exploring/Describing data Organizing/summarizing data Graphical presentations
CHAPTER 6. ' From the table the z value corresponding to this value Z = 1.96 or Z = 1.96 (d) P(Z >?) =
 P(Z >?) =") Solutions to End-of-Section and Chapter Review Problems 225 CHAPTER 6 6.1 (a) P(Z < 1.20) = 0.88493 P(Z > 1.25) = 1 0.89435 = 0.10565 P(1.25 < Z < 1.70) = 0.95543 0.89435 = 0.06108 (d) P(Z < 1.25) or Z
Solutions to End-of-Section and Chapter Review Problems 225 CHAPTER 6 6.1 (a) P(Z < 1.20) = 0.88493 P(Z > 1.25) = 1 0.89435 = 0.10565 P(1.25 < Z < 1.70) = 0.95543 0.89435 = 0.06108 (d) P(Z < 1.25) or Z
Some estimates of the height of the podium
 Some estimates of the height of the podium 24 36 40 40 40 41 42 44 46 48 50 53 65 98 1 5 number summary Inter quartile range (IQR) range = max min 2 1.5 IQR outlier rule 3 make a boxplot 24 36 40 40 40
SAMPLE. HSC formula sheet. Sphere V = 4 πr. Volume. A area of base
 Area of an annulus A = π(r 2 r 2 ) R radius of the outer circle r radius of the inner circle HSC formula sheet Area of an ellipse A = πab a length of the semi-major axis b length of the semi-minor axis
STA 248 H1S Winter 2008 Assignment 1 Solutions
 1. (a) Measures of location: STA 248 H1S Winter 2008 Assignment 1 Solutions i. The mean, 100 1=1 x i/100, can be made arbitrarily large if one of the x i are made arbitrarily large since the sample size
Table of Contents. New to the Second Edition... Chapter 1: Introduction : Social Research...
 iii Table of Contents Preface... xiii Purpose... xiii Outline of Chapters... xiv New to the Second Edition... xvii Acknowledgements... xviii Chapter 1: Introduction... 1 1.1: Social Research... 1 Introduction...
Week 1 Variables: Exploration, Familiarisation and Description. Descriptive Statistics.
 Week 1 Variables: Exploration, Familiarisation and Description. Descriptive Statistics. Convergent validity: the degree to which results/evidence from different tests/sources, converge on the same conclusion.
4. DESCRIPTIVE STATISTICS
 4. DESCRIPTIVE STATISTICS Descriptive Statistics is a body of techniques for summarizing and presenting the essential information in a data set. Eg: Here are daily high temperatures for Jan 16, 2009 in
Data that can be any numerical value are called continuous. These are usually things that are measured, such as height, length, time, speed, etc.
 Chapter 8 Measures of Center Data that can be any numerical value are called continuous. These are usually things that are measured, such as height, length, time, speed, etc. Data that can only be integer
PSYCHOLOGICAL STATISTICS
 UNIVERSITY OF CALICUT SCHOOL OF DISTANCE EDUCATION B Sc COUNSELLING PSYCHOLOGY (2011 Admission Onwards) II Semester Complementary Course PSYCHOLOGICAL STATISTICS QUESTION BANK 1. The process of grouping
Chapter 6 Simple Correlation and
 Contents Chapter 1 Introduction to Statistics Meaning of Statistics... 1 Definition of Statistics... 2 Importance and Scope of Statistics... 2 Application of Statistics... 3 Characteristics of Statistics...
CHAPTER 2 Describing Data: Numerical
 CHAPTER Multiple-Choice Questions 1. A scatter plot can illustrate all of the following except: A) the median of each of the two variables B) the range of each of the two variables C) an indication of
Lecture Week 4 Inspecting Data: Distributions
 Lecture Week 4 Inspecting Data: Distributions Introduction to Research Methods & Statistics 2013 2014 Hemmo Smit So next week No lecture & workgroups But Practice Test on-line (BB) Enter data for your
Section 6-1 : Numerical Summaries
 MAT 2377 (Winter 2012) Section 6-1 : Numerical Summaries With a random experiment comes data. In these notes, we learn techniques to describe the data. Data : We will denote the n observations of the random
BUSI 444 Suggested Answers to Review and Discussion Questions: Lesson 7
 BUSI 444 Suggested Answers to Review and Discussion Questions: Lesson 7 1. Use Analyze Descriptive Statistics Descriptives to calculate the standard deviation and mean for each variable. Then manually
Time allowed : 3 hours Maximum marks : 100. Total number of questions : 8 Total number of printed pages : 7 PART A
 : 1 : Roll No... Time allowed : 3 hours Maximum marks : 100 Total number of questions : 8 Total number of printed pages : 7 PART A (Answer Question No.1 which is compulsory and any two of the rest from
Summarising Data. Summarising Data. Examples of Types of Data. Types of Data
 Summarising Data Summarising Data Mark Lunt Arthritis Research UK Epidemiology Unit University of Manchester Today we will consider Different types of data Appropriate ways to summarise these data 17/10/2017
SOLUTIONS TO THE LAB 1 ASSIGNMENT
 SOLUTIONS TO THE LAB 1 ASSIGNMENT Question 1 Excel produces the following histogram of pull strengths for the 100 resistors: 2 20 Histogram of Pull Strengths (lb) Frequency 1 10 0 9 61 63 6 67 69 71 73
Handout 4 numerical descriptive measures part 2. Example 1. Variance and Standard Deviation for Grouped Data. mf N 535 = = 25
 Handout 4 numerical descriptive measures part Calculating Mean for Grouped Data mf Mean for population data: µ mf Mean for sample data: x n where m is the midpoint and f is the frequency of a class. Example
Chapter 3. Descriptive Measures. Copyright 2016, 2012, 2008 Pearson Education, Inc. Chapter 3, Slide 1
 Chapter 3 Descriptive Measures Copyright 2016, 2012, 2008 Pearson Education, Inc. Chapter 3, Slide 1 Chapter 3 Descriptive Measures Mean, Median and Mode Copyright 2016, 2012, 2008 Pearson Education, Inc.
How Wealthy Are Europeans?
 How Wealthy Are Europeans? Grades: 7, 8, 11, 12 (course specific) Description: Organization of data of to examine measures of spread and measures of central tendency in examination of Gross Domestic Product
Monte Carlo Simulation (Random Number Generation)
") Monte Carlo Simulation (Random Number Generation) Revised: 10/11/2017 Summary... 1 Data Input... 1 Analysis Options... 6 Summary Statistics... 6 Box-and-Whisker Plots... 7 Percentiles... 9 Quantile Plots...
Monte Carlo Simulation (Random Number Generation) Revised: 10/11/2017 Summary... 1 Data Input... 1 Analysis Options... 6 Summary Statistics... 6 Box-and-Whisker Plots... 7 Percentiles... 9 Quantile Plots...
Basic Procedure for Histograms
 Basic Procedure for Histograms 1. Compute the range of observations (min. & max. value) 2. Choose an initial # of classes (most likely based on the range of values, try and find a number of classes that
Standardized Data Percentiles, Quartiles and Box Plots Grouped Data Skewness and Kurtosis
 Descriptive Statistics (Part 2) 4 Chapter Percentiles, Quartiles and Box Plots Grouped Data Skewness and Kurtosis McGraw-Hill/Irwin Copyright 2009 by The McGraw-Hill Companies, Inc. Chebyshev s Theorem
YEAR 12 Trial Exam Paper FURTHER MATHEMATICS. Written examination 1. Worked solutions
 YEAR 12 Trial Exam Paper 2018 FURTHER MATHEMATICS Written examination 1 Worked solutions This book presents: worked solutions explanatory notes tips on how to approach the exam. This trial examination
Mini-Lecture 3.1 Measures of Central Tendency
 Mini-Lecture 3.1 Measures of Central Tendency Objectives 1. Determine the arithmetic mean of a variable from raw data 2. Determine the median of a variable from raw data 3. Explain what it means for a
CABARRUS COUNTY 2008 APPRAISAL MANUAL
 STATISTICS AND THE APPRAISAL PROCESS PREFACE Like many of the technical aspects of appraising, such as income valuation, you have to work with and use statistics before you can really begin to understand
STARRY GOLD ACADEMY , , Page 1
 ICAN KNOWLEDGE LEVEL QUANTITATIVE TECHNIQUE IN BUSINESS MOCK EXAMINATION QUESTIONS FOR NOVEMBER 2016 DIET. INSTRUCTION: ATTEMPT ALL QUESTIONS IN THIS SECTION OBJECTIVE QUESTIONS Given the following sample
The Normal Distribution
 Stat 6 Introduction to Business Statistics I Spring 009 Professor: Dr. Petrutza Caragea Section A Tuesdays and Thursdays 9:300:50 a.m. Chapter, Section.3 The Normal Distribution Density Curves So far we
MATHEMATICS APPLIED TO BIOLOGICAL SCIENCES MVE PA 07. LP07 DESCRIPTIVE STATISTICS - Calculating of statistical indicators (1)
") LP07 DESCRIPTIVE STATISTICS - Calculating of statistical indicators (1) Descriptive statistics are ways of summarizing large sets of quantitative (numerical) information. The best way to reduce a set of
LP07 DESCRIPTIVE STATISTICS - Calculating of statistical indicators (1) Descriptive statistics are ways of summarizing large sets of quantitative (numerical) information. The best way to reduce a set of
Percentiles, STATA, Box Plots, Standardizing, and Other Transformations
 Percentiles, STATA, Box Plots, Standardizing, and Other Transformations Lecture 3 Reading: Sections 5.7 54 Remember, when you finish a chapter make sure not to miss the last couple of boxes: What Can Go
Simple Descriptive Statistics
 Simple Descriptive Statistics These are ways to summarize a data set quickly and accurately The most common way of describing a variable distribution is in terms of two of its properties: Central tendency
Applications of Data Dispersions
 1 Applications of Data Dispersions Key Definitions Standard Deviation: The standard deviation shows how far away each value is from the mean on average. Z-Scores: The distance between the mean and a given
Measures of Central Tendency Lecture 5 22 February 2006 R. Ryznar
 Measures of Central Tendency 11.220 Lecture 5 22 February 2006 R. Ryznar Today s Content Wrap-up from yesterday Frequency Distributions The Mean, Median and Mode Levels of Measurement and Measures of Central
Introduction to Computational Finance and Financial Econometrics Descriptive Statistics
 You can t see this text! Introduction to Computational Finance and Financial Econometrics Descriptive Statistics Eric Zivot Summer 2015 Eric Zivot (Copyright 2015) Descriptive Statistics 1 / 28 Outline
Empirical Rule (P148)
") Interpreting the Standard Deviation Numerical Descriptive Measures for Quantitative data III Dr. Tom Ilvento FREC 408 We can use the standard deviation to express the proportion of cases that might fall
Interpreting the Standard Deviation Numerical Descriptive Measures for Quantitative data III Dr. Tom Ilvento FREC 408 We can use the standard deviation to express the proportion of cases that might fall
Some Characteristics of Data
 Some Characteristics of Data Not all data is the same, and depending on some characteristics of a particular dataset, there are some limitations as to what can and cannot be done with that data. Some key
HIGHER SECONDARY I ST YEAR STATISTICS MODEL QUESTION PAPER
 HIGHER SECONDARY I ST YEAR STATISTICS MODEL QUESTION PAPER Time - 2½ Hrs Max. Marks - 70 PART - I 15 x 1 = 15 Answer all the Questions I. Choose the Best Answer 1. Statistics may be called the Science
Random Variables and Probability Distributions
 Chapter 3 Random Variables and Probability Distributions Chapter Three Random Variables and Probability Distributions 3. Introduction An event is defined as the possible outcome of an experiment. In engineering
STAT Chapter 5: Continuous Distributions. Probability distributions are used a bit differently for continuous r.v. s than for discrete r.v. s.
 STAT 515 -- Chapter 5: Continuous Distributions Probability distributions are used a bit differently for continuous r.v. s than for discrete r.v. s. Continuous distributions typically are represented by
NOTES: Chapter 4 Describing Data
 NOTES: Chapter 4 Describing Data Intro to Statistics COLYER Spring 2017 Student Name: Page 2 Section 4.1 ~ What is Average? Objective: In this section you will understand the difference between the three
Lecture Slides. Elementary Statistics Tenth Edition. by Mario F. Triola. and the Triola Statistics Series. Slide 1
 Lecture Slides Elementary Statistics Tenth Edition and the Triola Statistics Series by Mario F. Triola Slide 1 Chapter 6 Normal Probability Distributions 6-1 Overview 6-2 The Standard Normal Distribution
Contents Part I Descriptive Statistics 1 Introduction and Framework Population, Sample, and Observations Variables Quali
 Part I Descriptive Statistics 1 Introduction and Framework... 3 1.1 Population, Sample, and Observations... 3 1.2 Variables.... 4 1.2.1 Qualitative and Quantitative Variables.... 5 1.2.2 Discrete and Continuous
The Range, the Inter Quartile Range (or IQR), and the Standard Deviation (which we usually denote by a lower case s).
, and the Standard Deviation (which we usually denote by a lower case s).") We will look the three common and useful measures of spread. The Range, the Inter Quartile Range (or IQR), and the Standard Deviation (which we usually denote by a lower case s). 1 Ameasure of the center
We will look the three common and useful measures of spread. The Range, the Inter Quartile Range (or IQR), and the Standard Deviation (which we usually denote by a lower case s). 1 Ameasure of the center
CHAPTER TOPICS STATISTIK & PROBABILITAS. Copyright 2017 By. Ir. Arthur Daniel Limantara, MM, MT.
 Distribusi Normal CHAPTER TOPICS The Normal Distribution The Standardized Normal Distribution Evaluating the Normality Assumption The Uniform Distribution The Exponential Distribution 2 CONTINUOUS PROBABILITY
WC-5 Just How Credible Is That Employer? Exploring GLMs and Multilevel Modeling for NCCI s Excess Loss Factor Methodology
 Antitrust Notice The Casualty Actuarial Society is committed to adhering strictly to the letter and spirit of the antitrust laws. Seminars conducted under the auspices of the CAS are designed solely to
KING FAHD UNIVERSITY OF PETROLEUM & MINERALS DEPARTMENT OF MATHEMATICAL SCIENCES DHAHRAN, SAUDI ARABIA. Name: ID# Section
 KING FAHD UNIVERSITY OF PETROLEUM & MINERALS DEPARTMENT OF MATHEMATICAL SCIENCES DHAHRAN, SAUDI ARABIA STAT 11: BUSINESS STATISTICS I Semester 04 Major Exam #1 Sunday March 7, 005 Please circle your instructor
In an earlier question, we constructed a frequency table for a customer satisfaction survey at a bank.
 Question 3: What is a bar chart? On a histogram, the variable being examined is a quantitative variable. This means that each data value is a number. If the variable is a qualitative variable, the data
Dot Plot: A graph for displaying a set of data. Each numerical value is represented by a dot placed above a horizontal number line.
 Introduction We continue our study of descriptive statistics with measures of dispersion, such as dot plots, stem and leaf displays, quartiles, percentiles, and box plots. Dot plots, a stem-and-leaf display,
UNIVERSITY OF TORONTO SCARBOROUGH Department of Computer and Mathematical Sciences. STAB22H3 Statistics I Duration: 1 hour and 45 minutes
 UNIVERSITY OF TORONTO SCARBOROUGH Department of Computer and Mathematical Sciences STAB22H3 Statistics I Duration: 1 hour and 45 minutes Last Name: First Name: Student number: Aids allowed: - One handwritten
Exploratory Data Analysis
 Exploratory Data Analysis Stemplots (or Stem-and-leaf plots) Stemplot and Boxplot T -- leading digits are called stems T -- final digits are called leaves STAT 74 Descriptive Statistics 2 Example: (number
Chapter 2: Descriptive Statistics. Mean (Arithmetic Mean): Found by adding the data values and dividing the total by the number of data.
: Found by adding the data values and dividing the total by the number of data.") -3: Measure of Central Tendency Chapter : Descriptive Statistics The value at the center or middle of a data set. It is a tool for analyzing data. Part 1: Basic concepts of Measures of Center Ex. Data
-3: Measure of Central Tendency Chapter : Descriptive Statistics The value at the center or middle of a data set. It is a tool for analyzing data. Part 1: Basic concepts of Measures of Center Ex. Data
Measures of Center. Mean. 1. Mean 2. Median 3. Mode 4. Midrange (rarely used) Measure of Center. Notation. Mean
 Measure of Center. Notation. Mean") Measure of Center Measures of Center The value at the center or middle of a data set 1. Mean 2. Median 3. Mode 4. Midrange (rarely used) 1 2 Mean Notation The measure of center obtained by adding the values
Measure of Center Measures of Center The value at the center or middle of a data set 1. Mean 2. Median 3. Mode 4. Midrange (rarely used) 1 2 Mean Notation The measure of center obtained by adding the values
Unit 2 Statistics of One Variable
 Unit 2 Statistics of One Variable Day 6 Summarizing Quantitative Data Summarizing Quantitative Data We have discussed how to display quantitative data in a histogram It is useful to be able to describe
Probability & Statistics Modular Learning Exercises
 Probability & Statistics Modular Learning Exercises About The Actuarial Foundation The Actuarial Foundation, a 501(c)(3) nonprofit organization, develops, funds and executes education, scholarship and
The Not-So-Geeky World of Statistics
 FEBRUARY 3 5, 2015 / THE HILTON NEW YORK The Not-So-Geeky World of Statistics Chris Emerson Chris Sweet (a/k/a Chris 2 ) 2 Who We Are Chris Sweet JPMorgan Chase VP, Outside Counsel & Engagement Management
Multiple Choice: Identify the choice that best completes the statement or answers the question.
 U8: Statistics Review Name: Date: Multiple Choice: Identify the choice that best completes the statement or answers the question. 1. A floral delivery company conducts a study to measure the effect of
Introduction to R (2)
") Introduction to R (2) Boxplots Boxplots are highly efficient tools for the representation of the data distributions. The five number summary can be located in boxplots. Additionally, we can distinguish
Introduction to R (2) Boxplots Boxplots are highly efficient tools for the representation of the data distributions. The five number summary can be located in boxplots. Additionally, we can distinguish
Contents. An Overview of Statistical Applications CHAPTER 1. Contents (ix) Preface... (vii)
 Preface... (vii)") Contents (ix) Contents Preface... (vii) CHAPTER 1 An Overview of Statistical Applications 1.1 Introduction... 1 1. Probability Functions and Statistics... 1..1 Discrete versus Continuous Functions... 1..
Contents (ix) Contents Preface... (vii) CHAPTER 1 An Overview of Statistical Applications 1.1 Introduction... 1 1. Probability Functions and Statistics... 1..1 Discrete versus Continuous Functions... 1..
1 Exercise One. 1.1 Calculate the mean ROI. Note that the data is not grouped! Below you find the raw data in tabular form:
 1 Exercise One Note that the data is not grouped! 1.1 Calculate the mean ROI Below you find the raw data in tabular form: Obs Data 1 18.5 2 18.6 3 17.4 4 12.2 5 19.7 6 5.6 7 7.7 8 9.8 9 19.9 10 9.9 11
Categorical. A general name for non-numerical data; the data is separated into categories of some kind.
 Chapter 5 Categorical A general name for non-numerical data; the data is separated into categories of some kind. Nominal data Categorical data with no implied order. Eg. Eye colours, favourite TV show,
Valid Missing Total. N Percent N Percent N Percent , ,0% 0,0% 2 100,0% 1, ,0% 0,0% 2 100,0% 2, ,0% 0,0% 5 100,0%
 dimension1 GET FILE= validacaonestscoremédico.sav' (só com os 59 doentes) /COMPRESSED. SORT CASES BY UMcpEVA (D). EXAMINE VARIABLES=UMcpEVA BY NoRespostasSignif /PLOT BOXPLOT HISTOGRAM NPPLOT /COMPARE
STAT Chapter 5: Continuous Distributions. Probability distributions are used a bit differently for continuous r.v. s than for discrete r.v. s.
 STAT 515 -- Chapter 5: Continuous Distributions Probability distributions are used a bit differently for continuous r.v. s than for discrete r.v. s. Continuous distributions typically are represented by
2019 Revaluation Update. Presented by the Mecklenburg County Assessor s Office
 2019 Revaluation Update Presented by the Mecklenburg County Assessor s Office Progress to Date 203,933 Parcels Completed 914 Residential Neighborhoods Completed (57%) All neighborhoods will be completed
Graphical and Tabular Methods in Descriptive Statistics. Descriptive Statistics
 Graphical and Tabular Methods in Descriptive Statistics MATH 3342 Section 1.2 Descriptive Statistics n Graphs and Tables n Numerical Summaries Sections 1.3 and 1.4 1 Why graph data? n The amount of data
A LEVEL MATHEMATICS ANSWERS AND MARKSCHEMES SUMMARY STATISTICS AND DIAGRAMS. 1. a) 45 B1 [1] b) 7 th value 37 M1 A1 [2]
![A LEVEL MATHEMATICS ANSWERS AND MARKSCHEMES SUMMARY STATISTICS AND DIAGRAMS. 1. a) 45 B1 [1] b) 7 th value 37 M1 A1 [2]](/thumbs/81/83043398.jpg "A LEVEL MATHEMATICS ANSWERS AND MARKSCHEMES SUMMARY STATISTICS AND DIAGRAMS. 1. a) 45 B1 [1] b) 7 th value 37 M1 A1 [2]") 1. a) 45 [1] b) 7 th value 37 [] n c) LQ : 4 = 3.5 4 th value so LQ = 5 3 n UQ : 4 = 9.75 10 th value so UQ = 45 IQR = 0 f.t. d) Median is closer to upper quartile Hence negative skew [] Page 1 . a) Orders
1. a) 45 [1] b) 7 th value 37 [] n c) LQ : 4 = 3.5 4 th value so LQ = 5 3 n UQ : 4 = 9.75 10 th value so UQ = 45 IQR = 0 f.t. d) Median is closer to upper quartile Hence negative skew [] Page 1 . a) Orders
Security Analysis: Performance
 Security Analysis: Performance Independent Variable: 1 Yr. Mean ROR: 8.72% STD: 16.76% Time Horizon: 2/1993-6/2003 Holding Period: 12 months Risk-free ROR: 1.53% Ticker Name Beta Alpha Correlation Sharpe
Descriptive Analysis
 Descriptive Analysis HERTANTO WAHYU SUBAGIO Univariate Analysis Univariate analysis involves the examination across cases of one variable at a time. There are three major characteristics of a single variable
Measures of Dispersion (Range, standard deviation, standard error) Introduction
 Introduction") Measures of Dispersion (Range, standard deviation, standard error) Introduction We have already learnt that frequency distribution table gives a rough idea of the distribution of the variables in a sample
Measures of Dispersion (Range, standard deviation, standard error) Introduction We have already learnt that frequency distribution table gives a rough idea of the distribution of the variables in a sample
Measures of Central Tendency: Ungrouped Data. Mode. Median. Mode -- Example. Median: Example with an Odd Number of Terms
 Measures of Central Tendency: Ungrouped Data Measures of central tendency yield information about particular places or locations in a group of numbers. Common Measures of Location Mode Median Percentiles
22.2 Shape, Center, and Spread
 Name Class Date 22.2 Shape, Center, and Spread Essential Question: Which measures of center and spread are appropriate for a normal distribution, and which are appropriate for a skewed distribution? Eplore
Descriptive Statistics Bios 662
 Descriptive Statistics Bios 662 Michael G. Hudgens, Ph.D. mhudgens@bios.unc.edu http://www.bios.unc.edu/ mhudgens 2008-08-19 08:51 BIOS 662 1 Descriptive Statistics Descriptive Statistics Types of variables