KPIT Technologies. CMP: INR175 TP: INR170 Downgrade to Neutral
|
|
|
- Mervin Anthony
- 5 years ago
- Views:
Transcription
 2/-27/4 Financials & Valuation (INR Billion) Y/E Mar 2015E 2016E 2017E Sales 29.5 33.5 37.9 EBITDA 4.4 5.3 6.2 PAT 2.7 3.4 4.2 EPS (INR) 13.5 17.1 21.0 EPS Gr. (%) 7.5 27.0 22.5 BV/Sh. 77.")
1 BSE SENSEX S&P CNX 26,026 7,768 Bloomberg KPIT IN Equity Shares (m) M.Cap. (INR b) / (USD b) 34.0/ Week Range (INR) 191/122 1, 6, 12 Rel. Per (%) 2/-27/4 Financials & Valuation (INR Billion) Y/E Mar 2015E 2016E 2017E Sales EBITDA PAT EPS (INR) EPS Gr. (%) BV/Sh RoE (%) RoCE (%) P/E (x) EV/EBITDA July QFY15 Results Update Sector: Technology CMP: INR175 TP: INR170 Downgrade to Neutral 1QFY15 - significant margin disappointment: KPIT s 1QFY15 margins were a significant disappointment, with EBITDA margin declining 400bp QoQ to 12.1%, v/s our est. of 200bp decline to 14.1%. Gross profit margin declined even more by 550bp QoQ to 26.5% v/s est. of 30%. Revenue grew 1.4% QoQ to USD115.2m, marginally below our estimate of 2.5% QoQ growth to USD116.4m. PAT was INR508m (est. of INR585m) v/s INR515m in 4Q (excluding an exceptional item). Multiple factors dragged profitability: [1] Wage hikes (240bp), [2] Currency (60bp), [3] Onsite mix shift (~60bp), [4] Utilization (40bp), [5] Visa costs (25bp) and [6] I-Cubed acquisition (30bp). Outlook on near term performance: KPIT expects sustained improvement in the operational profitability in the coming quarters aided by growth, utilization and pyramid improvement. However, some promotions and corrections will impact margins in 2Q and 3Q by 50bp and visa costs are spread through the year. 2Q is expected to see significantly better revenue growth on: [1] ramp-up in Telematics deal, [2] execution of multiple deals closed during the quarter and [3] full quarter s impact of I-Cubed acquisition. Cutting estimates: Our EPS estimates are lower by 8.0% for FY15E to INR13.5 and 5.9% for FY16E to INR17.1. We have revised the USD revenue growth, including the acquisition of I-Cubed, now to 12% in FY15E. Our EBITDA margin is revised downwards by 160bp to 14.8% in FY15E and by 100bp to 16% in FY16E. Downgrade rating to Neutral: After a sub-par FY14, 1QFY15 performance poses significant challenges for the company to converge the performance gap with peers over the medium term. In congruence with the performance, we expect the stock to stay subdued, compared to peers, till clear visibility emerges in the uptick in financial performance. Hence, we downgrade the rating to Neutral, with a revised target price of INR170, which discounts FY16E EPS by 10x. Ashish Chopra (Ashish.Chopra@MotilalOswal.com); Siddharth Vora (Siddharth.Vora@MotilalOswal.com); Investors are advised to refer through disclosures made at the end of the Research Report.
.")

2 1QFY15: Significant Profitability miss KPIT s 1QFY15 revenue grew 1.4% QoQ to USD115.2m, marginally below our estimate of 2.5% QoQ growth to USD116.4m. It consolidated I-Cubed numbers during the quarter. In Rupee terms, revenue was INR6897m, down 1.5% QoQ, v/s our estimate of INR6928m (-1% QoQ). USD Revenue was marginally below our estimate Source: MOSL, Company Gross profit margin declined a significant 550bp QoQ to 26.5% - a major disappointment during the quarter. This was despite SAP returning to profitability, which should be a tailwind of ~90-100bp in our view. Some of the factors contributing towards the steep decline in Gross margin are: Wage hikes were effective from April 01 and had a negative impact of 240bp on the EBITDA margin during the quarter. On a like to like basis the average wage hikes were 4%-5% onsite and 9%-11% offshore. Visa cost, impact from which will be spread out throughout the year, had 25bp impact in 1Q Rupee appreciated to INR59.87/USD v/s INR61.63 in 4QFY14. This had a negative impact of around 60bp on the EBITDA margin Due to one-time transaction and integration expenses, operationally I- Cubed had a loss, which had a 30bp impact Revenue mix during the quarter shifted in favor of onsite by 290bp, which as per our analysis had another 60bp impact. Offshore utilization decline 80bp QoQ, which would another ~30bp of margin loss. SGA declined 150bp QoQ to 14.4%, v/s our estimate of 15.8%, which cushioned a fraction of the decline in Gross Margins. Consequently, EBITDA margin during the quarter was 12.1%, down 400bp QoQ, v/s our estimate of 200bp QoQ decline to 14.1%. 22 July

3 EBITDA margins declined 400bps QoQ, despite 150bp QoQ reduction in SGA Source: MOSL, Company The other income during the quarter stood at INR107.86m as against loss of INR177.09m in 4QFY14. Other income included forex gain of INR74.57m against a loss of INR239.17m in the previous quarter. PAT was INR508m, v/s INR515m in 4Q (excluding exceptional item) and well below our estimate of INR585m. Segment-wise performance: US soft, A&E driving growth Manufacturing was the fastest growing vertical during the quarter by 5.9% QoQ, while others decline 9.5% QoQ. Manufacturing only vertical to drive growth Verticals Contr. to Rev. Growth - QoQ Contr to incr. 4 Qtr CQGR (%) (%) rev (%) (%) Automotive & Transportation (0.6) Manufacturing Energy & Utilities Others 8.6 (9.5) (64.8) (4.1) IES and A&E grew by 4.64% and 2.72% respectively while SAP and BTU declined by 3.44% and 2.69% respectively. Auto & Engineering, which is 26% of KPIT s revenues, is the healthiest of its segments over the last 4 quarters (4.2% CQGR). IES and Auto & Engg have been the growth driver over last few quarters Lines of Business Contr. to Contr Growth - QoQ (%) Rev. (%) to incr. rev (%) 4 Qtr CQGR (%) IES Auto & Engg SAP 22.6 (3.4) (57.7) (2.1) BTU 10.7 (2.7) (21.2) (1.0) On a QoQ basis, Europe growth was 10.96%, while US marginally grew by 0.4%. During the quarter APAC had a marginal de-growth of 3.06% due to quarterly fluctuations in billing. Over the last 6 quarters, US, the key geography, has remained flattish (between USD79-82m), hurting the overall company s growth 22 July
 4 Qtr CQGR (%) America 69.1 0.4 21.5 (0.6) Europe 15.8 10.9 112.4 6.3 APAC 15.1 (3.0) (33.9) 7.")

4 (US is 69% of revenues). Europe and APAC are seeing strong traction on a low base. Europe showed healthy growth Geographies Contr. to Rev. (%) Growth - QoQ (%) Contr to incr. rev (%) 4 Qtr CQGR (%) America (0.6) Europe APAC 15.1 (3.0) (33.9) 7.6 Top account Cummins grew sequentially during the quarter, but revenues remain range bound (between USD18-20m). Top 2-5 clients were weak during the quarter, declining 7.2% QoQ, and have been sluggish. Top6-10 clients have been growing impressively. Top 2-5 clients segment suffered due to the second largest client. Second largest customer declined Top 2-5, to continue in next quarter Top Clients Contr. to Rev. (%) Growth - QoQ (%) Contr to incr. rev (%) 4 Qtr CQGR (%) Top Client - Cummins Top 2-5 Clients 18.5 (7.2) (1.0) (2.7) Top 6-10 Clients Cummins revenue grew after a sharp decline last quarter SAP showed a decline but was margin positive Source: MOSL, Company Source: MOSL, Company Takeaways from management comments Revenue growth outlook: KPIT closed multiple deals during the quarter and the execution on these has started in the month of July. It also started delivering on the telematics deal in India and expects a good ramp up in delivery during the coming quarters. The company remains positive on the growth prospects during the remainder of the year Profitability outlook: Some corrections and promotions will additionally take effect from July 01 and October 01. The net impact on operational margins due to this would be around 0.5% in both 2QFY15 and 3QFY15. The visa cost impact will be spread out throughout the year. Despite the two factors, KPIT expects sustained improvement in the operational profitability in the coming quarters aided by growth, utilization improvement and pyramid improvement. Organization restructuring: 1QFY15 is the first complete quarter post our organizational restructuring and formation of new business units. The company 22 July
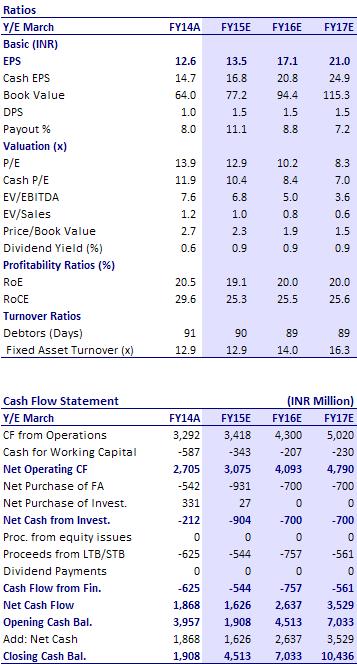
5 has almost completed the desired changes in our organization structure. It has filled up some new strategic positions by hiring senior level industry partisans. Cutting estimates on revenue and margins KPIT targeted EBITDA margin of 17% in FY15, however, 1QFY15 EBITDA margin of 12% implies that despite significant recovery in the remainder of the year (we model exit EBITDA margin of 16.1%), it may fall short of its target. So, our EBITDA margin is revised downwards by 110bp to 14.8% in FY15 and by 60bp to 15.9% in FY16. 1QFY15 revenues require KPIT to post a CQGR of 5.2% over 2Q-4QFY15, to meet the lower end of its guided band of 12-14%. Our earlier growth estimate of 15% factored the revenues from the acquisition as well. However, we have now moderated our revenue growth estimate to 12% in FY15 including I-Cubed. Consequently, our EPS estimates are lower by 8% for FY15 to INR13.5 and 5.9% for FY16 to INR17.1. Change in estimates Revised Earlier Change FY15E FY16E FY15E FY16E FY15E FY16E INR/USD % 0.0% USD Revenue (m) % -2.4% USD revenue growth (%) bp -60bp EBITDA Margin (%) bp -60bp EPS (INR) % -5.9% EPS Growth (%) Valuation View KPIT remains focused on select verticals, evidenced as the company added strong ERP capabilities to its Engineering prowess by acquisitions of CPG, Sparta and Systime. Going forward, it is looking to expand to new-age services like Analytics, PLM and even IMS. Its focus on Auto engineering services should also serve it well in its quest to expand to USD1b in revenues in a few years time. However, after a sub-par FY14, 1QFY15 performance poses significant challenges to the company to converge the performance gap with peers over the medium term. This, especially in a robust demand outlook for IT Services will weigh on the company s valuation relative to peers. KPIT trades at 12.9x FY15E and 10.2x FY16E EPS. We expect the company to grow its USD revenues at a CAGR of 14% (supported by I-Cubed) over FY14-16E and EPS at a CAGR of 17% (on a forex-hit FY14 base) during this period. In congruence with the performance, we expect to stock, too, to stay subdued compared to peers; till clear visibility emerges in the uptick in financial performance. As a result, we downgrade our rating to Neutral, with a revised target of INR170, which discounts FY16E EPS by 10x. Other result highlights Total development team at the end of the quarter increased by 174 to 8,757. Offshore utilization during the quarter was 70.15%, down 80bp QoQ. 22 July
6 KPIT added 3 new clients during the quarter taking total active client count to 201. Total amount of USD hedges at the end of the quarter stand at USD45.2m. These hedges are maturing in FY15 and average rate for these hedges is INR62.7 The Cash Balance as at the end of the quarter stood at INR 4.11b as compared to INR3.74b in the previous quarter. Total debt decreased to INR5.29b from INR4.94b at the end of previous quarter. Debtor days at the end of the quarter reduced by 5 days to 82 (from 87 in the previous quarter). Revenue proportion from Fixed Price contracts increased 130bps QoQ to 28.4% 22 July


7 Story in Charts Offerings focused on select verticals, with mix of IT and Engg Auto Engg to be the key growth driver SAP drag FY14 performance, to return to growth in FY15 SAP turnaround drives positive revenue outlook and outlook of healthy profit growth Unlikelihood of large acquisitions to help improve FCF 22 July
8 Operating Metrics 1QFY13 2QFY13 3QFY13 4QFY13 1QFY14 2QFY14 3QFY14 4QFY14 1QFY15 Geography Analysis (%) USA Europe ROW LOB Analysis (%) Integrated Enterprise Solutions Auto & Engg SAP Business Transformation Unit Customer Details No. of Customers Added No. of Active Customers Customers with a runrate of > $1m Top Customer Cummins (%) Top 5 Customers (%) Top 10 Customer (%) Revenue Split (%) Onsite Revenues Offshore Revenues Contract Type (%) T&M FP Debtor Days HR - Details Development Team Onsite (Avg) 1,031 1,126 1,148 1,139 1,176 1,243 1,274 1,366 1,423 Offshore (Avg) 6,074 6,207 6,364 6,486 6,553 6,708 6,987 7,139 7,224 Onsite FTE 977 1,064 1,066 1,074 1,107 1,148 1,123 1,231 1,293 Offshore FTE 4,501 4,638 4,637 4,805 4,809 4,888 4,985 5,064 5,068 Total FTE 5,478 5,702 5,703 5,879 5,916 6,036 6,108 6,295 6,361 Development 7,218 7,447 7,616 7,648 7,771 8,122 8,430 8,583 8,757 Support Marketing Total 7,873 8,111 8,286 8,321 8,456 8,816 9,136 9,296 9,490 Utilization (%) Onsite Offshore (Incl. Trainees) July
9 : an investment profile Company description KPIT Cummins is a leading technology solutions partner for global manufacturing corporations, with special focus on automotive, energy & utilities, industrial equipments and semiconductor industries. With over USD450m revenue (LTM) and 9,490 employees, company continues to focus on its chosen areas to grow, with equal thrust on organic and inorganic approaches. Key investment arguments A rare example in Indian IT of successfully integrating multiple acquisitions. Impressive organic growth despite inorganic thrust % in FY11 and 37% in FY12. Potential option value from success of its hybrid engine venture Revolo. Key investment risks Continued pressure on profit margins due to lower margin profile of acquisitions. Limited free cash flow generation due to thrust on inorganic growth route. Recent developments To enhance the existing IMS portfolio KPIT have formed a partnership with HP for cloud services and have launched KPIT Cloud powered by HP. KPIT added 3 new customers during the quarter. Valuation and view We expect KPIT to post revenue at a CAGR of 14% and EPS CAGR of 17% over FY The stock trades at 12.9x FY15E and 10.2x FY16E EPS. Downgrade to Neutral with a target price of INR170, which discounts our FY16E EPS by 10x. Sector view With strengthening demand in the US and large deals traction in traditional services in Europe, industry growth in FY15 should be better than FY14. Digital technologies/smac may not be a needle mover right now but are increasingly seeing traction and can potentially drive downstream opportunity. We see better risk-reward in Tier-I v/s Tier-II. Currency is a key risk to valuations, and Tier-II has a higher sensitivity to the same v/s Tier-I. Comparative valuations KPIT MTCL HEXW P/E (x) FY15E FY16E P/BV (x) FY15E FY16E EV/Sales (x) FY15E FY16E EV/EBITDA (x) FY15E FY16E EPS: MOSL forecast v/s consensus (INR) MOSL Forecast Consensus Forecast Variation (%) FY FY Target price and recommendation Current Target Upside Reco Price (INR) Price (INR) (%) Neutral Shareholding pattern (%) Mar-14 Dec-13 Mar-13 Promoter DII FII Others Note: FII Includes depository receipts Stock performance (1-year) 22 July
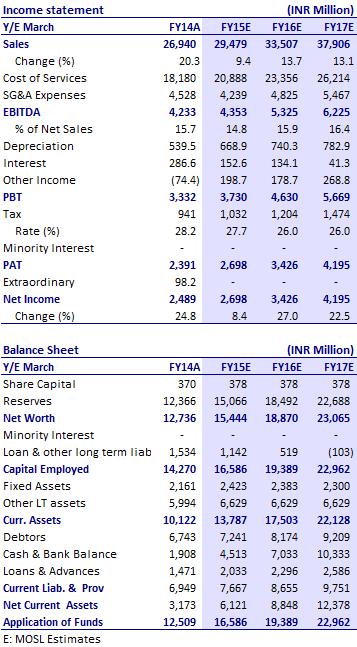
10 Financials and valuation 22 July
11 Disclosures This research report has been prepared by MOSt to provide information about the company(ies) and sector(s), if any, covered in the report and may be distributed by it and/or its affiliated company(ies). This report is for personal information of the select recipient and does not construe to be any investment, legal or taxation advice to you. This research report does not constitute an offer, KPIT invitation Technologies or inducement to invest in securities or other investments and Motilal Oswal Securities Limited (hereinafter referred as MOSt) is not soliciting any action based upon it. This report is not for public distribution and has been furnished to you solely for your general information and should not be reproduced or redistributed to any other person in any form. This report does not constitute a personal recommendation or take into account the particular investment objectives, financial situations, or needs of individual clients. Before acting on any advice or recommendation in this material, investors should consider whether it is suitable for their particular circumstances and, if necessary, seek professional advice. The price and value of the investments referred to in this material and the income from them may go down as well as up, and investors may realize losses on any investments. Past performance is not a guide for future performance, future returns are not guaranteed and a loss of original capital may occur. MOSt and its affiliates are a full-service, integrated investment banking, investment management, brokerage and financing group. We and our affiliates have investment banking and other business relationships with a significant percentage of the companies covered by our Research Department Our research professionals provide important input into our investment banking and other business selection processes. Investors should assume that MOSt and/or its affiliates are seeking or will seek investment banking or other business from the company or companies that are the subject of this material and that the research professionals who were involved in preparing this material may participate in the solicitation of such business. The research professionals responsible for the preparation of this document may interact with trading desk personnel, sales personnel and other parties for the purpose of gathering, applying and interpreting market information. Our research professionals are paid in part based on the profitability of MOSt which include earnings from investment banking and other business. MOSt generally prohibits its analysts, persons reporting to analysts, and members of their households from maintaining a financial interest in the securities or derivatives of any companies that the analysts cover. Additionally, MOSt generally prohibits its analysts and persons reporting to analysts from serving as an officer, director, or advisory board member of any companies that the analysts cover. Our salespeople, traders, and other professionals or affiliates may provide oral or written market commentary or trading strategies to our clients that reflect opinions that are contrary to the opinions expressed herein, and our proprietary trading and investing businesses may make investment decisions that are inconsistent with the recommendations expressed herein. In reviewing these materials, you should be aware that any or all o the foregoing, among other things, may give rise to real or potential conflicts of interest. MOSt and its affiliated company(ies), their directors and employees may; (a) from time to time, have a long or short position in, and buy or sell the securities of the company(ies) mentioned herein or (b) be engaged in any other transaction involving such securities and earn brokerage or other compensation or act as a market maker in the financial instruments of the company(ies) discussed herein or act as an advisor or lender/borrower to such company(ies) or may have any other potential conflict of interests with respect to any recommendation and other related information and opinions. Unauthorized disclosure, use, dissemination or copying (either whole or partial) of this information, is prohibited. The person accessing this information specifically agrees to exempt MOSt or any of its affiliates or employees from, any and all responsibility/liability arising from such misuse and agrees not to hold MOSt or any of its affiliates or employees responsible for any such misuse and further agrees to hold MOSt or any of its affiliates or employees free and harmless from all losses, costs, damages, expenses that may be suffered by the person accessing this information due to any errors and delays. The information contained herein is based on publicly available data or other sources believed to be reliable. Any statements contained in this report attributed to a third party represent MOSt s interpretation of the data, information and/or opinions provided by that third party either publicly or through a subscription service, and such use and interpretation have not been reviewed by the third party. This Report is not intended to be a complete statement or summary of the securities, markets or developments referred to in the document. While we would endeavor to update the information herein on reasonable basis, MOSt and/or its affiliates are under no obligation to update the information. Also there may be regulatory, compliance, or other reasons that may prevent MOSt and/or its affiliates from doing so. MOSt or any of its affiliates or employees shall not be in any way responsible and liable for any loss or damage that may arise to any person from any inadvertent error in the information contained in this report. MOSt or any of its affiliates or employees do not provide, at any time, any express or implied warranty of any kind, regarding any matter pertaining to this report, including without limitation the implied warranties of merchantability, fitness for a particular purpose, and non-infringement. The recipients of this report should rely on their own investigations. Recipients who are not institutional investors should seek advice of their independent financial advisor prior to taking any investment decision based on this report or for any necessary explanation of its contents. MOSt and/or its affiliates and/or employees may have interests/positions, financial or otherwise in the securities mentioned in this report. To enhance transparency, MOSt has incorporated a Disclosure of Interest Statement in this document. This should, however, not be treated as endorsement of the views expressed in the report. Disclosure of Interest Statement KPIT TECHNOLOGIES LTD Analyst ownership of the stock No Analyst Certification The views expressed in this research report accurately reflect the personal views of the analyst(s) about the subject securities or issues, and no part of the compensation of the research analyst(s) was, is, or will be directly or indirectly related to the specific recommendations and views expressed by research analyst(s) in this report. The research analysts, strategists, or research associates principally responsible for preparation of MOSt research receive compensation based upon various factors, including quality of research, investor client feedback, stock picking, competitive factors and firm revenues. Regional Disclosures (outside India) This report is not directed or intended for distribution to or use by any person or entity resident in a state, country or any jurisdiction, where such distribution, publication, availability or use would be contrary to law, regulation or which would subject MOSt & its group companies to registration or licensing requirements within such jurisdictions. For U.K. This report is intended for distribution only to persons having professional experience in matters relating to investments as described in Article 19 of the Financial Services and Markets Act 2000 (Financial Promotion) Order 2005 (referred to as "investment professionals"). This document must not be acted on or relied on by persons who are not investment professionals. Any investment or investment activity to which this document relates is only available to investment professionals and will be engaged in only with such persons. For U.S. Motilal Oswal Securities Limited (MOSL) is not a registered broker - dealer under the U.S. Securities Exchange Act of 1934, as amended (the"1934 act") and under applicable state laws in the United States. In addition MOSL is not a registered investment adviser under the U.S. Investment Advisers Act of 1940, as amended (the "Advisers Act" and together with the 1934 Act, the "Acts), and under applicable state laws in the United States. Accordingly, in the absence of specific exemption under the Acts, any brokerage and investment services provided by MOSL, including the products and services described herein are not available to or intended for U.S. persons. This report is intended for distribution only to "Major Institutional Investors" as defined by Rule 15a-6(b)(4) of the Exchange Act and interpretations thereof by SEC (henceforth referred to as "major institutional investors"). This document must not be acted on or relied on by persons who are not major institutional investors. Any investment or investment activity to which this document relates is only available to major institutional investors and will be engaged in only with major institutional investors. In reliance on the exemption from registration provided by Rule 15a-6 of the U.S. Securities Exchange Act of 1934, as amended (the "Exchange Act") and interpretations thereof by the U.S. Securities and Exchange Commission ("SEC") in order to conduct business with Institutional Investors based in the U.S., MOSL has entered into a chaperoning agreement with a U.S. registered broker-dealer, Motilal Oswal Securities International Private Limited. ("MOSIPL"). Any business interaction pursuant to this report will have to be executed within the provisions of this chaperoning agreement. The Research Analysts contributing to the report may not be registered /qualified as research analyst with FINRA. Such research analyst may not be associated persons of the U.S. registered broker-dealer, MOSIPL, and therefore, may not be subject to NASD rule 2711 and NYSE Rule 472 restrictions on communication with a subject company, public appearances and trading securities held by a research analyst account. For Singapore Motilal Oswal Capital Markets Singapore Pte Limited is acting as an exempt financial advisor under section 23(1)(f) of the Financial Advisers Act(FAA) read with regulation 17(1)(d) of the Financial Advisors Regulations and is a subsidiary of Motilal Oswal Securities Limited in India. This research is distributed in Singapore by Motilal Oswal Capital Markets Singapore Pte Limited and it is only directed in Singapore to accredited investors, as defined in the Financial Advisers Regulations and the Securities and Futures Act (Chapter 289), as amended from time to time. In respect of any matter arising from or in connection with the research you could contact the following representatives of Motilal Oswal Capital Markets Singapore Pte Limited: Anosh Koppikar Kadambari Balachandran anosh.Koppikar@motilaloswal.com kadambari.balachandran@motilaloswal.com Contact(+65) Contact: (+65) / Office Address:21 (Suite 31),16 Collyer Quay,Singapore Motilal Oswal Securities Ltd 22 July 2014 Motilal Oswal Tower, Level 9, Sayani Road, Prabhadevi, Mumbai Phone: reports@motilaloswal.com
Hardick Bora
 BSE Sensex S&P CNX 19,990 6,069 Bloomberg JOL IN Equity Shares (m) 159.3 M.Cap. (INR b)/(usd b) 26.0/0.5 52-Week Range (INR) 248/154 1,6,12 Rel. Perf. (%) -18/-28/-34 Financials & Valuation (INR b) Y/E
Amara Raja Batteries. CMP: INR517 TP: INR560 Buy
 BSE SENSEX S&P CNX 25,665 7,672 Bloomberg AMRJ IN Equity Shares (m) 170.8 M.Cap. (INR b) / (USD b) 88.2/1.4 52-Week Range (INR) 520/208 1, 6, 12 Rel. Per (%) 5/21/97 Financials & Valuation (INR Million)
Niket Shah
 BSE Sensex S&P CNX 20,213 6,147 Bloomberg VGRD IN Equity Shares (m) 29.8 M.Cap. (INR b)/(usd b) 14.6/0.3 52-Week Range (INR) 591/180 1,6,12 Rel. Perf. (%) -8/-6/138 Financial summary (INR b) Y/E March
Sohail Halai Alpesh Mehta
 BSE Sensex S&P CNX 20,039 6,064 Bloomberg IDBI IN Equity Shares (m) 1,278.4 M.Cap. (INR b)/(usd b) 144.9/2.7 52-Week Range (INR) 122/82 1,6,12 Rel.Perf.(%) -1/6/2 Financials & Valuation (INR b) Y/E March
Sanjay Jain Pavas Pethia
 BSE Sensex S&P CNX 19,561 5,923 Bloomberg SAIL IN Equity Shares (m) 4,130.4 M.Cap. (INR b)/(usd b) 334.6/6.2 52-Week Range (INR) 116/76 1,6,12 Rel. Perf. (%) -11/-17/-38 Financials & Valuation (INR b)
Pidilite Industries. CMP: INR164 TP: INR186 Buy
 BSE SENSEX S&P CNX 16,640 5,043 Bloomberg PIDI IN Equity Shares (m) 506.1 52-Week Range (INR) 188/134 1,6,12 Rel. Perf. (%) 1/20/5 M.Cap. (INR b) 83.0 M.Cap. (USD b) 1.5 27 July 2012 1QFY13 Results Update
Asian Paints. CMP: INR2,722 TP: INR3,161 Buy
 BSE SENSEX S&P CNX 16,739 5,049 Bloomberg APNT IN Equity Shares (m) 95.9 52-Week Range (INR) 3,366/2,395 1,6,12 Rel. Perf. (%) -5/-3/14 M.Cap. (INR b) 261.1 M.Cap. (USD b) 4.9 23 January 2012 3QFY12 Results
Urban demand revives; Akzo gaining market share
 BSE Sensex S&P CNX 22,095 6,601 CMP: INR889 26 March 2014 Update Sector: Consumer Not Rated Urban demand revives; Akzo gaining market share Reiterates focus on Profitable growth Urban demand for Decorative
CMP: INR350 TP: INR375 Downgrade to Neutral
 BSE Sensex S&P CNX 19,497 5,897 Bloomberg COAL IN Equity Shares (m) 6,316.4 M.Cap. (INR b)/(usd b) 2,211/41 52-Week Range (INR) 386/301 1,6,12 Rel. Perf. (%) 1/-11/-5 Financials & Valuation (INR b) Y/E
Titan Industries. CMP: INR222 TP: INR220 Neutral
 BSE SENSEX S&P CNX 17,257 5,241 Bloomberg TTAN IN Equity Shares (m) 887.8 52-Week Range (INR) 255/154 1,6,12 Rel. Perf. (%) -1/13/3 M.Cap. (Rs b) 197.1 M.Cap. (US$ b) 3.6 2 August 2012 1QFY13 Results Update
Siddharth Bothra
 BSE Sensex S&P CNX 19,152 5,797 Bloomberg CSTRL IN Equity Shares (m) 494.6 M.Cap. (INR b)/(usd b) 158/2.9 52-Week Range (INR) 338/223 1,6,12 Rel. Perf. (%) 12/-3/26 Financials & Valuation (INR b) Y/E March
Idea Cellular. CMP: INR159 TP: INR200 Buy
 BSE SENSEX S&P CNX 19,164 5,678 Bloomberg IDEA IN Equity Shares (m) 3,316.2 M.Cap. (INR b) / (USD b) 513.7/8.4 52-Week Range (INR) 176/72 1, 6, 12 Rel. Per (%) 12/45/83 Financials & Valuation (INR Billion)
CMP: INR415 TP: INR 471 BUY
 04 Mar 2013 Update Sector: Technology Wipro CMP: INR415 TP: INR 471 BUY Pipeline and deal signings suggest improvement in growth; Multiple levers and focus on productivity will cushion margin headwinds
Jubilant Foodworks. CMP: INR1,189 TP: INR1,0541,054 Neutral
 BSE SENSEX S&P CNX 16,846 5,110 Bloomberg JUBI IN Equity Shares (m) 63.5 52-Week Range (INR) 1,189/633 1,6,12 Rel. Perf. (%) 4/38/47 M.Cap. (INR b) 75.5 M.Cap. (USD b) 1.3 26 July 2012 1QFY13 Results Update
Canara Bank. CMP: INR419 TP: INR525 Buy
 BSE SENSEX S&P CNX 18,817 5,724 Bloomberg CBK IN Equity Shares (m) 443.0 52-Week Range (INR) 566/349 1,6, 12 Rel.Perf.(%) -7/-18/-17 M.Cap. (INR b) 170.3 M.Cap. (USD b) 3.0 7 November 2012 2QFY13 Results
IndusInd Bank. CMP: INR345 TP: INR419 Buy
 BSE SENSEX S&P CNX 17,504 5,332 Bloomberg IIB IN Equity Shares (m) 467.7 52-Week Range (INR) 352/222 1,6,12 Rel.Perf.(%) 13/25/34 M.Cap. (INR b) 161.4 M.Cap. (USD b) 3.1 20 April 2012 4QFY12 Results Update
NTPC CMP: INR169 TP: INR191 Buy
 BSE SENSEX S&P CNX 18,625 5,664 Bloomberg NTPC IN Equity Shares (m) 8,245.5 52-Week Range (INR) 190/139 1,6,12 Rel. Perf. (%) 3/-4/-11 M.Cap. (INR b) 1,393.5 M.Cap. (USD b) 26.0 26 October 2012 2QFY13
Jinesh Gandhi Chirag Jain
 BSE Sensex S&P CNX 19,561 5,923 Bloomberg EIM IN Equity Shares (m) 27.0 M.Cap. (INR b)/(usd b) 72.0/1.3 52-Week Range 3,240/1,620 1,6,12 Rel. Perf. (%) -4/17/40 Financials & Valuation (INR b) Y/E Dec 2013E
Jaypee Infratech. CMP: INR33 TP: INR45 Buy
 BSE SENSEX S&P CNX 2,550,318 Bloomberg JPIN IN Equity Shares (m) 1,388.9 M.Cap. (INR b) / (USD b) 51.3/0.9 52-Week Range (INR) 2/1 1,, 12 Rel. Per (%) 1/9/-3 Financials & Valuation (INR m) Y/E Mar 201
Godrej Consumer Products
 BSE SENSEX S&P CNX 17,602 5,337 Bloomberg GCPL IN Equity Shares (m) 340.3 52-Week Range (INR) 658/370 1,6,12 Rel. Perf. (%) 5/37/42 M.Cap. (INR b) 205.9 M.Cap. (USD b) 3.7 7 August 2012 1QFY13 Results
Punjab National Bank. CMP: INR716 TP: INR950 Buy
 BSE SENSEX S&P CNX 16,839 5,100 Bloomberg PNB IN Equity Shares (m) 339.2 52-Week Range (INR) 1,144/703 1,6,12 Rel.Perf.(%) -8/-24/-28 M.Cap. (INR b) 242.8 M.Cap. (USD b) 4.4 30 July 2012 1QFY13 Results
BGR Energy. CMP: INR282 TP: INR253 Neutral
 BSE SENSEX S&P CNX 17,413 5,283 Bloomberg BGRL IN Equity Shares (m) 72.0 52-Week Range (INR) 378/173 1,6,12 Rel. Perf. (%) -9/17/-22 M.Cap. (INR b) 20.3 M.Cap. (USD b) 0.4 6 August 2012 1QFY13 Results
Unitech. CMP: INR20 TP: INR30 Buy
 BSE SENSEX S&P CNX 16,328 4,943 Bloomberg UT IN Equity Shares (m) 2,438.8 52-Week Range (INR) 38/17 1,6,12 Rel. Perf. (%) -25/-14/-34 M.Cap. (INR b) 48.8 M.Cap. (USD b) 0.9 16 May 2012 4QFY12 Results Update
BGR Energy. CMP: INR266 TP: INR230 Neutral
 BSE SENSEX S&P CNX 18,562 5,645 Bloomberg BGRL IN Equity Shares (m) 72.0 52-Week Range (INR) 374/173 1,6,12 Rel. Perf. (%) -3/27/-24 M.Cap. (INR b) 19.2 M.Cap. (USD b) 0.4 3 November 2012 2QFY13 Results
Idea Cellular. CMP: INR81 TP: INR Under Review
 BSE SENSEX S&P CNX 16,918 5,128 Bloomberg IDEA IN Equity Shares (m) 3,308.8 52-Week Range (INR) 104/71 1,6,12 Rel. Perf. (%) 6/-13/4 M.Cap. (INR b) 268.0 M.Cap. (USD b) 4.8 25 July 2012 1QFY13 Results
Just Dial. CMP: INR1,129 TP: INR1,475 Buy
 BSE SENSEX S&P CNX 23,871 7,109 Bloomberg JUST IN Equity Shares (m) 70.2 M.Cap. (INR b) / (USD b) 79.2/1.3 52-Week Range (INR) 1,774/589 1, 6, 12 Rel. Per (%) -18/-7/- Financials & Valuation (INR m) Y/E
Jinesh Gandhi Sandipan Pal
 BSE Sensex S&P CNX 20,224 6,157 Bloomberg BCORP IN Equity Shares (m) 77.0 M.Cap. (INR b)/(usd b) 20.5/0.4 52-Week Range (INR) 342/202 1,6,12 Rel. Perf. (%) 6/-15/-23 Financials & Valuation (INR b) Y/E
Larsen & Toubro. CMP: INR1,160 TP: INR1,417 Buy
 BSE SENSEX S&P CNX 16,216 4,908 Bloomberg LT IN Equity Shares (m) 608.9 52-Week Range (INR) 1,868/971 1,6,12 Rel. Perf. (%) -4/-7/12 M.Cap. (INR b) 706.3 M.Cap. (USD b) 13.1 * Consolidated; EPS is fully
Punjab National Bank. CMP:INR1,103 TP:INR1,500 Buy
 BSE SENSEX S&P CNX 18,210 5,488 28 July 2011 1QFY12 Results Update Sector: Banking Punjab National Bank CMP:INR1,103 TP:INR1,500 Buy Bloomberg PNB IN Equity Shares (m) 316.8 52-Week Range (INR) 1,395/971
Sandipan Pal QFY13 Results Update Sector: Real Estate Unitech CMP: INR29 TP: INR44 Buy
 BSE Sensex S&P CNX 19,608 5,933 Bloomberg UT IN Equity Shares (m) 2,438.8 M.Cap. (INR b)/(usd b) 70/1.3 52-Week Range (INR) 41/18 1,6,12 Rel. Perf. (%) -27/24/-13 Financials & Valuation (INR b) Y/E March
Individual Housing Loans: Rationalization of Risk-Weights and LTV Ratios
 8 October 2015 Sector Update Financials Individual Housing Loans: Rationalization of Risk-Weights and LTV Ratios Significant capital release for HFCs; Limited benefits for banks Event: RBI reduces risk
CMP: INR320 TP: INR164(-49%) Sell Intending to exit UK execution is key!
 Sell Intending to exit UK execution is key!") 31 March 2016 Update Sector: Metals Tata Steel BSE SENSEX S&P CNX 25,342 7,738 Stock Info Bloomberg TATA IN Equity Shares (m) 971.2 52-Week Range (INR) 384/200 1, 6, 12 Rel. Per (%) 18/54/10 M.Cap. (INR
31 March 2016 Update Sector: Metals Tata Steel BSE SENSEX S&P CNX 25,342 7,738 Stock Info Bloomberg TATA IN Equity Shares (m) 971.2 52-Week Range (INR) 384/200 1, 6, 12 Rel. Per (%) 18/54/10 M.Cap. (INR
Kotak Mahindra Bank. CMP: INR626 TP: INR500 Neutral
 BSE SENSEX S&P CNX 18,759 5,705 Bloomberg KMB IN Equity Shares (m) 740.7 52-Week Range (INR) 652/418 1,6,12 Rel.Perf.(%) -3/-2/18 M.Cap. (INR b) 463.4 M.Cap. (USD b) 8.6 26 October 2012 2QFY13 Results
BGR Energy. CMP: INR284 TP: INR296 Neutral
 BSE SENSEX S&P CNX 16,312 4,951 Bloomberg BGRL IN Equity Shares (m) 72.0 52-Week Range (INR) 512/173 1,6,12 Rel. Perf. (%) -8/8/-31 M.Cap. (INR b) 20.5 M.Cap. (USD b) 0.4 31 May 2012 4QFY12 Results Update
Market share recovery, price hike, content leverage to drive growth
 BSE Sensex S&P CNX 24,377 7,276 Stock Info Bloomberg DITV IN Equity Shares (m) 1,064.8 52-Week Range (INR) 71/40 1, 6, 12 Rel. Per (%) 6/-15/-41 M.Cap. (INR b) 58.2 M.Cap. (USD b) 1.0 Financial Snapshot
Kotak Mahindra Bank. CMP: INR495 TP: INR429 Neutral
 BSE SENSEX S&P CNX 16,739 5,049 Bloomberg KMB IN Equity Shares (m) 689.3 52-Week Range 515/333 1,6,12 Rel.Perf.(%) 0/12/31 M.Cap. (Rs b) 340.5 M.Cap. (US$ b) 6.7 25 January 2012 3QFY12 Results Update Sector:
Hardick Bora 4QCY12 Results Update Sector: Healthcare Sanofi India CMP: INR2,307 TP: INR2,015 Neutral
 BSE Sensex S&P CNX 19,332 5,855 Bloomberg SANL IN Equity Shares (m) 23.0 M.Cap. (INR b)/(usd b) 53.1/1.0 52-Week Range (INR) 2,450/2,002 1,6,12 Rel. Perf. (%) 9/-1/-4 Financials & Valuation (INR b) Y/E
ECOSCOPE. Real GDP growth eases on lower net indirect taxes. The Economy Observer. Real GVA growth exactly as expected
 31 August 2016 ECOSCOPE The Economy Observer Real GDP growth eases on lower net indirect taxes Real GVA growth exactly as expected India s real gross domestic product (GDP) grew at the slowest pace in
IDBI Bank. CMP: INR106 TP: INR121 Neutral
 BSE SENSEX S&P CNX 17,207 5,223 Bloomberg IDBI IN Equity Shares (m) 1,278.4 52-Week Range (INR) 154/77 1,6,12 Rel.Perf.(%) -1/0/-7 M.Cap. (INR b) 135.5 M.Cap. (USD b) 2.6 24 April 2012 4QFY12 Results Update
Sanofi India. CMP: INR2,200 TP: INR1,848 Neutral
 BSE SENSEX S&P CNX 16,846 5,110 Bloomberg SANL IN Equity Shares (m) 23.0 52-Week Range (INR) 2,430/1,980 1,6,12 Rel. Perf. (%) 3/-3/15 M.Cap. (INR b) 50.7 M.Cap. (USD b) 0.9 26 July 2012 2QCY12 Results
Canara Bank. CMP: INR464 TP: INR645 Buy
 BSE SENSEX S&P CNX 17,234 5,205 Bloomberg CBK IN Equity Shares (m) 443.0 52-Week Range (INR) 672/349 1,6, 12 Rel.Perf.(%) 22/2/-13 M.Cap. (INR b) 205.6 M.Cap. (USD b) 4.1 31 January 2012 3QFY12 Results
To voluntarily stop supplies to US
 BSE Sensex S&P CNX 26,272 7,831 24 July 2014 Update Sector: Healthcare Ipca Laboratories CMP: INR728 TP: INR930 Buy Stock Info Bloomberg IPCA IN Equity Shares (m) 126.2 52-Week Range (INR) 907/609 1, 6,
Reliance Infrastructure CMP: INR528
 BSE SENSEX S&P CNX 17,657 5,363 16 August 2012 1QFY13 Results Update Sector: Utilities Reliance Infrastructure CMP: INR528 Buy Bloomberg RELI IN Equity Shares (m) 267.5 52-Week Range (INR) 680/328 1,6,12
Hardick Bora 4QFY13 Results Update Sector: Healthcare Dr Reddy's Laboratories CMP: INR2,026 TP: INR2,375 Buy
 BSE Sensex S&P CNX 19,772 5,995 Bloomberg DRRD IN Equity Shares (m) 169.2 M.Cap. (INR b)/(usd b) 344/6.3 52-Week Range (INR) 2,151/1,528 1,6,12 Rel. Perf. (%) -2/9/0 Financials & Valuation (INR b) Y/E
Hardick Bora QFY13 Results Update Sector: Healthcare Lupin CMP: INR725 TP: INR851 Buy
 BSE Sensex S&P CNX 19,990 6,069 Bloomberg LPC IN Equity Shares (m) 447.6 M.Cap. (INR b)/(usd b) 324.5/6.0 52-Week Range (INR) 739/507 1,6,12 Rel. Perf. (%) 9/18/13 Financials & Valuation (INR b) Y/E March
Strides Arcolab. CMP: INR717 TP: INR829 Buy
 BSE SENSEX S&P CNX 17,144 5,200 Bloomberg STR IN Equity Shares (m) 57.7 52-Week Range (INR) 794/276 1,6,12 Rel. Perf. (%) -2/37/98 M.Cap. (INR b) 41.4 M.Cap. (USD b) 0.7 31 July 2012 2QCY12 Results Update
CMP: INR401 TP: INR516 Buy. * After ESOP charges; # Axon consolidated in December 2008
 19 October 2011 1QFY12 Results Update Sector: Technology BSE SENSEX S&P CNX 16,748 5,038 Bloomberg HCLT IN Equity Shares (m) 700.9 52-Week Range (INR) 528/360 1,6,12 Rel. Perf. (%) 4/-1/7 M.Cap. (INR b)
Petronet LNG. CMP: INR146 TP: INR205 Buy
 BSE SENSEX S&P CNX 17,236 5,229 Bloomberg PLNG IN Equity Shares (m) 750.0 52-Week Range (INR) 186/122 1,6,12 Rel. Perf. (%) 3/-11/-10 M.Cap. (INR b) 109.7 M.Cap. (USD b) 2.0 1 August 2012 1QFY13 Results
CMP: INR388 TP: INR465(+20%) Buy
 Buy") BSE SENSEX S&P CNX 30,858 9,504 29 June 2017 Update Sector: Technology Tech Mahindra CMP: INR388 TP: INR465(+20%) Buy Steeper-than-anticipated challenges at the start of the year Revenue headwinds to add
BSE SENSEX S&P CNX 30,858 9,504 29 June 2017 Update Sector: Technology Tech Mahindra CMP: INR388 TP: INR465(+20%) Buy Steeper-than-anticipated challenges at the start of the year Revenue headwinds to add
REPORT THREADBARE. New accounting standards from FY The ART of annual report analysis
 23 February 2015 ANNUAL New accounting standards from FY16-17 Financial reporting set for revamp with introduction of Ind-AS The Government has unveiled a roadmap to implement Ind-AS (equivalent IFRS standards)
Torrent Pharmaceuticals
 BSE SENSEX S&P CNX 21,338 6,339 Bloomberg TRP IN Equity Shares (m) 169.2 M.Cap. (INR b) / (USD b) 80.4/1.3 52-Week Range (INR) 535/324 1, 6, 12 Rel.Per (%) 4/12/32 Financials & Valuation (INR Million)
Cross service charges at INR m/quarter
 BSE SENSEX S&P CNX 19,636 5,940 Cummins India CMP: INR504 TP: INR585 Buy LHP products to be an important growth driver Cross service charges at INR100-200m/quarter 20 February 2013 Update Sector: Capital
Godrej Properties. CMP: INR368 TP: INR420 Neutral
 BSE SENSEX S&P CNX 21,034 6,252 Bloomberg GPL IN Equity Shares (m) 99.6 M.Cap. (INR b) / (USD b) 36.4/ 0.7 52-Week Range (INR) 641/340 1, 6, 12 Rel. Per (%) -1/-44/-47 Financials & Valuation (INR b) Y/E
Shoppers Stop. CMP: INR339 TP: INR355 Neutral
 BSE SENSEX S&P CNX 20,684 6,145 Bloomberg SHOP IN Equity Shares (m) 83.1 M.Cap. (INR b) / (USD b) 28.1/0.5 52-Week Range (INR) 494/331 1, 6, 12 Rel. Per (%) -7/-16/-28 Financials & Valuation (INR b) Y/E
CMP: INR121 TP: INR193 Buy
 BSE SENSEX S&P CNX 17,085 5,139 20 October 2011 2QFY12 Results Update Sector: Metals Hindustan Zinc CMP: INR121 TP: INR193 Buy Bloomberg HZ IN Equity Shares (m) 4,225.3 52-Week Range (INR) 155/109 1,6,12
Jinesh Gandhi Chirag Jain
 BSE Sensex S&P CNX 19,722 5,995 Bloomberg EIM IN Equity Shares (m) 27.0 M.Cap. (INR b)/(usd b) 88.1/1.6 52-Week Range (INR) 3,285/1,620 1,6,12 Rel. Perf. (%) 10/20/36 Financials & Valuation (INR b) Y/E
CMP: INR1,044 TP: INR970 (-7%) Neutral Sale of Healthcare business margin accretive
 Neutral Sale of Healthcare business margin accretive") BSE SENSEX S&P CNX 24,646 7,485 4 March 2016 Update Sector: Capital Goods Siemens CMP: INR1,044 TP: INR970 (-7%) Neutral Sale of Healthcare business margin accretive Stock Info Bloomberg SIEM IN Equity
BSE SENSEX S&P CNX 24,646 7,485 4 March 2016 Update Sector: Capital Goods Siemens CMP: INR1,044 TP: INR970 (-7%) Neutral Sale of Healthcare business margin accretive Stock Info Bloomberg SIEM IN Equity
CPCB-2: Important long-term driver
 BSE Sensex S&P CNX 20,860 6,217 19 December 2013 Update Sector: Capital Goods Cummins India CMP: INR461 TP: INR540 Buy Stock Info Bloomberg KKC IN Equity Shares (m) 277.2 52-Week Range (INR) 550/365 1,
Coal India CMP: INR348 TP: INR408 Buy
 BSE SENSEX S&P CNX 17,633 5,348 Bloomberg COAL IN Equity Shares (m) 6,316.4 52-Week Range (INR) 404/294 1,6,12 Rel. Perf. (%) -4/4/-15 M.Cap. (INR b) 2,198.1 M.Cap. (USD b) 39.7 14 August 2012 1QFY13 Results
Axis Bank. CMP: INR1,119 TP: INR1,330 Buy
 BSE SENSEX S&P CNX 18,714 5,687 Bloomberg AXSB IN Equity Shares (m) 413.2 52-Week Range (INR) 1,309/785 1,6,12 Rel.Perf.(%) 9/-16/-8 M.Cap. (INR b) 462.4 M.Cap. (USD b) 8.7 16 October 2012 2QFY13 Results
Stress test: Weak capital servicing ratios to drive pricing discipline
 Stress test: Weak capital servicing ratios to drive pricing discipline Operating performance near trough; expect gradual improvement 20 Update Cement Our analysis of a cross-section of cement companies
Expect capacity-led rerating; maintain Buy
 BSE SENSEX S&P CNX 27,238 8,400 Stock Info Bloomberg SRCM IN Equity Shares (m) 34.8 52-Week Range (INR) 18519/9350 1, 6, 12 Rel. Per (%) -2/-3/32 M.Cap. (INR b) 523.7 M.Cap. (USD b) 7.7 Avg Val, INRm 216.4
Larsen & Toubro. CMP: INR1,278 TP: INR1,380 Buy
 BSE SENSEX S&P CNX 16,786 5,050 Bloomberg LT IN Equity Shares (m) 608.9 52-Week Range (INR) 1,933/971 1,6,12 Rel. Perf. (%) 20/-19/-11 M.Cap. (INR b) 778.1 M.Cap. (USD b) 15.5 * Consolidated; EPS is fully
M&M Financial Services
 BSE SENSEX S&P CNX 18,793 5,717 Bloomberg MMFS IN Equity Shares (m) 102.7 52-Week Range (INR) 938/590 1,6,12 Rel.Perf.(%) 7/24/30 M.Cap. (INR b) 90.7 M.Cap. (USD b) 1.7 23 October 2012 2QFY13 Results Update
ONGC. CMP: INR402 TP: INR485 Buy
 BSE SENSEX S&P CNX 25,919 7,740 Bloomberg ONGC IN Equity Shares (m) 8,555.5 M.Cap. (INR b) / (USD b) 3,437.6/56.1 52-Week Range (INR) 472/234 1, 6, 12 Rel. Per (%) -4/19/11 Financials & Valuation (INR
Financial integrity intact; FDA resolution the key
 BSE Sensex S&P CNX 25,842 7,843 19 November 2015 Update Sector: Healthcare Dr. Reddy s Lab CMP: INR3,287 TP: INR4,000 (+22%) Buy Stock Info Bloomberg DRRD IN Equity Shares (m) 170.4 M.Cap. (INR b)/(usd
Axis Bank. CMP: INR1,008 TP: INR1,240 Buy
 BSE SENSEX S&P CNX 16,739 5,049 Bloomberg AXSB IN Equity Shares (m) 410.5 52-Week Range 1,461/785 1,6,12 Rel.Perf.(%) 11/-9/-9 M.Cap. (INR b) 413.8 M.Cap. (USD b) 8.2 20 January 2012 Results Update Sector:
Jaiprakash Associates
 BSE SENSEX S&P CNX 16,312 4,951 Bloomberg JPA IN Equity Shares (m) 2,126.5 52-Week Range (INR) 89/50 1,6,12 Rel. Perf. (%) -14/-4/-17 M.Cap. (INR b) 127.9 M.Cap. (USD b) 2.3 31 May 2012 4QFY12 Results
Jindal Steel & Power. CMP: INR274 TP: INR379 Buy
 BSE SENSEX S&P CNX 25,665 7,672 Bloomberg JSP IN Equity Shares (m) 914.9 M.Cap. (INR b) / (USD b) 250.9/4.1 52-Week Range (INR) 350/190 1, 6, 12 Rel. Per (%) -15/-14/3 Financials & Valuation (INR Billion)
Eicher Motors. CMP: INR9,281 TP: INR11,401 Buy
 BSE SENSEX S&P CNX 25,881 7,727 Bloomberg EIM IN Equity Shares (m) 27.1 M.Cap. (INR b) / (USD b) 251.5/4.1 52-Week Range (INR) 9,350/2,975 1, 6, 12 Rel. Per (%) 9/83/144 Financials & Valuation (INR Million)
Castrol India. CMP: INR407 TP: INR474 (+16%) Neutral
 Neutral") BSE SENSEX S&P CNX 23,089 7,019 Bloomberg CSTRL IN Equity Shares (m) 494.6 M.Cap. (INR b) / (USD b) 201/2.9 52-Week Range (INR) 518 / 370 1, 6, 12 Rel. Per (%) 3/3/6 Avg Val (INR m) 128 Free float (%)
BSE SENSEX S&P CNX 23,089 7,019 Bloomberg CSTRL IN Equity Shares (m) 494.6 M.Cap. (INR b) / (USD b) 201/2.9 52-Week Range (INR) 518 / 370 1, 6, 12 Rel. Per (%) 3/3/6 Avg Val (INR m) 128 Free float (%)
Hindalco. CMP: INR113 TP: INR151 Buy
 BSE SENSEX S&P CNX 18,817 5,724 Bloomberg HNDL IN Equity Shares (m) 1,990.0 52-Week Range (INR) 165/100 1,6,12 Rel. Perf. (%) -9/-18/-26 M.Cap. (INR b) 224.9 M.Cap. (USD b) 4.1 Consolidated 2QFY13 Results
City Union Bank BUY. 24 February 2016 INR82
 SECTOR: FINANCIAL STOCK INFO. BSE Sensex : 23410 BLOOMBERG CUBK:IN BUY S&P CNX : 7110 REUTERS CODE CTBK.NS Initiating Coverage INR82 (INR CR) Y/E MARCH FY16E FY17E FY18E We recommend 'BUY' on for a target
CMP: INR124 TP: INR172 Buy. Benefit of two major motorcycle launches not priced in. Improved industry outlook and recent launch success drive upgrades
 BSE Sensex S&P CNX 24,717 7,359 Stock Info Bloomberg TVSL IN Equity Shares (m) 475.1 52-Week Range (INR) 138/28 1, 6, 12 Rel. Per (%) 34/111/210 M.Cap. (INR b) 59.1 M.Cap. (USD b) 1.0 Financial Snapshot
Alpesh Mehta Sohail Halai
 BSE Sensex S&P CNX 19,664 5,969 Bloomberg IIB IN Equity Shares (m) 521.8 M. Cap. (INR b)/(usd b) 227/4.1 52-Week Range (INR) 441/242 1,6,12 Rel.Perf.(%) 3/15/52 Financials & Valuation (INR b) Y/E March
Punjab National Bank. CMP: INR940 TP: INR1,275 Buy
 BSE SENSEX S&P CNX 17,194 5,199 Bloomberg PNB IN Equity Shares (m) 316.8 52-Week Range (INR) 1,234/751 1,6,12 Rel.Perf.(%) 9/-10/-9 M.Cap. (INR b) 297.7 M.Cap. (USD b) 6.0 1 February 2012 3QFY12 Results
JSW Steel. CMP: INR670 TP: INR391 Sell Merger with JSW Ispat
 BSE SENSEX S&P CNX 17,384 5,254 Bloomberg JSTL IN Equity Shares (m) 223.1 52-Week Range (INR) 885/464 1,6,12 Rel. Perf. (%) -5/-12/-10 M.Cap. (INR b) 149.5 M.Cap. (USD b) 2.7 Valuation summary (INR b)
Jubilant Foodworks. CMP: INR1,051 TP: INR1,054 Neutral
 BSE SENSEX S&P CNX 16,420 4,966 Bloomberg JUBI IN Equity Shares (m) 63.5 52-Week Range (INR) 1,144/536 1,6,12 Rel. Perf. (%) -6/37/53 M.Cap. (INR b) 66.7 M.Cap. (USD b) 1.3 11 May 2012 4QFY12 Results Update
ECOSCOPE. 3QFY16 CAD/GDP corrects to 1.3% The Economy Observer. Balance of Payments. See surplus in 4Q and to remain low in FY17; INR to correct still
 3QFY16 CAD/GDP corrects to 1.3% See surplus in 4Q and to remain low in FY17; INR to correct still 21 March 216 ECOSCOPE The Economy Observer Balance of Payments 3QFY16 CAD/GDP at 1.3% and trade deficit
Cummins India. CMP: INR430 TP: INR462 Neutral
 BSE SENSEX S&P CNX 16,070 4,870 Bloomberg KKC IN Equity Shares (m) 277.2 52-Week Range (INR) 515/322 1,6,12 Rel. Perf. (%) -3/30/-4 M.Cap. (INR b) 119.2 M.Cap. (USD b) 2.2 17 May 2012 4QFY12 Results Update
Maruti Suzuki. CMP: INR1,395 TP: INR1,730 Buy
 BSE SENSEX S&P CNX 18,431 5,598 Bloomberg MSIL IN Diluted Equity Shares (m) 302.1 52-Week Range (INR) 1,498/906 1,6,12 Rel.Perf.(%) 5/-5/20 M.Cap. (INR b) 421.3 M.Cap. (USD b) 7.8 31 October 2012 2QFY13
Godawari Power & Ispat
 BSE SENSEX S&P CNX CMP: INR103 TP: INR185 Buy 17,077 5,158 Bloomberg GODPI IN Equity Shares (m) 31.8 52-Week Range (INR) 200/70 1,6,12 Rel. Perf. (%) 32/-31/-33 M.Cap. (INR b) 3.3 M.Cap. (USD m) 65.3 Consolidated
CMP: INR615 TP: INR755(+23%) Buy Nominee Gold has some new competition on the block
 Buy Nominee Gold has some new competition on the block") BSE SENSEX S&P CNX 25,653 7,861 16 May 2016 Update Sector: Fertilizers PI Industries CMP: INR615 TP: INR755(+23%) Buy Nominee Gold has some new competition on the block We recently interacted with the
BSE SENSEX S&P CNX 25,653 7,861 16 May 2016 Update Sector: Fertilizers PI Industries CMP: INR615 TP: INR755(+23%) Buy Nominee Gold has some new competition on the block We recently interacted with the
Godrej Consumer Products
 BSE SENSEX S&P CNX 18,755 5,698 Bloomberg GCPL IN Equity Shares (m) 340.3 52-Week Range (INR) 745/370 1,6,12 Rel. Perf. (%) 4/17/67 M.Cap. (INR b) 246.4 M.Cap. (USD b) 4.6 5 November 2012 2QFY13 Results
CMP: INR2,623 TP: INR2,875 (+10%) Neutral
 Neutral") 21 March 2017 Update Sector: Healthcare Dr Reddy s Labs BSE SENSEX S&P CNX 29,485 9,122 Bloomberg DRRD IN Equity Shares (m) 170.4 M.Cap.(INR b)/(usd b) 447.0 / 6.6 52-Week Range (INR) 3689 / 2602 1, 6,
21 March 2017 Update Sector: Healthcare Dr Reddy s Labs BSE SENSEX S&P CNX 29,485 9,122 Bloomberg DRRD IN Equity Shares (m) 170.4 M.Cap.(INR b)/(usd b) 447.0 / 6.6 52-Week Range (INR) 3689 / 2602 1, 6,
Oberoi Realty. CMP: INR240 TP: INR297 Buy
 BSE SENSEX S&P CNX 25,642 7,664 Bloomberg OBER IN Equity Shares (m) 328.2 M.Cap. (INR b) / (USD b) 78.8/1.3 52-Week Range (INR) 276/154 1, 6, 12 Rel. Per (%) -8/-7/-6 Financials & Valuation (INR m) Y/E
No significant jump in retail electronic payments post demonetization
 No significant jump in retail electronic payments post demonetization Confirms a considerable dent in consumer demand in 4Q2016 29 December 2016 ECOSCOPE The Economy Observer The government s attempts
CMP: INR475 TP: INR609 (+28%) Buy
 Buy") 10 April 2017 Update Sector: Automobiles Tata Motors BSE SENSEX S&P CNX 29,576 9,181 Stock Info Bloomberg TTMT IN Equity Shares (m) 3,395.9 52-Week Range (INR) 599 / 373 1, 6, 12 Rel. Per (%) -1/-21/8
10 April 2017 Update Sector: Automobiles Tata Motors BSE SENSEX S&P CNX 29,576 9,181 Stock Info Bloomberg TTMT IN Equity Shares (m) 3,395.9 52-Week Range (INR) 599 / 373 1, 6, 12 Rel. Per (%) -1/-21/8
CMP: INR826 TP: INR810 (-2%) Neutral
 Neutral") 8 December 2015 Update Sector: Consumer Hindustan Unilever BSE SENSEX S&P CNX 25,310 7,702 CMP: INR826 TP: INR810 (-2%) Neutral Maneuvering pricing in a deflationary environment Delayed winter a risk for
8 December 2015 Update Sector: Consumer Hindustan Unilever BSE SENSEX S&P CNX 25,310 7,702 CMP: INR826 TP: INR810 (-2%) Neutral Maneuvering pricing in a deflationary environment Delayed winter a risk for
Punjab National Bank. CMP: INR768 TP: INR963 Buy
 BSE SENSEX S&P CNX 16,480 4,975 Bloomberg PNB IN Equity Shares (m) 339.2 52-Week Range (INR) 1,200/751 1,6,12 Rel.Perf.(%) -12/-16/-18 M.Cap. (INR b) 260.5 M.Cap. (USD b) 4.8 10 May 2012 4QFY12 Results
PVR Ltd. CMP: INR685 TP: INR750 Buy
 BSE SENSEX S&P CNX 27,860 8,324 Bloomberg PVRL IN Equity Shares (m) 41.3 M.Cap. (INR b) / (USD b) 28.3/0.5 52-Week Range (INR) 747/465 1, 6, 12 Rel. Per (%) -6/9/-19 Financials & Valuation (INR Million)
Can Fin Homes BUY. 23 September 2015 INR821
 SECTOR: FINANCIAL Can Fin Homes STOCK INFO. BSE Sensex : 25590 BLOOMBERG CANF:IN BUY S&P CNX : 7812 REUTERS CODE CNFH.NS Re-Initiating Coverage INR821 Y/E MARCH FY15 FY16E (INR CR) FY17E We recommend 'BUY'
No major improvement in value proposition expected
 Sector Update 18 July 2017 Oil & Gas Motilal Oswal values your support in the Asiamoney Brokers Poll 2017 for India Research, Sales and Trading team. We request your ballot. Refer to our report on Oil
Shree Renuka Sugars. CMP: INR26 TP: INR45 Buy
 BSE SENSEX S&P CNX 16,219 4,924 1 June 2012 6QSY12 Results Update Sector: Sugar CMP: INR26 TP: INR45 Buy Bloomberg SHRS IN Equity Shares (m) 671.0 52-Week Range (INR) 76/23 1,6,12 Rel. Perf. (%) -10/-16/-45
Dabur India. CMP: INR130 TP: INR135 Neutral
 BSE SENSEX S&P CNX 18,625 5,664 29 October 2012 2QFY13 Results Update Sector: Consumer Dabur India CMP: INR130 TP: INR135 Neutral Bloomberg DABUR IN Equity Shares (m) 1,740.7 52-Week Range (Rs) 139/92
Dabur India. CMP: INR106 TP: INR94 Neutral
 28 July 2011 1QFY12 Results Update Sector: FMCG BSE SENSEX S&P CNX 18,210 5,488 Dabur India CMP: INR106 TP: INR94 Neutral Bloomberg DABUR IN Equity Shares (m) 1,740.0 52-Week Range (INR) 122/87 1,6,12
Oberoi Realty. CMP: INR264 TP: INR315 Buy
 BSE SENSEX S&P CNX 17,151 5,202 Bloomberg OBER IN Equity Shares (m) 328.2 52-Week Range (INR) 323/205 1,6,12 Rel. Perf. (%) 4/15/16 M.Cap. (INR b) 87.0 M.Cap. (USD b) 1.7 26 April 2012 4QFY12 Results Update
ULTRAMARINE & PIGMENTS LTD
 02 December 2016 ULTRAMARINE & PIGMENTS LTD CMP INR 170 Initiating Coverage (BUY) Target Price INR 226 Stock Details Industry SPECIALTY CHEMICALS Bloomberg Code UMP:IN BSE Code 506685 Face Value (Rs.)
Decent performance by the sector in a tough quarter
 Sector Update 17 February 2017 Cement MOSL Cement Universe volume (mt) trend Volume (mt) 3QFY17 YoY 5.5-9% 11.4-1% 1.7-11% 2.4 21% 4.9 3.6 20% 1.9-1.8 2.0 2 1.3 19% Volumes in Jan-17 revive to pre-demonetization
SHRIRAM TRANSPORT FINANCE COMPANY LTD
 27 June 2017 SHRIRAM TRANSPORT FINANCE COMPANY LTD CMP INR 975 Initiating Coverage (BUY) Target Price INR 1225 Stock Details Industry Finance (including NBFCs) Bloomberg Code SHTF:IN BSE Code 511218 Face