Jinesh Gandhi Sandipan Pal
|
|
|
- Rosemary Carmel Clarke
- 6 years ago
- Views:
Transcription
 6/-15/-23 Financials & Valuation (INR b) Y/E March 2013 2014E 2015E Sales 25.6 27.7 32.0 EBITDA 3.5 3.1 4.9 NP 2.7 2.3 3.6 Adj. EPS (INR) 35.0 30.0 47.3 EPS Gr. (%) 12.8-14.5 57.9 BV/Sh.")
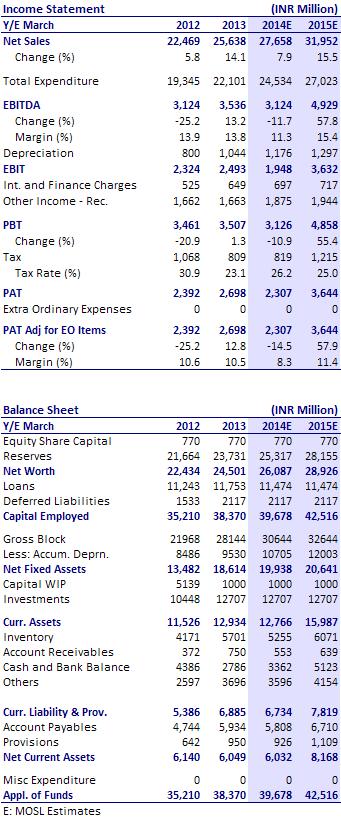
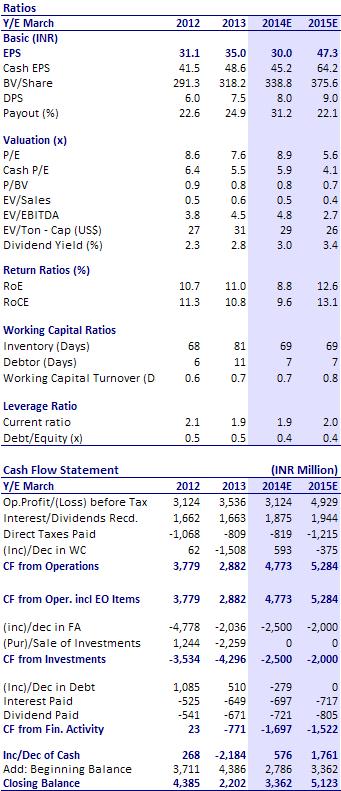
1 BSE Sensex S&P CNX 20,224 6,157 Bloomberg BCORP IN Equity Shares (m) 77.0 M.Cap. (INR b)/(usd b) 20.5/ Week Range (INR) 342/202 1,6,12 Rel. Perf. (%) 6/-15/-23 Financials & Valuation (INR b) Y/E March E 2015E Sales EBITDA NP Adj. EPS (INR) EPS Gr. (%) BV/Sh. (INR) RoE (%) RoCE (%) Payout (%) Valuations P/E (x) P/BV (x) EV/EBITDA (x) EV/Ton (x) May QFY13 Results Update Sector: Cement Birla Corporation CMP: INR266 TP: INR352 Buy Results below expectations: Birla Corporation's (BCORP) 3QFY13 performance was marginally below expectations. Net sales grew 2.4% YoY (8.7% QoQ) to INR6.7b (v/s our est. of INR6.8b) and EBITDA declined 17% YoY (29%QoQ) to INR663m (v/s our est. of INR706m). EBITDA margin expanded 1.6pp YoY (contracted 2.3pp QoQ) to 10%. Higher other income and lower interest cost resulted in PAT of INR726m (v/s our est. of INR433m). Cement volumes higher than expected: Cement volumes grew 4.6% YoY (9.1% QoQ) to 1.71m tons (v/s our est. of 1.61m tons). Growth in FY13 dispatch volumes was above par (on low base of FY12), despite ban on limestone mining at its Rajasthan (Chanderia) plant. Full-year volumes grew 8.5% to 6.47m tons, including 2.5m tons at Chanderia plant (78% utilization). Profitability lower than estimated: Realizations declined 0.9% YoY (4.5% QoQ) to INR3,581/ton (v/s our est. of INR3,959/ton). Cement revenue grew 3.7% YoY (4.2% QoQ). EBITDA/ton was INR507 (v/s our est. of INR606/ton, INR447/ ton in 3QFY13). Lower than expected profitability is attributable to sharp decline in realizations (INR8.5/bag QoQ), albeit partially offset by QoQ moderation in variable cost and positive operating leverage. Resolution of mining ban crucial: CBRI has sought further time for submitting report on the impact of mechanized mining at Chanderia on Chittorgarh Fort, with next hearing scheduled on July Resolution of mining ban is critical for future volume growth, capacity addition and normalization of profitability. Downgrading estimates; maintain Buy: We are downgrading our EPS estimates for FY14/15 by 15.7%/5.3% to INR30/INR47.3, to factor in for INR6/bag price decline in FY14 and INR15/bag improvement in FY15. The stock trades at 5.6x FY15E EPS, and EV of 2.7x FY15E EBITDA and USD26/ton. Maintain Buy, with a target price of INR352. The board has announced a dividend of ~INR7/share (including interim dividend of INR2.5/share) as against INR6/share last year. Jinesh Gandhi (Jinesh@MotilalOswal.com) Sandipan Pal (Sandipan.Pal@MotilalOswal.com);
 to 1.71m tons (v/s our estimate of 1.61m tons).")
. Cement realizations declined 0.9% YoY (4.5% QoQ) to INR3,581/ton (v/s our estimate of INR3,959/ton). Cement revenue grew 3.7% YoY (4.2% QoQ).")
 4QFY13 4QFY12 YoY (%) 3QFY13 QoQ (%) Cement 6,116 5,899 3.7 5,872 4.2 Contribution (%) 91.9 90.7 95.9 Jute 511 567-9.9 228 124.1 Contribution (%) 7.7 8.7 3.")
2 Trend in volumes and realizations Revenue in line, as higher volumes offset dip in realizations Net sales grew 2.4% YoY (8.7% QoQ) to INR6.7b (v/s our estimate of INR6.8b) in 4QFY13. Cement volumes grew 4.6% YoY (9.1% QoQ) to 1.71m tons (v/s our estimate of 1.61m tons). Growth in FY13 dispatch volumes was above par (on low base of FY12), despite ban on limestone mining at its Rajasthan (Chanderia) plant. Full-year volumes grew 8.5% to 6.47m tons, including 2.5m tons at Chanderia plant (78% utilization). Cement realizations declined 0.9% YoY (4.5% QoQ) to INR3,581/ton (v/s our estimate of INR3,959/ton). Cement revenue grew 3.7% YoY (4.2% QoQ). Non-cement business (jute and others) revenue declined 10% YoY but improved sequentially to INR541m. The jute mill at Birlapur resumed operations in mid- November Trend in revenue mix (INR m) 4QFY13 4QFY12 YoY (%) 3QFY13 QoQ (%) Cement 6,116 5, , Contribution (%) Jute Contribution (%) Others Contribution (%) Net sales 6,658 6, , Source: Company, MOSL Cost push moderates, yet realization decline dents profitability EBITDA margin expanded 1.6pp YoY (declined 2.3pp QoQ) to 10%. EBITDA declined 17% YoY (grew 29% QoQ) to INR663m (v/s our estimate of INR706m). Cement business EBITDA was INR507/ton (v/s our estimate of INR606/ton, INR447/ ton in 3QFY13 and INR678/ton in 4QFY12). Lower than expected profitability is attributable to sharp decline in cement realizations (INR8.5/bag QoQ), albeit partially offset by sequential moderation in variable cost and positive operating leverage. Higher other income and lower interest cost resulted in PAT of INR726m (v/s our estimate of INR433m). Purchase of clinker for Rajasthan plant (where limestone mining is banned) remains an overhang on RM cost. Trend in EBITDA Trend in cement EBITDA (INR/ton) 21 May
3 Trend in PBIT mix (INR M) 4QFY13 4QFY12 YoY (%) 3QFY13 QoQ (%) Cement Contribution (%) Jute Contribution (%) Others Contribution (%) Total Source: Company, MOSL Interim approval for mechanical mining at Rajasthan plant Operations at BCORP s Rajasthan plant (capacity: ~2m tons) have been impacted with effect from 27 August 2011 due to ban on mining within 10km of the Chittorgarh Fort. On 8 March 2013, the Supreme Court permitted mine operations using mechanical means without blasting for four weeks, during which period CBRI would carry out a study on the impact of mechanized mining at Chanderia on Chittorgarh Fort. CBRI has sought further time for submitting its report to the Supreme Court. The next hearing of this case is scheduled for July Resolution of the mining ban would be critical for future volume growth, capacity addition and normalization of profitability. Resolution of the mining ban would be critical for future volume growth and normalization of profitability. The company is prepared for brownfield expansion of 1.5m tons, with 50MW CPP at Chanderia, subject to the Supreme Court allowing mechanized mining. Our estimates factor in no resolution of the ban in the foreseeable future, resulting in higher RM cost. Downgrading EPS estimates, target price We are downgrading our EPS estimates for FY14/15 by 15.7%/5.3% to INR30/INR47.3, to factor in lower realization estimates. We factor in volume growth of 7%/8% for FY14/15. We now factor INR6/bag decline (v/s INR8/bag increase earlier) in FY14 and INR15/ bag improvement (v/s INR12.5/bag earlier) in FY15. This translates into 6% downgrade in target price to INR352 (v/s INR374 earlier). Revised Forecast (INR m) FY14E FY15E Rev Old Chg (%) Rev Old Chg (%) Net Sales 27,658 28, ,952 32, EBITDA 3,124 4, ,929 5, Net Profit 2,307 2, ,644 3, EPS (INR) Source: MOSL 21 May
4 Maintain Buy Favorable market mix (North, East and Central India) and efficient operations impart strong resilience to operating performance, if demand weakens further. Resolution of mining ban would be the key catalyst for the stock, as ~34% of its capacity is impacted by this ban. Its further capex plans are marred by ongoing litigation (~1.5m tons at Rajasthan due to mining ban; 3m tons plant at Satna awaiting mine allocation). We believe BCORP has the potential to drive strong operating performance (EBITDA/ton of over INR1,000 by FY15, adjusted for loss due to mining ban). Balance sheet remains strong, with net cash of INR5.2b. The stock trades at 5.6x FY15E EPS, and EV of 2.7x FY15E EBITDA and USD26/ton. Maintain Buy with a target price of INR352 (EV of ~4x FY15E EBITDA). 21 May
5 Birla Corporation: an investment profile Company description Birla Corporation (Bloomberg: BCORP), established in 1919, is part of the MP Birla group. It manufactures cement, jute products, synthetic viscose and cotton yarn. Cement constitutes about 85% of its revenue. It has cement plants in Rajasthan, Madhya Pradesh, Uttar Pradesh and West Bengal. Key investment arguments Among the key cement producers, with a capacity of 8.1m tons, having strong presence in North, East and Central India. Strong balance sheet, with zero net debt. Provides good platform to grow organically as well as inorganically. Recently added capacities to drive volume growth from FY13 onwards. Key investment risks Delay in capacity expansion would result in time and cost overruns, as well as muted volume growth. Increase in energy cost would impact profitability. Restoration of limestone mining at Rajasthan plant would be critical for improvement in profitability. Recent developments CBRI has sought further time for submitting its report on the impact of mechanized mining activity at Chanderia on Chittorgarh Fort. The next hearing of this case is scheduled for July The board has announced a dividend of ~INR7/share (including INR2.5/share of interim dividend) as against INR6/share, last year. Valuation and view The stock trades at 5.6x FY15E EPS, and at an EV of 2.7x FY15E EBITDA and USD26/ton. Maintain Buy with a target price of INR352 (EV of ~4x FY15E EBITDA). Sector view Unusual price weakness of 4QFY13 is expected to prevail in 1HFY14, as demand is expected to pick up only post monsoon. Structural increase in cost base (both capex and opex) would necessitate higher cement prices. Revival in cement demand would be the key catalyst for stock performance. Comparative valuations Birla JK Lakshmi Dalmia Bharat Corp Cement Cement P/E(x) FY14E FY15E P/BV(x) FY14E FY15E EV/Ton (USD) FY14E FY15E EV/EBITDA(x) FY14E FY15E EPS: MOSL forecast v/s consensus (INR) Most Consensus Variation Forecast Forecast (%) FY FY Target price and recommendation Current Target Upside Reco. Price (INR) Price (INR) (%) Buy Stock performance (1 year) Shareholding pattern (%) Mar-13 Dec-12 Mar-12 Promoter Domestic Inst Foreign Others May
6 Financials and Valuations 21 May
7 N O T E S 21 May
8 Disclosures This report is for personal information of the authorized recipient and does not construe to be any investment, legal or taxation advice to you. This research report does not constitute an offer, invitation or inducement to invest in securities or other investments and Motilal Oswal Securities Limited (hereinafter referred as MOSt) is not soliciting any action based upon it. This report is not for public distribution and has been furnished to you solely for your information and should not be reproduced or redistributed to any other person in any form. Unauthorized disclosure, use, dissemination or copying (either whole or partial) of this information, is prohibited. The person accessing this information specifically agrees to exempt MOSt or any of its affiliates or employees from, any and all responsibility/liability arising from such misuse and agrees not to hold MOSt or any of its affiliates or employees responsible for any such misuse and further agrees to hold MOSt or any of its affiliates or employees free and harmless from all losses, costs, damages, expenses that may be suffered by the person accessing this information due to any errors and delays. The information contained herein is based on publicly available data or other sources believed to be reliable. While we would endeavour to update the information herein on reasonable basis, MOSt and/or its affiliates are under no obligation to update the information. Also there may be regulatory, compliance, or other reasons that may prevent MOSt and/or its affiliates from doing so. MOSt or any of its affiliates or employees shall not be in any way responsible and liable for any loss or damage that may arise to any person from any inadvertent error in the information contained in this report. MOSt or any of its affiliates or employees do not provide, at any time, any express or implied warranty of any kind, regarding any matter pertaining to this report, including without limitation the implied warranties of merchantability, fitness for a particular purpose, and non-infringement. The recipients of this report should rely on their own investigations. This report is intended for distribution to institutional investors. Recipients who are not institutional investors should seek advice of their independent financial advisor prior to taking any investment decision based on this report or for any necessary explanation of its contents. MOSt and/or its affiliates and/or employees may have interests/positions, financial or otherwise in the securities mentioned in this report. To enhance transparency, MOSt has incorporated a Disclosure of Interest Statement in this document. This should, however, not be treated as endorsement of the views expressed in the report. Disclosure of Interest Statement Birla Corporation 1. Analyst ownership of the stock No 2. Group/Directors ownership of the stock Yes 3. Broking relationship with company covered No 4. Investment Banking relationship with company covered No Analyst Certification The views expressed in this research report accurately reflect the personal views of the analyst(s) about the subject securities or issues, and no part of the compensation of the research analyst(s) was, is, or will be directly or indirectly related to the specific recommendations and views expressed by research analyst(s) in this report. The research analysts, strategists, or research associates principally responsible for preparation of MOSt research receive compensation based upon various factors, including quality of research, investor client feedback, stock picking, competitive factors and firm revenues. Regional Disclosures (outside India) This report is not directed or intended for distribution to or use by any person or entity resident in a state, country or any jurisdiction, where such distribution, publication, availability or use would be contrary to law, regulation or which would subject MOSt & its group companies to registration or licensing requirements within such jurisdictions. For U.K. This report is intended for distribution only to persons having professional experience in matters relating to investments as described in Article 19 of the Financial Services and Markets Act 2000 (Financial Promotion) Order 2005 (referred to as "investment professionals"). This document must not be acted on or relied on by persons who are not investment professionals. Any investment or investment activity to which this document relates is only available to investment professionals and will be engaged in only with such persons. For U.S. Motilal Oswal Securities Limited (MOSL) is not a registered broker - dealer under the U.S. Securities Exchange Act of 1934, as amended (the"1934 act") and under applicable state laws in the United States. In addition MOSL is not a registered investment adviser under the U.S. Investment Advisers Act of 1940, as amended (the "Advisers Act" and together with the 1934 Act, the "Acts), and under applicable state laws in the United States. Accordingly, in the absence of specific exemption under the Acts, any brokerage and investment services provided by MOSL, including the products and services described herein are not available to or intended for U.S. persons. This report is intended for distribution only to "Major Institutional Investors" as defined by Rule 15a-6(b)(4) of the Exchange Act and interpretations thereof by SEC (henceforth referred to as "major institutional investors"). This document must not be acted on or relied on by persons who are not major institutional investors. Any investment or investment activity to which this document relates is only available to major institutional investors and will be engaged in only with major institutional investors. In reliance on the exemption from registration provided by Rule 15a-6 of the U.S. Securities Exchange Act of 1934, as amended (the "Exchange Act") and interpretations thereof by the U.S. Securities and Exchange Commission ("SEC") in order to conduct business with Institutional Investors based in the U.S., MOSL has entered into a chaperoning agreement with a U.S. registered broker-dealer, Motilal Oswal Securities International Private Limited. ("MOSIPL"). Any business interaction pursuant to this report will have to be executed within the provisions of this chaperoning agreement. The Research Analysts contributing to the report may not be registered /qualified as research analyst with FINRA. Such research analyst may not be associated persons of the U.S. registered broker-dealer, MOSIPL, and therefore, may not be subject to NASD rule 2711 and NYSE Rule 472 restrictions on communication with a subject company, public appearances and trading securities held by a research analyst account. For Singapore Motilal Oswal Capital Markets Singapore Pte Limited is acting as an exempt financial advisor under section 23(1)(f) of the Financial Advisers Act(FAA) read with regulation 17(1)(d) of the Financial Advisors Regulations and is a subsidiary of Motilal Oswal Securities Limited in India. This research is distributed in Singapore by Motilal Oswal Capital Markets Singapore Pte Limited and it is only directed in Singapore to accredited investors, as defined in the Financial Advisers Regulations and the Securities and Futures Act (Chapter 289), as amended from time to time. In respect of any matter arising from or in connection with the research you could contact the following representatives of Motilal Oswal Capital Markets Singapore Pte Limited: Nihar Oza Kadambari Balachandran niharoza.sg@motilaloswal.com kadambari.balachandran@motilaloswal.com Contact: (+65) Contact: (+65) / Office address: 21 (Suite 31), 16 Collyer Quay, Singapore Motilal Oswal Securities Ltd Motilal Oswal Tower, Level 9, Sayani Road, Prabhadevi, Mumbai Phone: reports@motilaloswal.com
Birla Corporation. CMP: INR216 TP: INR277 Buy
 BSE SENSEX S&P CNX 16,839 5,100 Bloomberg BCORP IN Equity Shares (m) 77.0 52-Week Range (INR) 348/211 1,6,12 Rel. Perf. (%) -5/-19/-25 M.Cap. (INR b) 16.6 M.Cap. (USD b) 0.3 30 July 2012 1QFY13 Results
Stress test: Weak capital servicing ratios to drive pricing discipline
 Stress test: Weak capital servicing ratios to drive pricing discipline Operating performance near trough; expect gradual improvement 20 Update Cement Our analysis of a cross-section of cement companies
Sanjay Jain Pavas Pethia
 BSE Sensex S&P CNX 19,561 5,923 Bloomberg SAIL IN Equity Shares (m) 4,130.4 M.Cap. (INR b)/(usd b) 334.6/6.2 52-Week Range (INR) 116/76 1,6,12 Rel. Perf. (%) -11/-17/-38 Financials & Valuation (INR b)
Hardick Bora
 BSE Sensex S&P CNX 19,990 6,069 Bloomberg JOL IN Equity Shares (m) 159.3 M.Cap. (INR b)/(usd b) 26.0/0.5 52-Week Range (INR) 248/154 1,6,12 Rel. Perf. (%) -18/-28/-34 Financials & Valuation (INR b) Y/E
CMP: INR350 TP: INR375 Downgrade to Neutral
 BSE Sensex S&P CNX 19,497 5,897 Bloomberg COAL IN Equity Shares (m) 6,316.4 M.Cap. (INR b)/(usd b) 2,211/41 52-Week Range (INR) 386/301 1,6,12 Rel. Perf. (%) 1/-11/-5 Financials & Valuation (INR b) Y/E
Sohail Halai Alpesh Mehta
 BSE Sensex S&P CNX 20,039 6,064 Bloomberg IDBI IN Equity Shares (m) 1,278.4 M.Cap. (INR b)/(usd b) 144.9/2.7 52-Week Range (INR) 122/82 1,6,12 Rel.Perf.(%) -1/6/2 Financials & Valuation (INR b) Y/E March
Niket Shah
 BSE Sensex S&P CNX 20,213 6,147 Bloomberg VGRD IN Equity Shares (m) 29.8 M.Cap. (INR b)/(usd b) 14.6/0.3 52-Week Range (INR) 591/180 1,6,12 Rel. Perf. (%) -8/-6/138 Financial summary (INR b) Y/E March
Jinesh Gandhi Chirag Jain
 BSE Sensex S&P CNX 19,561 5,923 Bloomberg EIM IN Equity Shares (m) 27.0 M.Cap. (INR b)/(usd b) 72.0/1.3 52-Week Range 3,240/1,620 1,6,12 Rel. Perf. (%) -4/17/40 Financials & Valuation (INR b) Y/E Dec 2013E
Sandipan Pal QFY13 Results Update Sector: Real Estate Unitech CMP: INR29 TP: INR44 Buy
 BSE Sensex S&P CNX 19,608 5,933 Bloomberg UT IN Equity Shares (m) 2,438.8 M.Cap. (INR b)/(usd b) 70/1.3 52-Week Range (INR) 41/18 1,6,12 Rel. Perf. (%) -27/24/-13 Financials & Valuation (INR b) Y/E March
Jinesh Gandhi Sandipan Pal
 BSE Sensex S&P CNX 19,576 5,944 Bloomberg GRASIM IN Equity Shares (m) 91.7 M.Cap. (INR b)/(usd b) 270.6/5.0 52-Week Range (INR) 3,511/2,216 1,6,12 Rel. Perf. (%) 2/-17/5 Financials & Valuation (INR b)
Jinesh Gandhi Sandipan Pal
 BSE Sensex S&P CNX 19,895 6,035 Bloomberg GRASIM IN Equity Shares (m) 91.7 M.Cap. (INR b)/(usd b) 275.8/5.2 52-Week Range (INR) 3,511/2,216 1,6,12 Rel. Perf. (%) -8/-12/-1 Financials & Valuation (INR b)
NTPC CMP: INR169 TP: INR191 Buy
 BSE SENSEX S&P CNX 18,625 5,664 Bloomberg NTPC IN Equity Shares (m) 8,245.5 52-Week Range (INR) 190/139 1,6,12 Rel. Perf. (%) 3/-4/-11 M.Cap. (INR b) 1,393.5 M.Cap. (USD b) 26.0 26 October 2012 2QFY13
Siddharth Bothra
 BSE Sensex S&P CNX 19,152 5,797 Bloomberg CSTRL IN Equity Shares (m) 494.6 M.Cap. (INR b)/(usd b) 158/2.9 52-Week Range (INR) 338/223 1,6,12 Rel. Perf. (%) 12/-3/26 Financials & Valuation (INR b) Y/E March
Pidilite Industries. CMP: INR164 TP: INR186 Buy
 BSE SENSEX S&P CNX 16,640 5,043 Bloomberg PIDI IN Equity Shares (m) 506.1 52-Week Range (INR) 188/134 1,6,12 Rel. Perf. (%) 1/20/5 M.Cap. (INR b) 83.0 M.Cap. (USD b) 1.5 27 July 2012 1QFY13 Results Update
Unitech. CMP: INR20 TP: INR30 Buy
 BSE SENSEX S&P CNX 16,328 4,943 Bloomberg UT IN Equity Shares (m) 2,438.8 52-Week Range (INR) 38/17 1,6,12 Rel. Perf. (%) -25/-14/-34 M.Cap. (INR b) 48.8 M.Cap. (USD b) 0.9 16 May 2012 4QFY12 Results Update
Jubilant Foodworks. CMP: INR1,189 TP: INR1,0541,054 Neutral
 BSE SENSEX S&P CNX 16,846 5,110 Bloomberg JUBI IN Equity Shares (m) 63.5 52-Week Range (INR) 1,189/633 1,6,12 Rel. Perf. (%) 4/38/47 M.Cap. (INR b) 75.5 M.Cap. (USD b) 1.3 26 July 2012 1QFY13 Results Update
Idea Cellular. CMP: INR159 TP: INR200 Buy
 BSE SENSEX S&P CNX 19,164 5,678 Bloomberg IDEA IN Equity Shares (m) 3,316.2 M.Cap. (INR b) / (USD b) 513.7/8.4 52-Week Range (INR) 176/72 1, 6, 12 Rel. Per (%) 12/45/83 Financials & Valuation (INR Billion)
Hardick Bora 4QCY12 Results Update Sector: Healthcare Sanofi India CMP: INR2,307 TP: INR2,015 Neutral
 BSE Sensex S&P CNX 19,332 5,855 Bloomberg SANL IN Equity Shares (m) 23.0 M.Cap. (INR b)/(usd b) 53.1/1.0 52-Week Range (INR) 2,450/2,002 1,6,12 Rel. Perf. (%) 9/-1/-4 Financials & Valuation (INR b) Y/E
CMP: INR121 TP: INR193 Buy
 BSE SENSEX S&P CNX 17,085 5,139 20 October 2011 2QFY12 Results Update Sector: Metals Hindustan Zinc CMP: INR121 TP: INR193 Buy Bloomberg HZ IN Equity Shares (m) 4,225.3 52-Week Range (INR) 155/109 1,6,12
Canara Bank. CMP: INR419 TP: INR525 Buy
 BSE SENSEX S&P CNX 18,817 5,724 Bloomberg CBK IN Equity Shares (m) 443.0 52-Week Range (INR) 566/349 1,6, 12 Rel.Perf.(%) -7/-18/-17 M.Cap. (INR b) 170.3 M.Cap. (USD b) 3.0 7 November 2012 2QFY13 Results
Jinesh Gandhi Chirag Jain
 BSE Sensex S&P CNX 19,722 5,995 Bloomberg EIM IN Equity Shares (m) 27.0 M.Cap. (INR b)/(usd b) 88.1/1.6 52-Week Range (INR) 3,285/1,620 1,6,12 Rel. Perf. (%) 10/20/36 Financials & Valuation (INR b) Y/E
BGR Energy. CMP: INR282 TP: INR253 Neutral
 BSE SENSEX S&P CNX 17,413 5,283 Bloomberg BGRL IN Equity Shares (m) 72.0 52-Week Range (INR) 378/173 1,6,12 Rel. Perf. (%) -9/17/-22 M.Cap. (INR b) 20.3 M.Cap. (USD b) 0.4 6 August 2012 1QFY13 Results
Titan Industries. CMP: INR222 TP: INR220 Neutral
 BSE SENSEX S&P CNX 17,257 5,241 Bloomberg TTAN IN Equity Shares (m) 887.8 52-Week Range (INR) 255/154 1,6,12 Rel. Perf. (%) -1/13/3 M.Cap. (Rs b) 197.1 M.Cap. (US$ b) 3.6 2 August 2012 1QFY13 Results Update
Jaypee Infratech. CMP: INR33 TP: INR45 Buy
 BSE SENSEX S&P CNX 2,550,318 Bloomberg JPIN IN Equity Shares (m) 1,388.9 M.Cap. (INR b) / (USD b) 51.3/0.9 52-Week Range (INR) 2/1 1,, 12 Rel. Per (%) 1/9/-3 Financials & Valuation (INR m) Y/E Mar 201
Idea Cellular. CMP: INR81 TP: INR Under Review
 BSE SENSEX S&P CNX 16,918 5,128 Bloomberg IDEA IN Equity Shares (m) 3,308.8 52-Week Range (INR) 104/71 1,6,12 Rel. Perf. (%) 6/-13/4 M.Cap. (INR b) 268.0 M.Cap. (USD b) 4.8 25 July 2012 1QFY13 Results
Reliance Infrastructure CMP: INR528
 BSE SENSEX S&P CNX 17,657 5,363 16 August 2012 1QFY13 Results Update Sector: Utilities Reliance Infrastructure CMP: INR528 Buy Bloomberg RELI IN Equity Shares (m) 267.5 52-Week Range (INR) 680/328 1,6,12
Coal India CMP: INR348 TP: INR408 Buy
 BSE SENSEX S&P CNX 17,633 5,348 Bloomberg COAL IN Equity Shares (m) 6,316.4 52-Week Range (INR) 404/294 1,6,12 Rel. Perf. (%) -4/4/-15 M.Cap. (INR b) 2,198.1 M.Cap. (USD b) 39.7 14 August 2012 1QFY13 Results
Asian Paints. CMP: INR2,722 TP: INR3,161 Buy
 BSE SENSEX S&P CNX 16,739 5,049 Bloomberg APNT IN Equity Shares (m) 95.9 52-Week Range (INR) 3,366/2,395 1,6,12 Rel. Perf. (%) -5/-3/14 M.Cap. (INR b) 261.1 M.Cap. (USD b) 4.9 23 January 2012 3QFY12 Results
Birla Corporation. CMP: INR484 TP: INR590 (+22%) Buy
 Buy") BSE SENSEX S&P CNX 28,851 8,712 Bloomberg BCORP IN Equity Shares (m) 77.0 M.Cap. (INR b) / (USD b) 37.3/0.6 52-Week Range (INR) 615/226 1, 6, 12 Rel. Per (%) 1/5/64 Avg Val (INRm)/Vol 000 34/72 Free float
BSE SENSEX S&P CNX 28,851 8,712 Bloomberg BCORP IN Equity Shares (m) 77.0 M.Cap. (INR b) / (USD b) 37.3/0.6 52-Week Range (INR) 615/226 1, 6, 12 Rel. Per (%) 1/5/64 Avg Val (INRm)/Vol 000 34/72 Free float
Sanofi India. CMP: INR2,200 TP: INR1,848 Neutral
 BSE SENSEX S&P CNX 16,846 5,110 Bloomberg SANL IN Equity Shares (m) 23.0 52-Week Range (INR) 2,430/1,980 1,6,12 Rel. Perf. (%) 3/-3/15 M.Cap. (INR b) 50.7 M.Cap. (USD b) 0.9 26 July 2012 2QCY12 Results
BGR Energy. CMP: INR266 TP: INR230 Neutral
 BSE SENSEX S&P CNX 18,562 5,645 Bloomberg BGRL IN Equity Shares (m) 72.0 52-Week Range (INR) 374/173 1,6,12 Rel. Perf. (%) -3/27/-24 M.Cap. (INR b) 19.2 M.Cap. (USD b) 0.4 3 November 2012 2QFY13 Results
Petronet LNG. CMP: INR146 TP: INR205 Buy
 BSE SENSEX S&P CNX 17,236 5,229 Bloomberg PLNG IN Equity Shares (m) 750.0 52-Week Range (INR) 186/122 1,6,12 Rel. Perf. (%) 3/-11/-10 M.Cap. (INR b) 109.7 M.Cap. (USD b) 2.0 1 August 2012 1QFY13 Results
IndusInd Bank. CMP: INR345 TP: INR419 Buy
 BSE SENSEX S&P CNX 17,504 5,332 Bloomberg IIB IN Equity Shares (m) 467.7 52-Week Range (INR) 352/222 1,6,12 Rel.Perf.(%) 13/25/34 M.Cap. (INR b) 161.4 M.Cap. (USD b) 3.1 20 April 2012 4QFY12 Results Update
Larsen & Toubro. CMP: INR1,160 TP: INR1,417 Buy
 BSE SENSEX S&P CNX 16,216 4,908 Bloomberg LT IN Equity Shares (m) 608.9 52-Week Range (INR) 1,868/971 1,6,12 Rel. Perf. (%) -4/-7/12 M.Cap. (INR b) 706.3 M.Cap. (USD b) 13.1 * Consolidated; EPS is fully
BGR Energy. CMP: INR284 TP: INR296 Neutral
 BSE SENSEX S&P CNX 16,312 4,951 Bloomberg BGRL IN Equity Shares (m) 72.0 52-Week Range (INR) 512/173 1,6,12 Rel. Perf. (%) -8/8/-31 M.Cap. (INR b) 20.5 M.Cap. (USD b) 0.4 31 May 2012 4QFY12 Results Update
Jaiprakash Associates
 BSE SENSEX S&P CNX 16,312 4,951 Bloomberg JPA IN Equity Shares (m) 2,126.5 52-Week Range (INR) 89/50 1,6,12 Rel. Perf. (%) -14/-4/-17 M.Cap. (INR b) 127.9 M.Cap. (USD b) 2.3 31 May 2012 4QFY12 Results
Market share recovery, price hike, content leverage to drive growth
 BSE Sensex S&P CNX 24,377 7,276 Stock Info Bloomberg DITV IN Equity Shares (m) 1,064.8 52-Week Range (INR) 71/40 1, 6, 12 Rel. Per (%) 6/-15/-41 M.Cap. (INR b) 58.2 M.Cap. (USD b) 1.0 Financial Snapshot
Alpesh Mehta Sohail Halai
 BSE Sensex S&P CNX 19,664 5,969 Bloomberg IIB IN Equity Shares (m) 521.8 M. Cap. (INR b)/(usd b) 227/4.1 52-Week Range (INR) 441/242 1,6,12 Rel.Perf.(%) 3/15/52 Financials & Valuation (INR b) Y/E March
Hardick Bora QFY13 Results Update Sector: Healthcare Lupin CMP: INR725 TP: INR851 Buy
 BSE Sensex S&P CNX 19,990 6,069 Bloomberg LPC IN Equity Shares (m) 447.6 M.Cap. (INR b)/(usd b) 324.5/6.0 52-Week Range (INR) 739/507 1,6,12 Rel. Perf. (%) 9/18/13 Financials & Valuation (INR b) Y/E March
Godrej Consumer Products
 BSE SENSEX S&P CNX 17,602 5,337 Bloomberg GCPL IN Equity Shares (m) 340.3 52-Week Range (INR) 658/370 1,6,12 Rel. Perf. (%) 5/37/42 M.Cap. (INR b) 205.9 M.Cap. (USD b) 3.7 7 August 2012 1QFY13 Results
Hardick Bora 4QFY13 Results Update Sector: Healthcare Dr Reddy's Laboratories CMP: INR2,026 TP: INR2,375 Buy
 BSE Sensex S&P CNX 19,772 5,995 Bloomberg DRRD IN Equity Shares (m) 169.2 M.Cap. (INR b)/(usd b) 344/6.3 52-Week Range (INR) 2,151/1,528 1,6,12 Rel. Perf. (%) -2/9/0 Financials & Valuation (INR b) Y/E
Punjab National Bank. CMP: INR716 TP: INR950 Buy
 BSE SENSEX S&P CNX 16,839 5,100 Bloomberg PNB IN Equity Shares (m) 339.2 52-Week Range (INR) 1,144/703 1,6,12 Rel.Perf.(%) -8/-24/-28 M.Cap. (INR b) 242.8 M.Cap. (USD b) 4.4 30 July 2012 1QFY13 Results
Godrej Properties. CMP: INR368 TP: INR420 Neutral
 BSE SENSEX S&P CNX 21,034 6,252 Bloomberg GPL IN Equity Shares (m) 99.6 M.Cap. (INR b) / (USD b) 36.4/ 0.7 52-Week Range (INR) 641/340 1, 6, 12 Rel. Per (%) -1/-44/-47 Financials & Valuation (INR b) Y/E
Cross service charges at INR m/quarter
 BSE SENSEX S&P CNX 19,636 5,940 Cummins India CMP: INR504 TP: INR585 Buy LHP products to be an important growth driver Cross service charges at INR100-200m/quarter 20 February 2013 Update Sector: Capital
Godawari Power & Ispat
 BSE SENSEX S&P CNX CMP: INR103 TP: INR185 Buy 17,077 5,158 Bloomberg GODPI IN Equity Shares (m) 31.8 52-Week Range (INR) 200/70 1,6,12 Rel. Perf. (%) 32/-31/-33 M.Cap. (INR b) 3.3 M.Cap. (USD m) 65.3 Consolidated
Urban demand revives; Akzo gaining market share
 BSE Sensex S&P CNX 22,095 6,601 CMP: INR889 26 March 2014 Update Sector: Consumer Not Rated Urban demand revives; Akzo gaining market share Reiterates focus on Profitable growth Urban demand for Decorative
Hindalco. CMP: INR113 TP: INR151 Buy
 BSE SENSEX S&P CNX 18,817 5,724 Bloomberg HNDL IN Equity Shares (m) 1,990.0 52-Week Range (INR) 165/100 1,6,12 Rel. Perf. (%) -9/-18/-26 M.Cap. (INR b) 224.9 M.Cap. (USD b) 4.1 Consolidated 2QFY13 Results
Shree Renuka Sugars. CMP: INR26 TP: INR45 Buy
 BSE SENSEX S&P CNX 16,219 4,924 1 June 2012 6QSY12 Results Update Sector: Sugar CMP: INR26 TP: INR45 Buy Bloomberg SHRS IN Equity Shares (m) 671.0 52-Week Range (INR) 76/23 1,6,12 Rel. Perf. (%) -10/-16/-45
JSW Steel. CMP: INR670 TP: INR391 Sell Merger with JSW Ispat
 BSE SENSEX S&P CNX 17,384 5,254 Bloomberg JSTL IN Equity Shares (m) 223.1 52-Week Range (INR) 885/464 1,6,12 Rel. Perf. (%) -5/-12/-10 M.Cap. (INR b) 149.5 M.Cap. (USD b) 2.7 Valuation summary (INR b)
Amara Raja Batteries. CMP: INR517 TP: INR560 Buy
 BSE SENSEX S&P CNX 25,665 7,672 Bloomberg AMRJ IN Equity Shares (m) 170.8 M.Cap. (INR b) / (USD b) 88.2/1.4 52-Week Range (INR) 520/208 1, 6, 12 Rel. Per (%) 5/21/97 Financials & Valuation (INR Million)
Canara Bank. CMP: INR464 TP: INR645 Buy
 BSE SENSEX S&P CNX 17,234 5,205 Bloomberg CBK IN Equity Shares (m) 443.0 52-Week Range (INR) 672/349 1,6, 12 Rel.Perf.(%) 22/2/-13 M.Cap. (INR b) 205.6 M.Cap. (USD b) 4.1 31 January 2012 3QFY12 Results
Punjab National Bank. CMP:INR1,103 TP:INR1,500 Buy
 BSE SENSEX S&P CNX 18,210 5,488 28 July 2011 1QFY12 Results Update Sector: Banking Punjab National Bank CMP:INR1,103 TP:INR1,500 Buy Bloomberg PNB IN Equity Shares (m) 316.8 52-Week Range (INR) 1,395/971
Steel Authority of India
 BSE SENSEX S&P CNX 16,439 4,990 4QFY12 Results Update Sector: Metals Steel Authority of India CMP: INR93 TP: INR99 Sell Bloomberg SAIL IN Equity Shares (m) 4,130.4 52-Week Range (INR) 151/73 1,6,12 Rel.
IDBI Bank. CMP: INR106 TP: INR121 Neutral
 BSE SENSEX S&P CNX 17,207 5,223 Bloomberg IDBI IN Equity Shares (m) 1,278.4 52-Week Range (INR) 154/77 1,6,12 Rel.Perf.(%) -1/0/-7 M.Cap. (INR b) 135.5 M.Cap. (USD b) 2.6 24 April 2012 4QFY12 Results Update
Shoppers Stop. CMP: INR339 TP: INR355 Neutral
 BSE SENSEX S&P CNX 20,684 6,145 Bloomberg SHOP IN Equity Shares (m) 83.1 M.Cap. (INR b) / (USD b) 28.1/0.5 52-Week Range (INR) 494/331 1, 6, 12 Rel. Per (%) -7/-16/-28 Financials & Valuation (INR b) Y/E
Maruti Suzuki. CMP: INR1,395 TP: INR1,730 Buy
 BSE SENSEX S&P CNX 18,431 5,598 Bloomberg MSIL IN Diluted Equity Shares (m) 302.1 52-Week Range (INR) 1,498/906 1,6,12 Rel.Perf.(%) 5/-5/20 M.Cap. (INR b) 421.3 M.Cap. (USD b) 7.8 31 October 2012 2QFY13
Larsen & Toubro. CMP: INR1,278 TP: INR1,380 Buy
 BSE SENSEX S&P CNX 16,786 5,050 Bloomberg LT IN Equity Shares (m) 608.9 52-Week Range (INR) 1,933/971 1,6,12 Rel. Perf. (%) 20/-19/-11 M.Cap. (INR b) 778.1 M.Cap. (USD b) 15.5 * Consolidated; EPS is fully
Just Dial. CMP: INR1,129 TP: INR1,475 Buy
 BSE SENSEX S&P CNX 23,871 7,109 Bloomberg JUST IN Equity Shares (m) 70.2 M.Cap. (INR b) / (USD b) 79.2/1.3 52-Week Range (INR) 1,774/589 1, 6, 12 Rel. Per (%) -18/-7/- Financials & Valuation (INR m) Y/E
Torrent Pharmaceuticals
 BSE SENSEX S&P CNX 21,338 6,339 Bloomberg TRP IN Equity Shares (m) 169.2 M.Cap. (INR b) / (USD b) 80.4/1.3 52-Week Range (INR) 535/324 1, 6, 12 Rel.Per (%) 4/12/32 Financials & Valuation (INR Million)
M&M Financial Services
 BSE SENSEX S&P CNX 18,793 5,717 Bloomberg MMFS IN Equity Shares (m) 102.7 52-Week Range (INR) 938/590 1,6,12 Rel.Perf.(%) 7/24/30 M.Cap. (INR b) 90.7 M.Cap. (USD b) 1.7 23 October 2012 2QFY13 Results Update
Jubilant Foodworks. CMP: INR1,051 TP: INR1,054 Neutral
 BSE SENSEX S&P CNX 16,420 4,966 Bloomberg JUBI IN Equity Shares (m) 63.5 52-Week Range (INR) 1,144/536 1,6,12 Rel. Perf. (%) -6/37/53 M.Cap. (INR b) 66.7 M.Cap. (USD b) 1.3 11 May 2012 4QFY12 Results Update
Kotak Mahindra Bank. CMP: INR495 TP: INR429 Neutral
 BSE SENSEX S&P CNX 16,739 5,049 Bloomberg KMB IN Equity Shares (m) 689.3 52-Week Range 515/333 1,6,12 Rel.Perf.(%) 0/12/31 M.Cap. (Rs b) 340.5 M.Cap. (US$ b) 6.7 25 January 2012 3QFY12 Results Update Sector:
Gautam Duggad Sreekanth P V S
 BSE Sensex S&P CNX 19,990 6,069 Bloomberg FRL IN Equity Shares (m) 217.1 M.Cap. (INR b)/(usd b) 33.4/0.6 52-Week Range (INR) 276/127 1,6,12 Rel. Perf. (%) -10/-32/-20 Financials & Valuation (INR b) Y/E
CPCB-2: Important long-term driver
 BSE Sensex S&P CNX 20,860 6,217 19 December 2013 Update Sector: Capital Goods Cummins India CMP: INR461 TP: INR540 Buy Stock Info Bloomberg KKC IN Equity Shares (m) 277.2 52-Week Range (INR) 550/365 1,
Monnet Ispat. CMP: INR449 TP: INR518 Neutral
 4QFY12 Results Update Sector: Metals Monnet Ispat BSE SENSEX S&P CNX 16,328 4,943 CMP: INR449 TP: INR518 Neutral Bloomberg MISP IN Equity Shares (m) 64.4 52-Week Range (INR) 561/305 1,6,12 Rel. Perf. (%)
Cement. Demand to grow 8%, with cost push to be passed on CCI probe to have limited impact
 15 May 2012 Update Cement Demand to grow 8%, with cost push to be passed on CCI probe to have limited impact We met with senior managements of the large cement companies in India, to get perspective on
Kotak Mahindra Bank. CMP: INR626 TP: INR500 Neutral
 BSE SENSEX S&P CNX 18,759 5,705 Bloomberg KMB IN Equity Shares (m) 740.7 52-Week Range (INR) 652/418 1,6,12 Rel.Perf.(%) -3/-2/18 M.Cap. (INR b) 463.4 M.Cap. (USD b) 8.6 26 October 2012 2QFY13 Results
Strides Arcolab. CMP: INR717 TP: INR829 Buy
 BSE SENSEX S&P CNX 17,144 5,200 Bloomberg STR IN Equity Shares (m) 57.7 52-Week Range (INR) 794/276 1,6,12 Rel. Perf. (%) -2/37/98 M.Cap. (INR b) 41.4 M.Cap. (USD b) 0.7 31 July 2012 2QCY12 Results Update
India Cements. CMP: INR107 TP: INR113 (+6%) Neutral
 Neutral") BSE SENSEX S&P CNX 28,805 8,712 Bloomberg ICEM IN Equity Shares (m) 307.2 M.Cap. (INR b) / (USD b) 32.8/0.5 52-Week Range (INR) 134/48 1, 6, 12 Rel. Per (%) 19/-14/68 Avg Val,INRm/Vol 000 291/2988 Free
BSE SENSEX S&P CNX 28,805 8,712 Bloomberg ICEM IN Equity Shares (m) 307.2 M.Cap. (INR b) / (USD b) 32.8/0.5 52-Week Range (INR) 134/48 1, 6, 12 Rel. Per (%) 19/-14/68 Avg Val,INRm/Vol 000 291/2988 Free
Automobiles. HMSI s expansion could result in short-term pressure on HMCL and BJAUT
 Sector Update Automobiles HMSI s expansion could result in short-term pressure on HMCL and BJAUT Valuations reasonable, but demand recovery key for stock performance Honda Motorcycle and Scooter India
CMP: INR415 TP: INR 471 BUY
 04 Mar 2013 Update Sector: Technology Wipro CMP: INR415 TP: INR 471 BUY Pipeline and deal signings suggest improvement in growth; Multiple levers and focus on productivity will cushion margin headwinds
Oberoi Realty. CMP: INR240 TP: INR297 Buy
 BSE SENSEX S&P CNX 25,642 7,664 Bloomberg OBER IN Equity Shares (m) 328.2 M.Cap. (INR b) / (USD b) 78.8/1.3 52-Week Range (INR) 276/154 1, 6, 12 Rel. Per (%) -8/-7/-6 Financials & Valuation (INR m) Y/E
CMP: INR320 TP: INR164(-49%) Sell Intending to exit UK execution is key!
 Sell Intending to exit UK execution is key!") 31 March 2016 Update Sector: Metals Tata Steel BSE SENSEX S&P CNX 25,342 7,738 Stock Info Bloomberg TATA IN Equity Shares (m) 971.2 52-Week Range (INR) 384/200 1, 6, 12 Rel. Per (%) 18/54/10 M.Cap. (INR
31 March 2016 Update Sector: Metals Tata Steel BSE SENSEX S&P CNX 25,342 7,738 Stock Info Bloomberg TATA IN Equity Shares (m) 971.2 52-Week Range (INR) 384/200 1, 6, 12 Rel. Per (%) 18/54/10 M.Cap. (INR
Axis Bank. CMP: INR1,119 TP: INR1,330 Buy
 BSE SENSEX S&P CNX 18,714 5,687 Bloomberg AXSB IN Equity Shares (m) 413.2 52-Week Range (INR) 1,309/785 1,6,12 Rel.Perf.(%) 9/-16/-8 M.Cap. (INR b) 462.4 M.Cap. (USD b) 8.7 16 October 2012 2QFY13 Results
Cummins India. CMP: INR430 TP: INR462 Neutral
 BSE SENSEX S&P CNX 16,070 4,870 Bloomberg KKC IN Equity Shares (m) 277.2 52-Week Range (INR) 515/322 1,6,12 Rel. Perf. (%) -3/30/-4 M.Cap. (INR b) 119.2 M.Cap. (USD b) 2.2 17 May 2012 4QFY12 Results Update
Oberoi Realty. CMP: INR269 TP: INR320 Buy
 BSE SENSEX S&P CNX 18,682 5,684 Bloomberg OBER IN Equity Shares (m) 328.2 52-Week Range (INR) 323/205 1,6,12 Rel. Perf. (%) 13/-7/7 M.Cap. (INR b) 88.3 M.Cap. (USD b) 1.6 22 October 2012 2QFY13 Results
Dabur India. CMP: INR130 TP: INR135 Neutral
 BSE SENSEX S&P CNX 18,625 5,664 29 October 2012 2QFY13 Results Update Sector: Consumer Dabur India CMP: INR130 TP: INR135 Neutral Bloomberg DABUR IN Equity Shares (m) 1,740.7 52-Week Range (Rs) 139/92
Punjab National Bank. CMP: INR768 TP: INR963 Buy
 BSE SENSEX S&P CNX 16,480 4,975 Bloomberg PNB IN Equity Shares (m) 339.2 52-Week Range (INR) 1,200/751 1,6,12 Rel.Perf.(%) -12/-16/-18 M.Cap. (INR b) 260.5 M.Cap. (USD b) 4.8 10 May 2012 4QFY12 Results
Punjab National Bank. CMP: INR940 TP: INR1,275 Buy
 BSE SENSEX S&P CNX 17,194 5,199 Bloomberg PNB IN Equity Shares (m) 316.8 52-Week Range (INR) 1,234/751 1,6,12 Rel.Perf.(%) 9/-10/-9 M.Cap. (INR b) 297.7 M.Cap. (USD b) 6.0 1 February 2012 3QFY12 Results
Previous Recommendation: Buy
 2QCY10 Results Update SECTOR: CEMENT ACC STOCK INFO. BSE Sensex: 18,113 S&P CNX: 5,442 BLOOMBERG ACC IN REUTERS CODE ACC.BO Previous Recommendation: Buy Buy Rs816 Equity Shares (m) 187.9 52-Week Range
Expect capacity-led rerating; maintain Buy
 BSE SENSEX S&P CNX 27,238 8,400 Stock Info Bloomberg SRCM IN Equity Shares (m) 34.8 52-Week Range (INR) 18519/9350 1, 6, 12 Rel. Per (%) -2/-3/32 M.Cap. (INR b) 523.7 M.Cap. (USD b) 7.7 Avg Val, INRm 216.4
Axis Bank. CMP: INR1,008 TP: INR1,240 Buy
 BSE SENSEX S&P CNX 16,739 5,049 Bloomberg AXSB IN Equity Shares (m) 410.5 52-Week Range 1,461/785 1,6,12 Rel.Perf.(%) 11/-9/-9 M.Cap. (INR b) 413.8 M.Cap. (USD b) 8.2 20 January 2012 Results Update Sector:
CMP: INR124 TP: INR172 Buy. Benefit of two major motorcycle launches not priced in. Improved industry outlook and recent launch success drive upgrades
 BSE Sensex S&P CNX 24,717 7,359 Stock Info Bloomberg TVSL IN Equity Shares (m) 475.1 52-Week Range (INR) 138/28 1, 6, 12 Rel. Per (%) 34/111/210 M.Cap. (INR b) 59.1 M.Cap. (USD b) 1.0 Financial Snapshot
Godrej Consumer Products
 BSE SENSEX S&P CNX 18,755 5,698 Bloomberg GCPL IN Equity Shares (m) 340.3 52-Week Range (INR) 745/370 1,6,12 Rel. Perf. (%) 4/17/67 M.Cap. (INR b) 246.4 M.Cap. (USD b) 4.6 5 November 2012 2QFY13 Results
Dabur India. CMP: INR106 TP: INR94 Neutral
 28 July 2011 1QFY12 Results Update Sector: FMCG BSE SENSEX S&P CNX 18,210 5,488 Dabur India CMP: INR106 TP: INR94 Neutral Bloomberg DABUR IN Equity Shares (m) 1,740.0 52-Week Range (INR) 122/87 1,6,12
CMP: INR2,013 TP: INR2,384 (+18%) DBEL to be merged with OCL India
 DBEL to be merged with OCL India") BSE SENSEX S&P CNX 27,459 8,497 CMP: INR2,013 TP: INR2,384 (+18%) DBEL to be merged with OCL India 7 November 2016 Update Sector: Cement Dalmia Bharat Buy Stock Info Bloomberg DBEL IN Equity Shares (m)
BSE SENSEX S&P CNX 27,459 8,497 CMP: INR2,013 TP: INR2,384 (+18%) DBEL to be merged with OCL India 7 November 2016 Update Sector: Cement Dalmia Bharat Buy Stock Info Bloomberg DBEL IN Equity Shares (m)
Tata Power. CMP: INR111 TP: INR92 Neutral
 BSE SENSEX S&P CNX 17,749 5,382 Bloomberg TPWR IN Equity Shares (m) 2,373.3 52-Week Range (INR) 135/81 1,6,12 Rel. Perf. (%) 10/-5/-10 M.Cap. (INR b) 263.9 M.Cap. (USD b) 5.3 13 February 2012 3QFY12 Results
BHEL. CMP: INR227 TP: INR233 Neutral
 BSE SENSEX S&P CNX 18,636 5,666 Bloomberg BHEL IN Equity Shares (m) 2,447.6 52-Week Range (INR) 368/198 1,6,12 Rel. Perf. (%) -7/-7/-35 M.Cap. (INR b) 556.2 M.Cap. (USD b) 10.3 30 October 2012 2QFY13 Results
Hindustan Unilever. CMP:INR324 TP:INR302 Neutral
 BSE SENSEX S&P CNX 18,197 5,482 29 July 2011 1QFY12 Results Update Sector: FMCG Hindustan Unilever CMP:INR324 TP:INR302 Neutral Bloomberg HUVR IN Equity Shares (m) 2,159.5 52-Week Range (INR) 347/250 1,6,12
Decent performance by the sector in a tough quarter
 Sector Update 17 February 2017 Cement MOSL Cement Universe volume (mt) trend Volume (mt) 3QFY17 YoY 5.5-9% 11.4-1% 1.7-11% 2.4 21% 4.9 3.6 20% 1.9-1.8 2.0 2 1.3 19% Volumes in Jan-17 revive to pre-demonetization
ECOSCOPE. Real GDP growth eases on lower net indirect taxes. The Economy Observer. Real GVA growth exactly as expected
 31 August 2016 ECOSCOPE The Economy Observer Real GDP growth eases on lower net indirect taxes Real GVA growth exactly as expected India s real gross domestic product (GDP) grew at the slowest pace in
Shree Renuka Sugars. CMP: INR41 TP: INR50 Buy
 BSE SENSEX S&P CNX 18,202 5,532 Bloomberg SHRS IN Equity Shares (m) 671.0 52-Week Range (INR) 87/23 1,6,12 Rel. Perf. (%) 14/-39/-51 M.Cap. (INR b) 27.3 M.Cap. (USD b) 0.6 16 February 2012 5QSY12 Results
Raymond. Restructuring initiatives bearing fruit; Land bank base case value INR147/share; Reiterate Buy. CMP: INR385 TP: INR462 Buy
 14 June 2012 Update Raymond CMP: INR385 TP: INR462 Buy Restructuring initiatives bearing fruit; Land bank base case value INR147/share; Reiterate Buy We met the management of Raymond (RW IN, Mkt Cap USD0.4b,
Godrej Properties. CMP: INR595 TP: INR635 Neutral
 BSE SENSEX S&P CNX 16,913 5,114 Bloomberg GPL IN Equity Shares (m) 78.0 52-Week Range 845/570 1,6,12 Rel. Perf. (%) 0/-9/-2 M.Cap. (INR b) 46.4 M.Cap. (USD b) 0.9 4QFY12 Results Update Sector: Real Estate
Individual Housing Loans: Rationalization of Risk-Weights and LTV Ratios
 8 October 2015 Sector Update Financials Individual Housing Loans: Rationalization of Risk-Weights and LTV Ratios Significant capital release for HFCs; Limited benefits for banks Event: RBI reduces risk
Sun Pharmaceuticals. CMP: INR554 TP: INR614 Neutral
 BSE SENSEX S&P CNX 17,849 5,416 Bloomberg SUNP IN Equity Shares (m) 1,035.6 52-Week Range (INR) 566/404 1,6,12 Rel. Perf. (%) -3/10/31 M.Cap. (INR b) 573.7 M.Cap. (USD b) 11.6 15 February 2012 3QFY12 Results
Oberoi Realty. CMP: INR264 TP: INR315 Buy
 BSE SENSEX S&P CNX 17,151 5,202 Bloomberg OBER IN Equity Shares (m) 328.2 52-Week Range (INR) 323/205 1,6,12 Rel. Perf. (%) 4/15/16 M.Cap. (INR b) 87.0 M.Cap. (USD b) 1.7 26 April 2012 4QFY12 Results Update
Jindal Steel & Power. CMP: INR274 TP: INR379 Buy
 BSE SENSEX S&P CNX 25,665 7,672 Bloomberg JSP IN Equity Shares (m) 914.9 M.Cap. (INR b) / (USD b) 250.9/4.1 52-Week Range (INR) 350/190 1, 6, 12 Rel. Per (%) -15/-14/3 Financials & Valuation (INR Billion)
Pantaloon Retail. CMP: INR177 TP: INR192 Neutral
 BSE SENSEX S&P CNX 17,773 5,390 Bloomberg PF IN Equity Shares (m) 217.1 52-Week Range (INR) 364/125 1,6,12 Rel. Perf. (%) 9/-49/-29 M.Cap. (Rs b) 38.4 M.Cap. (US$ b) 0.8 14 February 2012 2QFY12 Results
CMP: INR1,044 TP: INR970 (-7%) Neutral Sale of Healthcare business margin accretive
 Neutral Sale of Healthcare business margin accretive") BSE SENSEX S&P CNX 24,646 7,485 4 March 2016 Update Sector: Capital Goods Siemens CMP: INR1,044 TP: INR970 (-7%) Neutral Sale of Healthcare business margin accretive Stock Info Bloomberg SIEM IN Equity
BSE SENSEX S&P CNX 24,646 7,485 4 March 2016 Update Sector: Capital Goods Siemens CMP: INR1,044 TP: INR970 (-7%) Neutral Sale of Healthcare business margin accretive Stock Info Bloomberg SIEM IN Equity