Hindalco. CMP: INR113 TP: INR151 Buy
|
|
|
- Francine Watkins
- 5 years ago
- Views:
Transcription

 fell sharply due to swap of a long term debt (against operating asset) with NCDs (against project), which attracts a varied accounting adjustment and is largely")
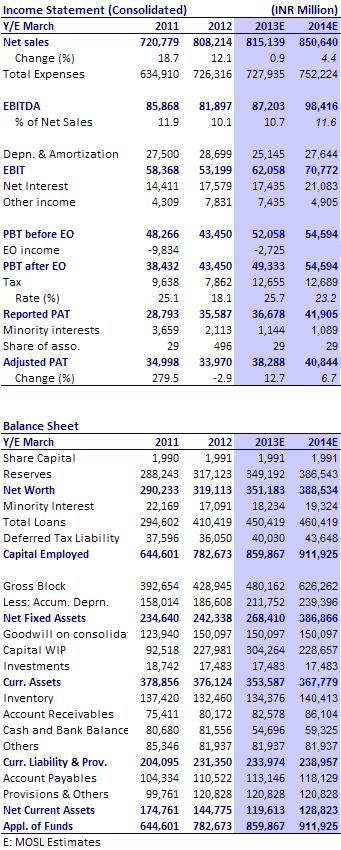
1 BSE SENSEX S&P CNX 18,817 5,724 Bloomberg HNDL IN Equity Shares (m) 1, Week Range (INR) 165/100 1,6,12 Rel. Perf. (%) -9/-18/-26 M.Cap. (INR b) M.Cap. (USD b) 4.1 Consolidated 2QFY13 Results Update Sector: Metals Hindalco CMP: INR113 TP: INR151 Buy Hindalco Industries' consolidated adjusted PAT at INR9.1b was in line with estimates. Standalone EBITDA increased 11% QoQ to INR5.2b and was 14% below estimate due to continued production disturbances at the aluminum smelters and increasing costs. Copper segment posted strong numbers. Interest expenses (standalone) fell sharply due to swap of a long term debt (against operating asset) with NCDs (against project), which attracts a varied accounting adjustment and is largely cosmetic. Novelis' adjusted EBITDA improved 7% QoQ to USD277m (4% above estimate) due to better margins, though rolled product volumes were flat at 719kt, against 3% QoQ expected growth. EBITDA per ton increased 7% QoQ to USD385/t, ahead of flat expectation. Strong demand in can and auto businesses and better operating cost management are mitigating headwinds at the cost front. While stronger regional premiums for ingots in Asian markets are affecting margins, weaker LME has reduced the recycling benefit. Novelis is on track to deliver projects across the world with USD1.4b capex (spent USD850m in 1HFY13). We reduce the consolidated FY14E EBITDA by 2% to factor the higher operating costs for Indian aluminum smelters. Indian aluminum volumes will improve in 2HFY13 as the operational issues get resolved; the 58ktpa Hirakud expansion, Mahan smelters and Utkal Alumina would add to volumes in FY14. Mahan coal block received stage 1 forest clearance, thus paving the path for further statutory clearances. FRP demand outlook remains strong in the longer term, though there may be near term pressures due to a slowing global economy. The stock is trading at FY14E EV/EBITDA of 6.5x. CWIP is estimated at INR285b, which is ~3x EBITDA. Valuations are attractive and we maintain a Buy with a target price of INR151. Sanjay Jain (SanjayJain@MotilalOswal.com); / Pavas Pethia (Pavas.Pethia@MotilalOswal.com); Investors are advised to refer through disclosures made at the end of the Research Report.
2 Hindalco Aluminium Business (INR m) Hindalco standalone: below est; aluminum CoP still rising; copper business returns to normal Hindalco's standalone adjusted PAT at INR3.6b was below estimate of INR4b due to lower EBIT in the aluminum segment. This is despite the copper segment returning to normal level of margins, after a disappointment in 1QFY13. Net sales increased 2% QoQ to INR61.6b due to a 3% increase each in aluminum and copper sales volumes. Average realizations continue to benefit from strong spot premiums in the aluminum segment. EBITDA increased 11% QoQ to INR5.2b, below estimate of INR6b, as the cost of production of aluminum continues to rise due to the seasonal impact on coal cost during monsoons and lower production on account of operational disturbances. Sales volumes at 127kt were 2% better than estimate. Copper segment EBITDA at INR2.5b was slightly above estimate of INR2.1b and production 3% lower than estimate at 78kt (+10% QoQ). Copper EBITDA increased 109% QoQ to INR2.5b. EBIT increased from USc8.9/lb in 1QFY13 to USc23.3/lb in 2QFY13 (v/s USc22.9/lb in 2QFY12). Copper sales volumes increased 3% QoQ to 73kt. Interest expenses saw a sharp decline due to paying off of certain high cost term debt pertaining to operational assets. Term debt has been replaced by project debt with NCDs. The interest expense thereon will be expensed along with projects' commercial production. Other income declined 56% QoQ to INR1.3b due to absence of dividends. Net debt increased by INR48b during 1HFY13 due to INR31b of capex and reduction in payables by INR10b. 1QFY12 2QFY12 3QFY12 4QFY12 1QFY13 2QFY13 3QFY13 4QFY13 Segmental Revenue 20,931 22,132 22,362 24,986 20,626 21,049 22,916 26,735 less: Alumina 1,660 2,020 1,980 2,170 2,930 2,160 2,160 2,160 (a) Revenue (only Aluminium products) 19,271 20,112 20,382 22,816 17,696 18,889 20,756 24,575 Sales (000 tons) Realization (INR/ton) 147, , , , , , , ,836 EBITDA 6,761 4,758 4,532 5,258 3,415 2,609 3,746 6,035 Less: Alumina EBITDA (50% margin assumed) 830 1, ,085 1,465 1,080 1,080 1,080 (b) EBITDA (only Aluminium products) 5,931 3,748 3,542 4,173 1,950 1,529 2,666 4,955 Costs (a - b) 13,340 16,364 16,840 18,643 15,745 17,360 18,090 19,620 Aluminium costs (INR/ton) 101, , , , , , , ,800 USD/INR LME (USD/ton) 2,618 2,450 2,115 2,225 1,985 1,900 2,000 2,100 Aluminium costs (USD/ton) 2,276 2,794 2,246 2,491 2,332 2,463 2,481 2,422 Realization (USD/ton) 3,288 3,434 2,719 3,049 2,621 2,680 2,847 3,034 Product premium over LME EBITDA per ton (USD) 1, ~ COP (LME - EBITDA/t +150) 1,756 1,960 1,793 1,817 1,846 1,833 1,784 1,638 Source: Company, MOSL 2


3 Novelis: above est; strong can and auto demand mitigates reduced recycling benefit and stronger regional premiums on ingots Adjusted EBITDA improved 7% QoQ to USD277m and was 4% ahead of estimate due to better margins; however, rolled product volumes remained flat at 719kt, against expectation of 3% QoQ growth. EBITDA per ton increased 7% QoQ to USD385/t, ahead of flat expectation. Volumes declined by 15kt QoQ in Europe but were made up by higher volumes in Americas and Asia. Segmental income increased 38% QoQ to USD123m in North America due to strong demand from auto sector and steady demand from can business, which is the highest-ever since Hindalco acquired Novelis. Stronger conversion premium and product mix helped margins and offset the reduced scrap recycling benefit. Volumes were up 1%. Segmental income was flat QoQ at USD74m in Europe despite 6% lower volumes. Margins improved due to exiting the low margin foil business. Asia and South America witnessed a decline in segmental income of 15% QoQ to USD39m and 18% to USD41m, despite 4% and 3% higher volumes respectively. Asian markets are witnessing pricing pressure and higher regional premiums. Geographical breakup of volumes (KT) Geographical breakup of EBIT (USD M) Source: Company, MOSL 3
4 Net debt increased by USD41m to USD4,235m due to increase in net working capital by USD83m and capex of USD178m. Operating activities generated cash flows of USD205m, before adjustment of working capital. Novelis is on track to deliver projects across the world with a capex of USD1.4b and has already spent USD850m in 1HFY13. Remaining USD550m will be spent over 2 years. FRP capacity will increase by 570kt, auto volumes will rise by 320kt and recycling capacity will increase by 855kt. Ground breaking at Germany and China was done during the quarter. For FY13, the total capex range has widened from USD m to USD m due to economic uncertainties. Novelis: Investing in growth Projects Location Cap addn. Total capex CapEx Comm. Remarks (ktpa) (USD m) (Usm) FY12 FY13 date FRP Projects 570 1, Rolling mill expansion - Can sheets Brazil, S America Dec-12 on time Rolling mill and recycling expansion S Korea, Asia Dec-13 on time Automotive (Heat treatment) N America Jun-13 on time Automotive (Heat treatment) China Dec-14 on time Global recycling initiatives & sustenance (original capacity was 1200ktpa Brazil, S America 190 Dec-13 on time To increase recycled aluminum Germany 400 Jan-15 on time from 34% to 80% by 2020 ) Korea Oct-12 completed Others Total 1, Source: Company, MOSL 4
5 Hindalco: an investment profile Company description Hindalco Industries (HNDL) is the largest aluminum producer in India and has captive bauxite mines from which it sources ~67% of requirements for its 1.5mtpa alumina refinery. Company also has a 0.54mtpa smelting capacity and is the largest maker of flat rolled aluminum products in India. After turning Novelis around in 2010, HNDL is focusing on tripling its aluminum production capacity in India in the next three years through brownfield and greenfield projects. Its copper smelting capacity of 500ktpa is the largest in Asia. Key investment arguments Company's new smelting capacities are coming up near energy sources and alumina facilities are near bauxite mines, thus ensuring low cost of production. We expect Novelis to deliver strong earnings growth, given its focus on high margin business, expansions in key markets and continued efforts to improve operating efficiencies across locations. Comparative valuations Hindalco Nalco Sterlite P/E (x) FY13E FY14E P/BV (x) FY13E FY14E EV/Sales (x) FY13E FY14E EV/EBITDA (x) FY13E FY14E Key investment risks An unexpected fall in aluminum prices, sluggish growth in developed countries and further delays in expansion activities could adversely impact earnings. Recent developments Mahan coal block has received stage I forest clearance. Valuation and view We value Hindalco at INR151 based on the SOTP method. Maintain Buy. Sector view With weak LME prices in the quarter, aluminium spot premium rose to all-time high levels. Weak demand resulted in capacity cuts by major aluminium producers. However, subsidies and benefits offered by the governments in Australia, China and Europe are ensuring that some of the high cost smelters work. We factor aluminium prices of USD1,996/t in FY13E and USD2,100 in FY14E. EPS: MOSL forecast v/s consensus (INR) MOSL Consensus Variation forecast forecast (%) FY FY Target price and recommendation Current *Target Upside Reco. Price (INR) Price (INR) (%) Buy 5.0xFY14 EV/EBITDA and 50% discount to CWIP Stock performance (1 year) Shareholding Pattern (%) Sep-12 Jun-12 Sep-11 Promoter Domestic Inst Foreign Others

6 Financials and Valuation 6
7 N O T E S 7
8 Disclosures This report is for personal information of the authorized recipient and does not construe to be any investment, legal or taxation advice to you. This research report does not constitute an offer, invitation or inducement to invest in securities or other investments and Motilal Oswal Securities Limited (hereinafter referred as MOSt) is not soliciting any action based upon it. This report is not for public distribution and has been furnished to you solely for your information and should not be reproduced or redistributed to any other person in any form. Unauthorized disclosure, use, dissemination or copying (either whole or partial) of this information, is prohibited. The person accessing this information specifically agrees to exempt MOSt or any of its affiliates or employees from, any and all responsibility/liability arising from such misuse and agrees not to hold MOSt or any of its affiliates or employees responsible for any such misuse and further agrees to hold MOSt or any of its affiliates or employees free and harmless from all losses, costs, damages, expenses that may be suffered by the person accessing this information due to any errors and delays. The information contained herein is based on publicly available data or other sources believed to be reliable. While we would endeavour to update the information herein on reasonable basis, MOSt and/or its affiliates are under no obligation to update the information. Also there may be regulatory, compliance, or other reasons that may prevent MOSt and/or its affiliates from doing so. MOSt or any of its affiliates or employees shall not be in any way responsible and liable for any loss or damage that may arise to any person from any inadvertent error in the information contained in this report. MOSt or any of its affiliates or employees do not provide, at any time, any express or implied warranty of any kind, regarding any matter pertaining to this report, including without limitation the implied warranties of merchantability, fitness for a particular purpose, and non-infringement. The recipients of this report should rely on their own investigations. This report is intended for distribution to institutional investors. Recipients who are not institutional investors should seek advice of their independent financial advisor prior to taking any investment decision based on this report or for any necessary explanation of its contents. MOSt and/or its affiliates and/or employees may have interests/positions, financial or otherwise in the securities mentioned in this report. To enhance transparency, MOSt has incorporated a Disclosure of Interest Statement in this document. This should, however, not be treated as endorsement of the views expressed in the report. Disclosure of Interest Statement Hindalco 1. Analyst ownership of the stock No 2. Group/Directors ownership of the stock No 3. Broking relationship with company covered No 4. Investment Banking relationship with company covered No Analyst Certification The views expressed in this research report accurately reflect the personal views of the analyst(s) about the subject securities or issues, and no part of the compensation of the research analyst(s) was, is, or will be directly or indirectly related to the specific recommendations and views expressed by research analyst(s) in this report. The research analysts, strategists, or research associates principally responsible for preparation of MOSt research receive compensation based upon various factors, including quality of research, investor client feedback, stock picking, competitive factors and firm revenues. Regional Disclosures (outside India) This report is not directed or intended for distribution to or use by any person or entity resident in a state, country or any jurisdiction, where such distribution, publication, availability or use would be contrary to law, regulation or which would subject MOSt & its group companies to registration or licensing requirements within such jurisdictions. For U.K. This report is intended for distribution only to persons having professional experience in matters relating to investments as described in Article 19 of the Financial Services and Markets Act 2000 (Financial Promotion) Order 2005 (referred to as "investment professionals"). This document must not be acted on or relied on by persons who are not investment professionals. Any investment or investment activity to which this document relates is only available to investment professionals and will be engaged in only with such persons. For U.S. MOSt is not a registered broker-dealer in the United States (U.S.) and, therefore, is not subject to U.S. rules. In reliance on the exemption from registration provided by Rule 15a-6 of the U.S. Securities Exchange Act of 1934, as amended (the "Exchange Act") and interpretations thereof by the U.S. Securities and Exchange Commission ("SEC") in order to conduct business with Institutional Investors based in the U.S., Motilal Oswal has entered into a chaperoning agreement with a U.S. registered broker-dealer, Marco Polo Securities Inc. ("Marco Polo"). Any business interaction pursuant to this report will have to be executed within the provisions of this Chaperoning agreement. This report is intended for distribution only to "Major Institutional Investors" as defined by Rule 15a-6(b)(4) of the Exchange Act and interpretations thereof by SEC (henceforth referred to as "major institutional investors"). This document must not be acted on or relied on by persons who are not major institutional investors. Any investment or investment activity to which this document relates is only available to major institutional investors and will be engaged in only with major institutional investors. The Research Analysts contributing to the report may not be registered /qualified as research analyst with FINRA. Such research analyst may not be associated persons of the U.S. registered broker-dealer, Marco Polo and therefore, may not be subject to NASD rule 2711 and NYSE Rule 472 restrictions on communication with a subject company, public appearances and trading securities held by a research analyst account. Motilal Oswal Securities Ltd Motilal Oswal Tower, Level 9, Sayani Road, Prabhadevi, Mumbai Phone: reports@motilaloswal.com
CMP: INR121 TP: INR193 Buy
 BSE SENSEX S&P CNX 17,085 5,139 20 October 2011 2QFY12 Results Update Sector: Metals Hindustan Zinc CMP: INR121 TP: INR193 Buy Bloomberg HZ IN Equity Shares (m) 4,225.3 52-Week Range (INR) 155/109 1,6,12
Sanjay Jain Pavas Pethia
 BSE Sensex S&P CNX 19,561 5,923 Bloomberg SAIL IN Equity Shares (m) 4,130.4 M.Cap. (INR b)/(usd b) 334.6/6.2 52-Week Range (INR) 116/76 1,6,12 Rel. Perf. (%) -11/-17/-38 Financials & Valuation (INR b)
Godawari Power & Ispat
 BSE SENSEX S&P CNX CMP: INR103 TP: INR185 Buy 17,077 5,158 Bloomberg GODPI IN Equity Shares (m) 31.8 52-Week Range (INR) 200/70 1,6,12 Rel. Perf. (%) 32/-31/-33 M.Cap. (INR b) 3.3 M.Cap. (USD m) 65.3 Consolidated
Pidilite Industries. CMP: INR164 TP: INR186 Buy
 BSE SENSEX S&P CNX 16,640 5,043 Bloomberg PIDI IN Equity Shares (m) 506.1 52-Week Range (INR) 188/134 1,6,12 Rel. Perf. (%) 1/20/5 M.Cap. (INR b) 83.0 M.Cap. (USD b) 1.5 27 July 2012 1QFY13 Results Update
Steel Authority of India
 BSE SENSEX S&P CNX 16,439 4,990 4QFY12 Results Update Sector: Metals Steel Authority of India CMP: INR93 TP: INR99 Sell Bloomberg SAIL IN Equity Shares (m) 4,130.4 52-Week Range (INR) 151/73 1,6,12 Rel.
NTPC CMP: INR169 TP: INR191 Buy
 BSE SENSEX S&P CNX 18,625 5,664 Bloomberg NTPC IN Equity Shares (m) 8,245.5 52-Week Range (INR) 190/139 1,6,12 Rel. Perf. (%) 3/-4/-11 M.Cap. (INR b) 1,393.5 M.Cap. (USD b) 26.0 26 October 2012 2QFY13
Titan Industries. CMP: INR222 TP: INR220 Neutral
 BSE SENSEX S&P CNX 17,257 5,241 Bloomberg TTAN IN Equity Shares (m) 887.8 52-Week Range (INR) 255/154 1,6,12 Rel. Perf. (%) -1/13/3 M.Cap. (Rs b) 197.1 M.Cap. (US$ b) 3.6 2 August 2012 1QFY13 Results Update
Monnet Ispat. CMP: INR449 TP: INR518 Neutral
 4QFY12 Results Update Sector: Metals Monnet Ispat BSE SENSEX S&P CNX 16,328 4,943 CMP: INR449 TP: INR518 Neutral Bloomberg MISP IN Equity Shares (m) 64.4 52-Week Range (INR) 561/305 1,6,12 Rel. Perf. (%)
Jubilant Foodworks. CMP: INR1,189 TP: INR1,0541,054 Neutral
 BSE SENSEX S&P CNX 16,846 5,110 Bloomberg JUBI IN Equity Shares (m) 63.5 52-Week Range (INR) 1,189/633 1,6,12 Rel. Perf. (%) 4/38/47 M.Cap. (INR b) 75.5 M.Cap. (USD b) 1.3 26 July 2012 1QFY13 Results Update
BGR Energy. CMP: INR266 TP: INR230 Neutral
 BSE SENSEX S&P CNX 18,562 5,645 Bloomberg BGRL IN Equity Shares (m) 72.0 52-Week Range (INR) 374/173 1,6,12 Rel. Perf. (%) -3/27/-24 M.Cap. (INR b) 19.2 M.Cap. (USD b) 0.4 3 November 2012 2QFY13 Results
Asian Paints. CMP: INR2,722 TP: INR3,161 Buy
 BSE SENSEX S&P CNX 16,739 5,049 Bloomberg APNT IN Equity Shares (m) 95.9 52-Week Range (INR) 3,366/2,395 1,6,12 Rel. Perf. (%) -5/-3/14 M.Cap. (INR b) 261.1 M.Cap. (USD b) 4.9 23 January 2012 3QFY12 Results
BGR Energy. CMP: INR282 TP: INR253 Neutral
 BSE SENSEX S&P CNX 17,413 5,283 Bloomberg BGRL IN Equity Shares (m) 72.0 52-Week Range (INR) 378/173 1,6,12 Rel. Perf. (%) -9/17/-22 M.Cap. (INR b) 20.3 M.Cap. (USD b) 0.4 6 August 2012 1QFY13 Results
Coal India CMP: INR348 TP: INR408 Buy
 BSE SENSEX S&P CNX 17,633 5,348 Bloomberg COAL IN Equity Shares (m) 6,316.4 52-Week Range (INR) 404/294 1,6,12 Rel. Perf. (%) -4/4/-15 M.Cap. (INR b) 2,198.1 M.Cap. (USD b) 39.7 14 August 2012 1QFY13 Results
Reliance Infrastructure CMP: INR528
 BSE SENSEX S&P CNX 17,657 5,363 16 August 2012 1QFY13 Results Update Sector: Utilities Reliance Infrastructure CMP: INR528 Buy Bloomberg RELI IN Equity Shares (m) 267.5 52-Week Range (INR) 680/328 1,6,12
Canara Bank. CMP: INR419 TP: INR525 Buy
 BSE SENSEX S&P CNX 18,817 5,724 Bloomberg CBK IN Equity Shares (m) 443.0 52-Week Range (INR) 566/349 1,6, 12 Rel.Perf.(%) -7/-18/-17 M.Cap. (INR b) 170.3 M.Cap. (USD b) 3.0 7 November 2012 2QFY13 Results
JSW Steel. CMP: INR670 TP: INR391 Sell Merger with JSW Ispat
 BSE SENSEX S&P CNX 17,384 5,254 Bloomberg JSTL IN Equity Shares (m) 223.1 52-Week Range (INR) 885/464 1,6,12 Rel. Perf. (%) -5/-12/-10 M.Cap. (INR b) 149.5 M.Cap. (USD b) 2.7 Valuation summary (INR b)
Idea Cellular. CMP: INR81 TP: INR Under Review
 BSE SENSEX S&P CNX 16,918 5,128 Bloomberg IDEA IN Equity Shares (m) 3,308.8 52-Week Range (INR) 104/71 1,6,12 Rel. Perf. (%) 6/-13/4 M.Cap. (INR b) 268.0 M.Cap. (USD b) 4.8 25 July 2012 1QFY13 Results
Unitech. CMP: INR20 TP: INR30 Buy
 BSE SENSEX S&P CNX 16,328 4,943 Bloomberg UT IN Equity Shares (m) 2,438.8 52-Week Range (INR) 38/17 1,6,12 Rel. Perf. (%) -25/-14/-34 M.Cap. (INR b) 48.8 M.Cap. (USD b) 0.9 16 May 2012 4QFY12 Results Update
Larsen & Toubro. CMP: INR1,160 TP: INR1,417 Buy
 BSE SENSEX S&P CNX 16,216 4,908 Bloomberg LT IN Equity Shares (m) 608.9 52-Week Range (INR) 1,868/971 1,6,12 Rel. Perf. (%) -4/-7/12 M.Cap. (INR b) 706.3 M.Cap. (USD b) 13.1 * Consolidated; EPS is fully
Hardick Bora
 BSE Sensex S&P CNX 19,990 6,069 Bloomberg JOL IN Equity Shares (m) 159.3 M.Cap. (INR b)/(usd b) 26.0/0.5 52-Week Range (INR) 248/154 1,6,12 Rel. Perf. (%) -18/-28/-34 Financials & Valuation (INR b) Y/E
BGR Energy. CMP: INR284 TP: INR296 Neutral
 BSE SENSEX S&P CNX 16,312 4,951 Bloomberg BGRL IN Equity Shares (m) 72.0 52-Week Range (INR) 512/173 1,6,12 Rel. Perf. (%) -8/8/-31 M.Cap. (INR b) 20.5 M.Cap. (USD b) 0.4 31 May 2012 4QFY12 Results Update
Godrej Consumer Products
 BSE SENSEX S&P CNX 17,602 5,337 Bloomberg GCPL IN Equity Shares (m) 340.3 52-Week Range (INR) 658/370 1,6,12 Rel. Perf. (%) 5/37/42 M.Cap. (INR b) 205.9 M.Cap. (USD b) 3.7 7 August 2012 1QFY13 Results
CMP: INR350 TP: INR375 Downgrade to Neutral
 BSE Sensex S&P CNX 19,497 5,897 Bloomberg COAL IN Equity Shares (m) 6,316.4 M.Cap. (INR b)/(usd b) 2,211/41 52-Week Range (INR) 386/301 1,6,12 Rel. Perf. (%) 1/-11/-5 Financials & Valuation (INR b) Y/E
CMP: INR415 TP: INR 471 BUY
 04 Mar 2013 Update Sector: Technology Wipro CMP: INR415 TP: INR 471 BUY Pipeline and deal signings suggest improvement in growth; Multiple levers and focus on productivity will cushion margin headwinds
Petronet LNG. CMP: INR146 TP: INR205 Buy
 BSE SENSEX S&P CNX 17,236 5,229 Bloomberg PLNG IN Equity Shares (m) 750.0 52-Week Range (INR) 186/122 1,6,12 Rel. Perf. (%) 3/-11/-10 M.Cap. (INR b) 109.7 M.Cap. (USD b) 2.0 1 August 2012 1QFY13 Results
Niket Shah
 BSE Sensex S&P CNX 20,213 6,147 Bloomberg VGRD IN Equity Shares (m) 29.8 M.Cap. (INR b)/(usd b) 14.6/0.3 52-Week Range (INR) 591/180 1,6,12 Rel. Perf. (%) -8/-6/138 Financial summary (INR b) Y/E March
Shree Renuka Sugars. CMP: INR26 TP: INR45 Buy
 BSE SENSEX S&P CNX 16,219 4,924 1 June 2012 6QSY12 Results Update Sector: Sugar CMP: INR26 TP: INR45 Buy Bloomberg SHRS IN Equity Shares (m) 671.0 52-Week Range (INR) 76/23 1,6,12 Rel. Perf. (%) -10/-16/-45
Larsen & Toubro. CMP: INR1,278 TP: INR1,380 Buy
 BSE SENSEX S&P CNX 16,786 5,050 Bloomberg LT IN Equity Shares (m) 608.9 52-Week Range (INR) 1,933/971 1,6,12 Rel. Perf. (%) 20/-19/-11 M.Cap. (INR b) 778.1 M.Cap. (USD b) 15.5 * Consolidated; EPS is fully
Jaiprakash Associates
 BSE SENSEX S&P CNX 16,312 4,951 Bloomberg JPA IN Equity Shares (m) 2,126.5 52-Week Range (INR) 89/50 1,6,12 Rel. Perf. (%) -14/-4/-17 M.Cap. (INR b) 127.9 M.Cap. (USD b) 2.3 31 May 2012 4QFY12 Results
Sanofi India. CMP: INR2,200 TP: INR1,848 Neutral
 BSE SENSEX S&P CNX 16,846 5,110 Bloomberg SANL IN Equity Shares (m) 23.0 52-Week Range (INR) 2,430/1,980 1,6,12 Rel. Perf. (%) 3/-3/15 M.Cap. (INR b) 50.7 M.Cap. (USD b) 0.9 26 July 2012 2QCY12 Results
Punjab National Bank. CMP: INR716 TP: INR950 Buy
 BSE SENSEX S&P CNX 16,839 5,100 Bloomberg PNB IN Equity Shares (m) 339.2 52-Week Range (INR) 1,144/703 1,6,12 Rel.Perf.(%) -8/-24/-28 M.Cap. (INR b) 242.8 M.Cap. (USD b) 4.4 30 July 2012 1QFY13 Results
IndusInd Bank. CMP: INR345 TP: INR419 Buy
 BSE SENSEX S&P CNX 17,504 5,332 Bloomberg IIB IN Equity Shares (m) 467.7 52-Week Range (INR) 352/222 1,6,12 Rel.Perf.(%) 13/25/34 M.Cap. (INR b) 161.4 M.Cap. (USD b) 3.1 20 April 2012 4QFY12 Results Update
IDBI Bank. CMP: INR106 TP: INR121 Neutral
 BSE SENSEX S&P CNX 17,207 5,223 Bloomberg IDBI IN Equity Shares (m) 1,278.4 52-Week Range (INR) 154/77 1,6,12 Rel.Perf.(%) -1/0/-7 M.Cap. (INR b) 135.5 M.Cap. (USD b) 2.6 24 April 2012 4QFY12 Results Update
Punjab National Bank. CMP:INR1,103 TP:INR1,500 Buy
 BSE SENSEX S&P CNX 18,210 5,488 28 July 2011 1QFY12 Results Update Sector: Banking Punjab National Bank CMP:INR1,103 TP:INR1,500 Buy Bloomberg PNB IN Equity Shares (m) 316.8 52-Week Range (INR) 1,395/971
Strides Arcolab. CMP: INR717 TP: INR829 Buy
 BSE SENSEX S&P CNX 17,144 5,200 Bloomberg STR IN Equity Shares (m) 57.7 52-Week Range (INR) 794/276 1,6,12 Rel. Perf. (%) -2/37/98 M.Cap. (INR b) 41.4 M.Cap. (USD b) 0.7 31 July 2012 2QCY12 Results Update
Stress test: Weak capital servicing ratios to drive pricing discipline
 Stress test: Weak capital servicing ratios to drive pricing discipline Operating performance near trough; expect gradual improvement 20 Update Cement Our analysis of a cross-section of cement companies
Cummins India. CMP: INR430 TP: INR462 Neutral
 BSE SENSEX S&P CNX 16,070 4,870 Bloomberg KKC IN Equity Shares (m) 277.2 52-Week Range (INR) 515/322 1,6,12 Rel. Perf. (%) -3/30/-4 M.Cap. (INR b) 119.2 M.Cap. (USD b) 2.2 17 May 2012 4QFY12 Results Update
Sohail Halai Alpesh Mehta
 BSE Sensex S&P CNX 20,039 6,064 Bloomberg IDBI IN Equity Shares (m) 1,278.4 M.Cap. (INR b)/(usd b) 144.9/2.7 52-Week Range (INR) 122/82 1,6,12 Rel.Perf.(%) -1/6/2 Financials & Valuation (INR b) Y/E March
Kotak Mahindra Bank. CMP: INR495 TP: INR429 Neutral
 BSE SENSEX S&P CNX 16,739 5,049 Bloomberg KMB IN Equity Shares (m) 689.3 52-Week Range 515/333 1,6,12 Rel.Perf.(%) 0/12/31 M.Cap. (Rs b) 340.5 M.Cap. (US$ b) 6.7 25 January 2012 3QFY12 Results Update Sector:
Idea Cellular. CMP: INR159 TP: INR200 Buy
 BSE SENSEX S&P CNX 19,164 5,678 Bloomberg IDEA IN Equity Shares (m) 3,316.2 M.Cap. (INR b) / (USD b) 513.7/8.4 52-Week Range (INR) 176/72 1, 6, 12 Rel. Per (%) 12/45/83 Financials & Valuation (INR Billion)
Kotak Mahindra Bank. CMP: INR626 TP: INR500 Neutral
 BSE SENSEX S&P CNX 18,759 5,705 Bloomberg KMB IN Equity Shares (m) 740.7 52-Week Range (INR) 652/418 1,6,12 Rel.Perf.(%) -3/-2/18 M.Cap. (INR b) 463.4 M.Cap. (USD b) 8.6 26 October 2012 2QFY13 Results
Jinesh Gandhi Sandipan Pal
 BSE Sensex S&P CNX 20,224 6,157 Bloomberg BCORP IN Equity Shares (m) 77.0 M.Cap. (INR b)/(usd b) 20.5/0.4 52-Week Range (INR) 342/202 1,6,12 Rel. Perf. (%) 6/-15/-23 Financials & Valuation (INR b) Y/E
Tata Power. CMP: INR111 TP: INR92 Neutral
 BSE SENSEX S&P CNX 17,749 5,382 Bloomberg TPWR IN Equity Shares (m) 2,373.3 52-Week Range (INR) 135/81 1,6,12 Rel. Perf. (%) 10/-5/-10 M.Cap. (INR b) 263.9 M.Cap. (USD b) 5.3 13 February 2012 3QFY12 Results
Canara Bank. CMP: INR464 TP: INR645 Buy
 BSE SENSEX S&P CNX 17,234 5,205 Bloomberg CBK IN Equity Shares (m) 443.0 52-Week Range (INR) 672/349 1,6, 12 Rel.Perf.(%) 22/2/-13 M.Cap. (INR b) 205.6 M.Cap. (USD b) 4.1 31 January 2012 3QFY12 Results
M&M Financial Services
 BSE SENSEX S&P CNX 18,793 5,717 Bloomberg MMFS IN Equity Shares (m) 102.7 52-Week Range (INR) 938/590 1,6,12 Rel.Perf.(%) 7/24/30 M.Cap. (INR b) 90.7 M.Cap. (USD b) 1.7 23 October 2012 2QFY13 Results Update
Siddharth Bothra
 BSE Sensex S&P CNX 19,152 5,797 Bloomberg CSTRL IN Equity Shares (m) 494.6 M.Cap. (INR b)/(usd b) 158/2.9 52-Week Range (INR) 338/223 1,6,12 Rel. Perf. (%) 12/-3/26 Financials & Valuation (INR b) Y/E March
Jinesh Gandhi Chirag Jain
 BSE Sensex S&P CNX 19,561 5,923 Bloomberg EIM IN Equity Shares (m) 27.0 M.Cap. (INR b)/(usd b) 72.0/1.3 52-Week Range 3,240/1,620 1,6,12 Rel. Perf. (%) -4/17/40 Financials & Valuation (INR b) Y/E Dec 2013E
Dabur India. CMP: INR106 TP: INR94 Neutral
 28 July 2011 1QFY12 Results Update Sector: FMCG BSE SENSEX S&P CNX 18,210 5,488 Dabur India CMP: INR106 TP: INR94 Neutral Bloomberg DABUR IN Equity Shares (m) 1,740.0 52-Week Range (INR) 122/87 1,6,12
Birla Corporation. CMP: INR216 TP: INR277 Buy
 BSE SENSEX S&P CNX 16,839 5,100 Bloomberg BCORP IN Equity Shares (m) 77.0 52-Week Range (INR) 348/211 1,6,12 Rel. Perf. (%) -5/-19/-25 M.Cap. (INR b) 16.6 M.Cap. (USD b) 0.3 30 July 2012 1QFY13 Results
BHEL. CMP: INR227 TP: INR233 Neutral
 BSE SENSEX S&P CNX 18,636 5,666 Bloomberg BHEL IN Equity Shares (m) 2,447.6 52-Week Range (INR) 368/198 1,6,12 Rel. Perf. (%) -7/-7/-35 M.Cap. (INR b) 556.2 M.Cap. (USD b) 10.3 30 October 2012 2QFY13 Results
Dabur India. CMP: INR130 TP: INR135 Neutral
 BSE SENSEX S&P CNX 18,625 5,664 29 October 2012 2QFY13 Results Update Sector: Consumer Dabur India CMP: INR130 TP: INR135 Neutral Bloomberg DABUR IN Equity Shares (m) 1,740.7 52-Week Range (Rs) 139/92
Jubilant Foodworks. CMP: INR1,051 TP: INR1,054 Neutral
 BSE SENSEX S&P CNX 16,420 4,966 Bloomberg JUBI IN Equity Shares (m) 63.5 52-Week Range (INR) 1,144/536 1,6,12 Rel. Perf. (%) -6/37/53 M.Cap. (INR b) 66.7 M.Cap. (USD b) 1.3 11 May 2012 4QFY12 Results Update
Cement. Demand to grow 8%, with cost push to be passed on CCI probe to have limited impact
 15 May 2012 Update Cement Demand to grow 8%, with cost push to be passed on CCI probe to have limited impact We met with senior managements of the large cement companies in India, to get perspective on
Maruti Suzuki. CMP: INR1,395 TP: INR1,730 Buy
 BSE SENSEX S&P CNX 18,431 5,598 Bloomberg MSIL IN Diluted Equity Shares (m) 302.1 52-Week Range (INR) 1,498/906 1,6,12 Rel.Perf.(%) 5/-5/20 M.Cap. (INR b) 421.3 M.Cap. (USD b) 7.8 31 October 2012 2QFY13
Godrej Consumer Products
 BSE SENSEX S&P CNX 18,755 5,698 Bloomberg GCPL IN Equity Shares (m) 340.3 52-Week Range (INR) 745/370 1,6,12 Rel. Perf. (%) 4/17/67 M.Cap. (INR b) 246.4 M.Cap. (USD b) 4.6 5 November 2012 2QFY13 Results
Jaypee Infratech. CMP: INR33 TP: INR45 Buy
 BSE SENSEX S&P CNX 2,550,318 Bloomberg JPIN IN Equity Shares (m) 1,388.9 M.Cap. (INR b) / (USD b) 51.3/0.9 52-Week Range (INR) 2/1 1,, 12 Rel. Per (%) 1/9/-3 Financials & Valuation (INR m) Y/E Mar 201
Shree Renuka Sugars. CMP: INR41 TP: INR50 Buy
 BSE SENSEX S&P CNX 18,202 5,532 Bloomberg SHRS IN Equity Shares (m) 671.0 52-Week Range (INR) 87/23 1,6,12 Rel. Perf. (%) 14/-39/-51 M.Cap. (INR b) 27.3 M.Cap. (USD b) 0.6 16 February 2012 5QSY12 Results
Axis Bank. CMP: INR1,119 TP: INR1,330 Buy
 BSE SENSEX S&P CNX 18,714 5,687 Bloomberg AXSB IN Equity Shares (m) 413.2 52-Week Range (INR) 1,309/785 1,6,12 Rel.Perf.(%) 9/-16/-8 M.Cap. (INR b) 462.4 M.Cap. (USD b) 8.7 16 October 2012 2QFY13 Results
Sandipan Pal QFY13 Results Update Sector: Real Estate Unitech CMP: INR29 TP: INR44 Buy
 BSE Sensex S&P CNX 19,608 5,933 Bloomberg UT IN Equity Shares (m) 2,438.8 M.Cap. (INR b)/(usd b) 70/1.3 52-Week Range (INR) 41/18 1,6,12 Rel. Perf. (%) -27/24/-13 Financials & Valuation (INR b) Y/E March
Oberoi Realty. CMP: INR269 TP: INR320 Buy
 BSE SENSEX S&P CNX 18,682 5,684 Bloomberg OBER IN Equity Shares (m) 328.2 52-Week Range (INR) 323/205 1,6,12 Rel. Perf. (%) 13/-7/7 M.Cap. (INR b) 88.3 M.Cap. (USD b) 1.6 22 October 2012 2QFY13 Results
Raymond. Restructuring initiatives bearing fruit; Land bank base case value INR147/share; Reiterate Buy. CMP: INR385 TP: INR462 Buy
 14 June 2012 Update Raymond CMP: INR385 TP: INR462 Buy Restructuring initiatives bearing fruit; Land bank base case value INR147/share; Reiterate Buy We met the management of Raymond (RW IN, Mkt Cap USD0.4b,
Punjab National Bank. CMP: INR768 TP: INR963 Buy
 BSE SENSEX S&P CNX 16,480 4,975 Bloomberg PNB IN Equity Shares (m) 339.2 52-Week Range (INR) 1,200/751 1,6,12 Rel.Perf.(%) -12/-16/-18 M.Cap. (INR b) 260.5 M.Cap. (USD b) 4.8 10 May 2012 4QFY12 Results
Hindustan Unilever. CMP:INR324 TP:INR302 Neutral
 BSE SENSEX S&P CNX 18,197 5,482 29 July 2011 1QFY12 Results Update Sector: FMCG Hindustan Unilever CMP:INR324 TP:INR302 Neutral Bloomberg HUVR IN Equity Shares (m) 2,159.5 52-Week Range (INR) 347/250 1,6,12
Urban demand revives; Akzo gaining market share
 BSE Sensex S&P CNX 22,095 6,601 CMP: INR889 26 March 2014 Update Sector: Consumer Not Rated Urban demand revives; Akzo gaining market share Reiterates focus on Profitable growth Urban demand for Decorative
Pantaloon Retail. CMP: INR177 TP: INR192 Neutral
 BSE SENSEX S&P CNX 17,773 5,390 Bloomberg PF IN Equity Shares (m) 217.1 52-Week Range (INR) 364/125 1,6,12 Rel. Perf. (%) 9/-49/-29 M.Cap. (Rs b) 38.4 M.Cap. (US$ b) 0.8 14 February 2012 2QFY12 Results
Amara Raja Batteries. CMP: INR517 TP: INR560 Buy
 BSE SENSEX S&P CNX 25,665 7,672 Bloomberg AMRJ IN Equity Shares (m) 170.8 M.Cap. (INR b) / (USD b) 88.2/1.4 52-Week Range (INR) 520/208 1, 6, 12 Rel. Per (%) 5/21/97 Financials & Valuation (INR Million)
Hardick Bora 4QCY12 Results Update Sector: Healthcare Sanofi India CMP: INR2,307 TP: INR2,015 Neutral
 BSE Sensex S&P CNX 19,332 5,855 Bloomberg SANL IN Equity Shares (m) 23.0 M.Cap. (INR b)/(usd b) 53.1/1.0 52-Week Range (INR) 2,450/2,002 1,6,12 Rel. Perf. (%) 9/-1/-4 Financials & Valuation (INR b) Y/E
Axis Bank. CMP: INR1,008 TP: INR1,240 Buy
 BSE SENSEX S&P CNX 16,739 5,049 Bloomberg AXSB IN Equity Shares (m) 410.5 52-Week Range 1,461/785 1,6,12 Rel.Perf.(%) 11/-9/-9 M.Cap. (INR b) 413.8 M.Cap. (USD b) 8.2 20 January 2012 Results Update Sector:
CMP: INR401 TP: INR516 Buy. * After ESOP charges; # Axon consolidated in December 2008
 19 October 2011 1QFY12 Results Update Sector: Technology BSE SENSEX S&P CNX 16,748 5,038 Bloomberg HCLT IN Equity Shares (m) 700.9 52-Week Range (INR) 528/360 1,6,12 Rel. Perf. (%) 4/-1/7 M.Cap. (INR b)
Punjab National Bank. CMP: INR940 TP: INR1,275 Buy
 BSE SENSEX S&P CNX 17,194 5,199 Bloomberg PNB IN Equity Shares (m) 316.8 52-Week Range (INR) 1,234/751 1,6,12 Rel.Perf.(%) 9/-10/-9 M.Cap. (INR b) 297.7 M.Cap. (USD b) 6.0 1 February 2012 3QFY12 Results
Coal India. CMP: INR322 TP: INR370 Buy
 BSE SENSEX S&P CNX 16,439 4,990 Bloomberg COAL IN Equity Shares (m) 6,316.4 52-Week Range (INR) 422/294 1,6,12 Rel. Perf. (%) -4/-3/-7 M.Cap. (INR b) 2,033.9 M.Cap. (USD b) 36.4 30 May 2012 4QFY12 Results
Oberoi Realty. CMP: INR264 TP: INR315 Buy
 BSE SENSEX S&P CNX 17,151 5,202 Bloomberg OBER IN Equity Shares (m) 328.2 52-Week Range (INR) 323/205 1,6,12 Rel. Perf. (%) 4/15/16 M.Cap. (INR b) 87.0 M.Cap. (USD b) 1.7 26 April 2012 4QFY12 Results Update
Godrej Properties. CMP: INR595 TP: INR635 Neutral
 BSE SENSEX S&P CNX 16,913 5,114 Bloomberg GPL IN Equity Shares (m) 78.0 52-Week Range 845/570 1,6,12 Rel. Perf. (%) 0/-9/-2 M.Cap. (INR b) 46.4 M.Cap. (USD b) 0.9 4QFY12 Results Update Sector: Real Estate
Thermax. CMP: INR522 TP: INR414 Neutral
 BSE SENSEX S&P CNX 17,605 5,326 Bloomberg TMX IN Equity Shares (m) 119.2 52-Week Range (INR) 720/388 1,6,12 Rel. Perf. (%) 14/1/-21 M.Cap. (INR b) 60.3 M.Cap. (USD b) 1.1 3 February 2012 3QFY12 Results
CMP: INR320 TP: INR164(-49%) Sell Intending to exit UK execution is key!
 Sell Intending to exit UK execution is key!") 31 March 2016 Update Sector: Metals Tata Steel BSE SENSEX S&P CNX 25,342 7,738 Stock Info Bloomberg TATA IN Equity Shares (m) 971.2 52-Week Range (INR) 384/200 1, 6, 12 Rel. Per (%) 18/54/10 M.Cap. (INR
31 March 2016 Update Sector: Metals Tata Steel BSE SENSEX S&P CNX 25,342 7,738 Stock Info Bloomberg TATA IN Equity Shares (m) 971.2 52-Week Range (INR) 384/200 1, 6, 12 Rel. Per (%) 18/54/10 M.Cap. (INR
Hindalco NEUTRAL. Performance highlights CMP. `112 Target Price - 1QFY2013 Result Update Base Metals. Investment Period -
 1QFY213 Result Update Base Metals August 21, 212 Hindalco Performance highlights Standalone (` cr) 1QFY13 1QFY12 % chg (yoy) 4QFY12 % chg (qoq) Net sales 5,964 5,979 (.2) 7,563 (21.1) EBITDA 463 868 (46.6)
Phoenix Mills. CMP: INR184 TP: INR255 Buy
 BSE SENSEX S&P CNX 16,439 4,990 Bloomberg PHNX IN Equity Shares (m) 144.8 52-Week Range (INR) 229/149 1,6,12 Rel. Perf. (%) -8/-5/10 M.Cap. (INR b) 26.8 M.Cap. (USD b) 0.5 30 May 2012 4QFY12 Results Update
Sun Pharmaceuticals. CMP: INR554 TP: INR614 Neutral
 BSE SENSEX S&P CNX 17,849 5,416 Bloomberg SUNP IN Equity Shares (m) 1,035.6 52-Week Range (INR) 566/404 1,6,12 Rel. Perf. (%) -3/10/31 M.Cap. (INR b) 573.7 M.Cap. (USD b) 11.6 15 February 2012 3QFY12 Results
Jinesh Gandhi Chirag Jain
 BSE Sensex S&P CNX 19,722 5,995 Bloomberg EIM IN Equity Shares (m) 27.0 M.Cap. (INR b)/(usd b) 88.1/1.6 52-Week Range (INR) 3,285/1,620 1,6,12 Rel. Perf. (%) 10/20/36 Financials & Valuation (INR b) Y/E
Godrej Properties. CMP: INR368 TP: INR420 Neutral
 BSE SENSEX S&P CNX 21,034 6,252 Bloomberg GPL IN Equity Shares (m) 99.6 M.Cap. (INR b) / (USD b) 36.4/ 0.7 52-Week Range (INR) 641/340 1, 6, 12 Rel. Per (%) -1/-44/-47 Financials & Valuation (INR b) Y/E
Shoppers Stop. CMP: INR339 TP: INR355 Neutral
 BSE SENSEX S&P CNX 20,684 6,145 Bloomberg SHOP IN Equity Shares (m) 83.1 M.Cap. (INR b) / (USD b) 28.1/0.5 52-Week Range (INR) 494/331 1, 6, 12 Rel. Per (%) -7/-16/-28 Financials & Valuation (INR b) Y/E
Market share recovery, price hike, content leverage to drive growth
 BSE Sensex S&P CNX 24,377 7,276 Stock Info Bloomberg DITV IN Equity Shares (m) 1,064.8 52-Week Range (INR) 71/40 1, 6, 12 Rel. Per (%) 6/-15/-41 M.Cap. (INR b) 58.2 M.Cap. (USD b) 1.0 Financial Snapshot
CPCB-2: Important long-term driver
 BSE Sensex S&P CNX 20,860 6,217 19 December 2013 Update Sector: Capital Goods Cummins India CMP: INR461 TP: INR540 Buy Stock Info Bloomberg KKC IN Equity Shares (m) 277.2 52-Week Range (INR) 550/365 1,
Hardick Bora QFY13 Results Update Sector: Healthcare Lupin CMP: INR725 TP: INR851 Buy
 BSE Sensex S&P CNX 19,990 6,069 Bloomberg LPC IN Equity Shares (m) 447.6 M.Cap. (INR b)/(usd b) 324.5/6.0 52-Week Range (INR) 739/507 1,6,12 Rel. Perf. (%) 9/18/13 Financials & Valuation (INR b) Y/E March
Godrej Consumer Products
 BSE SENSEX S&P CNX 16,739 5,049 Bloomberg GCPL IN Equity Shares (m) 323.6 52-Week Range (INR) 464/325 1,6,12 Rel. Perf. (%) 3/3/16 M.Cap. (INR b) 135.6 M.Cap. (USD b) 2.7 24 January 2012 3QFY12 Results
Jinesh Gandhi Sandipan Pal
 BSE Sensex S&P CNX 19,895 6,035 Bloomberg GRASIM IN Equity Shares (m) 91.7 M.Cap. (INR b)/(usd b) 275.8/5.2 52-Week Range (INR) 3,511/2,216 1,6,12 Rel. Perf. (%) -8/-12/-1 Financials & Valuation (INR b)
ITC. CMP: INR201 TP: INR230 Buy
 BSE SENSEX S&P CNX 16,739 5,049 Bloomberg ITC IN Equity Shares (m) 7,738.1 52-Week Range (INR) 211/149 1,6,12 Rel. Perf. (%) 3/23/38 M.Cap. (INR b) 1,601.0 M.Cap. (USD b) 32.1 21 January 2012 Results Update
Jinesh Gandhi Sandipan Pal
 BSE Sensex S&P CNX 19,576 5,944 Bloomberg GRASIM IN Equity Shares (m) 91.7 M.Cap. (INR b)/(usd b) 270.6/5.0 52-Week Range (INR) 3,511/2,216 1,6,12 Rel. Perf. (%) 2/-17/5 Financials & Valuation (INR b)
Cross service charges at INR m/quarter
 BSE SENSEX S&P CNX 19,636 5,940 Cummins India CMP: INR504 TP: INR585 Buy LHP products to be an important growth driver Cross service charges at INR100-200m/quarter 20 February 2013 Update Sector: Capital
CMP: INR156 TP: INR216 (+38%) Buy To generate free cash flows for first time in 10 years
 Buy To generate free cash flows for first time in 10 years") BSE SENSEX S&P CNX 28,005 8,624 Stock Info Bloomberg HNDL IN Equity Shares (m) 2,065.2 52-Week Range (INR) 157/59 1, 6, 12 Rel. Per (%) 13/108/71 M.Cap. (INR b)/ (USD b) 322.2/ 4.8 Avg Val,(INR m) 1,140
BSE SENSEX S&P CNX 28,005 8,624 Stock Info Bloomberg HNDL IN Equity Shares (m) 2,065.2 52-Week Range (INR) 157/59 1, 6, 12 Rel. Per (%) 13/108/71 M.Cap. (INR b)/ (USD b) 322.2/ 4.8 Avg Val,(INR m) 1,140
Torrent Pharmaceuticals
 BSE SENSEX S&P CNX 21,338 6,339 Bloomberg TRP IN Equity Shares (m) 169.2 M.Cap. (INR b) / (USD b) 80.4/1.3 52-Week Range (INR) 535/324 1, 6, 12 Rel.Per (%) 4/12/32 Financials & Valuation (INR Million)
Just Dial. CMP: INR1,129 TP: INR1,475 Buy
 BSE SENSEX S&P CNX 23,871 7,109 Bloomberg JUST IN Equity Shares (m) 70.2 M.Cap. (INR b) / (USD b) 79.2/1.3 52-Week Range (INR) 1,774/589 1, 6, 12 Rel. Per (%) -18/-7/- Financials & Valuation (INR m) Y/E
ECOSCOPE. Real GDP growth eases on lower net indirect taxes. The Economy Observer. Real GVA growth exactly as expected
 31 August 2016 ECOSCOPE The Economy Observer Real GDP growth eases on lower net indirect taxes Real GVA growth exactly as expected India s real gross domestic product (GDP) grew at the slowest pace in
Jindal Steel & Power. CMP: INR274 TP: INR379 Buy
 BSE SENSEX S&P CNX 25,665 7,672 Bloomberg JSP IN Equity Shares (m) 914.9 M.Cap. (INR b) / (USD b) 250.9/4.1 52-Week Range (INR) 350/190 1, 6, 12 Rel. Per (%) -15/-14/3 Financials & Valuation (INR Billion)
Hardick Bora 4QFY13 Results Update Sector: Healthcare Dr Reddy's Laboratories CMP: INR2,026 TP: INR2,375 Buy
 BSE Sensex S&P CNX 19,772 5,995 Bloomberg DRRD IN Equity Shares (m) 169.2 M.Cap. (INR b)/(usd b) 344/6.3 52-Week Range (INR) 2,151/1,528 1,6,12 Rel. Perf. (%) -2/9/0 Financials & Valuation (INR b) Y/E
Tribhovandas Bhimji Zaveri
 24 April 2012 Update CMP INR TP INR TRIBHOVANDAS BHIMJI ZAVERI Pure jewellery retail play with strong brand; Execution risks priced in; Subscribe (TBZ) is a pure play on the fast-growing branded jewellery
Alpesh Mehta Sohail Halai
 BSE Sensex S&P CNX 19,664 5,969 Bloomberg IIB IN Equity Shares (m) 521.8 M. Cap. (INR b)/(usd b) 227/4.1 52-Week Range (INR) 441/242 1,6,12 Rel.Perf.(%) 3/15/52 Financials & Valuation (INR b) Y/E March
Expect capacity-led rerating; maintain Buy
 BSE SENSEX S&P CNX 27,238 8,400 Stock Info Bloomberg SRCM IN Equity Shares (m) 34.8 52-Week Range (INR) 18519/9350 1, 6, 12 Rel. Per (%) -2/-3/32 M.Cap. (INR b) 523.7 M.Cap. (USD b) 7.7 Avg Val, INRm 216.4
Dabur India. Neutral. Rs93
 3QFY11 Results Update SECTOR: FMCG BSE SENSEX S&P CNX 18,022 5,417 Bloomberg DABUR IN Equity Shares (m) 1,738.0 52-Week Range (Rs) 112/79 1,6,12 Rel. Perf. (%) 5/-5/2 M.Cap. (Rs b) 160.8 M.Cap. (US$ b)
Punjab National Bank. CMP: INR760 TP: INR964 Buy Asset quality deteriorates; asset-liability well-matched Highlights of FY12 Annual Report
 BSE SENSEX S&P CNX 16,706 5,064 19 June 2012 Annual Report Update Sector: Financials Punjab National Bank CMP: INR760 TP: INR964 Buy Asset quality deteriorates; asset-liability well-matched Highlights