Dabur India. CMP: INR106 TP: INR94 Neutral
|
|
|
- Dorcas Higgins
- 5 years ago
- Views:
Transcription
 122/87 1,6,12 Rel. Perf. (%) -5/12/5 M.Cap. (INR b) 184.4 M.Cap. (USD b) 4.1 Key takeaways from the concall Dabur India's (DABUR) 1QFY12 domestic volume grew 7.")

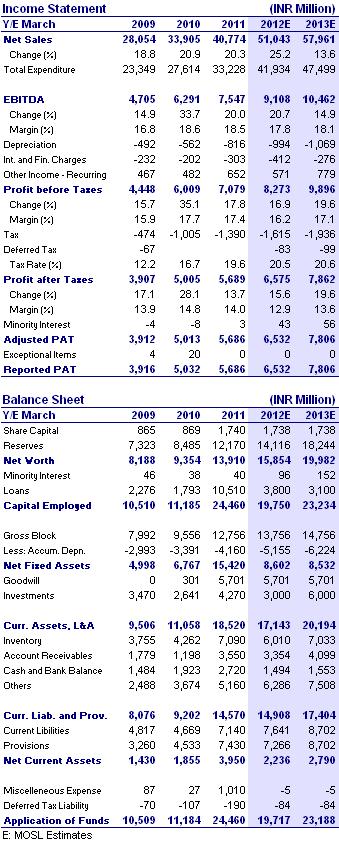
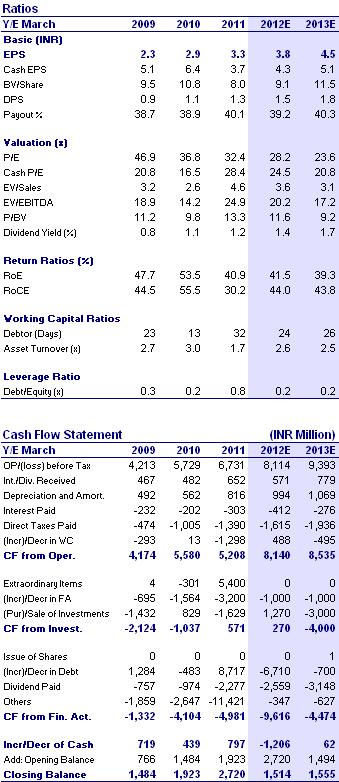
1 28 July QFY12 Results Update Sector: FMCG BSE SENSEX S&P CNX 18,210 5,488 Dabur India CMP: INR106 TP: INR94 Neutral Bloomberg DABUR IN Equity Shares (m) 1, Week Range (INR) 122/87 1,6,12 Rel. Perf. (%) -5/12/5 M.Cap. (INR b) M.Cap. (USD b) 4.1 Key takeaways from the concall Dabur India's (DABUR) 1QFY12 domestic volume grew 7.5% impacted by a decline in shampoo sales, flat volume growth in Dabur Amla and a decline in glucose sales owing to a weak summer. DABUR took price increases of 3.5-4% in 1QFY12 and plans to increase prices again at the end of 2QFY12 to recover lost gross margins. The average price increase impact in FY12 is expected to be 9-10%. Advertising spends are likely to be maintained at ~13.5% in FY12. The management indicated that maintaining FY11 margins would be challenging. In shampoos, DABUR expects to return to year on year growth from 2QFY12 but profitability is likely to continue to be under pressure. DABUR plans to merge its CHD division with the CCD division to expand the CHD franchise and leverage the distribution strength of the CCD division. On an LTL basis, Hobi revenues increased 14% and Namaste revenues grew ~22%. Hobi margins are likely to be 12-13% and Namaste's margins are expected to be in the high teens in FY12. Organic growth outlook challenging, margin pressure to persist; Neutral The standalone business continues to face headwinds owing to (1) rising competitive intensity in key categories like shampoos, skin care and hair oils, (2) continued pressure on margins due to an inflationary input cost environment and (3) inadequate price increases. Although DABUR has tried to preserve margins by cutting ad-spends for the second consecutive quarter, lower ad spends and promotions can start impacting the brand salience in highly competitive categories. Organic growth in the international business improved from 4QFY11 levels but is moderate at 12.5%. We expect slow recovery given (1) unrest in Levant markets and (2) pricing restrictions in some geographies. Recovery in the Middle East/Africa and the successful integration of Hobi and Namaste will determine the international business division's (IBD) growth trajectory after 3QFY12. The stock trades at 28.2x FY12E and 23.6x FY13E EPS of INR3.8 and INR4.5. Neutral. Amnish Aggarwal (AmnishAggarwal@MotilalOswal.com); Tel: Harit Kapoor (Harit.Kapoor@MotilalOswal.com); Tel:
2 Key takeaways from the concall Dabur India's (DABUR) 1QFY12 domestic volume grew 7.5% impacted by a decline in shampoo sales, flat volume growth in Dabur Amla and a decline in glucose sales owing to a weak summer. DABUR took price increases of 3.5-4% in 1QFY12 and plans to increase prices again at the end of 2QFY12 to recover lost gross margins. The average price increase impact in FY12 is expected to be 9-10%. Advertising spends are likely to be maintained at ~13.5% in FY12. The management indicated that maintaining FY11 margins would be challenging. In shampoos, DABUR expects to return to year on year growth from 2QFY12 but profitability is likely to continue to be under pressure. DABUR plans to merge its CHD division with the CCD division to expand the CHD franchsie and leverage the distribution strength of the CCD division. On an LTL basis, Hobi revenues increased 14% and Namaste revenues grew ~22%. Hobi margins are likely to be 12-13% and Namaste's margins are expected to be in the high teens in FY12. DABUR consolidated segmental numbers: EBIT margin contraction Year Ended March 1QFY12 1QFY11 % Chg Net Sales (INR m) 12,162 9, Consumer Care 9,500 7, Consumer Health Foods 1,567 1, Retail Others EBIT (INR m) 2,332 1, Consumer Care 1,922 1, Consumer Health Foods Retail Others EBIT Margin % Consumer Care Consumer Health Foods Retail Others Source: Company/MOSL Volume growth declined to 8.6%; Standalone was EBITDA up 4.4% Consolidated sales increased 31.4%, of which 18% was acquisition driven. Volume growth in 1QFY12 moderated to 8.6%, impacted by a 19.2% decline in shampoo sales and flat growth in health supplements. Gross margins contracted 480bp to 47.8% as price increases were not passed on in line with input costs increases. A 380bp decline in advertising spends restricted EBITDA margin contraction to 70bp at 14.2%. Higher other income (up 56%) boosted PAT growth to 19.6% to INR1,277m. Domestic sales grew 12.6% to INR 8.4b, gross margins contracted 590bp to 44.1%, a 390bp reduction in ad spends (16.8% absolute decline) restricted EBITDA margin contraction to 110bp at 13.8%. EBITDA increased by only 4.4% and 59% growth in other income enabled adjusted PAT growth of 1.8% to INR 911m. 28 July
3 Acquisition contribution to net sales growth 18% Second consecutive quarter of single digit volume growth 27.2 Net Sales (Rs m) Grow th (% YoY) Volume grow th (%) Source: Company/MOSL EBITDA (Rs m) EBITDA Margins (%) Mar-09 Jun-09 Sep-09 Dec-09 Mar-10 Jun-10 Sep-10 Dec-10 Mar-11 Jun-11 1,296 1,182 1,754 1,773 1,620 1,367 2,028 2,095 2,056 1,708 Jun-09 Sep-09 Dec-09 Mar-10 Jun-10 Sep-10 Dec-10 Mar-11 Jun-11 Jun-09 Sep-09 Dec-09 Mar-10 Jun-10 Sep-10 Dec-10 Mar-11 Jun-11 7,683 8,480 9,262 8,488 9,165 9,728 10,800 11,082 12, bp decline in ad spends restricts EBITDA margin contraction Source: Company/MOSL Flat volumes in Dabur Amla, fall in shampoo sales hit volume growth The 16.1% growth in hair oils was led by a 41.1% growth in Vatika hair oil, with Dabur Amla sales increasing by 9.5% (flat volume growth). DABUR's hair oil growth was significantly lower than Marico's 32% volume growth, led by product innovations and geographical expansion. Toothpaste growth was 14.1% with YoY market share increasing 80bp to 14.4%. Oral care increased by a 12.7% increase in sales. Skin care growth of 16.3% was led by 18.6% growth in the Fem portfolio, though Gulabari sales were subdued due to a high base effect. Home care grew 24.9% as all three brands reported healthy growth. Foods grew 31.5%, and were the highlight of the quarter with Real fruit juices growing 38.8% and Hommade growing by double digits. The CHD (Consumer Health Division) grew 11.4% with ethicals growing 13.8%. We believe price increases in the domestic portfolio are likely to follow in the coming quarters, which could impact future volume growth. 28 July
4 Weak performance by shampoos, health supplements Category Growth (%) FY08 FY09 FY10 1QFY11 1HFY11 2QFY11 3QFY11 4QFY11 1QFY12 Hair Care Health Supplements Oral Care Foods Digestives Skin care Home Care IBD (organic) Source: Company/MOSL Global margins stable, 12.5% organic revenue growth as Levant region faces pressure DABUR's international business organic sales (55% of IBD) increased 12.5% in constant currency terms, impacted by political turmoil in Libya, Syria and Yemen. Egypt and GCC sales increased 30%, indicating strong recovery from economic unrest in the regions. Reported sales increased 99% as Hobi and Namaste were fully consolidated in 1QFY12. Hobi posted revenue of INR 341m and Namaste's sales were INR1,306m. Subsidiaries' margins were 14.5%, up 10bp YoY and 180bp QoQ. A rebound in sales growth in GCC and Egypt bodes well for margin recovery. Political unrest in the Levant countries are likely to keep IBD growth subdued over the next few quarters. Adspend cuts unsustainable, organic growth outlook challenging; Neutral The standalone business continues to face headwinds due to (1) rising competitive intensity in key categories like shampoos, skin care and hair oils, (2) continued pressure on margins due to an inflationary input cost environment and (3) inadequate price increases. Although DABUR tried to preserve margins by cutting adspends for the second consecutive quarter, lower adspends and promotions can impact brand salience in highly competitive categories. Organic growth in the global business improved from 4QFY11 levels but is moderate at 12.5%. We expect slow recovery given (1) unrest in Levant markets and (2) pricing restrictions in some geographies. Recovery in the Middle East/Africa and the successful integration of Hobi and Namaste will determine IBD's growth trajectory after 3QFY12. The stock trades at 29.4x FY12E and 24.6xFY13E EPS of INR 3.8 and INR 4.5. Neutral. 28 July
5 Dabur India: an investment profile Company description Dabur India (DABUR) is the second largest FMCG company in India, in terms of product portfolio and the market leader in the Chyawanprash category. It is increasing its presence in other traditional categories like hair care, oral care, household care and foods. Dabur's acquisition of Fem Care has given it a strategic presence in the high potential skin care segment. Key investment arguments Strong herbal positioning with little competition from MNC in categories like hair oil, CHD and health supplements. DABUR has the second broadest product portfolio (after HUL) with a presence in high potential categories like skin care, hair care, oral care and health supplements. DABUR is likely to be under MAT for 7-8 years, resulting in huge tax savings. Key investment risks Dabur has witnessed continued deceleration in standalone sales over the past three quarters and has been highly dependant on international business for PAT growth. We believe DABUR will face stiffer competition in some key business segments: (1) toothpaste (with the Comparative valuations Dabur Marico GCPL P/E (x) FY12E FY13E P/BV (x) FY12E FY13E EV/Sales (x) FY12E FY13E EV/EBITDA (x) FY12E FY13E likely entry of P&G), (2) hair oil (aggressive strategy by Marico and Emami), (3) shampoo (aggressive strategy by P&G, HUL and Garnier resulting in a squeeze in sales growth and margins) and (4) skin care (rising focus of MNCs on the mass to mid-premium segment). Recent developments DABUR increased prices by 3-4% in 1Q FY12 to offset input cost pressure. DABUR completed acquisition of the Namaste group and the business is being consolidated from 4QFY11. Valuation and view Our EPS estimate is INR3.8 for FY12 and INR4.5 for FY13, implying PAT CAGR of 18% over FY The stock trades at 28.2x FY12E of INR3.8 and 23.6x FY13E EPS of INR4.5. Maintain Neutral. Sector view We have a cautious view on the sector given slower income growth in the economy, which might impact volumes and profit margins. Companies with low competitive pressure and broad product portfolios will be able to better withstand a slowdown in a segment. Longer term prospects appear bright, given rising incomes and low penetration. EPS: MOSL forecast v/s consensus (INR) MOSL Consensus Variation Forecast Forecast (%) FY FY Target Price and Recommendation Current Target Upside Reco. Price (INR) Price (INR) (%) Neutral Stock performance (1 year) Shareholding pattern (%) Jun-11 Mar-11 Jun-10 Promoter Domestic Inst Dabur Sensex - Rebased Foreign Others Jul-10 Oct-10 Jan-11 Apr-11 Jul July
6 Financials and Valuation 28 July
7 NOTES 28 July
8 Disclosures This report is for personal information of the authorized recipient and does not construe to be any investment, legal or taxation advice to you. This research report does not constitute an offer, invitation or inducement to invest in securities or other investments and Motilal Oswal Securities Limited (hereinafter referred as MOSt) is not soliciting any action based upon it. This report is not for public distribution and has been furnished to you solely for your information and should not be reproduced or redistributed to any other person in any form. Unauthorized disclosure, use, dissemination or copying (either whole or partial) of this information, is prohibited. The person accessing this information specifically agrees to exempt MOSt or any of its affiliates or employees from, any and all responsibility/liability arising from such misuse and agrees not to hold MOSt or any of its affiliates or employees responsible for any such misuse and further agrees to hold MOSt or any of its affiliates or employees free and harmless from all losses, costs, damages, expenses that may be suffered by the person accessing this information due to any errors and delays. The information contained herein is based on publicly available data or other sources believed to be reliable. While we would endeavour to update the information herein on reasonable basis, MOSt and/or its affiliates are under no obligation to update the information. Also there may be regulatory, compliance, or other reasons that may prevent MOSt and/or its affiliates from doing so. MOSt or any of its affiliates or employees shall not be in any way responsible and liable for any loss or damage that may arise to any person from any inadvertent error in the information contained in this report. MOSt or any of its affiliates or employees do not provide, at any time, any express or implied warranty of any kind, regarding any matter pertaining to this report, including without limitation the implied warranties of merchantability, fitness for a particular purpose, and non-infringement. The recipients of this report should rely on their own investigations. This report is intended for distribution to institutional investors. Recipients who are not institutional investors should seek advice of their independent financial advisor prior to taking any investment decision based on this report or for any necessary explanation of its contents. MOSt and/or its affiliates and/or employees may have interests/positions, financial or otherwise in the securities mentioned in this report. To enhance transparency, MOSt has incorporated a Disclosure of Interest Statement in this document. This should, however, not be treated as endorsement of the views expressed in the report. Disclosure of Interest Statement Dabur India 1. Analyst ownership of the stock No 2. Group/Directors ownership of the stock No 3. Broking relationship with company covered No 4. Investment Banking relationship with company covered No Analyst Certification The views expressed in this research report accurately reflect the personal views of the analyst(s) about the subject securities or issues, and no part of the compensation of the research analyst(s) was, is, or will be directly or indirectly related to the specific recommendations and views expressed by research analyst(s) in this report. The research analysts, strategists, or research associates principally responsible for preparation of MOSt research receive compensation based upon various factors, including quality of research, investor client feedback, stock picking, competitive factors and firm revenues. Regional Disclosures (outside India) This report is not directed or intended for distribution to or use by any person or entity resident in a state, country or any jurisdiction, where such distribution, publication, availability or use would be contrary to law, regulation or which would subject MOSt & its group companies to registration or licensing requirements within such jurisdictions. For U.K. This report is intended for distribution only to persons having professional experience in matters relating to investments as described in Article 19 of the Financial Services and Markets Act 2000 (Financial Promotion) Order 2005 (referred to as "investment professionals"). This document must not be acted on or relied on by persons who are not investment professionals. Any investment or investment activity to which this document relates is only available to investment professionals and will be engaged in only with such persons. For U.S. MOSt is not a registered broker-dealer in the United States (U.S.) and, therefore, is not subject to U.S. rules. In reliance on the exemption from registration provided by Rule 15a-6 of the U.S. Securities Exchange Act of 1934, as amended (the "Exchange Act") and interpretations thereof by the U.S. Securities and Exchange Commission ("SEC") in order to conduct business with Institutional Investors based in the U.S., Motilal Oswal has entered into a chaperoning agreement with a U.S. registered broker-dealer, Marco Polo Securities Inc. ("Marco Polo"). This report is intended for distribution only to "Major Institutional Investors" as defined by Rule 15a-6(b)(4) of the Exchange Act and interpretations thereof by SEC (henceforth referred to as "major institutional investors"). This document must not be acted on or relied on by persons who are not major institutional investors. Any investment or investment activity to which this document relates is only available to major institutional investors and will be engaged in only with major institutional investors. The Research Analysts contributing to the report may not be registered /qualified as research analyst with FINRA. Such research analyst may not be associated persons of the U.S. registered broker-dealer, Marco Polo and therefore, may not be subject to NASD rule 2711 and NYSE Rule 472 restrictions on communication with a subject company, public appearances and trading securities held by a research analyst account. Motilal Oswal Securities Ltd 3rd Floor, Hoechst House, Nariman Point, Mumbai Phone: (91-22) Fax: (91-22) reports@motilaloswal.com 28 July
Dabur India. Neutral. Rs93
 3QFY11 Results Update SECTOR: FMCG BSE SENSEX S&P CNX 18,022 5,417 Bloomberg DABUR IN Equity Shares (m) 1,738.0 52-Week Range (Rs) 112/79 1,6,12 Rel. Perf. (%) 5/-5/2 M.Cap. (Rs b) 160.8 M.Cap. (US$ b)
Dabur India. CMP: INR130 TP: INR135 Neutral
 BSE SENSEX S&P CNX 18,625 5,664 29 October 2012 2QFY13 Results Update Sector: Consumer Dabur India CMP: INR130 TP: INR135 Neutral Bloomberg DABUR IN Equity Shares (m) 1,740.7 52-Week Range (Rs) 139/92
Asian Paints. CMP: INR2,722 TP: INR3,161 Buy
 BSE SENSEX S&P CNX 16,739 5,049 Bloomberg APNT IN Equity Shares (m) 95.9 52-Week Range (INR) 3,366/2,395 1,6,12 Rel. Perf. (%) -5/-3/14 M.Cap. (INR b) 261.1 M.Cap. (USD b) 4.9 23 January 2012 3QFY12 Results
Pidilite Industries. CMP: INR164 TP: INR186 Buy
 BSE SENSEX S&P CNX 16,640 5,043 Bloomberg PIDI IN Equity Shares (m) 506.1 52-Week Range (INR) 188/134 1,6,12 Rel. Perf. (%) 1/20/5 M.Cap. (INR b) 83.0 M.Cap. (USD b) 1.5 27 July 2012 1QFY13 Results Update
Hindustan Unilever. CMP:INR324 TP:INR302 Neutral
 BSE SENSEX S&P CNX 18,197 5,482 29 July 2011 1QFY12 Results Update Sector: FMCG Hindustan Unilever CMP:INR324 TP:INR302 Neutral Bloomberg HUVR IN Equity Shares (m) 2,159.5 52-Week Range (INR) 347/250 1,6,12
Titan Industries. CMP: INR222 TP: INR220 Neutral
 BSE SENSEX S&P CNX 17,257 5,241 Bloomberg TTAN IN Equity Shares (m) 887.8 52-Week Range (INR) 255/154 1,6,12 Rel. Perf. (%) -1/13/3 M.Cap. (Rs b) 197.1 M.Cap. (US$ b) 3.6 2 August 2012 1QFY13 Results Update
Jubilant Foodworks. CMP: INR1,189 TP: INR1,0541,054 Neutral
 BSE SENSEX S&P CNX 16,846 5,110 Bloomberg JUBI IN Equity Shares (m) 63.5 52-Week Range (INR) 1,189/633 1,6,12 Rel. Perf. (%) 4/38/47 M.Cap. (INR b) 75.5 M.Cap. (USD b) 1.3 26 July 2012 1QFY13 Results Update
Godrej Consumer Products
 BSE SENSEX S&P CNX 17,602 5,337 Bloomberg GCPL IN Equity Shares (m) 340.3 52-Week Range (INR) 658/370 1,6,12 Rel. Perf. (%) 5/37/42 M.Cap. (INR b) 205.9 M.Cap. (USD b) 3.7 7 August 2012 1QFY13 Results
CMP: INR121 TP: INR193 Buy
 BSE SENSEX S&P CNX 17,085 5,139 20 October 2011 2QFY12 Results Update Sector: Metals Hindustan Zinc CMP: INR121 TP: INR193 Buy Bloomberg HZ IN Equity Shares (m) 4,225.3 52-Week Range (INR) 155/109 1,6,12
Unitech. CMP: INR20 TP: INR30 Buy
 BSE SENSEX S&P CNX 16,328 4,943 Bloomberg UT IN Equity Shares (m) 2,438.8 52-Week Range (INR) 38/17 1,6,12 Rel. Perf. (%) -25/-14/-34 M.Cap. (INR b) 48.8 M.Cap. (USD b) 0.9 16 May 2012 4QFY12 Results Update
Jubilant Foodworks. CMP: INR1,051 TP: INR1,054 Neutral
 BSE SENSEX S&P CNX 16,420 4,966 Bloomberg JUBI IN Equity Shares (m) 63.5 52-Week Range (INR) 1,144/536 1,6,12 Rel. Perf. (%) -6/37/53 M.Cap. (INR b) 66.7 M.Cap. (USD b) 1.3 11 May 2012 4QFY12 Results Update
IndusInd Bank. CMP: INR345 TP: INR419 Buy
 BSE SENSEX S&P CNX 17,504 5,332 Bloomberg IIB IN Equity Shares (m) 467.7 52-Week Range (INR) 352/222 1,6,12 Rel.Perf.(%) 13/25/34 M.Cap. (INR b) 161.4 M.Cap. (USD b) 3.1 20 April 2012 4QFY12 Results Update
Larsen & Toubro. CMP: INR1,160 TP: INR1,417 Buy
 BSE SENSEX S&P CNX 16,216 4,908 Bloomberg LT IN Equity Shares (m) 608.9 52-Week Range (INR) 1,868/971 1,6,12 Rel. Perf. (%) -4/-7/12 M.Cap. (INR b) 706.3 M.Cap. (USD b) 13.1 * Consolidated; EPS is fully
Punjab National Bank. CMP:INR1,103 TP:INR1,500 Buy
 BSE SENSEX S&P CNX 18,210 5,488 28 July 2011 1QFY12 Results Update Sector: Banking Punjab National Bank CMP:INR1,103 TP:INR1,500 Buy Bloomberg PNB IN Equity Shares (m) 316.8 52-Week Range (INR) 1,395/971
IDBI Bank. CMP: INR106 TP: INR121 Neutral
 BSE SENSEX S&P CNX 17,207 5,223 Bloomberg IDBI IN Equity Shares (m) 1,278.4 52-Week Range (INR) 154/77 1,6,12 Rel.Perf.(%) -1/0/-7 M.Cap. (INR b) 135.5 M.Cap. (USD b) 2.6 24 April 2012 4QFY12 Results Update
Godrej Consumer Products
 3QFY11 Results Update SECTOR: FMCG BSE SENSEX S&P CNX 19,151 5,743 Rs400 Godrej Consumer Products Neutral Bloomberg GCPL IN Equity Shares (m) 323.6 52-Week Range (Rs) 480/225 1,6,12 Rel. Perf. (%) 7/6/46
Godawari Power & Ispat
 BSE SENSEX S&P CNX CMP: INR103 TP: INR185 Buy 17,077 5,158 Bloomberg GODPI IN Equity Shares (m) 31.8 52-Week Range (INR) 200/70 1,6,12 Rel. Perf. (%) 32/-31/-33 M.Cap. (INR b) 3.3 M.Cap. (USD m) 65.3 Consolidated
BGR Energy. CMP: INR284 TP: INR296 Neutral
 BSE SENSEX S&P CNX 16,312 4,951 Bloomberg BGRL IN Equity Shares (m) 72.0 52-Week Range (INR) 512/173 1,6,12 Rel. Perf. (%) -8/8/-31 M.Cap. (INR b) 20.5 M.Cap. (USD b) 0.4 31 May 2012 4QFY12 Results Update
NTPC CMP: INR169 TP: INR191 Buy
 BSE SENSEX S&P CNX 18,625 5,664 Bloomberg NTPC IN Equity Shares (m) 8,245.5 52-Week Range (INR) 190/139 1,6,12 Rel. Perf. (%) 3/-4/-11 M.Cap. (INR b) 1,393.5 M.Cap. (USD b) 26.0 26 October 2012 2QFY13
Larsen & Toubro. CMP: INR1,278 TP: INR1,380 Buy
 BSE SENSEX S&P CNX 16,786 5,050 Bloomberg LT IN Equity Shares (m) 608.9 52-Week Range (INR) 1,933/971 1,6,12 Rel. Perf. (%) 20/-19/-11 M.Cap. (INR b) 778.1 M.Cap. (USD b) 15.5 * Consolidated; EPS is fully
Kotak Mahindra Bank. CMP: INR495 TP: INR429 Neutral
 BSE SENSEX S&P CNX 16,739 5,049 Bloomberg KMB IN Equity Shares (m) 689.3 52-Week Range 515/333 1,6,12 Rel.Perf.(%) 0/12/31 M.Cap. (Rs b) 340.5 M.Cap. (US$ b) 6.7 25 January 2012 3QFY12 Results Update Sector:
BGR Energy. CMP: INR282 TP: INR253 Neutral
 BSE SENSEX S&P CNX 17,413 5,283 Bloomberg BGRL IN Equity Shares (m) 72.0 52-Week Range (INR) 378/173 1,6,12 Rel. Perf. (%) -9/17/-22 M.Cap. (INR b) 20.3 M.Cap. (USD b) 0.4 6 August 2012 1QFY13 Results
BGR Energy. CMP: INR266 TP: INR230 Neutral
 BSE SENSEX S&P CNX 18,562 5,645 Bloomberg BGRL IN Equity Shares (m) 72.0 52-Week Range (INR) 374/173 1,6,12 Rel. Perf. (%) -3/27/-24 M.Cap. (INR b) 19.2 M.Cap. (USD b) 0.4 3 November 2012 2QFY13 Results
Godrej Consumer Products
 BSE SENSEX S&P CNX 18,755 5,698 Bloomberg GCPL IN Equity Shares (m) 340.3 52-Week Range (INR) 745/370 1,6,12 Rel. Perf. (%) 4/17/67 M.Cap. (INR b) 246.4 M.Cap. (USD b) 4.6 5 November 2012 2QFY13 Results
Canara Bank. CMP: INR464 TP: INR645 Buy
 BSE SENSEX S&P CNX 17,234 5,205 Bloomberg CBK IN Equity Shares (m) 443.0 52-Week Range (INR) 672/349 1,6, 12 Rel.Perf.(%) 22/2/-13 M.Cap. (INR b) 205.6 M.Cap. (USD b) 4.1 31 January 2012 3QFY12 Results
Sanofi India. CMP: INR2,200 TP: INR1,848 Neutral
 BSE SENSEX S&P CNX 16,846 5,110 Bloomberg SANL IN Equity Shares (m) 23.0 52-Week Range (INR) 2,430/1,980 1,6,12 Rel. Perf. (%) 3/-3/15 M.Cap. (INR b) 50.7 M.Cap. (USD b) 0.9 26 July 2012 2QCY12 Results
Jaiprakash Associates
 BSE SENSEX S&P CNX 16,312 4,951 Bloomberg JPA IN Equity Shares (m) 2,126.5 52-Week Range (INR) 89/50 1,6,12 Rel. Perf. (%) -14/-4/-17 M.Cap. (INR b) 127.9 M.Cap. (USD b) 2.3 31 May 2012 4QFY12 Results
Canara Bank. CMP: INR419 TP: INR525 Buy
 BSE SENSEX S&P CNX 18,817 5,724 Bloomberg CBK IN Equity Shares (m) 443.0 52-Week Range (INR) 566/349 1,6, 12 Rel.Perf.(%) -7/-18/-17 M.Cap. (INR b) 170.3 M.Cap. (USD b) 3.0 7 November 2012 2QFY13 Results
Hardick Bora
 BSE Sensex S&P CNX 19,990 6,069 Bloomberg JOL IN Equity Shares (m) 159.3 M.Cap. (INR b)/(usd b) 26.0/0.5 52-Week Range (INR) 248/154 1,6,12 Rel. Perf. (%) -18/-28/-34 Financials & Valuation (INR b) Y/E
Cummins India. CMP: INR430 TP: INR462 Neutral
 BSE SENSEX S&P CNX 16,070 4,870 Bloomberg KKC IN Equity Shares (m) 277.2 52-Week Range (INR) 515/322 1,6,12 Rel. Perf. (%) -3/30/-4 M.Cap. (INR b) 119.2 M.Cap. (USD b) 2.2 17 May 2012 4QFY12 Results Update
Reliance Infrastructure CMP: INR528
 BSE SENSEX S&P CNX 17,657 5,363 16 August 2012 1QFY13 Results Update Sector: Utilities Reliance Infrastructure CMP: INR528 Buy Bloomberg RELI IN Equity Shares (m) 267.5 52-Week Range (INR) 680/328 1,6,12
Idea Cellular. CMP: INR81 TP: INR Under Review
 BSE SENSEX S&P CNX 16,918 5,128 Bloomberg IDEA IN Equity Shares (m) 3,308.8 52-Week Range (INR) 104/71 1,6,12 Rel. Perf. (%) 6/-13/4 M.Cap. (INR b) 268.0 M.Cap. (USD b) 4.8 25 July 2012 1QFY13 Results
Niket Shah
 BSE Sensex S&P CNX 20,213 6,147 Bloomberg VGRD IN Equity Shares (m) 29.8 M.Cap. (INR b)/(usd b) 14.6/0.3 52-Week Range (INR) 591/180 1,6,12 Rel. Perf. (%) -8/-6/138 Financial summary (INR b) Y/E March
Sanjay Jain Pavas Pethia
 BSE Sensex S&P CNX 19,561 5,923 Bloomberg SAIL IN Equity Shares (m) 4,130.4 M.Cap. (INR b)/(usd b) 334.6/6.2 52-Week Range (INR) 116/76 1,6,12 Rel. Perf. (%) -11/-17/-38 Financials & Valuation (INR b)
Punjab National Bank. CMP: INR716 TP: INR950 Buy
 BSE SENSEX S&P CNX 16,839 5,100 Bloomberg PNB IN Equity Shares (m) 339.2 52-Week Range (INR) 1,144/703 1,6,12 Rel.Perf.(%) -8/-24/-28 M.Cap. (INR b) 242.8 M.Cap. (USD b) 4.4 30 July 2012 1QFY13 Results
Shree Renuka Sugars. CMP: INR26 TP: INR45 Buy
 BSE SENSEX S&P CNX 16,219 4,924 1 June 2012 6QSY12 Results Update Sector: Sugar CMP: INR26 TP: INR45 Buy Bloomberg SHRS IN Equity Shares (m) 671.0 52-Week Range (INR) 76/23 1,6,12 Rel. Perf. (%) -10/-16/-45
Monnet Ispat. CMP: INR449 TP: INR518 Neutral
 4QFY12 Results Update Sector: Metals Monnet Ispat BSE SENSEX S&P CNX 16,328 4,943 CMP: INR449 TP: INR518 Neutral Bloomberg MISP IN Equity Shares (m) 64.4 52-Week Range (INR) 561/305 1,6,12 Rel. Perf. (%)
Pantaloon Retail. CMP: INR177 TP: INR192 Neutral
 BSE SENSEX S&P CNX 17,773 5,390 Bloomberg PF IN Equity Shares (m) 217.1 52-Week Range (INR) 364/125 1,6,12 Rel. Perf. (%) 9/-49/-29 M.Cap. (Rs b) 38.4 M.Cap. (US$ b) 0.8 14 February 2012 2QFY12 Results
Godrej Consumer Products
 BSE SENSEX S&P CNX 16,739 5,049 Bloomberg GCPL IN Equity Shares (m) 323.6 52-Week Range (INR) 464/325 1,6,12 Rel. Perf. (%) 3/3/16 M.Cap. (INR b) 135.6 M.Cap. (USD b) 2.7 24 January 2012 3QFY12 Results
Coal India CMP: INR348 TP: INR408 Buy
 BSE SENSEX S&P CNX 17,633 5,348 Bloomberg COAL IN Equity Shares (m) 6,316.4 52-Week Range (INR) 404/294 1,6,12 Rel. Perf. (%) -4/4/-15 M.Cap. (INR b) 2,198.1 M.Cap. (USD b) 39.7 14 August 2012 1QFY13 Results
Petronet LNG. CMP: INR146 TP: INR205 Buy
 BSE SENSEX S&P CNX 17,236 5,229 Bloomberg PLNG IN Equity Shares (m) 750.0 52-Week Range (INR) 186/122 1,6,12 Rel. Perf. (%) 3/-11/-10 M.Cap. (INR b) 109.7 M.Cap. (USD b) 2.0 1 August 2012 1QFY13 Results
Axis Bank. CMP: INR1,008 TP: INR1,240 Buy
 BSE SENSEX S&P CNX 16,739 5,049 Bloomberg AXSB IN Equity Shares (m) 410.5 52-Week Range 1,461/785 1,6,12 Rel.Perf.(%) 11/-9/-9 M.Cap. (INR b) 413.8 M.Cap. (USD b) 8.2 20 January 2012 Results Update Sector:
ITC. CMP: INR201 TP: INR230 Buy
 BSE SENSEX S&P CNX 16,739 5,049 Bloomberg ITC IN Equity Shares (m) 7,738.1 52-Week Range (INR) 211/149 1,6,12 Rel. Perf. (%) 3/23/38 M.Cap. (INR b) 1,601.0 M.Cap. (USD b) 32.1 21 January 2012 Results Update
Punjab National Bank. CMP: INR940 TP: INR1,275 Buy
 BSE SENSEX S&P CNX 17,194 5,199 Bloomberg PNB IN Equity Shares (m) 316.8 52-Week Range (INR) 1,234/751 1,6,12 Rel.Perf.(%) 9/-10/-9 M.Cap. (INR b) 297.7 M.Cap. (USD b) 6.0 1 February 2012 3QFY12 Results
Strides Arcolab. CMP: INR717 TP: INR829 Buy
 BSE SENSEX S&P CNX 17,144 5,200 Bloomberg STR IN Equity Shares (m) 57.7 52-Week Range (INR) 794/276 1,6,12 Rel. Perf. (%) -2/37/98 M.Cap. (INR b) 41.4 M.Cap. (USD b) 0.7 31 July 2012 2QCY12 Results Update
Sohail Halai Alpesh Mehta
 BSE Sensex S&P CNX 20,039 6,064 Bloomberg IDBI IN Equity Shares (m) 1,278.4 M.Cap. (INR b)/(usd b) 144.9/2.7 52-Week Range (INR) 122/82 1,6,12 Rel.Perf.(%) -1/6/2 Financials & Valuation (INR b) Y/E March
Oberoi Realty. CMP: INR264 TP: INR315 Buy
 BSE SENSEX S&P CNX 17,151 5,202 Bloomberg OBER IN Equity Shares (m) 328.2 52-Week Range (INR) 323/205 1,6,12 Rel. Perf. (%) 4/15/16 M.Cap. (INR b) 87.0 M.Cap. (USD b) 1.7 26 April 2012 4QFY12 Results Update
Hindalco. CMP: INR113 TP: INR151 Buy
 BSE SENSEX S&P CNX 18,817 5,724 Bloomberg HNDL IN Equity Shares (m) 1,990.0 52-Week Range (INR) 165/100 1,6,12 Rel. Perf. (%) -9/-18/-26 M.Cap. (INR b) 224.9 M.Cap. (USD b) 4.1 Consolidated 2QFY13 Results
M&M Financial Services
 BSE SENSEX S&P CNX 18,793 5,717 Bloomberg MMFS IN Equity Shares (m) 102.7 52-Week Range (INR) 938/590 1,6,12 Rel.Perf.(%) 7/24/30 M.Cap. (INR b) 90.7 M.Cap. (USD b) 1.7 23 October 2012 2QFY13 Results Update
Steel Authority of India
 BSE SENSEX S&P CNX 16,439 4,990 4QFY12 Results Update Sector: Metals Steel Authority of India CMP: INR93 TP: INR99 Sell Bloomberg SAIL IN Equity Shares (m) 4,130.4 52-Week Range (INR) 151/73 1,6,12 Rel.
CMP: INR415 TP: INR 471 BUY
 04 Mar 2013 Update Sector: Technology Wipro CMP: INR415 TP: INR 471 BUY Pipeline and deal signings suggest improvement in growth; Multiple levers and focus on productivity will cushion margin headwinds
Raymond. Restructuring initiatives bearing fruit; Land bank base case value INR147/share; Reiterate Buy. CMP: INR385 TP: INR462 Buy
 14 June 2012 Update Raymond CMP: INR385 TP: INR462 Buy Restructuring initiatives bearing fruit; Land bank base case value INR147/share; Reiterate Buy We met the management of Raymond (RW IN, Mkt Cap USD0.4b,
Punjab National Bank. CMP: INR768 TP: INR963 Buy
 BSE SENSEX S&P CNX 16,480 4,975 Bloomberg PNB IN Equity Shares (m) 339.2 52-Week Range (INR) 1,200/751 1,6,12 Rel.Perf.(%) -12/-16/-18 M.Cap. (INR b) 260.5 M.Cap. (USD b) 4.8 10 May 2012 4QFY12 Results
CMP: INR350 TP: INR375 Downgrade to Neutral
 BSE Sensex S&P CNX 19,497 5,897 Bloomberg COAL IN Equity Shares (m) 6,316.4 M.Cap. (INR b)/(usd b) 2,211/41 52-Week Range (INR) 386/301 1,6,12 Rel. Perf. (%) 1/-11/-5 Financials & Valuation (INR b) Y/E
Tata Power. CMP: INR111 TP: INR92 Neutral
 BSE SENSEX S&P CNX 17,749 5,382 Bloomberg TPWR IN Equity Shares (m) 2,373.3 52-Week Range (INR) 135/81 1,6,12 Rel. Perf. (%) 10/-5/-10 M.Cap. (INR b) 263.9 M.Cap. (USD b) 5.3 13 February 2012 3QFY12 Results
Kotak Mahindra Bank. CMP: INR626 TP: INR500 Neutral
 BSE SENSEX S&P CNX 18,759 5,705 Bloomberg KMB IN Equity Shares (m) 740.7 52-Week Range (INR) 652/418 1,6,12 Rel.Perf.(%) -3/-2/18 M.Cap. (INR b) 463.4 M.Cap. (USD b) 8.6 26 October 2012 2QFY13 Results
Godrej Properties. CMP: INR595 TP: INR635 Neutral
 BSE SENSEX S&P CNX 16,913 5,114 Bloomberg GPL IN Equity Shares (m) 78.0 52-Week Range 845/570 1,6,12 Rel. Perf. (%) 0/-9/-2 M.Cap. (INR b) 46.4 M.Cap. (USD b) 0.9 4QFY12 Results Update Sector: Real Estate
CMP: INR401 TP: INR516 Buy. * After ESOP charges; # Axon consolidated in December 2008
 19 October 2011 1QFY12 Results Update Sector: Technology BSE SENSEX S&P CNX 16,748 5,038 Bloomberg HCLT IN Equity Shares (m) 700.9 52-Week Range (INR) 528/360 1,6,12 Rel. Perf. (%) 4/-1/7 M.Cap. (INR b)
JSW Steel. CMP: INR670 TP: INR391 Sell Merger with JSW Ispat
 BSE SENSEX S&P CNX 17,384 5,254 Bloomberg JSTL IN Equity Shares (m) 223.1 52-Week Range (INR) 885/464 1,6,12 Rel. Perf. (%) -5/-12/-10 M.Cap. (INR b) 149.5 M.Cap. (USD b) 2.7 Valuation summary (INR b)
Urban demand revives; Akzo gaining market share
 BSE Sensex S&P CNX 22,095 6,601 CMP: INR889 26 March 2014 Update Sector: Consumer Not Rated Urban demand revives; Akzo gaining market share Reiterates focus on Profitable growth Urban demand for Decorative
Hardick Bora 4QCY12 Results Update Sector: Healthcare Sanofi India CMP: INR2,307 TP: INR2,015 Neutral
 BSE Sensex S&P CNX 19,332 5,855 Bloomberg SANL IN Equity Shares (m) 23.0 M.Cap. (INR b)/(usd b) 53.1/1.0 52-Week Range (INR) 2,450/2,002 1,6,12 Rel. Perf. (%) 9/-1/-4 Financials & Valuation (INR b) Y/E
Idea Cellular. CMP: INR159 TP: INR200 Buy
 BSE SENSEX S&P CNX 19,164 5,678 Bloomberg IDEA IN Equity Shares (m) 3,316.2 M.Cap. (INR b) / (USD b) 513.7/8.4 52-Week Range (INR) 176/72 1, 6, 12 Rel. Per (%) 12/45/83 Financials & Valuation (INR Billion)
Axis Bank. CMP: INR1,119 TP: INR1,330 Buy
 BSE SENSEX S&P CNX 18,714 5,687 Bloomberg AXSB IN Equity Shares (m) 413.2 52-Week Range (INR) 1,309/785 1,6,12 Rel.Perf.(%) 9/-16/-8 M.Cap. (INR b) 462.4 M.Cap. (USD b) 8.7 16 October 2012 2QFY13 Results
Sun Pharmaceuticals. CMP: INR554 TP: INR614 Neutral
 BSE SENSEX S&P CNX 17,849 5,416 Bloomberg SUNP IN Equity Shares (m) 1,035.6 52-Week Range (INR) 566/404 1,6,12 Rel. Perf. (%) -3/10/31 M.Cap. (INR b) 573.7 M.Cap. (USD b) 11.6 15 February 2012 3QFY12 Results
Maruti Suzuki. CMP: INR1,395 TP: INR1,730 Buy
 BSE SENSEX S&P CNX 18,431 5,598 Bloomberg MSIL IN Diluted Equity Shares (m) 302.1 52-Week Range (INR) 1,498/906 1,6,12 Rel.Perf.(%) 5/-5/20 M.Cap. (INR b) 421.3 M.Cap. (USD b) 7.8 31 October 2012 2QFY13
Thermax. CMP: INR522 TP: INR414 Neutral
 BSE SENSEX S&P CNX 17,605 5,326 Bloomberg TMX IN Equity Shares (m) 119.2 52-Week Range (INR) 720/388 1,6,12 Rel. Perf. (%) 14/1/-21 M.Cap. (INR b) 60.3 M.Cap. (USD b) 1.1 3 February 2012 3QFY12 Results
Siddharth Bothra
 BSE Sensex S&P CNX 19,152 5,797 Bloomberg CSTRL IN Equity Shares (m) 494.6 M.Cap. (INR b)/(usd b) 158/2.9 52-Week Range (INR) 338/223 1,6,12 Rel. Perf. (%) 12/-3/26 Financials & Valuation (INR b) Y/E March
Cement. Demand to grow 8%, with cost push to be passed on CCI probe to have limited impact
 15 May 2012 Update Cement Demand to grow 8%, with cost push to be passed on CCI probe to have limited impact We met with senior managements of the large cement companies in India, to get perspective on
ITC. Buy. Rs169. 3QFY11 Results Update 19,008 5,697
 Results Update SECTOR: FMCG BSE SENSEX S&P CNX 19,8 5,697 Bloomberg ITC IN Equity Shares (m) 7,75.9 52-Week Range (Rs) 185/112 1,6,12 Rel. Perf. (%) 6/9/3 M.Cap. (Rs b) 1,31.5 M.Cap. (US$ b) 29.3 Rs169
Shriram Transport Finance
 Results Update SECTOR: BANKING STOCK INFO. BSE Sensex: 18,113 S&P CNX: 5,442 BLOOMBERG SHTF IN REUTERS CODE SRTR.BO Equity Shares (m) 225.5 52-Week Range 651/291 1,6,12 Rel.Perf.(%) -1/12/71 M.Cap. (Rs
Jinesh Gandhi Chirag Jain
 BSE Sensex S&P CNX 19,561 5,923 Bloomberg EIM IN Equity Shares (m) 27.0 M.Cap. (INR b)/(usd b) 72.0/1.3 52-Week Range 3,240/1,620 1,6,12 Rel. Perf. (%) -4/17/40 Financials & Valuation (INR b) Y/E Dec 2013E
Tribhovandas Bhimji Zaveri
 24 April 2012 Update CMP INR TP INR TRIBHOVANDAS BHIMJI ZAVERI Pure jewellery retail play with strong brand; Execution risks priced in; Subscribe (TBZ) is a pure play on the fast-growing branded jewellery
Maruti Suzuki. CMP:Rs1,327 TP:Rs1,625 Buy
 25 April 2011 4QFY11 Results Update Sector: Automobiles Maruti Suzuki BSE SENSEX S&P CNX 19,584 5,875 Bloomberg MSIL IN Diluted Equity Shares (m) 289.0 52-Week Range (Rs) 1,600/1,126 1,6,12 Rel.Perf.(%)
Shree Renuka Sugars. CMP: INR41 TP: INR50 Buy
 BSE SENSEX S&P CNX 18,202 5,532 Bloomberg SHRS IN Equity Shares (m) 671.0 52-Week Range (INR) 87/23 1,6,12 Rel. Perf. (%) 14/-39/-51 M.Cap. (INR b) 27.3 M.Cap. (USD b) 0.6 16 February 2012 5QSY12 Results
Sandipan Pal QFY13 Results Update Sector: Real Estate Unitech CMP: INR29 TP: INR44 Buy
 BSE Sensex S&P CNX 19,608 5,933 Bloomberg UT IN Equity Shares (m) 2,438.8 M.Cap. (INR b)/(usd b) 70/1.3 52-Week Range (INR) 41/18 1,6,12 Rel. Perf. (%) -27/24/-13 Financials & Valuation (INR b) Y/E March
Phoenix Mills. CMP: INR184 TP: INR255 Buy
 BSE SENSEX S&P CNX 16,439 4,990 Bloomberg PHNX IN Equity Shares (m) 144.8 52-Week Range (INR) 229/149 1,6,12 Rel. Perf. (%) -8/-5/10 M.Cap. (INR b) 26.8 M.Cap. (USD b) 0.5 30 May 2012 4QFY12 Results Update
Jinesh Gandhi Sandipan Pal
 BSE Sensex S&P CNX 20,224 6,157 Bloomberg BCORP IN Equity Shares (m) 77.0 M.Cap. (INR b)/(usd b) 20.5/0.4 52-Week Range (INR) 342/202 1,6,12 Rel. Perf. (%) 6/-15/-23 Financials & Valuation (INR b) Y/E
Oberoi Realty. CMP: INR269 TP: INR320 Buy
 BSE SENSEX S&P CNX 18,682 5,684 Bloomberg OBER IN Equity Shares (m) 328.2 52-Week Range (INR) 323/205 1,6,12 Rel. Perf. (%) 13/-7/7 M.Cap. (INR b) 88.3 M.Cap. (USD b) 1.6 22 October 2012 2QFY13 Results
Amara Raja Batteries. CMP: INR517 TP: INR560 Buy
 BSE SENSEX S&P CNX 25,665 7,672 Bloomberg AMRJ IN Equity Shares (m) 170.8 M.Cap. (INR b) / (USD b) 88.2/1.4 52-Week Range (INR) 520/208 1, 6, 12 Rel. Per (%) 5/21/97 Financials & Valuation (INR Million)
BHEL. CMP: INR227 TP: INR233 Neutral
 BSE SENSEX S&P CNX 18,636 5,666 Bloomberg BHEL IN Equity Shares (m) 2,447.6 52-Week Range (INR) 368/198 1,6,12 Rel. Perf. (%) -7/-7/-35 M.Cap. (INR b) 556.2 M.Cap. (USD b) 10.3 30 October 2012 2QFY13 Results
Jaypee Infratech. CMP: INR33 TP: INR45 Buy
 BSE SENSEX S&P CNX 2,550,318 Bloomberg JPIN IN Equity Shares (m) 1,388.9 M.Cap. (INR b) / (USD b) 51.3/0.9 52-Week Range (INR) 2/1 1,, 12 Rel. Per (%) 1/9/-3 Financials & Valuation (INR m) Y/E Mar 201
Hardick Bora QFY13 Results Update Sector: Healthcare Lupin CMP: INR725 TP: INR851 Buy
 BSE Sensex S&P CNX 19,990 6,069 Bloomberg LPC IN Equity Shares (m) 447.6 M.Cap. (INR b)/(usd b) 324.5/6.0 52-Week Range (INR) 739/507 1,6,12 Rel. Perf. (%) 9/18/13 Financials & Valuation (INR b) Y/E March
Stress test: Weak capital servicing ratios to drive pricing discipline
 Stress test: Weak capital servicing ratios to drive pricing discipline Operating performance near trough; expect gradual improvement 20 Update Cement Our analysis of a cross-section of cement companies
Shoppers Stop. CMP: INR339 TP: INR355 Neutral
 BSE SENSEX S&P CNX 20,684 6,145 Bloomberg SHOP IN Equity Shares (m) 83.1 M.Cap. (INR b) / (USD b) 28.1/0.5 52-Week Range (INR) 494/331 1, 6, 12 Rel. Per (%) -7/-16/-28 Financials & Valuation (INR b) Y/E
Alpesh Mehta Sohail Halai
 BSE Sensex S&P CNX 19,664 5,969 Bloomberg IIB IN Equity Shares (m) 521.8 M. Cap. (INR b)/(usd b) 227/4.1 52-Week Range (INR) 441/242 1,6,12 Rel.Perf.(%) 3/15/52 Financials & Valuation (INR b) Y/E March
Previous Recommendation: Neutral
 2QFY11 Results Update SECTOR: PHARMACEUTICALS STOCK INFO. BSE Sensex: 20,589 S&P CNX: 6,194 BLOOMBERG JOL IN REUTERS CODE JUBO.BO Equity Shares (m) 170.0 52-Week Range 413/255 1,6,12 Rel. Perf. (%) -4/-34/-8
Market share recovery, price hike, content leverage to drive growth
 BSE Sensex S&P CNX 24,377 7,276 Stock Info Bloomberg DITV IN Equity Shares (m) 1,064.8 52-Week Range (INR) 71/40 1, 6, 12 Rel. Per (%) 6/-15/-41 M.Cap. (INR b) 58.2 M.Cap. (USD b) 1.0 Financial Snapshot
Previous Recommendation: Buy
 2QCY10 Results Update SECTOR: CEMENT ACC STOCK INFO. BSE Sensex: 18,113 S&P CNX: 5,442 BLOOMBERG ACC IN REUTERS CODE ACC.BO Previous Recommendation: Buy Buy Rs816 Equity Shares (m) 187.9 52-Week Range
Godrej Properties. CMP: INR368 TP: INR420 Neutral
 BSE SENSEX S&P CNX 21,034 6,252 Bloomberg GPL IN Equity Shares (m) 99.6 M.Cap. (INR b) / (USD b) 36.4/ 0.7 52-Week Range (INR) 641/340 1, 6, 12 Rel. Per (%) -1/-44/-47 Financials & Valuation (INR b) Y/E
Jinesh Gandhi Chirag Jain
 BSE Sensex S&P CNX 19,722 5,995 Bloomberg EIM IN Equity Shares (m) 27.0 M.Cap. (INR b)/(usd b) 88.1/1.6 52-Week Range (INR) 3,285/1,620 1,6,12 Rel. Perf. (%) 10/20/36 Financials & Valuation (INR b) Y/E
Torrent Pharmaceuticals
 BSE SENSEX S&P CNX 21,338 6,339 Bloomberg TRP IN Equity Shares (m) 169.2 M.Cap. (INR b) / (USD b) 80.4/1.3 52-Week Range (INR) 535/324 1, 6, 12 Rel.Per (%) 4/12/32 Financials & Valuation (INR Million)
Birla Corporation. CMP: INR216 TP: INR277 Buy
 BSE SENSEX S&P CNX 16,839 5,100 Bloomberg BCORP IN Equity Shares (m) 77.0 52-Week Range (INR) 348/211 1,6,12 Rel. Perf. (%) -5/-19/-25 M.Cap. (INR b) 16.6 M.Cap. (USD b) 0.3 30 July 2012 1QFY13 Results
Reliance Communications
 1QFY11 Results Update SECTOR: TELECOM Reliance Communications STOCK INFO. BSE Sensex: 18,167 S&P CNX: 5,452 BLOOMBERG RCOM IN REUTERS CODE RLCM.BO 13 August 2010 Previous Recommendation: Under Review Buy
CPCB-2: Important long-term driver
 BSE Sensex S&P CNX 20,860 6,217 19 December 2013 Update Sector: Capital Goods Cummins India CMP: INR461 TP: INR540 Buy Stock Info Bloomberg KKC IN Equity Shares (m) 277.2 52-Week Range (INR) 550/365 1,
Cross service charges at INR m/quarter
 BSE SENSEX S&P CNX 19,636 5,940 Cummins India CMP: INR504 TP: INR585 Buy LHP products to be an important growth driver Cross service charges at INR100-200m/quarter 20 February 2013 Update Sector: Capital
Hardick Bora 4QFY13 Results Update Sector: Healthcare Dr Reddy's Laboratories CMP: INR2,026 TP: INR2,375 Buy
 BSE Sensex S&P CNX 19,772 5,995 Bloomberg DRRD IN Equity Shares (m) 169.2 M.Cap. (INR b)/(usd b) 344/6.3 52-Week Range (INR) 2,151/1,528 1,6,12 Rel. Perf. (%) -2/9/0 Financials & Valuation (INR b) Y/E
Dabur India. Source: Company Data; PL Research
 Deflation and poor demand impacts sales; Accumulate July 27, 2016 Amnish Aggarwal amnishaggarwal@plindia.com +91 22 66322233 Gaurav Jogani gauravjogani@plindia.com +91 22 66322238 Rating Accumulate Price
Dabur India. Share gains power growth, Accumulate. Source: Company Data; PL Research
 Share gains power growth, Accumulate May 02, 2018 Amnish Aggarwal amnishaggarwal@plindia.com +91 22 66322233 Nishita Doshi nishitadoshi@plindia.com +91 22 66322381 Rating Accumulate Price Rs371 Target
Dabur India. Steady recovery in place; Accumulate. Source: Company Data; PL Research
 Steady recovery in place; Accumulate January 31, 2018 Amnish Aggarwal amnishaggarwal@plindia.com +91 22 66322233 Nishita Doshi nishitadoshi@plindia.com +91 22 66322381 Rating Accumulate Price Rs354 Target
Coal India. CMP: INR322 TP: INR370 Buy
 BSE SENSEX S&P CNX 16,439 4,990 Bloomberg COAL IN Equity Shares (m) 6,316.4 52-Week Range (INR) 422/294 1,6,12 Rel. Perf. (%) -4/-3/-7 M.Cap. (INR b) 2,033.9 M.Cap. (USD b) 36.4 30 May 2012 4QFY12 Results