For September 2017 Payout
|
|
|
- Alyson Woods
- 5 years ago
- Views:
Transcription

1 finmagm Abstract For September 2017 Payout
2 CARE has rated more than 335 Asset Backed Securitisation (ABS) / Mortgage Backed Securitisation (MBS) pools across 42 s and pools aggregating to around Rs. 64,000 crore covering various asset classes, which include - Auto Loans, Commercial Vehicle loans, Construction Equipment loans, Two Wheeler loans, Personal Loans, Microfinance loans and Mortgage Loans. This report analyses the performance of all rated transactions live as on recent date. It covers the characteristics of pools at the time of origination and their key performance indicators. Key performance indicators include 90+ DPD levels, 180+ DPD levels, Cumulative Collection Efficiency Ratio, Prepayments etc. CARE also calculates the Break-even ratio to determine the minimum collection efficiency required on pools future cash flow to be able to serve the payouts on time. It also covers the Credit Enhancement Utilization and Coverage at 90+ DPD levels & 180+ DPD levels. Detailed performance report and interpretation of each term are briefed in the later sections. All the securitisation pools rated by CARE have either maintained the initial rating assigned to them or have been upgraded. All the pools so far continue to be comfortably placed in terms of low utilization of credit enhancements. Break-even and Enhancement coverage for all the rated pool shows that they are comfortably placed. 1
3 Contents S.No Index Page No I Terminologies 3 II Acronym 6 III -Wise Pools Performance Asirvad Microfinance Private Limited 12 Aptus Value Housing Finance Limited 18 Arohan Financial Services Private Ltd. 21 Annapurna Microfinance Private Limited 23 Bharat Financial Inclusion Ltd 28 Cholamandalam Investment Finance Company Ltd. 35 Dewan Housing Finance Limited 37 Equitas Small Finance Bank Limited 51 ESAF Microfinance 54 HDFC Limited 64 Hinduja Leyland Finance Limited 74 Indiabulls Housing Finance Company Ltd. 77 IKF Finance Limited 91 India Shelter Finance Corporation Ltd. 99 Light Microfinance 101 Magma Fincorp Limited 103 Magma ITL Finance Ltd 106 Shriram City Union Finance Limited 108 Shriram Transport Finance Company Limited 110 Suryodaya Micro Finance Ltd. 114 S V Creditline Pvt Ltd. 116 Varam Capital Pvt Ltd. 118 Visage Holdings and Finance Private Limited 120 2
4 Terminologies Commencement Month: Date from which pool receivables have been transferred. : Whether the pool receivables were transferred at their par value or at a premium. If there is some new structure, then it is suitably mentioned. Pool Principal: The pool principal outstanding at the time of securitisation. Future Payout: Total obligation towards PTC holders or the acquirer at the time of securitisation. Future Receivables: Total cash flows arising from the assigned pool. : The total number of contracts in a pool. Average Maturity: It is calculated as weighted average maturity of all future cash flow. Average Seasoning: Weighted average seasoning of the pool as on cut off date. : Principal outstanding of all those loans in a pool which are in overdue category. It is expressed as % of initial pool principal outstanding. It is presented sequentially as current, one month overdue and two months overdue. For example, if the Pool has 98% current contracts, 1% one month overdue and 1% two month overdue. The will appear as 98%, 1%, 1%. Cash Collateral: Cash Collateral (CC) is the total amount of credit protection available in the form of cash or corporate undertaking divided by the pool receivables (in the case of premium transactions) or pool principal (in the case of par transactions). Cash collateral is further divided into first loss and second loss (wherever applicable). Liquidity Facility: This facility is used for meeting temporary shortfall in the collection. This facility can be used only for the overdue pertaining to all the contracts which are due for 90 days or less (less than 90 dpd). Excess Interest Spread: It is difference between scheduled interest cash flow from underlying obligors and schedule interest payout to investor / acquirer. It is calculated as a % of initial principal outstanding. (No. of Month * Monthly Pool Cash Flow) Sum of Pool Cash Flow Pool Interest Cash Flow Investor Interest Payout Initial Principal Outstanding Pool Maturity: Last payout date to the investor or the date on which last payment to the investor is to be made. Months Post Securitisation: Months elapsed after the securitisation. Balance Tenure: Number of months for which investor / acquirer payout is outstanding in the transaction. Amortisation: Amount of pool got amortised as a percentage of original assigned pool. 3
5 30+/ 90+/ 180+ (% of Initial POS / FP): It is a ratio of sum of pool principal outstanding (POS) or future receivables (FR) of all those contracts which are more than 30/90/180 days past dues (dpd) and overdue amount pertaining to those contracts and loss from repossessed assets (wherever available) to the initial POS / future payouts (FP). Future POS / FR (30+/ 90+/ 180+dpd) + Amount (30+/ 90+/ 180+dpd) + Repo Loss Initial POS / FP 30+/ 90+/ 180+ (% of Balance POS / FP): It is a ratio of future POS / FR of all those contracts which are more than 30/90/180dpd to the balance pool POS / FP. Future POS / FR (30+/ 90+/ 180+dpd) Balance POS/ FP as a % of Initial POS / FP: It is a ratio of overdue amount of all the contracts overdue as on date to initial POS / FP. Amount Initial POS / FP Cash Collateral as % of Balance POS: It is ratio of outstanding cash collateral as on date as a % of principal outstanding as on date. Outstandingcash collateral Balance POS Liquidity Facility as % of Balance POS: It is ratio of outstanding liquidity facility as on date as a % of principal outstanding as on date. Outstandingliquidity facility Balance POS Balance cash collateral: Outstanding cash collateral as a % of initial cash collateral. Outstanding Cash Collateral Initial cash collateral Break Even : Minimum collection efficiency required from future billings (excluding overdues) to serve the investors. Future Payouts Available cash collateral Future Billing Break Even (First Loss Facility): Minimum collection efficiency required from future billings (excluding overdues) to serve the investor keeping second loss facility unutilised at the end of the transaction. Future Payouts Available first loss facility (cash collateral) Future Billing 4
6 Overall Credit Enhancement coverage at 30+/ 90+/ 180+dpd: This ratio explains the credit enhancement coverage available to the future receivables of above 30/90/180dpd contracts. 1- Break even collection efficiency 30+/ 90+/ 180+dpd (% of Balance POS) First Loss Enhancement coverage at 90+/ 180+dpd: This ratio explains the first loss enhancement coverage available to the future receivables of above 90/180dpd contracts. 1- Break even collection efficiency (First Loss Facility) 90+/180+dpd (% of Balance POS) Cumulative Prepayment: This ratio explains the cumulative prepayment in the pool. Cumulative Prepayment Initial POS / FP Cumulative (): This ratio explains the cumulative collection in the pool. Cumulative Collection till date (exclusive of prepayments) Cumulative Monthly Billing Monthly (): This ratio explains the monthly collection in the pool. Total Monthly Collections (exclusive of prepayments) Monthly Billing Fortnightly (FCE): This ratio explains the fortnightly collection in the pool. Total Fortnightly Collections (exclusive of prepayments) Fortnightly Billing 5
7 Acronym ABS Amt AP CC DPD EIS FLF FL FP FR LF MBS FCE OC PTC POS SLF Asset Backed Securities Amount Assignee Payout Break-even Cash Collateral/ Credit Collateral Cumulative Days Past Due Excess Interest Spread First Loss Facility First Loss Future Payouts Future Receivables Liquidity Facility Mortgage Backed Securities Monthly Fortnightly Over Collateralization Pass through Certificate Principal Outstanding Second Loss Facility Not Applicable 6
8 Rating Withdrawal: No Transaction Name 1 IKF Finance Limited Asirvad Microfinance Pvt. Ltd. Asirvad Microfinance Pvt. Ltd. Asirvad Microfinance Pvt. Ltd. Bharat Financial Inclusion Limited 6 Magma Fincorp Limited Volturnus CV IFMR Capital 2016 Dufresne IFMR Capital 2016 Travis IFMR Capital 2016 Casca IFMR Capital 2016 Facilities / Instrument A1 PTCs A2 PTCs A1 PTCs A2 PTCs A1 PTCs A2 PTCs A1 PTCs A2 PTCs Month of Withdrawal Jan 18 Jan 18 Jan 18 Dec 17 IMLRT Jan 16 A PTCs Dec 17 MFL Securitisation Trust XXVIII 7 S V Creditline Ltd Amako IFMR Capital Indiabulls Hosuing Finance Limited Indiabulls Hosuing Finance Limited Indiabulls Hosuing Finance Limited Indiabulls Hosuing Finance Limited Equitas Small Finance Bank Limited ESAF Microfinance Private Limited ESAF Microfinance Private Limited Light Microfinance Private Limited Bharat Financial Inclusion Limited A1 PTCs A2 PTCs SLF LF A1 PTCs A2 PTCs Dec 17 Dec 17 IBFSL DA Mar12 II A PTCs Oct 17 IBFSL DA Sep 11 I A PTCs Oct 17 Innovation Trust XI A PTCs Oct 17 Innovation Trust VIII A PTCs Oct 17 EMF Microloans Pool Series X - March 2016 A PTCs Sep-17 Cedar MFI Trust 25 A PTCs Sep-17 Cedar MFI Trust 26 A PTCs Aug-17 Tachyon Trust 2016 A PTCs Aug-17 IMLRT March 2016 A A PTCs Jul-17 7
9 Provisional Rating: List of provisional rating cases assigned by CARE which are yet to convert to final rating provided below. The rating shall be confirmed, once the final documents received. The executed documents should confirm to the structure/conditions as provided at the time of the initial rating. No Asirvad Microfinance Limited Satin Credircare Limited Home Credit India Finance Ltd Light Microfinance Private Limited Annapurna Microfinance Private Limited Fusion Microfinance Private Limited Spandana Sphoorty Finance limited Spandana Sphoorty Finance limited Asirvad Microfinance Limited ESAF Small Finance Bank Transaction Name Daenerys IFMR Capital 2017 Vivriti Rey Tarini IFMR Capital 2017 Aguamenti IFMR Capital 2017 Vivriti Asensio Olenna IFMR Capital 2017 Abhilasha Shree Vivriti Matic Cedar Inclusive Finance Trust 1 Rating assigned month Nov-17 Nov-17 Nov-17 Nov-17 Nov-17 Nov-17 Nov-17 Nov-17 Dec-17 Dec-17 Instrument Series A1 PTCs Series A2 PTCs Series A1 PTCs Series A2 PTCs Series A1 PTCs Series A2 PTCs Series A1 PTCs Series A2 PTCs Series A PTCs Series A1 PTCs Series A2 PTCs Series A PTCs Series A PTCs Series A1 PTCs Series A2 PTCs Series A1 PTCs Series A2 PTCs Series A3 PTCs Amount (Rs Crs) Ratings assigned Provisional CARE AA- (SO) Provisional CARE A- (SO) Provisional CARE A- (SO) Provisional CARE BBB (SO) Provisional CARE A- (SO) Provisional CARE BBB- (SO) Provisional CARE BBB+ (SO) Provisional CARE BBB (SO) Provisional CARE A- (SO) Provisional CARE A- (SO) Provisional CARE BBB (SO) Provisional CARE A+ (SO) Provisional CARE A+ (SO) Provisional CARE A+ (SO) Provisional CARE BBB+ (SO) Provisional CARE A- (SO) Provisional CARE BBB+ (SO) Provisional CARE BBB- (SO) Documents pending YES YES YES YES YES YES YES YES YES YES 8
10 No Fusion Microfinance Private Limited Fusion Microfinance Private Limited Hinduja Leyland Finance Hinduja Leyland Finance Transaction Name Vivriti Windu Rosetta IFMR Capital 2017 Gemini CV Trust II Dec 2017 Ramnos IFMR Capital 2017 Rating assigned month Dec-17 Dec-17 Dec-17 Dec-17 Instrument Series A PTCs Series A PTCs Series A1 PTCs Amount (Rs Crs) SLF 20.1 Series A1 PTCs SLF Ratings assigned Provisional CARE A- (SO) Provisional CARE A (SO) Provisional CARE AAA (SO) Provisional CARE A- (SO) Provisional CARE AAA (SO) Provisional CARE BBB+ (SO) Documents pending YES YES YES YES 9
11 Sr. No. 1 2 Rating Transition: Indiabulls Housing Finance Limited Indiabulls Housing Finance Limited Transaction Name IBHFL DA Mar 12 I IBHFL DA Mar 12 II Instrument Assignee Payout Assignee Payout Month of Upgrade Oct 17 Oct 17 Rating/Credit Opinion CARE AAA (SO) CARE AAA (SO) Remarks Upgraded from CARE AA+ (SO) Upgraded from CARE AA+ (SO) 3 Dewan Housing Finance Ltd Nirmaan RMBS Trust - Series I Series A1 PTCs Series A2 PTCs Oct'17 CARE AAA (SO) CARE AAA (SO) Reaffirmed Upgraded from CARE AA (SO) 4 Dewan Housing Finance Ltd Nirmaan RMBS Trust - Series II Series A1 PTCs Series A2 PTCs Dec'17 CARE AAA (SO) CARE AAA (SO) Reaffirmed Upgraded from CARE AA- (SO) 5 Dewan Housing Finance Ltd Nirmaan RMBS Trust - Series III Series A1 PTCs Series A2 PTCs Dec'17 CARE AAA (SO) CARE AAA (SO) Reaffirmed Upgraded from CARE AA (SO) 6 Dewan Housing Finance Ltd Nirmaan RMBS Trust - Series IV Series A1 PTCs Series A2 PTCs Dec'17 CARE AAA (SO) CARE AAA (SO) Reaffirmed Upgraded from CARE AA (SO) 10
12 Sr. No Credit Enhancement Reset: Transaction Name Instrument Dewan Housing Finance Ltd Dewan Housing Finance Ltd Dewan Housing Finance Ltd Dewan Housing Finance Ltd Nirmaan RMBS Trust - Series I Nirmaan RMBS Trust - Series II Nirmaan RMBS Trust - Series III Nirmaan RMBS Trust - Series IV Month of Reset Principal Outstanding (Rs. Cr.) Rating/Credit Opinion Series A1 PTCs CARE AAA (SO) Oct'17 Series A2 PTCs 0.65 CARE AAA (SO) Series A1 PTCs CARE AAA (SO) Dec'17 Series A2 PTCs 4.71 CARE AAA (SO) Series A1 PTCs CARE AAA (SO) Dec'17 Series A2 PTCs 6.08 CARE AAA (SO) Series A1 PTCs CARE AAA (SO) Dec'17 Series A2 PTCs 3.21 CARE AAA (SO) 11
13 Asirvad Microfinance Limited (AMFPL 5 Pools) Key financial indicators For the year ended as on 31st March (12m, A) (12m, A) (12m, A) Total Income (in Rs. Cr) Profit After Tax (in Rs. Cr) Net worth (in Rs. Cr) Gross NPA ratio (%) Capital Adequacy Ratio (CAR) (%) P*=Provisional, A=Audited Total income stood at Rs. 363 Crores in FY17 as compared to Rs. 156 Crore in FY16, a growth of 133% The Gross NPA ratio increased from 0.11% as on March 31, 2016 to 4.56% as on March 31 st AMFPL reported regulatory CAR of 20.60% as on FY17. 12
14 Rating Dufresne IFMR Capital 2016 Asirvad Microfinance Limited (AMFL) Withdrawn Microfinance (100%) Jun-16 CC as % of initial POS 4.5% Par First Loss Credit Facility 54.5 Second Loss Credit Facility Series A1 Principal (Rs Cr) 47.9 LF as % of initial POS 62.8 Series A2 Principal (subordinated to A1) (Rs Cr) ,654 EIS 8.7% Average Maturity (Fortnights) 33.6 OC 2.0% Average Seasoning' (Fortnights) 9.6 Pool Maturity Apr %, 0% Maturity (months) 22 Months Post Securitisation Balance Tenure (Months) Pool Amortisation % % Amortisation (Series A1 Principal) % Amortisation (Series A2 Principal) 51.4% 30+ (% of Initial POS) 4.9% 8.0% 90+ (% of Initial POS) 3.6% 5.6% 30+ (% of Balance POS) 30.1% 16.0% 90+ (% of Balance POS) 16.5% 9.6% Amt (% of Initial POS) 10.1% 7.0% CC as % of Balance POS 113.6% 26.5% FLF as % of Balance POS LF as % of Balance POS Balance CC (unutilized) Balance FLF (unutilized) Balance LF (unutilized) 90.9% 92.9% (3 month average) 77.0% 86.5% Break even 71.6% Break even (FLF) Overall enhancement coverage (30+ DPD) 1.8 Overall enhancement coverage (90+ DPD) 2.9 FL enhancement Coverage (30+ DPD) FL enhancement Coverage (90+ DPD) Cumulative Prepayment 3.4% 2.2% 12.0% 30+ dpd 90+ dpd 120% 9.0% 6.0% 80% 3.0% 40% M1 M4 M7 M10 M13 0% M1 M4 M7 M10 M13 13
15 Rating Casca IFMR Capital 2016 Asirvad Microfinance Limited (AMFL) Withdrawn Microfinance (100%) Jul-16 CC as % of initial POS 4.5% Par First Loss Credit Facility 66.7 Second Loss Credit Facility Series A1 Principal (Rs Cr) 58.7 LF as % of initial POS 76.4 Series A2 Principal (subordinated to A1) (Rs Cr) ,158 EIS 8.5% Average Maturity (Months) 15.3 OC 2.0% Average Seasoning' (Months) 6.7 Pool Maturity May %, 0% Maturity (months) 23 Months Post Securitisation Balance Tenure (Months) 6 9 Pool Amortisation 99.3% 86.2% Amortisation (Series A1 Principal) % Amortisation (Series A2 Principal) 79.3% 30+ (% of Initial POS) 4.1% 5.9% 90+ (% of Initial POS) 3.8% 4.7% 30+ (% of Balance POS) 68.0% 15.8% 90+ (% of Balance POS) 55.7% 10.8% Amt (% of Initial POS) 3.9% 4.5% CC as % of Balance POS 619.9% 32.6% FLF as % of Balance POS LF as % of Balance POS Balance CC (unutilized) Balance FLF (unutilized) Balance LF (unutilized) 95.7% 95.4% (3 month average) 97.8% 97.5% Break even 56.1% Break even (FLF) Overall enhancement coverage (30+ DPD) 2.8 Overall enhancement coverage (90+ DPD) 4.1 FL enhancement Coverage (30+ DPD) FL enhancement Coverage (90+ DPD) Cumulative Prepayment 9.6% 7.1% 8.0% 30+ dpd 90+ dpd 120% 6.0% 4.0% 80% 2.0% 40% M1 M4 M7 M10 M13 0% M1 M4 M7 M10 M13 14
16 Rating Travis IFMR Capital 2016 Asirvad Microfinance Limited (AMFL) Withdrawn Microfinance (100%) Sep-16 CC as % of initial POS 4.0% Par First Loss Credit Facility 50.6 Second Loss Credit Facility Series A1 Principal (Rs Cr) 44.0 LF as % of initial POS 57.2 Series A2 Principal (subordinated to A1) (Rs Cr) ,626 EIS 7.7% Average Maturity (Months) 15.6 OC 4.0% Average Seasoning' (Months) 6.9 Pool Maturity Jun %, 0% Maturity (months) 21 Months Post Securitisation 12 9 Balance Tenure (Months) 9 12 Pool Amortisation 92.3% 76.2% Amortisation (Series A1 Principal) % Amortisation (Series A2 Principal) 61.2% 30+ (% of Initial POS) 1 6.8% 90+ (% of Initial POS) 6.3% 4.4% 30+ (% of Balance POS) 39.0% 12.9% 90+ (% of Balance POS) 13.4% 7.0% Amt (% of Initial POS) 8.3% 5.6% CC as % of Balance POS 51.6% 16.8% FLF as % of Balance POS LF as % of Balance POS Balance CC (unutilized) Balance FLF (unutilized) Balance LF (unutilized) 91.7% 93.8% (3 month average) 80.6% 90.8% Break even 36.5% 63.0% Break even (FLF) Overall enhancement coverage (30+ DPD) 2.9 Overall enhancement coverage (90+ DPD) 5.3 FL enhancement Coverage (30+ DPD) FL enhancement Coverage (90+ DPD) Cumulative Prepayment 4.3% 2.6% 12.0% 30+ dpd 90+ dpd 110% 8.0% 80% 4.0% 50% M1 M3 M5 M7 M9 M11 20% M1 M3 M5 M7 M9 M11 15
17 Rating Brewster IFMR Capital 2016 Asirvad Microfinance Limited (AMFL) Series A1 PTC- CARE A (SO) and Series A2 PTC- CARE BBB+ (SO) Microfinance (100%) Jun-17 CC as % of initial POS 5.2% Par First Loss Credit Facility 52.1 Second Loss Credit Facility Series A1 Principal (Rs Cr) 43.8 LF as % of initial POS 58.0 Series A2 Principal (subordinated to A1) (Rs Cr) ,894 EIS 8.4% Average Maturity (Months) 14.9 OC 13.0% Average Seasoning' (Months) 8.6 Pool Maturity Mar %, 0% Maturity (months) 21 Months Post Securitisation 3 - Balance Tenure (Months) 18 - Pool Amortisation 33.2% - Amortisation (Series A1 Principal) 39.7% - Amortisation (Series A2 Principal) (% of Initial POS) 0.3% (% of Initial POS) (% of Balance POS) 0.3% (% of Balance POS) - Amt (% of Initial POS) 0.2% - CC as % of Balance POS 7.8% - FLF as % of Balance POS - LF as % of Balance POS - Balance CC (unutilized) 10 - Balance FLF (unutilized) - Balance LF (unutilized) % - (3 month average) 99.2% - Break even 67.6% - Break even (FLF) - Overall enhancement coverage (30+ DPD) >30 - Overall enhancement coverage (90+ DPD) >30 - FL enhancement Coverage (30+ DPD) - FL enhancement Coverage (90+ DPD) - Cumulative Prepayment 1.3% - 16
18 Rating Canopus IFMR Capital 2016 Asirvad Microfinance Limited (AMFL) Series A1 PTC- CARE A (SO) and Series A2 PTC- CARE A- (SO) Microfinance (100%) Jul-17 CC as % of initial POS 4.4% Par First Loss Credit Facility 51.2 Second Loss Credit Facility Series A1 Principal (Rs Cr) 43.0 LF as % of initial POS 57.6 Series A2 Principal (subordinated to A1) (Rs Cr) ,601 EIS 9.2% Average Maturity (Months) 14.7 OC 13.0% Average Seasoning' (Months) 6.9 Pool Maturity Apr %, 0% Maturity (months) 21 Months Post Securitisation 2 - Balance Tenure (Months) 19 - Pool Amortisation 19.1% - Amortisation (Series A1 Principal) 22.8% - Amortisation (Series A2 Principal) (% of Initial POS) 0.1% (% of Initial POS) (% of Balance POS) 0.1% (% of Balance POS) - Amt (% of Initial POS) 0.1% - CC as % of Balance POS 5.4% - FLF as % of Balance POS - LF as % of Balance POS - Balance CC (unutilized) 10 - Balance FLF (unutilized) - Balance LF (unutilized) % - (3 month average) - Break even 72.8% - Break even (FLF) - Overall enhancement coverage (30+ DPD) >30 - Overall enhancement coverage (90+ DPD) - FL enhancement Coverage (30+ DPD) - FL enhancement Coverage (90+ DPD) - Cumulative Prepayment 0.9% - 17
19 Aptus Value Housing Finance Limited (AVHFIL - 2 Pools) Key financial indicators For the year ended as on 31st March (12m, A) (12m, A) (12m, A) Total Income (in Rs. Cr) Profit After Tax (in Rs. Cr) Net worth (in Rs. Cr) Gross NPA ratio (%) Capital Adequacy Ratio (CAR) (%) P*=Provisional, A=Audited Total income stood at Rs Cr in FY17, as compared to Rs. 78 Crore in FY16. The Gross NPA ratio increased from 0.41% as on March 31, 2016 to 0.45% as on March 31 st AMFPL reported regulatory CAR of 98.07% as on FY17. 18
20 Rating Ariel SBL IFMR Capital 2015 Aptus Value Housing Finance India Limited (AVHFIL) Series A1 PTC - CARE A- (SO) and Series A2 PTC - CARE BBB+ (SO) Small Business Loans (100%) Jan-16 CC as % of initial POS 2.5% Par First Loss Credit Facility 14.2 Second Loss Credit Facility Series A1 Principal (Rs Cr) 12.6 LF as % of initial POS 24.2 Series A2 Principal (subordinated to A1) (Rs Cr) EIS 42.1% Average Maturity (months) 63.1 OC 9.0% Average Seasoning' (months) 24.6 Pool Maturity Feb Maturity (months) 133 Months Post Securitisation Pool Amortisation Amortisation (Series A1 Principal) Amortisation (Series A2 Principal) 53.3% 59.9% 47.8% 53.7% 90+ (% of Initial POS) 2.1% 1.1% 180+ (% of Initial POS) 1.0% 0.7% 90+ (% of Balance POS) 2.4% 1.0% 180+ (% of Balance POS) 0.6% 0.4% Amt (% of Initial POS) 1.1% 0.8% CC as % of Balance POS 5.4% 4.8% FLF as % of Balance POS LF as % of Balance POS Balance CC (unutilized) Balance FLF (unutilized) Balance LF (unutilized) 94.1% 94.5% (3 month average) 92.0% 94.4% Break even 57.4% 59.2% Break even (FLF) Overall enhancement coverage (90+ DPD) 17.7 >30 Overall enhancement coverage (180+ DPD) >30 >30 FL enhancement Coverage (90+ DPD) FL enhancement Coverage (180+ DPD) Cumulative Prepayment 33.6% 31.0% 5.0% 90+ dpd 180+ dpd 120% 4.0% 3.0% 2.0% 100% 80% 1.0% 60% M1 M4 M7 M10 M13 M16 M19 40% M1 M4 M7 M10 M13 M16 M19 19
21 Rating Attis SBL IFMR Capital 2016 Aptus Value Housing Finance India Limited (AVHFIL) Series A1 PTC - CARE A- (SO) and Series A2 PTC - CARE BBB (SO) Small Business Loans (100%) Feb-16 CC as % of initial POS 2.5% Par First Loss Credit Facility 25.9 Second Loss Credit Facility Series A1 Principal (Rs Cr) 23.1 LF as % of initial POS 48.2 Series A2 Principal (subordinated to A1) (Rs Cr) EIS 47.7% Average Maturity (months) 83.3 OC 9.0% Average Seasoning' (months) 16.3 Pool Maturity Feb Maturity (months) 108 Months Post Securitisation Pool Amortisation 39.9% 33.5% Amortisation (Series A1 Principal) 44.9% 37.6% Amortisation (Series A2 Principal) 90+ (% of Initial POS) 0.6% 0.4% 180+ (% of Initial POS) 0.3% 0.3% 90+ (% of Balance POS) 0.4% 0.2% 180+ (% of Balance POS) Amt (% of Initial POS) 0.5% 0.4% CC as % of Balance POS 4.2% 3.8% FLF as % of Balance POS LF as % of Balance POS Balance CC (unutilized) Balance FLF (unutilized) Balance LF (unutilized) 93.9% 94.2% (3 month average) 92.1% 91.8% Break even 61.3% 63.1% Break even (FLF) Overall enhancement coverage (90+ DPD) >30 >30 Overall enhancement coverage (180+ DPD) >30 >30 FL enhancement Coverage (90+ DPD) FL enhancement Coverage (180+ DPD) Cumulative Prepayment 27.5% 22.9% 5.0% 90+ dpd 180+ dpd 120% 4.0% 3.0% 100% 2.0% 1.0% 80% M1 M4 M7 M10 M13 M16 M19 60% M1 M4 M7 M10 M13 M16 M19 20
22 Arohan Financial Services Private Limited (Arohan 1 Pools) Key Financial Indicators For the year ended as on 31st March (12m, A) (12m, A) (12m, A) Total Income (in Rs. Cr) Profit After Tax (in Rs. Cr) Net worth (in Rs. Cr) Gross NPA Capital Adequacy Ratio (CAR) P*=Provisional, A=Audited Total Income of Arohan has increased by 64% in FY17 to Rs crore with PAT increasing by 26.54%. With capital infusion during FY17, the capital adequacy increased to 39.35% as on March The Gross NPA remained stable at 0.36%. 21
23 Rating Mace IFMR Capital 2017 Arohan Financial Services Private Limited (AFSPL) Series A1 PTC - CARE A- (SO) and Series A2 PTC - CARE BBB+ (SO) Microfinance (100%) Mar-17 CC as % of initial POS 5.8% Par First Loss Credit Facility 35.8 Second Loss Credit Facility Series A1 Principal (Rs Cr) 31.8 LF as % of initial POS 39.3 Series A2 Principal (subordinated to A1) (Rs Cr) ,408 EIS 7.7% Average Maturity (Months) 8.8 OC 9.5% Average Seasoning' (Months) 7.0 Pool Maturity Dec %, 0% Maturity (months) 21 Months Post Securitisation 6 3 Balance Tenure (Months) Pool Amortisation 71.9% 41.4% Amortisation (Series A1 Principal) 82.5% 46.6% Amortisation (Series A2 Principal) 30+ (% of Initial POS) 1.1% 0.7% 90+ (% of Initial POS) 0.4% 30+ (% of Balance POS) 1.7% 0.9% 90+ (% of Balance POS) 0.6% Amt (% of Initial POS) 0.9% 0.8% CC as % of Balance POS 20.6% 9.9% FLF as % of Balance POS LF as % of Balance POS Balance CC (unutilized) Balance FLF (unutilized) Balance LF (unutilized) 98.8% 98.2% (3 month average) 99.6% 98.2% Break even 38.6% 68.4% Break even (FLF) Overall enhancement coverage (30+ DPD) >30 > 30 Overall enhancement coverage (90+ DPD) >30 FL enhancement Coverage (30+ DPD) FL enhancement Coverage (90+ DPD) Cumulative Prepayment 2.6% 1.9% 3.0% 30+ dpd 90+ dpd 120% 2.0% 90% 1.0% 60% M1 M2 M3 M4 M5 M6 30% M1 M2 M3 M4 M5 M6 22
24 Annapurna Microfinance Private Limited (AMPL 4 Pools) Key financial indicators For the year ended as on 31st March (12m, A) (12m, A) (12m, A) Total Income (in Rs. Cr) Profit After Tax (in Rs. Cr) Net worth (in Rs. Cr) Gross NPA ratio (%) Capital Adequacy Ratio (CAR) (%) P*=Provisional, A=Audited Total income stood at Rs Crore in FY16 as compare to crore as in FY15. The Gross NPA ratio reduced from 0.10% as on March 31, 2015 to 0.07% as on March 31 st AMFPL reported regulatory CAR of 19.43% as on FY16. 23
25 24
26 25
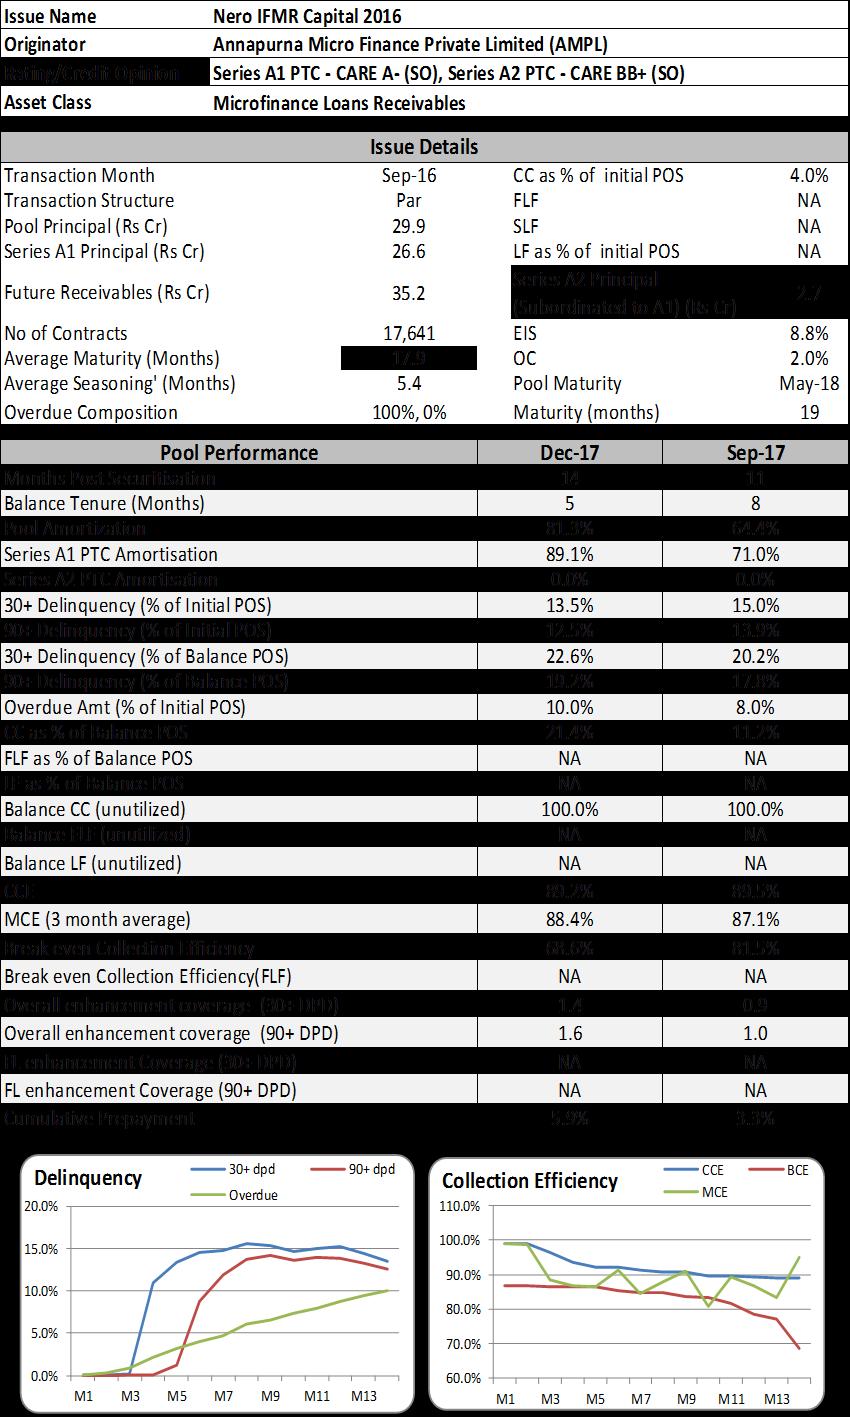
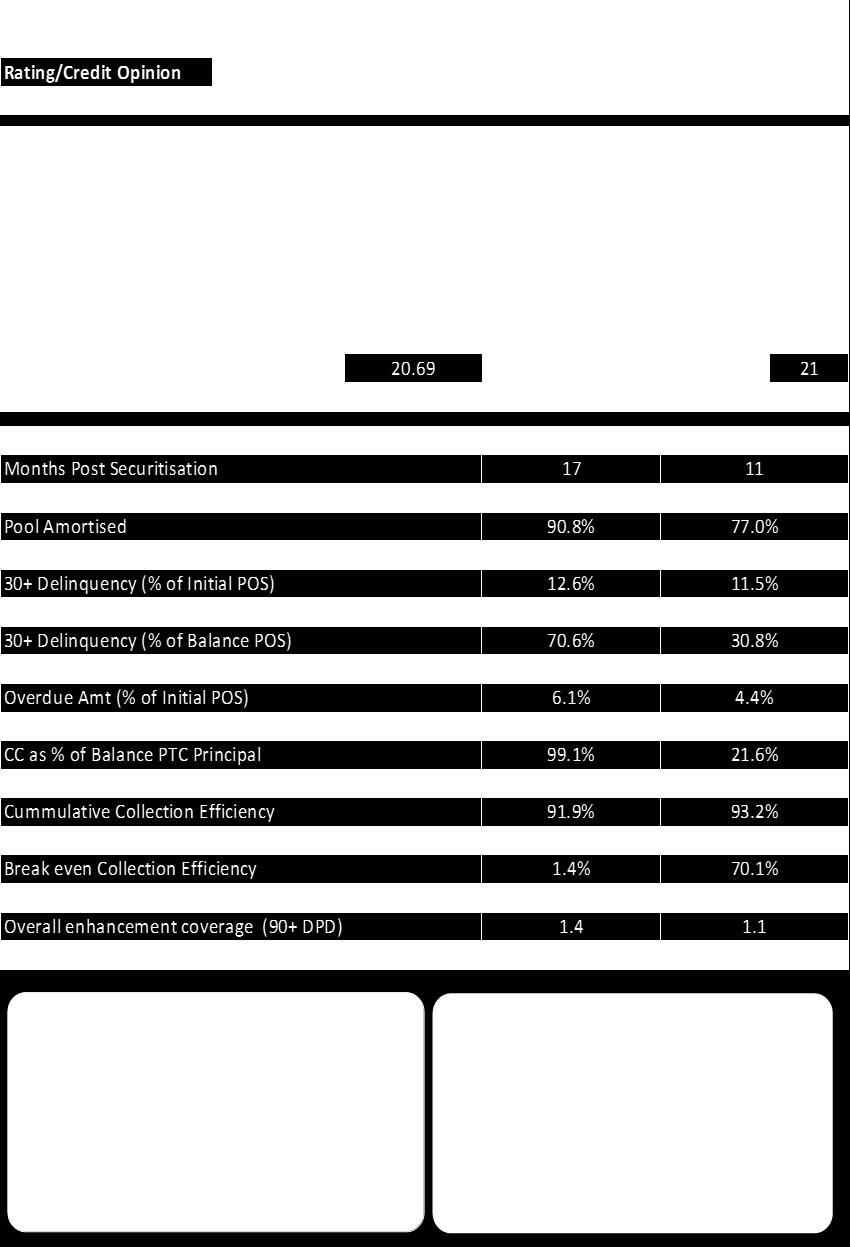
27 Rating/Credit Opinion Gale IFMR Capital 2016 Annapurna Micro Finance Private Limited (AMPL) Series A1 PTC - CARE A- (SO), Series A2 PTC - CARE BB (SO) Microfinance Loans Receivables Series A1 Principal (Rs Cr) Average Maturity (Months) Average Seasoning' (Months) Dec-16 CC as % of initial POS 4.5% Par FLF 25.4 SLF 22.6 LF as % of initial POS 29.7 Series A2 Principal (Subordinated to A1) (Rs Cr) ,736 EIS 9.0% 16.4 OC 1.0% 5.9 Pool Maturity Aug %, 0% Maturity (months) 19 Months Post Securitisation 8 5 Balance Tenure (Months) Pool Amortization 55.5% 35.6% Series A1 PTC Amortisation 63.4% 41.0% Series A2 PTC Amortisation 30+ (% of Initial POS) 2.2% 1.8% 90+ (% of Initial POS) 30+ (% of Balance POS) 1.6% 2.8% 1.2% 2.0% 90+ (% of Balance POS) 1.8% 1.2% Amt (% of Initial POS) CC as % of Balance POS FLF as % of Balance POS LF as % of Balance POS Balance CC (unutilized) Balance FLF (unutilized) Balance LF (unutilized) 1.0% 10.1% % 0.6% 7.0% % (3 month average) 99.6% 100.4% Break even 78.2% 84.8% Break even (FLF) Overall enhancement coverage (30+ DPD) Overall enhancement coverage (90+ DPD) FL enhancement Coverage (30+ DPD) FL enhancement Coverage (90+ DPD) Cumulative Prepayment 3.8% 1.0% 4.0% 30+ dpd 90+ dpd % % 1.0% M1 M2 M3 M4 M5 M6 M7 M8 6 M1 M2 M3 M4 M5 M6 M7 M8 26
28 Rating/Credit Opinion Herrera IFMR Capital 2017 Annapurna Micro Finance Private Limited (AMPL) Series A1 PTC - CARE A- (SO), Series A2 PTC - CARE BB+ (SO) Microfinance Loans Receivables Series A1 Principal (Rs Cr) Average Maturity (Months) Average Seasoning' (Months) Mar-17 CC as % of initial POS 6.0% Par FLF 47.6 SLF 41.5 LF as % of initial POS 55.6 Series A2 Principal (Subordinated to A1) (Rs Cr) ,677 EIS 10.7% 15.6 OC 4.0% 4.8 Pool Maturity Nov %, 0% Maturity (months) 20 Months Post Securitisation 6 3 Balance Tenure (Months) Pool Amortization 42.0% 21.9% Series A1 PTC Amortisation Series A2 PTC Amortisation 49.2% 25.8% 30+ (% of Initial POS) 90+ (% of Initial POS) 30+ (% of Balance POS) 90+ (% of Balance POS) Amt (% of Initial POS) CC as % of Balance POS 0.4% 0.2% 0.5% 0.2% 0.1% 10.3% 0.2% 0.1% 0.2% 0.1% 0.1% 7.7% FLF as % of Balance POS LF as % of Balance POS Balance CC (unutilized) Balance FLF (unutilized) Balance LF (unutilized) 99.7% 99.7% (3 month average) Break even 100.3% 76.5% 99.8% 80.7% Break even (FLF) Overall enhancement coverage (30+ DPD) >30 >30 Overall enhancement coverage (90+ DPD) >30 >30 FL enhancement Coverage (30+ DPD) FL enhancement Coverage (90+ DPD) Cumulative Prepayment 0.9% 0.1% 2.0% 30+ dpd 90+ dpd % % 0.5% M1 M2 M3 M4 M5 M6 6 M1 M2 M3 M4 M5 M6 27
29 Bharat Financial Inclusion Limited (erstwhile SKS Microfinance Ltd) (BFIL 6 Pools) Key Financial Indicators For the year ended as on 31st March (12m, A) (12m, A) (12m, A) Total Income (in Rs. Cr) 803 1, Profit After Tax (in Rs. Cr) Net worth (in Rs. Cr) 1,041 1,378 2,442 Gross NPA/Gross Advances(%) Capital Adequacy Ratio (CAR) P*=Provisional, A=Audited Total income for the FY17 increased by 30.81% to Rs. 1,728 crores from Rs. 1,321 crores in FY16. BFIL has registered net profit of Rs. 290 crores for FY17. Asset quality deteriorated post demonetisation with Gross NPA increasing to 6.0% in FY17. BFIL continues to have comfortable capital adequacy ratio (CAR) at 33.5% 28
30 Rating Indian Microfinance Loan Receivables Trust November 2015 Bharat Financial Inclusion Ltd (Erstwhile SKS Microfinance Ltd) Withdrawn Microfinance Loans PTC Series A Principal (Rs Cr) Average Maturity (Weeks) Average Seasoning' (Weeks) Nov-15 CC as % of initial POS 5.0% Par FLF SLF LF as % of initial POS EIS 11.8% 1,09, OC Pool Maturity 8.0% Jul %, 0% Maturity (months) 20 Pool Performance Jul-17 Jun-17 Months Post Securitisation Balance Tenure (Months) 0 1 Pool Amortisation % Series A PTC Amortisation % 30+ (% of Initial POS) 2.2% 2.4% 90+ (% of Initial POS) 2.1% 2.1% 30+ (% of Balance POS) 16.0% 90+ (% of Balance POS) 10.9% Amt (% of Initial POS) 2.2% 2.3% CC as % of Balance POS 566.7% CC as % of Balance PTC Principal 712.8% Balance CC (unutilized) % 97.9% (3 month average) 99.9% 94.2% Break even Overall enhancement coverage (30+ DPD) Overall enhancement coverage (90+ DPD) Cumulative Prepayment 1.9% 1.9% 3.0% 30+ dpd 90+ dpd 120% 2.0% 90% 60% 1.0% 30% M1 M4 M7 M10 M13 M16 M19 0% M2 M5 M8 M11 M14 M17 M20 29
31 Rating Indian Microfinance Loan Receivables Trust January 2016 Bharat Financial Inclusion Ltd (Erstwhile SKS Microfinance Ltd) Withdrawn Microfinance Loans PTC Series A Principal (Rs Cr) Average Maturity (Weeks) Average Seasoning (Weeks) Jan-16 CC as % of initial 5.0% Par FLF SLF LF as % of initial POS EIS 6.7% 5,49, OC Pool Maturity 7.5% Nov %, 0% Maturity (months) 22 Months Post Securitisation Balance Tenure (Months) 2 5 Pool Amortisation 98.7% 94.1% Series A PTC Amortisation 98.7% 94.3% 30+ (% of Initial POS) 1.0% 1.2% 90+ (% of Initial POS) 1.0% 0.9% 30+ (% of Balance POS) 9.5% 8.9% 90+ (% of Balance POS) 7.2% 5.7% Amt (% of Initial POS) 0.9% 0.7% CC as % of Balance POS 397.6% 85.2% CC as % of Balance PTC Principal 409.0% 94.5% Balance CC (unutilized) % 99.3% (3 month average) 94.4% 94.9% Break even 8.5% Overall enhancement coverage (30+ DPD) 10.3 Overall enhancement coverage (90+ DPD) 15.9 Cumulative Prepayment 2.1% 1.9% 2.0% 30+ dpd 90+ dpd 120% 1.5% 1.0% 80% 0.5% 40% M1 M4 M7 M10 M13 M16 M19 0% M1 M4 M7 M10 M13 M16 M19 30
32 Rating Indian Microfinance Loan Receivables Trust March 2016 B Bharat Financial Inclusion Ltd (Erstwhile SKS Microfinance Ltd) Series A PTC - CARE AAA (SO) Microfinance Loans PTC Series A Principal (Rs Cr) Average Maturity (Weeks) Average Seasoning' (Weeks) Mar-16 CC as % of initial POS 5.0% Par First Loss Credit Facility Second Loss Credit Facility LF as % of initial POS EIS 6.8% 4,02, Principal Subordination as a % of Pool Principal Pool Maturity 7.5% Jan %, 0% Maturity (months) 22 Months Post Securitisation Balance Tenure (Months) 4 7 Pool Amortisation 94.0% 88.2% Series A PTC Amortisation 93.9% 88.2% 30+ (% of Initial POS) 1.9% 2.1% 90+ (% of Initial POS) 1.7% 1.5% 30+ (% of Balance POS) 10.3% 9.8% 90+ (% of Balance POS) 7.8% 6.3% Amt (% of Initial POS) 1.4% 1.0% CC as % of Balance POS 82.7% 42.4% CC as % of Balance PTC Principal 88.8% 46.3% Balance CC (unutilized) % 99.0% (3 month average) 93.6% 94.1% Break even 9.4% 46.2% Overall enhancement coverage (30+ DPD) Overall enhancement coverage (90+ DPD) Cumulative Prepayment 1.8% 1.7% 3.0% 30+ dpd 90+ dpd 120% 2.0% 80% 1.0% 40% M1 M4 M7 M10 M13 M16 0% M1 M3 M5 M7 M9 M11 M13 M15 M17 31
33 Rating Indian Microfinance Loan Receivables Trust September 2016 Bharat Financial Inclusion Limited Series A PTC - CARE AA (SO) Microfinance Loans PTC Series A Principal (Rs Cr) Average Maturity (Weeks) Average Seasoning' (Weeks) Sep-16 CC as % of initial POS 5.0% Par First Loss Credit Facility Second Loss Credit Facility 99.6 LF as % of initial POS EIS 6.8% 53, Principal Subordination as a % of Pool Principal Pool Maturity 7.75% Jun %, 0% Maturity (months) 22 Months Post Securitisation Balance Tenure (Months) 9 12 Pool Amortisation 79.0% 71.7% Series A PTC Amortisation 79.0% 71.7% 30+ (% of Initial POS) 7.0% 7.2% 90+ (% of Initial POS) 6.0% 5.6% 30+ (% of Balance POS) 13.2% 11.8% 90+ (% of Balance POS) 9.5% 7.8% Amt (% of Initial POS) 4.2% 3.9% CC as % of Balance POS 23.8% 17.6% CC as % of Balance PTC Principal 25.8% 19.2% Balance CC (unutilized) % 95.1% (3 month average) 96.4% 95.1% Break even 56.1% 63.5% Overall enhancement coverage (30+ DPD) Overall enhancement coverage (90+ DPD) Cumulative Prepayment 0.9% 0.8% 8.0% 6.0% 4.0% 2.0% 30+ dpd 90+ dpd M1 M3 M5 M7 M9 M11 M13 120% 100% 80% 60% 40% M1 M3 M5 M7 M9 M11 M13 32
34 Rating Indian Microfinance Loan Receivables Trust March 2017 Bharat Financial Inclusion Limited Series A PTC - CARE AA (SO) Microfinance Loans PTC Series A Principal (Rs Cr) Average Maturity (Weeks) Average Seasoning' (Weeks) Mar-17 CC as % of initial POS 6.3% Par First Loss Credit Facility Second Loss Credit Facility LF as % of initial POS EIS 7.9% 1,27, Principal Subordination as a % of Pool Principal Pool Maturity 8.50% Jan %, 0% Maturity (months) 22 Months Post Securitisation 6 3 Balance Tenure (Months) Pool Amortisation Series A PTC Amortisation 40.8% 40.8% 19.9% 19.9% 30+ (% of Initial POS) 0.4% 0.3% 90+ (% of Initial POS) 0.3% 30+ (% of Balance POS) 0.5% 0.3% 90+ (% of Balance POS) 0.3% Amt (% of Initial POS) 0.2% 0.1% CC as % of Balance POS 10.6% 7.9% CC as % of Balance PTC Principal 11.6% 8.6% Balance CC (unutilized) % 99.7% (3 month average) 99.4% 99.7% Break even 78.0% 79.5% Overall enhancement coverage (30+ DPD) >30 >30 Overall enhancement coverage (90+ DPD) >30 >30 Cumulative Prepayment 0.5% 0.2% 1.5% 30+ dpd 90+ dpd 120% 1.0% 100% 0.5% 80% M1 M2 M3 M4 M5 M6 60% M1 M2 M3 M4 M5 M6 33
35 Rating Indian Microfinance Loan Receivables Trust July 2017 Bharat Financial Inclusion Limited Series A PTC - CARE AA (SO) Microfinance Loans PTC Series A Principal (Rs Cr) Average Maturity (Weeks) Average Seasoning' (Weeks) Aug-17 CC as % of initial POS 5.7% Par First Loss Credit Facility Second Loss Credit Facility LF as % of initial POS EIS 8.3% 1,23, Principal Subordination as a % of Pool Principal Pool Maturity 8.00% Apr %, 0% Maturity (months) 21 Months Post Securitisation 2 - Balance Tenure (Months) 19 - Pool Amortisation 9.8% - Series A PTC Amortisation 9.8% (% of Initial POS) (% of Initial POS) (% of Balance POS) (% of Balance POS) - Amt (% of Initial POS) - CC as % of Balance POS 6.3% - CC as % of Balance PTC Principal 6.9% - Balance CC (unutilized) % - (3 month average) - Break even 78.8% - Overall enhancement coverage (30+ DPD) > 30 - Overall enhancement coverage (90+ DPD) - Cumulative Prepayment 0.1% - 34
36 Cholamandalam Investment Finance Company Ltd. (CIFCL 1 Pool) Key Financial Indicators For the year ended as on 31st March (12m, A) (12m, A) (12m, A) Total Income (in Rs. Cr) 3,691 4,193 4,660 Profit After Tax (in Rs. Cr) Net worth (in Rs. Cr) 3,172 3,657 4,313 Gross NPA (%) Capital Adequacy Ratio (CAR) P*=Provisional, A=Audited During FY16, CIFCL reported an operating income of Rs. 4,660 crore (growth of 11.14% yoy) and PAT of Rs. 719 crore (growth of 26.58% y-o-y) The overall asset quality of CIFCL had seen deterioration over the years. The gross NPA has increased to 5.69% in FY17 and compared to 3.53% in FY16. The CAR declined marginally to 18.64% as on March 31, 2017 as against 19.68% as on March 31,
37 Rating/Credit Opinion Platinum Trust Jan -14 Cholamandalam Investment and Finance Company Ltd. (CIFCL) Series A PTCs - CARE AAA (SO) Loan Against property Average Maturity (Months) Average Seasoning' (Months) Jan-14 CC as % of initial POS 10.5% Par FLF SLF LF as % of initial POS 413 EIS 40.3% 62.8 Over Collateral 15.0 Pool Maturity Dec %, 0% Maturity (months) 168 Months Post Securitisation Amortisation 76.4% 73.0% 90+ (% of Initial POS) 7.5% 6.5% 180+ (% of Initial POS) 7.1% 5.7% 90+ (% of Balance POS) 20.6% 16.5% 180+ (% of Balance POS) 18.8% 14.0% Amt (% of Initial POS) 2.7% 2.1% CC as % of Balance POS 44.5% 39.0% FLF as % of Balance POS LF as % of Balance POS Balance CC (unutilized) Balance FLF (unutilized) Balance LF (unutilized) 94.2% 94.8% (3 month average) 82.1% 101.8% Break even 54.3% 57.5% Break even (FLF) Overall enhancement coverage (90+ DPD) Overall enhancement coverage (180+ DPD) FL enhancement Coverage (90+ DPD) FL enhancement Coverage (180+ DPD) Cumulative Prepayment 61.6% 59.2% 8.0% 6.0% 4.0% 2.0% 90+ dpd 180+ dpd M1 M7 M13 M19 M25 M31 M37 M M1 M7 M13 M19 M25 M31 M37 M43 36
38 Dewan Housing Finance Limited (DHFL 13 Pools) Key Financial Indicators For the year ended as on 31st March (12m, A) (12m, A) (12m, A) Total Income (in Rs. Cr) 5,982 7,317 10,827 Profit After Tax (in Rs. Cr) ,896 Net worth (in Rs. Cr) 4,636 4,981 7,989 Gross NPA (%) Capital Adequacy Ratio (CAR) (%) DHFL reported PAT of Rs. 2,896 crore on total income of Rs. 10,827 crore during FY17 as compared to PAT of Rs. 729 crore on total income of Rs. 7,317 crore during FY16. DHFL reported Gross NPA ratio of 0.94% in FY17. Over the years DHFL has developed the expertise in lending in the low-middle income group segment while maintaining stable asset quality parameters. DHFL reported the CAR of 19.34% as on March 31, 2017, as compared to 16.74% as on March 31,
39 Rating/Credit Opinion DHFL Direct Assignment Mar'12 I Dewan Housing Finance Limited Assignee Payout - CARE AAA (SO) Equivalent Housing Loans Receivables Average Maturity (Months) Average Seasoning' (Months) Mar-12 CC as % of initial POS 15.5% Par FLF SLF LF as % of initial POS 3,853 EIS 10.3% 91.0 OC 12.8 Pool Maturity Mar %, 0% Maturity (months) 240 Months Post Securitisation Amortisation 65.4% 63.6% 90+ (% of Initial POS) 0.2% 0.4% 180+ (% of Initial POS) 0.2% 0.3% 90+ (% of Balance POS) 0.4% 0.8% 180+ (% of Balance POS) 0.4% 0.6% Amt (% of Initial POS) 0.1% 0.1% CC as % of Balance POS 44.8% 42.5% FLF as % of Balance POS LF as % of Balance POS Balance CC (unutilized) Balance FLF (unutilized) Balance LF (unutilized) 99.7% 99.7% (3 month average) 101.5% 100.5% Break even 66.3% 67.8% Break even (FLF) Overall enhancement coverage (90+ DPD) >30 >30 Overall enhancement coverage (180+ DPD) >30 >30 FL enhancement Coverage (90+ DPD) FL enhancement Coverage (180+ DPD) Cumulative Prepayment 43.8% 42.9% 5.0% 4.0% 3.0% 2.0% 1.0% 90+ dpd 180+ dpd M1 M11 M21 M31 M41 M51 M M1 M11 M21 M31 M41 M51 M61 \ 38
40 Rating/Credit Opinion DHFL Direct Assignment Mar'12 II Dewan Housing Finance Limited Assignee Payout - CARE AAA (SO) Equivalent Housing Loans Receivables Average Maturity (Months) Average Seasoning' (Months) Mar-12 CC as % of initial POS 13.0% Par FLF SLF LF as % of initial POS 3,874 EIS 20.9% 92.4 OC 16.6 Pool Maturity Mar %, 0% Maturity (months) 300 Months Post Securitisation Amortisation 66.5% 64.3% 90+ (% of Initial POS) 0.2% 0.2% 180+ (% of Initial POS) 0.2% 0.2% 90+ (% of Balance POS) 0.4% 0.4% 180+ (% of Balance POS) 0.3% 0.3% Amt (% of Initial POS) 0.1% 0.1% CC as % of Balance POS 38.8% 36.4% FLF as % of Balance POS LF as % of Balance POS Balance CC (unutilized) Balance FLF (unutilized) Balance LF (unutilized) 99.6% 99.6% (3 month average) 99.4% 10 Break even 68.3% 70.1% Break even (FLF) Overall enhancement coverage (90+ DPD) >30 >30 Overall enhancement coverage (180+ DPD) >30 >30 FL enhancement Coverage (90+ DPD) FL enhancement Coverage (180+ DPD) Cumulative Prepayment 45.7% 44.4% 5.0% 4.0% 3.0% 2.0% 1.0% 90+ dpd 180+ dpd M1 M14 M27 M40 M53 M M1 M14 M27 M40 M53 M66 39
41 Rating/Credit Opinion DHFL Direct Assignment Mar'12 III Dewan Housing Finance Limited Assignee Payout - CARE AAA (SO) Equivalent Housing Loans Receivables Average Maturity (Months) Average Seasoning' (Months) Mar-12 CC as % of initial POS 14.0% Par FLF SLF LF as % of initial POS 1,444 EIS 12.5% 90.5 OC 17.1 Pool Maturity Mar %, 0% Maturity (months) 240 Months Post Securitisation Amortisation 67.1% 64.7% 90+ (% of Initial POS) 0.4% 0.7% 180+ (% of Initial POS) 0.3% 0.5% 90+ (% of Balance POS) 0.9% 1.4% 180+ (% of Balance POS) 0.6% 1.0% Amt (% of Initial POS) 0.2% 0.2% CC as % of Balance POS 42.6% 39.6% FLF as % of Balance POS LF as % of Balance POS Balance CC (unutilized) Balance FLF (unutilized) Balance LF (unutilized) 99.6% 99.6% (3 month average) 100.5% 100.2% Break even 68.2% 70.1% Break even (FLF) Overall enhancement coverage (90+ DPD) > Overall enhancement coverage (180+ DPD) > FL enhancement Coverage (90+ DPD) FL enhancement Coverage (180+ DPD) Cumulative Prepayment 46.7% 45.1% 5.0% 4.0% 3.0% 2.0% 1.0% 90+ dpd 180+ dpd M1 M11 M21 M31 M41 M51 M61 110% 100% 90% 80% 70% 60% M1 M11 M21 M31 M41 M51 M61 40
42 Rating/Credit opinion Nirmaan RMBS Trust - Series II Dewan Housing Finance Limited Series A1 PTCs - CARE AAA(SO) & Series A2 PTC - CARE AA- (SO) Housing Loans Receivables Jun-13 CC as % of initial POS 8.0% Par FLF SLF Series A1 Principal (Rs Cr) LF as % of initial POS Average Maturity (Months) Average Seasoning' (Months) Series A2 Principal (subordinated to A1) (Rs Cr) ,110 EIS 33.6% OC 4.0% 17.9 Pool Maturity Jun %, 0% Maturity (months) 300 Months Post Securitisation Pool Amortisation % % Amortisation (Series A1 Principal) 59.0% 56.8% Amortisation (Series A2 Principal) 59.0% 56.8% 90+ (% of Initial POS) 0.2% 0.2% 180+ (% of Initial POS) 0.1% 0.1% 90+ (% of Balance POS) 0.4% 0.4% 180+ (% of Balance POS) 0.3% 0.2% Amt (% of Initial POS) 0.1% 0.1% CC as % of Balance POS 19.5% 18.5% FLF as % of Balance POS LF as % of Balance POS Balance LF (unutilized) Balance FLF (unutilized) Balance LF (unutilized) 99.6% 99.6% (3 month average) 100.1% 100.3% Break even 78.1% 78.7% Break even (FLF) Overall enhancement coverage (90+ DPD) >30 >30 Overall enhancement coverage (180+ DPD) >30 >30 FL enhancement Coverage (90+ DPD) FL enhancement Coverage (180+ DPD) Cumulative Prepayment 46.6% 45.2% 5.0% 4.0% 3.0% 2.0% 1.0% 90+ dpd 180+ dpd M1 M8 M15 M22 M29 M36 M43 M50 110% 100% 90% 80% 70% M1 M8 M15 M22 M29 M36 M43 M50 41
43 Rating/Credit Opinion Nirmaan RMBS Trust - Series III Dewan Housing Finance Limited Series A1 PTCs - CARE AAA(SO) & Series A2 PTC - CARE AA (SO) Housing Loans Receivables Aug-13 CC as % of initial POS 8.4% Par FLF SLF Series A1 Principal (Rs Cr) LF as % of initial POS Series A2 Principal (subordinated to A1) (Rs Cr) ,791 EIS 23.2% Average Maturity (Months) 98.6 OC Average Seasoning' (Months) 33.4 Pool Maturity May %, 0% Maturity (months) 299 Months Post Securitisation Pool Amortisation 62.0% 59.4% Amortisation (Series A1 Principal) 62.0% 59.4% Amortisation (Series A2 Principal) 62.0% 59.4% 90+ (% of Initial POS) 0.2% 0.3% 180+ (% of Initial POS) 0.2% 0.2% 90+ (% of Balance POS) 0.5% 0.6% 180+ (% of Balance POS) 0.4% 0.5% Amt (% of Initial POS) 0.1% 0.1% CC as % of Balance POS 21.0% 19.7% FLF as % of Balance POS LF as % of Balance POS Balance CC (unutilized) Balance FLF (unutilized) Balance LF (unutilized) 99.8% 99.8% (3 month average) 100.2% 100.1% Break even 78.0% 78.9% Break even (FLF) Overall enhancement coverage (90+ DPD) >30 >30 Overall enhancement coverage (180+ DPD) >30 >30 FL enhancement Coverage (90+ DPD) FL enhancement Coverage (180+ DPD) Cumulative Prepayment 46.5% 44.8% 5.0% 4.0% 3.0% 2.0% 1.0% 90+ dpd 180+ dpd M1 M7 M13 M19 M25 M31 M37 M43 M49 110% 100% 90% 80% 70% M1 M7 M13 M19 M25 M31 M37 M43 M49 42
44 Rating/Credit Opinion Nirmaan RMBS Trust - Series IV Dewan Housing Finance Limited Series A1 PTCs - CARE AAA(SO) & Series A2 PTC - CARE AA (SO) Housing Loans Receivables Nov-13 CC as % of initial POS 8.0% Par FLF SLF Series A1 Principal (Rs Cr) LF as % of initial POS Series A2 Principal (subordinated to A1) (Rs Cr) 7.8 2,135 EIS 29.5% Average Maturity (Months) OC 4.0% Average Seasoning' (Months) 37.2 Pool Maturity Oct %, 0% Maturity (months) 360 Pool Performance Sep-17 Sep-17 Months Post Securitisation Pool Amortisation 57.3% 54.9% Amortisation (Series A1 Principal) 57.3% 54.9% Amortisation (Series A2 Principal) 57.3% 54.9% 90+ (% of Initial POS) 0.2% 0.4% 180+ (% of Initial POS) 0.2% 0.3% 90+ (% of Balance POS) 0.4% 0.7% 180+ (% of Balance POS) 0.4% 0.6% Amt (% of Initial POS) 0.1% 0.1% CC as % of Balance POS 18.7% 17.8% FLF as % of Balance POS LF as % of Balance POS Balance LF (unutilized) Balance FLF (unutilized) Balance LF (unutilized) 99.8% 99.8% (3 month average) 100.5% 99.5% Break even 78.6% 79.3% Break even (FLF) Overall enhancement coverage (90+ DPD) >30 >30 Overall enhancement coverage (180+ DPD) >30 >30 FL enhancement Coverage (90+ DPD) FL enhancement Coverage (180+ DPD) Cumulative Prepayment 42.3% 40.8% 5.0% 4.0% 3.0% 2.0% 1.0% 90+ dpd 180+ dpd M1 M6 M11 M16 M21 M26 M31 M36 M41 M46 110% 100% 90% 80% 70% M1 M6 M11 M16 M21 M26 M31 M36 M41 M46 43
45 Rating/Credit opinion Nirmaan RMBS Trust - Series III Dewan Housing Finance Limited Series A1 PTCs - CARE AAA(SO) & Series A2 PTC - CARE AA (SO) Housing Loans Receivables Mar-14 CC as % of initial POS 8.8% Par FLF 92.2 SLF Series A1 PTC Principal (Rs Cr) 88.5 LF as % of initial POS Series A2 Principal (subordinated to A1) (Rs Cr) EIS 34.7% Average Maturity (Months) OC 4.0% Average Seasoning' (Months) 22.8 Pool Maturity Feb %, 0% Maturity (months) 299 Months Post Securitisation Pool Amortisation 47.2% 44.3% Amortisation (Series A1 Principal) 47.2% 44.3% Amortisation (Series A2 Principal) 47.2% 44.3% 90+ (% of Initial POS) 180+ (% of Initial POS) 90+ (% of Balance POS) 180+ (% of Balance POS) Amt (% of Initial POS) CC as % of Balance POS 16.6% 15.7% FLF as % of Balance POS LF as % of Balance POS Balance CC (unutilized) Balance FLF (unutilized) Balance LF (unutilized) 99.9% 99.9% (3 month average) 99.7% 101.8% Break even 80.4% 80.7% Break even (FLF) Overall enhancement coverage (90+ DPD) Overall enhancement coverage (180+ DPD) FL enhancement Coverage (90+ DPD) FL enhancement Coverage (180+ DPD) Cumulative Prepayment 35.6% 33.7% 5.0% 90+ dpd 180+ dpd 110% 4.0% 100% 3.0% 2.0% 1.0% 90% 80% M1 M6 M11 M16 M21 M26 M31 M36 M41 70% M1 M6 M11 M16 M21 M26 M31 M36 M41 44
46 Rating/Credit Opinion Nirmaan RMBS Trust - Series IV Dewan Housing Finance Limited Series A PTCs - CARE AAA(SO) Housing Loans Receivables Average Maturity (Months) Average Seasoning' (Months) Mar-14 CC as % of initial POS 7.5% Par FLF 37.8 SLF 87.4 LF as % of initial POS 288 EIS 32.7% Mortgage Guarantee by IMGC Pool Maturity Dec %, 0% Maturity (months) 297 Months Post Securitisation Pool Amortisation 49.4% 46.0% Series A PTC Amortisation 49.4% 46.0% 90+ (% of Initial POS) 180+ (% of Initial POS) 90+ (% of Balance POS) 180+ (% of Balance POS) Amt (% of Initial POS) 0.1% CC as % of Balance POS 15.2% 14.2% FLF as % of Balance POS LF as % of Balance POS Balance CC (unutilized) Balance FLF (unutilized) Balance LF (unutilized) 99.9% 99.9% (3 month average) 99.9% 99.6% Break even 80.6% 81.6% Break even (FLF) Overall enhancement coverage (90+ DPD) Overall enhancement coverage (180+ DPD) FL enhancement Coverage (90+ DPD) FL enhancement Coverage (180+ DPD) Cumulative Prepayment 35.7% 33.3% 5.0% 4.0% 3.0% 2.0% 1.0% 90+ dpd 180+ dpd M1 M6 M11 M16 M21 M26 M31 M36 M M1 M6 M11 M16 M21 M26 M31 M36 M41 45
47 Rating/Credit Opinion Nirmaan RMBS Trust - Series I Dewan Housing Finance Limited Series A1 PTCs - CARE AAA(SO) & Series A2 PTC - CARE AA (SO) Housing Loans Receivables Feb-15 CC as % of initial POS 10.5% Par FLF SLF Series A1 PTC Principal (Rs Cr) LF as % of initial POS Average Maturity (Months) Average Seasoning' (Months) Series A2 Principal (subordinated to A1) (Rs Cr) 6.4 1,596 EIS 29.1% OC 3.0% 22.5 Pool Maturity Feb %, 0% Maturity (months) 300 Months Post Securitisation Pool Amortisation 36.6% 33.6% Amortisation (Series A1 Principal) 36.6% 33.6% Amortisation (Series A2 Principal) 36.6% 33.6% 90+ (% of Initial POS) 0.3% 0.2% 180+ (% of Initial POS) 0.3% 0.2% 90+ (% of Balance POS) 0.5% 0.2% 180+ (% of Balance POS) 0.5% 0.2% Amt (% of Initial POS) 0.1% 0.1% CC as % of Balance POS 16.6% 15.8% FLF as % of Balance POS LF as % of Balance POS Balance LF (unutilized) Balance FLF (unutilized) Balance LF (unutilized) 99.7% 99.8% (3 month average) 99.4% 99.9% Break even 80.3% 80.7% Break even (FLF) Overall enhancement coverage (90+ DPD) >30 >30 Overall enhancement coverage (180+ DPD) >30 >30 FL enhancement Coverage (90+ DPD) FL enhancement Coverage (180+ DPD) Cumulative Prepayment 27.5% 25.4% 5.0% 90+ dpd 180+ dpd 110% 4.0% 100% 3.0% 2.0% 1.0% 90% 80% M1 M6 M11 M16 M21 M26 M31 70% M1 M6 M11 M16 M21 M26 M31 46
48 Rating/Credit Opinion Nirmaan RMBS Trust - Series II Dewan Housing Finance Limited Series A1 PTCs - CARE AAA(SO) & Series A2 PTC - CARE AA (SO) Housing Loans Receivables Mar-15 CC as % of initial POS 7.8% Par FLF SLF Series A1 PTC Principal (Rs Cr) LF as % of initial POS Series A2 Principal (subordinated to A1) (Rs Cr) 9.4 4,228 EIS 26.6% Average Maturity (Months) 94.2 OC 3.0% Average Seasoning' (Months) 28.9 Pool Maturity Apr %, 0% Maturity (months) 242 Months Post Securitisation Pool Amortisation 39.0% 35.3% Amortisation (Series A1 Principal) 39.0% 35.3% Amortisation (Series A2 Principal) 39.0% 35.3% 90+ (% of Initial POS) 0.1% 0.2% 180+ (% of Initial POS) 0.1% 0.2% 90+ (% of Balance POS) 0.2% 0.3% 180+ (% of Balance POS) 0.2% 0.2% Amt (% of Initial POS) 0.1% 0.1% CC as % of Balance POS 12.8% 12.1% FLF as % of Balance POS LF as % of Balance POS Balance LF (unutilized) Balance FLF (unutilized) Balance LF (unutilized) 99.8% 99.8% (3 month average) 99.8% 99.7% Break even 82.1% 82.5% Break even (FLF) Overall enhancement coverage (90+ DPD) >30 >30 Overall enhancement coverage (180+ DPD) >30 >30 FL enhancement Coverage (90+ DPD) FL enhancement Coverage (180+ DPD) Cumulative Prepayment 21.9% 19.8% 5.0% 4.0% 3.0% 2.0% 1.0% 90+ dpd 180+ dpd M1 M6 M11 M16 M21 M M1 M6 M11 M16 M21 M26 47
49 Rating/Credit Opinion Nirmaan RMBS Trust - Series I Dewan Housing Finance Limited Series A PTCs - CARE AAA(SO) Housing Loans Receivables Average Maturity (Months) Average Seasoning' (Months) Jun-16 CC as % of initial POS 9.5% Par FLF SLF LF as % of initial POS EIS Pool Maturity 22.3% May %, 0% Maturity (months) 300 Months Post Securitisation Pool Amortisation 20.1% 15.6% Series A PTC Amortisation 20.1% 15.6% 90+ (% of Initial POS) 0.1% 0.1% 180+ (% of Initial POS) 0.1% 90+ (% of Balance POS) 0.1% 0.1% 180+ (% of Balance POS) 0.1% Amt (% of Initial POS) 0.1% 0.1% CC as % of Balance POS 11.9% 11.3% FLF as % of Balance POS LF as % of Balance POS Balance CC (unutilized) Balance FLF (unutilized) Balance LF (unutilized) 99.4% 99.5% (3 month average) 99.2% 99.0% Break even 80.2% 84.4% Break even (FLF) Overall enhancement coverage (90+ DPD) >30 >30 Overall enhancement coverage (180+ DPD) >30 >30 FL enhancement Coverage (90+ DPD) FL enhancement Coverage (180+ DPD) Cumulative Prepayment 12.8% 1 5.0% 90+ dpd 180+ dpd % 3.0% 2.0% 1.0% M1 M3 M5 M7 M9 M11 M13 M15 7 M1 M3 M5 M7 M9 M11 M13 M15 48
50 Rating/Credit Opinion Nirmaan RMBS Trust - Series II Dewan Housing Finance Limited Series A PTCs - CARE AAA(SO), Second Loss Facility - CARE A- (SO) equivalent Housing Loans Receivables Average Maturity (Months) Average Seasoning' (Months) Sep-16 CC as % of initial POS 9.3% Par FLF 5.0% SLF 4.3% LF as % of initial POS 1, EIS Pool Maturity 17.2% Aug %, 0% Maturity (months) 300 Months Post Securitisation 12 9 Pool Amortisation 14.7% 10.7% Series A PTC Amortisation 14.7% 10.7% 90+ (% of Initial POS) 0.2% 0.2% 180+ (% of Initial POS) 0.1% 90+ (% of Balance POS) 0.3% 0.2% 180+ (% of Balance POS) 0.1% Amt (% of Initial POS) 0.1% CC as % of Balance POS 10.8% 10.4% FLF as % of Balance POS 5.9% 5.6% LF as % of Balance POS Balance CC (unutilized) Balance FLF (unutilized) Balance LF (unutilized) 99.6% 99.6% (3 month average) 99.7% 99.7% Break even 86.3% 86.3% Break even (FLF) 89.0% 88.9% Overall enhancement coverage (90+ DPD) >30 >30 Overall enhancement coverage (180+ DPD) >30 FL enhancement Coverage (90+ DPD) >30 >30 FL enhancement Coverage (180+ DPD) >30 Cumulative Prepayment 8.8% 6.5% 5.0% 90+ dpd 180+ dpd % 3.0% 2.0% 1.0% M1 M3 M5 M7 M9 M11 7 M1 M3 M5 M7 M9 M11 49
51 Rating/Credit Opinion Nirmaan RMBS Trust - Series I Dewan Housing Finance Limited Series A1 PTCs - CARE AAA(SO) & Series A2 PTC - CARE AA (SO) Loan Against Property (LAP) Feb-14 CC as % of initial POS 14.5% Par FLF 80.2 SLF Series A1 Principal (Rs Cr) 77.0 LF as % of initial POS Average Maturity (Months) Average Seasoning' (Months) Series A2 Principal (subordinated to A1) (Rs Cr) EIS 42.0% 83.5 OC 4.0% 30.1 Pool Maturity Apr %, 0% Maturity (months) 266 Months Post Securitisation Pool Amortisation % % Amortisation (Series A1 Principal) 79.8% 78.8% Amortisation (Series A2 Principal) 79.8% 78.8% 90+ (% of Initial POS) 2.1% 180+ (% of Initial POS) 2.1% 90+ (% of Balance POS) 7.7% 180+ (% of Balance POS) 7.7% Amt (% of Initial POS) 0.2% 0.6% CC as % of Balance POS 71.7% 68.2% FLF as % of Balance POS LF as % of Balance POS Balance CC (unutilized) % Balance FLF (unutilized) Balance LF (unutilized) 100.4% 98.3% (3 month average) 127.6% 93.9% Break even 42.9% 45.6% Break even (FLF) Overall enhancement coverage (90+ DPD) 7.1 Overall enhancement coverage (180+ DPD) 7.1 FL enhancement Coverage (90+ DPD) FL enhancement Coverage (180+ DPD) Cumulative Prepayment 69.6% 69.0% 5.0% 90+ dpd 180+ dpd 200% 4.0% 3.0% 2.0% 1.0% M1 M7 M13 M19 M25 M31 M37 M43 150% 100% 50% 0% M1 M7 M13 M19 M25 M31 M37 M43 50
52 Equitas Small Finance Bank Limited (2 Pool) Key Financial Indicators For the year ended as on 31st March 2015 * 2016 * 2017 * (12m, A) (12m, A) (12m, A) Total Income (in Rs. Cr) 749 1,115 1,557 Profit After Tax (in Rs. Cr) Tangible Net worth (in Rs. Cr) 1,248 1,341 2,231 Gross NPA ratio (%) P=Provisional, A=Audited *includes financials of the wholly owned subsidiaries (EFL, EMFL, EHL & Equitas Technologies Private Limited [ETPL]). The gross NPA level has increased from 1.34% as of 31 st March, 2016 (30+ DPD for EMFL & 150+ DPD for EFL) to 3.54% as of 31 st March The reported PAT in FY16 was Rs. 167crores, while in FY17 it was Rs.159 crores. In FY16 the reported Total Income for the company was Rs. 1,115crores, while in FY17 it was Rs. 1,557crores. 51
53 Rating/Credit Opinion EMF Microloans Pool Series X - March 2016 Equitas Small Finance Bank Ltd. (Erstwhile Equitas Microfinance Private Limited) Withdrawn Microfinance Loans Average Maturity (Months) Average Seasoning' (Months) Mar-16 CC as % of initial POS 1 Par First Loss Credit Facility 80.0 Second Loss Credit 93.1 LF as % of initial POS 68,740 EIS 10.6% 8.0 OC 8.5 Pool Maturity Dec-17 NIL Maturity (months) 22 Pool Performance Jun-17 Jun-17 Months Post Securitisation Balance Tenure (Months) 6 7 Pool Amortisation 91.4% 88.9% 30+ (% of Initial POS) 0.6% 0.6% 90+ (% of Initial POS) 0.5% 0.5% 30+ (% of Balance POS) 2.1% 1.9% 90+ (% of Balance POS) 1.4% 1.3% Amt (% of Initial POS) 0.4% 0.4% CC as % of Balance POS 116.4% 90.3% CC as % of Balance PTC Principal 116.4% 90.3% Balance CC (unutilized) % 99.59% (3 month average) 98.2% 98.3% Break even 8.5% Overall enhancement coverage (30+ DPD) >30 Overall enhancement coverage (90+ DPD) >30 Cumulative Prepayment 8.2% 7.9% 30+DPD 90+DPD 2.0% 1.0% M1 M3 M5 M7 M9 M11 M13 M M1 M3 M5 M7 M9 M11 M13 M15 52
54 Rating Despina CV IFMR Capital 2016 Equitas Small Finance Bank Ltd. (Erstwhile Equitas Finance Limited) Series A1 PTC - CARE AAA (SO) and Series A2 PTC - CARE AAA (SO) CV (100%) Aug-16 CC as % of initial POS 6.9% Par First Loss Credit Facility Second Loss Credit Facility Series A1 Principal (Rs Cr) LF as % of initial POS Series A2 Principal (subordinated to A1) (Rs Cr) ,257 EIS 10.9% Average Maturity (Weeks) 15.5 OC 8.0% Average Seasoning' (Weeks) 19.4 Pool Maturity Aug Maturity (months) 24 Months Post Securitisation Balance Tenure (Months) Pool Amortization 86.4% 75.6% Amortisation (Series A1 Principal) 94.1% 82.0% Amortisation (Series A2 Principal) 90+ (% of Initial POS) 1.6% 1.4% 180+ (% of Initial POS) 0.9% 0.6% 90+ (% of Balance POS) 4.7% 2.7% 180+ (% of Balance POS) 2.3% 0.9% Amt (% of Initial POS) 2.1% 2.0% CC as % of Balance POS 50.5% 28.0% FLF as % of Balance POS LF as % of Balance POS Balance CC (unutilized) Balance FLF (unutilized) Balance LF (unutilized) 97.2% 96.9% (3 month average) 99.6% 100.4% Break even 4.3% 41.0% Break even (FLF) Overall enhancement coverage (90+ DPD) Overall enhancement coverage (180+ DPD) >30 >30 FL enhancement Coverage (90+ DPD) FL enhancement Coverage (180+ DPD) Cumulative Prepayment 24.2% 21.3% 5.0% 90+ dpd 180+ dpd 120% 4.0% 3.0% 2.0% 90% 60% 1.0% 30% M1 M3 M5 M7 M9 M11 M13 0% M1 M3 M5 M7 M9 M11 M13 53
55 ESAF Microfinance and Investments Pvt. Ltd. (EMFIPL 9 Pools) Key Financial Indicators For the year ended as on 31st March (12m, A) (12m, A) (12m, A) Total Income (in Rs. Cr) Profit After Tax (in Rs. Cr) Net worth (in Rs. Cr) Gross NPA Capital Adequacy Ratio (CAR) P*=Provisional, A=Audited Income of EMFIPL has increased by 58% Y-o-Y to Rs 318 crore backed by growth in AUM during the above period. Capital adequacy stood at 21.30% comprising of Tier-I capital of 16.70% as on March 31, Gross NPA ratio stood at 0.24% as on March 31,
56 Rating/Credit Opinion Series A Principal Average Maturity (Weeks) Average Seasoning' (Weeks) Cedar MFI Trust 25 ESAF Microfinance & Investments (P) Ltd Withdrawn Microfinance Loans Feb-16 CC as % of initial POS 5.0% Par First Loss Credit Facility Second Loss Credit Facility LF as % of initial POS EIS 10.5% 49,018 OC 4.5% Pool Maturity Oct Maturity (months) %, Pool Performance Aug-17 Jun-17 Months Post Securitisation Balance Tenure (Months) 4 6 Pool Amortised 91.9% 84.7% Series A PTC Amortised % 30+ (% of Initial POS) 4.5% 4.1% 90+ (% of Initial POS) 4.3% 3.7% 30+ (% of Balance POS) 29.5% 16.0% 90+ (% of Balance POS) 27.5% 14.1% Amt (% of Initial POS) 2.1% 1.7% CC as % of Balance POS 32.8% CC as % of Balance PTC Principal 52.7% Balance CC (unutilized) 10 Cummulative 97.1% 97.6% (3 month average) 90.8% 91.6% Break even 31.7% Overall enhancement coverage (30+ DPD) 4.3 Overall enhancement coverage (90+ DPD) 4.8 Cumulative Prepayment 6.3% 4.7% 6.0% 30+ dpd 90+ dpd Collection Efficiecny % 4.0% 80.00% 2.0% 50.00% M1 M4 M7 M10 M13 M % M1 M4 M7 M10 M13 M16 55
57 Rating/Credit Opinion Series A Principal Average Maturity (Weeks) Average Seasoning' (Weeks) Cedar MFI Trust 26 ESAF Microfinance & Investments (P) Ltd Withdrawn Microfinance Loans Mar-16 CC as % of initial POS 5.0% Par First Loss Credit Facility Second Loss Credit Facility LF as % of initial POS EIS 8.5% 78,697 OC 7.0% Pool Maturity Dec Maturity (months) %, Pool Performance Jul-17 Jun-17 Months Post Securitisation Balance Tenure (Months) 4 5 Pool Amortised 91.9% 89.7% Series A PTC Amortised 93.1% 90.9% 30+ (% of Initial POS) 2.7% 2.6% 90+ (% of Initial POS) 2.4% 2.2% 30+ (% of Balance POS) 19.9% 15.7% 90+ (% of Balance POS) 17.0% 12.9% Amt (% of Initial POS) 1.1% 1.0% CC as % of Balance POS 48.5% CC as % of Balance PTC Principal 58.9% Balance CC (unutilized) 10 Cummulative 98.4% 98.5% (3 month average) 91.4% 91.8% Break even 38.1% Overall enhancement coverage (30+ DPD) 3.9 Overall enhancement coverage (90+ DPD) 4.8 Cumulative Prepayment 6.4% 5.8% 3.0% 30+ dpd 90+ dpd Collection Efficiecny % 2.0% 80.00% 1.0% 50.00% M1 M4 M7 M10 M13 M % M1 M4 M7 M10 M13 M16 56
58 Rating/Credit Opinion Series A Principal Average Maturity (Weeks) Average Seasoning' (Weeks) Cedar MFI Trust 29 ESAF Microfinance & Investments (P) Ltd Series A PTC - CARE BBB (SO) Microfinance Loans Jun-16 CC as % of initial POS 4.2% Par FLF SLF LF as % of initial POS EIS 7.7% OC 5.0% Pool Maturity Mar Maturity (months) %, Months Post Securitisation Balance Tenure (Months) 6 9 Pool Amortised 77.1% 65.5% Series A PTC Amortised 83.3% 70.1% 30+ (% of Initial POS) 8.4% 7.8% 90+ (% of Initial POS) 7.8% 6.7% 30+ (% of Balance POS) 21.7% 15.0% 90+ (% of Balance POS) 19.7% 12.2% Amt (% of Initial POS) 3.4% 2.7% CC as % of Balance POS 18.4% 12.2% CC as % of Balance PTC Principal 26.5% 14.8% Balance CC (unutilized) Cummulative 93.3% 93.7% (3 month average) 90.7% 90.6% Break even 53.6% 71.2% Overall enhancement coverage (30+ DPD) Overall enhancement coverage (90+ DPD) Cumulative Prepayment 3.7% 2.3% 9.0% 30+ dpd 90+ dpd Collection Efficiecny % 6.0% 90.00% 3.0% 70.00% M1 M3 M5 M7 M9 M11 M13 M % M1 M3 M5 M7 M9 M11 M13 M15 57
59 Rating/Credit Opinion Series A Principal Average Maturity (Weeks) Average Seasoning' (Weeks) Cedar MFI Trust 31 ESAF Microfinance & Investments (P) Ltd Series A PTC - CARE BBB (SO) Microfinance Loans Jul-16 CC as % of initial POS 3.75% Par FLF SLF LF as % of initial POS EIS 10.1% OC 5.0% Pool Maturity Mar Maturity (months) %, Months Post Securitisation Balance Tenure (Months) 7 10 Pool Amortised 71.2% 60.6% Series A PTC Amortised 78.7% 66.5% 30+ (% of Initial POS) 13.0% 12.2% 90+ (% of Initial POS) 12.5% 11.1% 30+ (% of Balance POS) 26.2% 19.8% 90+ (% of Balance POS) 24.9% 17.5% Amt (% of Initial POS) 5.4% 4.4% CC as % of Balance POS 13.0% 9.5% CC as % of Balance PTC Principal 18.5% 11.8% Balance CC (unutilized) Cummulative 91.8% 92.4% (3 month average) 88.8% 87.7% Break even 64.5% 74.7% Overall enhancement coverage (30+ DPD) Overall enhancement coverage (90+ DPD) Cumulative Prepayment 2.0% 1.3% 16.0% 30+ dpd 90+ dpd Collection Efficiecny % 12.0% 8.0% 4.0% M1 M4 M7 M10 M % 70.00% 50.00% M1 M4 M7 M10 M13 58
60 Rating/Credit Opinion Series A Principal Average Maturity (Weeks) Average Seasoning' (Weeks) Cedar MFI Trust 32 ESAF Microfinance & Investments (P) Ltd Series A PTC - CARE BBB (SO) Microfinance Loans Jul-16 CC as % of initial POS 4.0% Par FLF SLF LF as % of initial POS EIS 10.3% OC 5.0% Pool Maturity Mar Maturity (months) %, Months Post Securitisation Balance Tenure (Months) 7 10 Pool Amortised 73.1% 60.6% Series A PTC Amortised 79.4% 65.1% 30+ (% of Initial POS) 5.1% 4.6% 90+ (% of Initial POS) 4.7% 3.8% 30+ (% of Balance POS) 11.9% 8.2% 90+ (% of Balance POS) 10.7% 6.4% Amt (% of Initial POS) 1.9% 1.4% CC as % of Balance POS 14.9% 10.1% CC as % of Balance PTC Principal 20.5% 12.1% Balance CC (unutilized) Cummulative 96.8% 97.2% (3 month average) 94.4% 94.2% Break even 63.1% 77.2% Overall enhancement coverage (30+ DPD) Overall enhancement coverage (90+ DPD) Cumulative Prepayment 3.5% 2.0% 6.0% 30+ dpd 90+ dpd Collection Efficiecny % 4.0% 90.00% 2.0% 70.00% M1 M3 M5 M7 M9 M11 M % M1 M3 M5 M7 M9 M11 M13 59
61 60
62 Rating/Credit Opinion Series A Principal Average Maturity (Weeks) Average Seasoning' (Weeks) Cedar MFI Trust 34 ESAF Microfinance & Investments (P) Ltd Series A PTC - CARE BBB (SO) Microfinance Loans Sep-16 CC as % of initial POS 3.75% Par FLF SLF LF as % of initial POS EIS 8.3% OC 5.0% Pool Maturity Jun Maturity (months) %, Months Post Securitisation 12 9 Balance Tenure (Months) 9 12 Pool Amortised 73.3% 64.3% Series A PTC Amortised 80.8% 71.0% 30+ (% of Initial POS) 11.0% 10.9% 90+ (% of Initial POS) 10.6% 9.5% 30+ (% of Balance POS) 23.3% 18.2% 90+ (% of Balance POS) 21.9% 15.4% Amt (% of Initial POS) 4.8% 4.5% CC as % of Balance POS 14.0% 10.5% CC as % of Balance PTC Principal 20.5% 13.6% Balance CC (unutilized) Cummulative 91.9% 91.9% (3 month average) 91.9% 88.0% Break even 59.6% 78.7% Overall enhancement coverage (30+ DPD) Overall enhancement coverage (90+ DPD) Cumulative Prepayment 2.6% 2.0% 12.0% 30+ dpd 90+ dpd Collection Efficiecny % 8.0% 90.00% 4.0% 70.00% M1 M3 M5 M7 M % M1 M3 M5 M7 M9 M11 61
63 Rating/Credit Opinion Series A Principal Average Maturity (Weeks) Average Seasoning' (Weeks) Cedar MFI Trust 35 ESAF Microfinance & Investments (P) Ltd Series A PTC - CARE BBB (SO) Microfinance Loans Oct-16 CC as % of initial POS 3.75% Par FLF SLF LF as % of initial POS EIS 8.55% OC 5.0% Pool Maturity Jul Maturity (months) %, Months Post Securitisation 11 8 Balance Tenure (Months) Pool Amortised 67.5% 54.5% Series A PTC Amortised 74.9% 60.8% 30+ (% of Initial POS) 11.1% 10.6% 90+ (% of Initial POS) 10.7% 9.2% 30+ (% of Balance POS) 19.1% 14.3% 90+ (% of Balance POS) 18.1% 12.1% Amt (% of Initial POS) 4.9% 4.2% CC as % of Balance POS 11.6% 8.2% CC as % of Balance PTC Principal 15.7% 10.1% Balance CC (unutilized) Cummulative 91.4% 91.4% (3 month average) 91.8% 89.1% Break even 65.6% 83.3% Overall enhancement coverage (30+ DPD) Overall enhancement coverage (90+ DPD) Cumulative Prepayment 2.7% 1.3% 12.0% 30+ dpd 90+ dpd Collection Efficiecny % 8.0% 90.00% 4.0% 70.00% M1 M4 M7 M % M1 M4 M7 M10 62
64 Rating/Credit Opinion Series A Principal Average Maturity (Months) Average Seasoning' (Months) Cedar MFI Trust 36 ESAF Microfinance & Investments (P) Ltd Series A PTC - CARE BBB (SO) Microfinance Loans Feb-17 CC as % of initial POS 4.50% Par FLF SLF LF as % of initial POS EIS 8.7% OC 5.0% Pool Maturity Dec Maturity (months) %, Months Post Securitisation 8 5 Balance Tenure (Months) Pool Amortised 61.1% 38.0% Series A PTC Amortised 65.1% 40.8% 30+ (% of Initial POS) 0.7% 0.4% 90+ (% of Initial POS) 0.5% 0.2% 30+ (% of Balance POS) 1.0% 0.5% 90+ (% of Balance POS) 0.8% 0.2% Amt (% of Initial POS) 0.3% 0.1% CC as % of Balance POS 11.6% 7.3% CC as % of Balance PTC Principal 13.6% 8.0% Balance CC (unutilized) Cummulative 99.4% 99.5% (3 month average) 99.2% 99.4% Break even 69.4% 79.2% Overall enhancement coverage (30+ DPD) 29.8 >30 Overall enhancement coverage (90+ DPD) >30 >30 Cumulative Prepayment 2.8% 0.5% 1.0% 30+ dpd 90+ dpd Collection Efficiecny % 90.00% 0.5% 70.00% M1 M3 M5 M % M1 M3 M5 M7 63
65 HDFC Ltd 9 (Pools) Key Financial Indicators For the year ended as on 31st March (12m, A) (12m, A) (12m, A) Total Income (in Rs. Cr) 27,471 30,957 33,160 Profit After Tax (in Rs. Cr) 5,990 7, Net worth (in Rs. Cr) 30,970 34,121 39,645 Gross NPA (%) Capital Adequacy Ratio (CAR) (%) P*=Provisional, A=Audited As on 31 st March 2017 the Total Income was Rs. 33,160crores. HDFC reported Gross NPA ratio of 0.79% as on March 31, HDFC reported Capital Adequacy Ratio (CAR) of 14.50% (Tier I CAR: 11.80%) as on March 31,
66 Rating/Credit Opinion HDFC's Assignment of Receivables of Mar' 09 HDFC Limited Assignee Payout - CARE AAA (SO) Equivalent Second Loss Facility - AA+ (SO) Equivalent Housing Loan Average Maturity (Months) Average Seasoning' (Months) Mar-09 CC as % of initial POS 7.5% Par FLF 2.5% SLF 5.0% LF as % of initial POS 14,764 EIS 25.9% 94.0 OC Nil 19.2 Pool Maturity Feb %, 16.4% Maturity (months) 299 Months Post Securitisation Amortisation 86.5% 85.4% 90+ (% of Initial POS) 0.4% 0.4% 180+ (% of Initial POS) 0.2% 0.2% 90+ (% of Balance POS) 2.0% 2.1% 180+ (% of Balance POS) 1.0% 1.0% Amt (% of Initial POS) 0.2% 0.2% CC as % of Balance POS 55.4% 51.5% FLF as % of Balance POS 18.5% 17.2% LF as % of Balance POS Balance CC (unutilized) Balance FLF (unutilized) Balance LF (unutilized) 99.8% 99.8% (3 month average) 100.7% 100.7% Break even 53.3% 56.4% Break even (FLF) 79.7% 80.7% Overall enhancement coverage (90+ DPD) Overall enhancement coverage (180+ DPD) >30 >30 FL enhancement Coverage (90+ DPD) FL enhancement Coverage (180+ DPD) Cumulative Prepayment 49.6% 49.2% 1.0% 0.5% M1 90+ dpd 180+ dpd M13 M25 M37 M49 M61 M73 M85 M M1 M13 M25 M37 M49 M61 M73 M85 M97 65
67 Rating/Credit Opinion HDFC's Assignment of Receivables of May' 09-I HDFC Limited Assignee Payout - CARE AAA (SO) Equivalent Second Loss Facility - AA+ (SO) Equivalent Housing Loan Average Maturity (Months) Average Seasoning' (Months) May-09 CC as % of initial POS 12.0% Par FLF 5.5% SLF 6.5% LF as % of initial POS 3,945 EIS 11.2% 89.3 OC Nil 2.4 Pool Maturity Jan %,4.4%,0.3% Maturity (months) 248 Months Post Securitisation Amortisation 79.4% 78.0% 90+ (% of Initial POS) 0.7% 0.7% 180+ (% of Initial POS) 0.3% 0.2% 90+ (% of Balance POS) 3.0% 2.6% 180+ (% of Balance POS) 1.2% 0.7% Amt (% of Initial POS) 0.2% 0.2% CC as % of Balance POS 58.2% 54.7% FLF as % of Balance POS 26.6% 25.0% LF as % of Balance POS Balance CC (unutilized) Balance FLF (unutilized) Balance LF (unutilized) 99.7% 99.7% (3 month average) 98.7% 101.1% Break even 56.2% 59.0% Break even (FLF) 77.8% 79.0% Overall enhancement coverage (90+ DPD) Overall enhancement coverage (180+ DPD) >30 >30 FL enhancement Coverage (90+ DPD) FL enhancement Coverage (180+ DPD) Cumulative Prepayment 44.2% 43.7% 1.5% 1.0% 0.5% M1 90+ dpd 180+ dpd M13 M25 M37 M49 M61 M73 M85 M M1 M13 M25 M37 M49 M61 M73 M85 M97 66
68 Rating/Credit Opinion HDFC's Assignment of Receivables of May' 09-II HDFC Limited Assignee Payout - CARE AAA (SO) Equivalent Second Loss Facility - AAA (SO) Equivalent Housing Loan Average Maturity (Months) Average Seasoning' (Months) May-09 CC as % of initial POS 1 Par FLF 4.3% SLF 5.8% LF as % of initial POS 3,384 EIS 12.4% 95.4 OC Nil 7.4 Pool Maturity Nov %,3.8%,0.3% Maturity (months) 294 Months Post Securitisation Amortisation 84.9% 83.8% 90+ (% of Initial POS) 0.5% 0.5% 180+ (% of Initial POS) 0.4% 0.4% 90+ (% of Balance POS) 2.7% 2.2% 180+ (% of Balance POS) 1.5% 1.5% Amt (% of Initial POS) 0.3% 0.3% CC as % of Balance POS 66.5% 61.9% FLF as % of Balance POS 28.3% 26.3% LF as % of Balance POS Balance CC (unutilized) Balance FLF (unutilized) Balance LF (unutilized) 99.7% 99.7% (3 month average) 99.5% 99.2% Break even 49.4% 53.0% Break even (FLF) 76.3% 77.8% Overall enhancement coverage (90+ DPD) Overall enhancement coverage (180+ DPD) >30 >30 FL enhancement Coverage (90+ DPD) FL enhancement Coverage (180+ DPD) Cumulative Prepayment 54.6% 54.2% 1.0% 90+ dpd 180+ dpd %
69 Rating/Credit Opinion HDFC's Assignment of Receivables of Dec' 09-I HDFC Limited Assignee Payout - CARE AAA (SO) Equivalent Second Loss Facility - AA+ (SO) Equivalent Housing Loan Average Maturity (Months) Average Seasoning' (Months) Dec-09 CC as % of initial POS 12.9% Par FLF 5.7% SLF 7.2% LF as % of initial POS 3,243 EIS 9.8% 84.6 OC Nil 8.3 Pool Maturity Sep %, 0.2% Maturity (months) 240 Months Post Securitisation Amortisation 78.2% 76.9% 90+ (% of Initial POS) 0.7% 0.7% 180+ (% of Initial POS) 0.3% 0.4% 90+ (% of Balance POS) 2.5% 2.5% 180+ (% of Balance POS) 1.2% 1.2% Amt (% of Initial POS) 0.2% 0.2% CC as % of Balance POS 59.3% 55.8% FLF as % of Balance POS 26.4% 24.9% LF as % of Balance POS Balance CC (unutilized) Balance FLF (unutilized) Balance LF (unutilized) % (3 month average) 100.8% 99.8% Break even 56.0% 58.8% Break even (FLF) 78.6% 79.9% Overall enhancement coverage (90+ DPD) Overall enhancement coverage (180+ DPD) >30 >30 FL enhancement Coverage (90+ DPD) FL enhancement Coverage (180+ DPD) Cumulative Prepayment 43.6% 43.1% 1.0% 0.5% 90+ dpd 180+ dpd M1 M11 M21 M31 M41 M51 M61 M71 M81 M M1 M11M21M31M41M51M61M71M81M91 68
70 Rating/Credit Opinion HDFC's Assignment of Receivables of Dec' 09-II HDFC Limited Assignee Payout - CARE AAA (SO) Equivalent Second Loss Facility - AAA (SO) Equivalent Housing Loan Average Maturity (Months) Average Seasoning' (Months) Dec-09 CC as % of initial POS 9.8% Par FLF 3.7% SLF 6.1% LF as % of initial POS 13,248 EIS 14.5% 76.4 OC Nil 36.2 Pool Maturity Aug %, 0.3% Maturity (months) 251 Months Post Securitisation Amortisation 84.9% 83.7% 90+ (% of Initial POS) 0.3% 0.3% 180+ (% of Initial POS) 0.1% 0.2% 90+ (% of Balance POS) 1.5% 1.7% 180+ (% of Balance POS) 0.7% 0.7% Amt (% of Initial POS) 0.1% 0.2% CC as % of Balance POS 64.5% 59.7% FLF as % of Balance POS 24.8% 23.0% LF as % of Balance POS Balance CC (unutilized) Balance FLF (unutilized) Balance LF (unutilized) 99.8% 99.8% (3 month average) 101.4% 100.8% Break even 48.4% 52.2% Break even (FLF) 77.3% 78.7% Overall enhancement coverage (90+ DPD) Overall enhancement coverage (180+ DPD) 71.9 >30 FL enhancement Coverage (90+ DPD) FL enhancement Coverage (180+ DPD) 31.6 >30 Cumulative Prepayment 46.5% 46.1% 1.0% 0.5% 90+ dpd 180+ dpd M1 M11 M21 M31 M41 M51 M61 M71 M81 M M1 M11M21M31M41M51M61M71M81M91 69
71 Rating/Credit Opinion HDFC Direct Assignment Oct' 10-I HDFC Limited Assignee Payout - CARE AAA (SO) Equivalent Second Loss Facility - A+ (SO) Equivalent Housing Loan Average Maturity (Months) Average Seasoning' (Months) Nov-10 CC as % of initial POS 10.5% Par FLF 4.2% SLF 6.3% LF as % of initial POS 2,982 EIS 12.0% 97.7 OC Nil 2.3 Pool Maturity Aug %, 8.2%, 0.1% Maturity (months) 238 Months Post Securitisation Amortisation 63.6% 61.6% 90+ (% of Initial POS) 0.6% 0.6% 180+ (% of Initial POS) 0.3% 90+ (% of Balance POS) 1.4% 180+ (% of Balance POS) 0.7% Amt (% of Initial POS) 0.2% CC as % of Balance POS 28.8% FLF as % of Balance POS 11.5% LF as % of Balance POS Balance CC (unutilized) 10 Balance FLF (unutilized) 10 Balance LF (unutilized) 99.9% (3 month average) 101.0% Break even 76.3% Break even (FLF) 88.0% Overall enhancement coverage (90+ DPD) 16.6 Overall enhancement coverage (180+ DPD) >30 FL enhancement Coverage (90+ DPD) 8.4 FL enhancement Coverage (180+ DPD) Cumulative Prepayment 36.5% 0.3% 1.3% 0.6% 0.2% 27.3% 10.9% % 100.7% 77.5% 88.4% 17.8 > % 3.0% 90+ dpd 180+ dpd % % 8 M1 M16 M31 M46 M61 M76 6 M1 M16 M31 M46 M61 M76 70
72 Rating/Credit Opinion HDFC Direct Assignment Oct' 10-II HDFC Limited Assignee Payout - CARE AAA (SO) Equivalent Second Loss Facility - A+ (SO) Equivalent Housing Loan Average Maturity (Months) Average Seasoning' (Months) Nov-10 CC as % of initial POS 10.5% Par FLF 4.2% SLF 6.3% LF as % of initial POS 9,974 EIS 12.0% 95.4 OC Nil 1.1 Pool Maturity Aug %, 8.6% Maturity (months) 238 Months Post Securitisation Amortisation 69.6% 67.9% 90+ (% of Initial POS) 0.6% 0.7% 180+ (% of Initial POS) 0.3% 0.3% 90+ (% of Balance POS) 1.7% 1.8% 180+ (% of Balance POS) 0.7% 0.6% Amt (% of Initial POS) 0.2% 0.2% CC as % of Balance POS 34.6% 32.7% FLF as % of Balance POS 13.8% 13.1% LF as % of Balance POS Balance CC (unutilized) Balance FLF (unutilized) Balance LF (unutilized) 99.8% 99.8% (3 month average) 101.5% 101.7% Break even 72.3% 73.9% Break even (FLF) 86.4% 87.0% Overall enhancement coverage (90+ DPD) Overall enhancement coverage (180+ DPD) >30 >30 FL enhancement Coverage (90+ DPD) FL enhancement Coverage (180+ DPD) Cumulative Prepayment 39.9% 39.1% 3.0% 2.0% 1.0% 90+ dpd 180+ dpd M1 M12 M23 M34 M45 M56 M67 M M1 M12 M23 M34 M45 M56 M67 M78 71
73 Rating/Credit Opinion HDFC Direct Assignment Sep' 11 HDFC Limited Assignee Payout - CARE AAA (SO) Equivalent Second Loss Facility - A+ (SO) Equivalent Housing Loan Average Maturity (Months) Average Seasoning' (Months) Sep-11 CC as % of initial POS 9.3% Par FLF 4.1% SLF 5.2% LF as % of initial POS 4,191 EIS 7.6% OC Nil 11.0 Pool Maturity Dec %,5.13%, 0.15% Maturity (months) 278 Months Post Securitisation Amortisation 61.9% 60.1% 90+ (% of Initial POS) 0.5% 0.5% 180+ (% of Initial POS) 0.2% 0.2% 90+ (% of Balance POS) 1.1% 1.0% 180+ (% of Balance POS) 0.4% 0.4% Amt (% of Initial POS) 0.2% 0.2% CC as % of Balance POS 24.4% 23.3% FLF as % of Balance POS 10.8% 10.3% LF as % of Balance POS Balance CC (unutilized) Balance FLF (unutilized) Balance LF (unutilized) 99.9% 99.9% (3 month average) 100.5% 98.5% Break even 81.3% 82.2% Break even (FLF) 90.3% 90.7% Overall enhancement coverage (90+ DPD) Overall enhancement coverage (180+ DPD) >30 >30 FL enhancement Coverage (90+ DPD) FL enhancement Coverage (180+ DPD) Cumulative Prepayment 37.5% 36.7% 3.0% 90+ dpd 180+ dpd % % 9 M1 M11 M21 M31 M41 M51 M61 M71 8 M1 M11 M21 M31 M41 M51 M61 M71 72
74 Rating/Credit Opinion HDFC Direct Assignment Oct' 11 HDFC Limited Assignee Payout - CARE AAA (SO) Equivalent Second Loss Facility - A+ (SO) Equivalent Housing Loan Average Maturity (Months) Average Seasoning' (Months) Oct-11 CC as % of initial POS 8.8% Par FLF 3.6% SLF 5.2% LF as % of initial POS 15,568 EIS 16.3% OC Nil 22.2 Pool Maturity Apr %,17.47%, 1.55% Maturity (months) 344 Months Post Securitisation Amortisation 67.7% 65.7% 90+ (% of Initial POS) 0.7% 0.7% 180+ (% of Initial POS) 0.3% 0.3% 90+ (% of Balance POS) 1.8% 1.9% 180+ (% of Balance POS) 0.8% 0.8% Amt (% of Initial POS) 0.2% 0.2% CC as % of Balance POS 27.5% 25.9% FLF as % of Balance POS 11.3% 10.6% LF as % of Balance POS Balance CC (unutilized) Balance FLF (unutilized) Balance LF (unutilized) % 99.99% (3 month average) 100.5% 101.0% Break even 76.3% 77.8% Break even (FLF) 87.1% 87.7% Overall enhancement coverage (90+ DPD) Overall enhancement coverage (180+ DPD) > FL enhancement Coverage (90+ DPD) FL enhancement Coverage (180+ DPD) Cumulative Prepayment 39.2% 38.3% 3.0% 90+ dpd 180+ dpd 2.0% 1.0% M1 M11 M21 M31 M41 M51 M61 M M1 M11 M21 M31 M41 M51 M61 M71 73
75 Hinduja Leyland Finance Ltd (2 Pools) Key Financial Indicators For the year ended as on 31st March (12m, A) (12m, A) (12m, A) Total Income (in Rs. Cr) 814 1, Profit After Tax (in Rs. Cr) Net worth (in Rs. Cr) 917 1, Gross NPA (%) Capital Adequacy Ratio (CAR) P*=Provisional, A=Audited During FY17, HLF registered 29.67% growth in total income driven by strong growth in AUM. Gross NPA increased from Rs.3.48% on March 31, 2016 to 5.45% as on March 31, HLF has maintained capital adequacy above the NBFC s regulatory requirement. HLF reported CAR of 16.20% as on March 31, 2017 as compared to 16.19% as on March 31,
76 Rating/Credit Opinion Aeries CV Trust March 2015 Hinduja Leyland Finance Ltd. Series A PTCs - CARE AAA (SO) MHCV (48.24%),SCV (20.12%),LCV(8.31%),Tractor(8.16%),Others (15.19%) Average Maturity (Months) Average Seasoning' (Months) Mar-15 CC as % of initial POS 14.0% Par FLF SLF LF as % of initial POS 4,682 EIS 7.2% 16.0 OC 14.2 Pool Maturity Mar %, 0.95% Maturity (months) 48 Months Post Securitisation Balance Tenure (Months) Amortisation 91.8% 87.1% 90+ (% of Initial POS) 0.2% 0.2% 180+ (% of Initial POS) 0.2% 0.2% 90+ (% of Balance POS) 0.5% 0.3% 180+ (% of Balance POS) 0.5% 0.3% Amt (% of Initial POS) 2.1% 2.4% CC as % of Balance POS 170.6% 108.6% FLF as % of Balance POS LF as % of Balance POS Balance CC (unutilized) Balance FLF (unutilized) Balance LF (unutilized) 97.3% 97.0% (3 month average) 102.1% 102.6% Break even Break even (FLF) Overall enhancement coverage (90+ DPD) >30 >30 Overall enhancement coverage (180+ DPD) >30 >30 FL enhancement Coverage (90+ DPD) FL enhancement Coverage (180+ DPD) Cumulative Prepayment 23.5% 22.6% 90+ dpd 180+ dpd 4.0% 3.0% 2.0% 1.0% M1 M7 M13 M19 M M1 M7 M13 M19 M24 75
77 Rating/Credit Opinion Taurus CV Trust Mar 17 Hinduja Leyland Finance Company Limited Series A PTCs - CARE AAA (SO), SLF - CARE BBB+ (SO) Equivalent Vehicle and Construction Equipment Loans Average Maturity (Months) Average Seasoning' (Months) Mar-17 CC as % of initial POS 13.0% Par FLF 5.0% SLF 8.0% LF as % of initial POS 5,429 EIS 39.3% 30.0 OC 14.9 Pool Maturity Jul %,0% Maturity (months) 53 Months Post Securitisation 6 3 Amortisation 21.9% 10.6% 90+ (% of Initial POS) 180+ (% of Initial POS) 90+ (% of Balance POS) 180+ (% of Balance POS) Amt (% of Initial POS) 1.4% 0.8% CC as % of Balance POS 16.6% 14.5% FLF as % of Balance POS 7.7% LF as % of Balance POS Balance CC (unutilized) Balance FLF (unutilized) 10 Balance LF (unutilized) 101.9% 94.2% (3 month average) 96.6% Break even 81.1% 81.4% Break even (FLF) Overall enhancement coverage (90+ DPD) Overall enhancement coverage (180+ DPD) FL enhancement Coverage (90+ DPD) FL enhancement Coverage (180+ DPD) Cumulative Prepayment 1.4% 0.4% 90+ dpd 180+ dpd 3.0% 2.0% 1.0% M1 M2 M3 M4 M5 M M1 M2 M3 M4 M5 M6 76
78 Indiabulls Housing Finance Company Ltd 13 (Pools) Key Financial Indicators For the year ended as on 31st March (12m, A) (12m, A) (12m, A) Total Income (in Rs. Cr) 7,253 9, Profit After Tax (in Rs. Cr) 1,901 2,345 2,908 Net worth (in Rs. Cr) 6,559 10,619 12,122 Gross NPA (%) Capital Adequacy Ratio (%) P*=Provisional, A=Audited Net profit (PAT) for the FY17 period stood at Rs. 2,908 crore on a total income of Rs. 11,701 crore. Asset quality has remained stable during the FY17 period with Gross NPA at 0.95%, as on March 31, The entity has a comfortable capital adequacy ratio with Total CAR at 20.91%. 77
79 Rating/Credit Opinion IBHFL Direct Assignment- Mar 12 I Indiabulls Housing Finance Limited CARE AAA (SO) Equivalent Housing Loan Receivables Average Maturity (Months) Average Seasoning' (Months) Mar-12 CC as % of initial POS 12.0% Par FLF SLF LF as % of initial POS 1,272 EIS 15.8% 93.5 OC 12.0 Pool Maturity Feb %,0% Maturity (months) 240 Months Post Securitisation Amortisation 81.0% 72.2% 90+ (% of Initial POS) 180+ (% of Initial POS) 90+ (% of Balance POS) 180+ (% of Balance POS) Amt (% of Initial POS) CC as % of Balance POS 63.0% 43.2% FLF as % of Balance POS LF as % of Balance POS Balance CC (unutilized) Balance FLF (unutilized) Balance LF (unutilized) 99.94% 99.93% (3 month average) 100.4% 100.1% Break even 58.8% 70.9% Break even (FLF) Overall enhancement coverage (90+ DPD) Overall enhancement coverage (180+ DPD) FL enhancement Coverage (90+ DPD) FL enhancement Coverage (180+ DPD) Cumulative Prepayment 65.3% 57.2% 3.0% 2.0% 1.0% 90+ dpd 180+ dpd M1 M10 M19 M28 M37 M46 M55 M63 4 M1 M10 M19 M28 M37 M46 M55 M63 78
80 Rating/Credit Opinion IBHFL Direct Assignment- Mar 12 II Indiabulls Housing Finance Limited CARE AAA (SO) Equivalent Housing Loan Receivables Average Maturity (Months) Average Seasoning' (Months) Mar-12 CC as % of initial POS 12.5% Par FLF SLF LF as % of initial POS 987 EIS 7.3% 88.3 OC 6.9 Pool Maturity Dec %,0% Maturity (months) 238 Months Post Securitisation Amortisation 88.6% 76.4% 90+ (% of Initial POS) 180+ (% of Initial POS) 90+ (% of Balance POS) 180+ (% of Balance POS) Amt (% of Initial POS) CC as % of Balance POS 110.1% 53.1% FLF as % of Balance POS LF as % of Balance POS Balance CC (unutilized) Balance FLF (unutilized) Balance LF (unutilized) 99.98% 99.99% (3 month average) 99.2% 100.3% Break even 27.1% 63.8% Break even (FLF) Overall enhancement coverage (90+ DPD) Overall enhancement coverage (180+ DPD) FL enhancement Coverage (90+ DPD) FL enhancement Coverage (180+ DPD) Cumulative Prepayment 69.4% 57.8% 90+ dpd 180+ dpd 1.0% 0.5% M1 M10 M19 M28 M37 M46 M55 M M1 M10 M19 M28 M37 M46 M55 M64 79
81 Rating/Credit Opinion IBHFL Direct Assignment- Mar 12 III Indiabulls Housing Finance Limited CARE AA+ (SO) Equivalent Housing Loan Receivables Average Maturity (Months) Average Seasoning' (Months) Mar-12 CC as % of initial POS 12.8% Par FLF SLF LF as % of initial POS 731 EIS 7.2% OC 6.2 Pool Maturity Aug %,0% Maturity (months) 294 Months Post Securitisation Amortisation 92.4% 79.5% 90+ (% of Initial POS) 180+ (% of Initial POS) 90+ (% of Balance POS) 180+ (% of Balance POS) Amt (% of Initial POS) CC as % of Balance POS 166.3% 62.1% FLF as % of Balance POS LF as % of Balance POS Balance CC (unutilized) 99.8% 10 Balance FLF (unutilized) Balance LF (unutilized) 99.82% 99.90% (3 month average) 95.81% 97.12% Break even 0.5% 63.7% Break even (FLF) Overall enhancement coverage (90+ DPD) Overall enhancement coverage (180+ DPD) FL enhancement Coverage (90+ DPD) FL enhancement Coverage (180+ DPD) Cumulative Prepayment 81.2% 68.6% 90+ dpd 180+ dpd 1.0% 0.5% M1 M11 M21 M31 M41 M51 M M1 M11 M21 M31 M41 M51 M61 80
82 Rating/Credit Opinion Innovation Trust-I Sep 12 Indiabulls Housing Finance Limited CARE AAA (SO) Equivalent Housing Loan Receivables Average Maturity (Months) Average Seasoning' (Months) Sep-12 CC as % of initial POS 11.5% Par FLF 54.9 SLF LF as % of initial POS 458 EIS 9.5% 8.1 OC 20.3 Pool Maturity Apr %,0% Maturity (months) 283 Pool Performance Sep-17 Jun-17 Months Post Securitisation Amortisation 85.1% 75.5% 90+ (% of Initial POS) 180+ (% of Initial POS) 90+ (% of Balance POS) 180+ (% of Balance POS) Amt (% of Initial POS) CC as % of Balance POS 76.4% 46.8% FLF as % of Balance POS LF as % of Balance POS Balance CC (unutilized) 99.0% 99.8% Balance FLF (unutilized) 99.0% 99.8% Balance LF (unutilized) 99.92% 99.92% (3 month average) 99.7% 97.4% Break even 53.4% 70.8% Break even (FLF) Overall enhancement coverage (90+ DPD) Overall enhancement coverage (180+ DPD) FL enhancement Coverage (90+ DPD) FL enhancement Coverage (180+ DPD) Cumulative Prepayment % 1.0% 90+ dpd 180+ dpd % 8 M1 M11 M21 M31 M41 M M1 M11 M21 M31 M41 M51 81
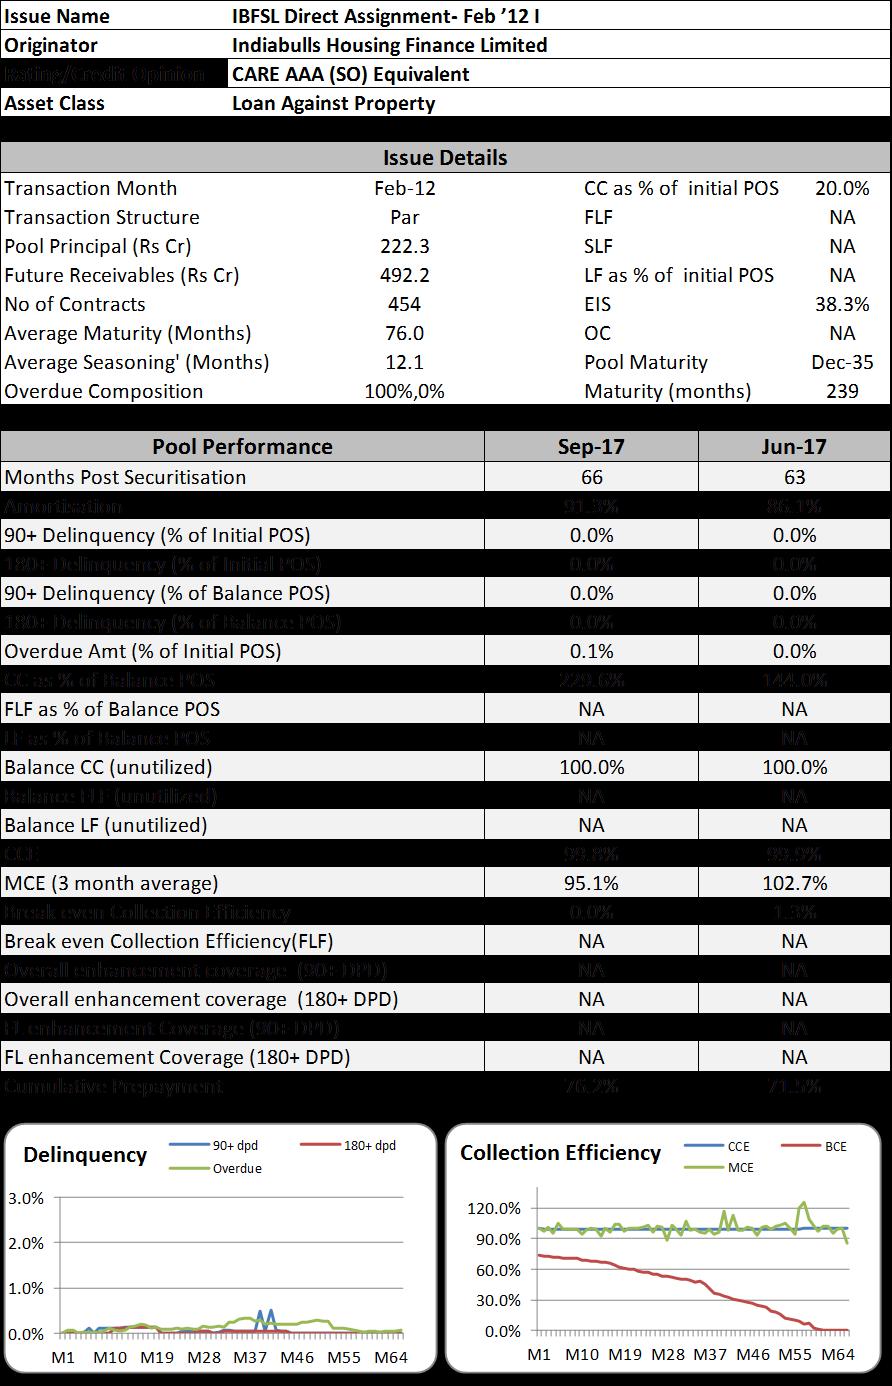
83 82
Abstract. CARE has rated more than 210 Asset Backed Securitisation (ABS) / Mortgage Backed
 / Mortgage Backed") Abstract CARE has rated more than 210 Asset Backed Securitisation (ABS) / Mortgage Backed Securitisation (MBS) pools across 28 Originators and pools aggregating to around Rs 48,000 crore covering various
Abstract CARE has rated more than 210 Asset Backed Securitisation (ABS) / Mortgage Backed Securitisation (MBS) pools across 28 Originators and pools aggregating to around Rs 48,000 crore covering various
Rating Rationale. Credit (Rs. Cr) Balance Tenure* (months) Principal Outstanding (Rs. Cr) Instrument. Structure. Remark.
 Balance Tenure* (months) Principal Outstanding (Rs. Cr) Instrument. Structure. Remark.") Rating Rationale MFL Securitisation Trust XIII Credit Opinion on Liquidity Facility and Rating/Credit Opinion Reaffirmation of Pass Through Certificates issued by MFL Securitisation Trust XIII and Second
Rating Rationale MFL Securitisation Trust XIII Credit Opinion on Liquidity Facility and Rating/Credit Opinion Reaffirmation of Pass Through Certificates issued by MFL Securitisation Trust XIII and Second
Structured Finance. Asset Backed Securities (ABS) FAQs. A One-Stop Compendium for ABS Rating Methodology ABS/RMBS.
 FAQs. A One-Stop Compendium for ABS Rating Methodology ABS/RMBS.") A One-Stop Compendium for ABS Rating Methodology ABS/RMBS Table of Content Market Structure...4 What is the Historical Trend of Issuance Volume of ABS/MBS Transactions in India?...4 How is the issuance
A One-Stop Compendium for ABS Rating Methodology ABS/RMBS Table of Content Market Structure...4 What is the Historical Trend of Issuance Volume of ABS/MBS Transactions in India?...4 How is the issuance
Banking and Finance Indian Microfinance Sector: Entering a phase of moderate credit risk, three years post AP crisis
 Indian Microfinance Sector: Entering a phase of moderate credit risk, three years post AP crisis March 7, 214 Summary Microfinance sector in India has gone through 3 broad risk phases in the past high
Indian Receivable Trust 2019 Series 5 (Originator: Reliance Home Finance Limited)
") Rating Rationale Indian Receivable Trust 2019 Series 5 (Originator: Reliance Home Finance Limited) 11 March 2019 The Ratings of BWR AAA (SO) for the Senior PTCs, issued by Indian Receivable Trust 2019
Rating Rationale Indian Receivable Trust 2019 Series 5 (Originator: Reliance Home Finance Limited) 11 March 2019 The Ratings of BWR AAA (SO) for the Senior PTCs, issued by Indian Receivable Trust 2019
Rating Rationale. Rating / Credit Opinion 1. Second Loss Facility (SL) Credit Collateral. Over Collateral
 Credit Collateral. Over Collateral") Rating Rationale Rating of Pass Through Certificates (PTCs) issued by Nirmaan RMBS Trust Series I 2018 backed by Home and LAP loan receivables (Principal outstanding Rs. 1,053.82 Cr), backed by mortgage
Rating Rationale Rating of Pass Through Certificates (PTCs) issued by Nirmaan RMBS Trust Series I 2018 backed by Home and LAP loan receivables (Principal outstanding Rs. 1,053.82 Cr), backed by mortgage
Brickwork Ratings India Pvt Ltd. Annexure V
 Brickwork Ratings India Pvt Ltd Annexure V History of credit rating of all outstanding securities as on 31st March 2012. Table 2.3 : History of credit rating of all outstanding securities Sl No Name of
IFMR CAPITAL CONNECTING MICROFINANCE INSTITUTIONS TO CAPITAL MARKETS
 Introduction to Securitisation for MFIs IFMR CAPITAL CONNECTING MICROFINANCE INSTITUTIONS TO CAPITAL MARKETS About IFMR Capital IFMR Capital is a non-banking finance company based in Chennai, whose mission
Tarini Ifmr Capital 2017 Originator: Home Credit India Finance Pvt Ltd. (Hcif) November 15, 2017
 November 15, 2017") Tarini Ifmr Capital 2017 Originator: Home Credit India Finance Pvt Ltd. (Hcif) November 15, 2017 Ratings Instrument @ Series A1 PTC # Series A2 PTC # Amount 148.59 (Rs. One Hundred Forty Eight Crore Fifty
Tarini Ifmr Capital 2017 Originator: Home Credit India Finance Pvt Ltd. (Hcif) November 15, 2017 Ratings Instrument @ Series A1 PTC # Series A2 PTC # Amount 148.59 (Rs. One Hundred Forty Eight Crore Fifty
CRISIL Performance Report
 December 07 CRISIL Performance Report ABS & MBS s CRISIL Performance Report d Finance Ratings Krishnan Sitaraman Senior Director Tel: +9 334 8070 Email: kishnan.sitaraman@crisil.com Rohit Inamdar Senior
BFIL s lowest interest rate benefits 55 lakh women in 1 lakh villages
 BFIL UPDATE Sab se Sastha loan BFIL s lowest interest rate benefits 55 lakh women in 1 lakh villages MAR 2017 BHARAT FINANCIAL INCLUSION LIMITED (Formerly known as SKS Microfinance Limited ) BSE: 533228
Division of Bond Finance Interest Rate Calculations. Revenue Estimating Conference Interest Rates Used for Appropriations, including PECO Bond Rates
 Division of Bond Finance Interest Rate Calculations Revenue Estimating Conference Interest Rates Used for Appropriations, including PECO Bond Rates November 16, 2018 Division of Bond Finance Calculation
CRISIL Performance Report
 September 07 CRISIL Performance Report ABS & MBS s CRISIL Performance Report d Finance Ratings Krishnan Sitaraman Senior Director Tel: +9 334 8070 Email: kishnan.sitaraman@crisil.com Ajit Velonie Director
DEVELOPMENTS IN THE SECURITIZATION MARKETS IN INDIA. Nidhi Bothra India Securitisation Foundation
 DEVELOPMENTS IN THE SECURITIZATION MARKETS IN INDIA Nidhi Bothra nidhi@vinodkothari.com India Securitisation Foundation HISTORY OF SECURITIZATION IN INDIA Securitization has been in existence since 1990s.
Board Presentation Quarter / Year ended 31 st March TH APRIL 2016
 Board Presentation Quarter / Year ended 31 st March 2016 19 TH APRIL 2016 1 SUMMARY FINANCIAL STATEMENT Amounts In Rs. Lakhs Financial Snapshot * Figures are annualized Quarter Ended Q-o-Q Year Ended
How Macros have changed favourably
 How Macros have changed favourably Prime Minister s most important focus Housing for All by 2022 : Action Steps and Outcomes (Urban housing requirement estimated at 4.5 Cr units by 2022) 1. Regulatory
Earnings Presentation. Annual Results FY16-17
 Earnings Presentation Annual Results FY16-17 1 Safe Harbor Except for the historical information contained herein, statements in this release which contain words or phrases such as will, aim, will likely
Tenure * (months) Varia ble
 Varia ble") Rating Rationale Rating of Pass Through Certificates issued by Pearl Trust March 2018 backed by LAP loan receivables (Principal outstanding Rs. 33.50 Cr) originated by StarAgri Finance Limited (SAFL) CARE
Rating Rationale Rating of Pass Through Certificates issued by Pearl Trust March 2018 backed by LAP loan receivables (Principal outstanding Rs. 33.50 Cr) originated by StarAgri Finance Limited (SAFL) CARE
Executive Summary. July 17, 2015
 Executive Summary July 17, 2015 The Revenue Estimating Conference adopted interest rates for use in the state budgeting process. The adopted interest rates take into consideration current benchmark rates
QUARTERLY FINANCIAL REPORT December 31, 2017
 California Independent System Operator QUARTERLY FINANCIAL REPORT December 31, 2017 Preliminary and Unaudited 250 Outcropping Way Folsom, CA 95630 (916) 351-4000 CALIFORNIA INDEPENDENT SYSTEM OPERATOR
FPSBI/M-VI/03-01/10/WN-23 (1+0.09/4)^4-1 ( )/( )-1
^4-1 ( )/( )-1") Solutions-Irawati Senna 1) B) 2) A) Nominal interest rate Effective rate Inflation Real rate of return 9.00% p.a. 9.31% p.a. 5.50% p.a. 3.61% p.a. (1+0.09/4)^4-1 (1+0.0931)/(1+0.055)-1 3) D) Amount of
Solutions-Irawati Senna 1) B) 2) A) Nominal interest rate Effective rate Inflation Real rate of return 9.00% p.a. 9.31% p.a. 5.50% p.a. 3.61% p.a. (1+0.09/4)^4-1 (1+0.0931)/(1+0.055)-1 3) D) Amount of
XML Publisher Balance Sheet Vision Operations (USA) Feb-02
 Feb-02") Page:1 Apr-01 May-01 Jun-01 Jul-01 ASSETS Current Assets Cash and Short Term Investments 15,862,304 51,998,607 9,198,226 Accounts Receivable - Net of Allowance 2,560,786
Page:1 Apr-01 May-01 Jun-01 Jul-01 ASSETS Current Assets Cash and Short Term Investments 15,862,304 51,998,607 9,198,226 Accounts Receivable - Net of Allowance 2,560,786
QUARTERLY FINANCIAL REPORT March 31, 2018
 California Independent System Operator QUARTERLY FINANCIAL REPORT March 31, 2018 250 Outcropping Way Folsom, CA 95630 (916) 351-4000 CALIFORNIA INDEPENDENT SYSTEM OPERATOR CORPORATION QUARTERLY FINANCIAL
Vivriti Windu (Originator: Fusion Microfinanceprivate Limited)
") Vivriti Windu 010 2017(Originator: Fusion Microfinanceprivate Limited) November29, 2017 Ratings Instrument Series A PTC # Amount 39.99 (Rs. Thirty ninecroreninety ninelakhs Only) Structure Yield Tenure
Vivriti Windu 010 2017(Originator: Fusion Microfinanceprivate Limited) November29, 2017 Ratings Instrument Series A PTC # Amount 39.99 (Rs. Thirty ninecroreninety ninelakhs Only) Structure Yield Tenure
Madura Micro Finance Limited
 Madura Micro Finance Limited August 20, 2018 Summary of rated instruments Instrument* Previous Rated Amount Subordinated 50.00 50.00 - Loans from Banks 300.00 300.00 Non-convertible 36.60 36.60 Non-convertible
QUARTERLY FINANCIAL REPORT June 30, 2017
 California Independent System Operator QUARTERLY FINANCIAL REPORT June 30, 2017 250 Outcropping Way Folsom, CA 95630 (916) 351-4000 CALIFORNIA INDEPENDENT SYSTEM OPERATOR CORPORATION QUARTERLY FINANCIAL
CRISIL Performance Report
 Ratings 0.97 cm 0.97 cm 4.0 cm CRISIL Performance Report 9.0 cm.0 cm.0 cm 4.0 cm March 7 ABS & MBS s 0.78 cm CRISIL Performance Report d Finance Ratings Krishnan Sitaraman Senior Director Tel: +9 334 8070
On a review of the performance of the Bank, Brickwork Ratings has reaffirmed the Rating 1 for the following instruments of Andhra Bank.
 Annual Surveillance - Rating Rationale Brickwork Ratings reaffirms the Bond Ratings for Andhra Bank s Upper Tier II issue aggregating 1000 Cr, Perpetual Tier I issue of 200 Cr and Lower Tier II issue of
BUY CMP (Rs.) 297 Target (Rs.) 385 Potential Upside 30%
 297 Target (Rs.) 385 Potential Upside 30%") Nov-15 Dec-15 Jan-16 Feb-16 Mar-16 Apr-16 May- Jun-16 Jul-16 Aug-16 Aug-16 Sep-16 Oct-16. Volume No.. I Issue No. 95 Dewan Housing Finance Corporation (DHFL) Nov. 4, 2016 BSE Code: 511072 NSE Code: DHFL
Nov-15 Dec-15 Jan-16 Feb-16 Mar-16 Apr-16 May- Jun-16 Jul-16 Aug-16 Aug-16 Sep-16 Oct-16. Volume No.. I Issue No. 95 Dewan Housing Finance Corporation (DHFL) Nov. 4, 2016 BSE Code: 511072 NSE Code: DHFL
HDFCs Assignment Of Receivables Of SEP 11. [Originator: HDFC Limited]
![HDFCs Assignment Of Receivables Of SEP 11. [Originator: HDFC Limited]](/thumbs/86/93524480.jpg "HDFCs Assignment Of Receivables Of SEP 11. [Originator: HDFC Limited]") HDFCs Assignment Of Receivables Of SEP 11 [Originator: HDFC Limited] March 29, 2018 Ratings Instrument Assignee Payouts Amount 212.69 (Rs.Two hundred and twelve crore and sixty nine lakhs only) Details
HDFCs Assignment Of Receivables Of SEP 11 [Originator: HDFC Limited] March 29, 2018 Ratings Instrument Assignee Payouts Amount 212.69 (Rs.Two hundred and twelve crore and sixty nine lakhs only) Details
Rationale/Description of Key Rating Drivers/Rating sensitivities:
 Rating Rationale Indiabulls Housing Finance Ltd. 2 May 2018 Brickwork Ratings reaffirms the ratings for various existing debt issues of Indiabulls Housing Finance Ltd aggregating to 37,150 crs. Particulars
by Dr. Kshama Fernandes, IFMR Capital
 A structured finance approach to microfinance by Dr. Kshama Fernandes, IFMR Capital 56 The lending model of making small-sized loans to groups of borrowers who mutually guarantee repayment, was brought
Performance and Outlook. November 2016
 Performance and Outlook November 2016 1 Macro Picture Asset Quality Growth Earnings Quality Retail Franchise 2 Growth in industrial production has slowed in recent months Growth in IIP and Components 14%
SmallBizU WORKSHEET 1: REQUIRED START-UP FUNDS. Online elearning Classroom. Item Required Amount ($) Fixed Assets. 1 -Buildings $ 2 -Land $
 Fixed Assets. 1 -Buildings $ 2 -Land $") WORKSHEET 1: REQUIRED START-UP FUNDS Item Required Amount () Fixed Assets 1 -Buildings 2 -Land 3 -Initial Inventory 4 -Equipment 5 -Furniture and Fixtures 6 -Vehicles 7 Total Fixed Assets Working Capital
WORKSHEET 1: REQUIRED START-UP FUNDS Item Required Amount () Fixed Assets 1 -Buildings 2 -Land 3 -Initial Inventory 4 -Equipment 5 -Furniture and Fixtures 6 -Vehicles 7 Total Fixed Assets Working Capital
Recommendation Not Rated Snapshot Bajaj Finance Ltd (BFL), earlier known as Bajaj Auto Finance Ltd is a
, earlier known as Bajaj Auto Finance Ltd is a") Recommendation Not Rated Snapshot (BFL), earlier known as Bajaj Auto Finance Ltd is a CMP (13/07/2011) Rs. 686 Bajaj group company and was incorporated in 1987. BFL started its Sector NBFC operations as
Recommendation Not Rated Snapshot (BFL), earlier known as Bajaj Auto Finance Ltd is a CMP (13/07/2011) Rs. 686 Bajaj group company and was incorporated in 1987. BFL started its Sector NBFC operations as
Allianz Group Fiscal Year 2012
 Allianz Group Fiscal Year 2012 Michael Diekmann CEO Allianz SE Financial press conference February 21, 2013 Based on preliminary figures Overview 2012 EUR 106.4bn Total revenues EUR 9.5bn Operating profit
Financial & Business Highlights For the Year Ended June 30, 2017
 Financial & Business Highlights For the Year Ended June, 17 17 16 15 14 13 12 Profit and Loss Account Operating Revenue 858 590 648 415 172 174 Investment gains net 5 162 909 825 322 516 Other 262 146
INVESTOR PRESENTATION Q3 FY18
 INVESTOR PRESENTATION Q3 FY18 CONTENTS SLIDE NO. COMPANY OVERVIEW 2 4 QUARTER UPDATES BUSINESS MODEL 6 11 OPERATING MODEL RECOVERY UPDATE 16 23 FINANCIALS PARTNERS 28 COMPANY OVERVIEW 2 ABOUT THE COMPANY
Key highlights. RBI surprised markets by not hiking rates; however changed the stance to calibrated tightening. 10 year G-Sec Yield(%)
") Key highlights RBI surprised markets by not hiking rates; however changed the stance to calibrated tightening Repo Rate maintained by RBI at 6.50% Liquidity squeezed in money market Regulators come to
Key highlights RBI surprised markets by not hiking rates; however changed the stance to calibrated tightening Repo Rate maintained by RBI at 6.50% Liquidity squeezed in money market Regulators come to
Indiabulls Housing Finance Limited Unaudited Financial Results Q1 FY July 18, 2013
 Indiabulls Housing Finance Limited Unaudited Financial Results Q1 FY 2013-14 July 18, 2013 Safe Harbour Statement This document contains certain forward-looking statements based on current expectations
ABI MONTHLY REPORT 1 January 2017 (Main evidence)
") ABI MONTHLY REPORT 1 January 2017 (Main evidence) LOANS AND DEPOSITS 1. At the end of 2016, loans to customers granted by banks operating in Italy, totalling 1,807.7 billion euro (cf. Table 1) was nearly
ABI MONTHLY REPORT 1 January 2017 (Main evidence) LOANS AND DEPOSITS 1. At the end of 2016, loans to customers granted by banks operating in Italy, totalling 1,807.7 billion euro (cf. Table 1) was nearly
April 16, BSE Limited Listing Department Phiroze Jeejeebhoy Towers Dalal Street Mumbai Dear Sirs,
 an April 16, 2018 BSE Limited Listing Department Phiroze Jeejeebhoy Towers Dalal Street Mumbai 400 001 Dear Sirs, National Stock Exchange of India Limited Listing Department Exchange Plaza, 5th floor Plot
BSE: NSE: SATIN CSE: Corporate Identity No. L65991DL1990PLC Familiarization Programme for Independent Directors
 BSE: 539404 NSE: SATIN CSE: 30024 Corporate Identity No. L65991DL1990PLC041796 Familiarization Programme for Independent Directors Microfinance Through Window of Relevance Micro-finance is defined as financial
 2 3 4 5 MISSION 47% 6 7 8 9 MISSION 10 11 12 13 14 15 TOTAL INCOME (` IN CRORES) 3,083 2,056 623 934 1,103 1,323 FY 2008 FY 2009 FY 2010 FY 2011 FY 2012 FY 2013 NET PROFIT (` IN CRORES) 343 450 194 241
MFIN MicroMeter. June, 2012
 MFIN MicroMeter June, 2012 All rights reserved. No part of this publication may be reproduced or transmitted in any form or by any means without written permission from MFIN, except you may download, reprint,
Default & Transition Study. July CARE s DEFAULT AND TRANSITION STUDY (For the period March 31, 2005 March 31, 2015) Summary
 Summary") July 2015 Default & Transition Study CARE s DEFAULT AND TRANSITION STUDY 2015 (For the period March 31, 2005 March 31, 2015) Summary CARE commenced its rating activity in 1993, and has over the years acquired
July 2015 Default & Transition Study CARE s DEFAULT AND TRANSITION STUDY 2015 (For the period March 31, 2005 March 31, 2015) Summary CARE commenced its rating activity in 1993, and has over the years acquired
Brickwork Ratings (BWR) assigns the rating for the proposed facility of Capital First Limited ( CFL or the Company ) as detailed below:
 assigns the rating for the proposed facility of Capital First Limited ( CFL or the Company ) as detailed below:") Rating Rationale Capital First Limited July 1 Brickwork Ratings assigns rating for the proposed unsecured subordinated of Rs. Crores and reaffirms the existing ratings for the bank facilities and various
Rating Rationale Capital First Limited July 1 Brickwork Ratings assigns rating for the proposed unsecured subordinated of Rs. Crores and reaffirms the existing ratings for the bank facilities and various
Adhikar Agora Annapurna Arohan Asirvad Belstar. BSS Chaitanya Fusion Grameen Koota Growing. Madura Margdarshak Midland MSM Muthoot Microfin
 Adhikar Agora Annapurna Arohan Asirvad Belstar BFIL BSS Chaitanya Fusion Grameen Koota Growing Opportunity Hindusthan Fino Jagaran Light M Power Madura Margdarshak Midland MSM Muthoot Microfin Namra Navachetna
Participate in one of the key drivers of Growth & Development in India
 Participate in one of the key drivers of Growth & Development in India DATE OF ALLOTMENT December 28, 2015 BENCHMARK Nifty Financial Services TRI (WEF From 1st February 2018) FUND SIZE Rs.261.73 (Rs. in
GRUH Finance Limited (A Subsidiary of HDFC Limited) March 2017
 March 2017") GRUH Finance Limited (A Subsidiary of HDFC Limited) March 2017 1 GRUH PROFILE 2 2 Promoted by HDFC & AKFED on July 21, 1986 Commenced operations in 1988 from Ahmedabad A subsidiary of HDFC - Since June
GRUH Finance Limited (A Subsidiary of HDFC Limited) March 2017 1 GRUH PROFILE 2 2 Promoted by HDFC & AKFED on July 21, 1986 Commenced operations in 1988 from Ahmedabad A subsidiary of HDFC - Since June
MONTHLY FINANCIAL REPORT June 2009
 California Independent System Operator MONTHLY FINANCIAL REPORT June 2009 151 Blue Ravine Road Folsom, CA 95630 (916) 351-4000 CALIFORNIA INDEPENDENT SYSTEM OPERATOR CORPORATION MONTHLY FINANCIAL REPORT
ABI MONTHLY REPORT 1 July 2018 (Main evidence)
") ABI MONTHLY REPORT 1 July 2018 (Main evidence) LOANS AND DEPOSITS 1. In June 2018, loans to customers granted by banks operating in Italy, totalling 1,773.8 billion euro (cf. Table 1) was 37 billion higher
ABI MONTHLY REPORT 1 July 2018 (Main evidence) LOANS AND DEPOSITS 1. In June 2018, loans to customers granted by banks operating in Italy, totalling 1,773.8 billion euro (cf. Table 1) was 37 billion higher
CRISIL s rating methodology for ABS transactions
 CRISIL s rating methodology for ABS transactions Executive Summary Asset-backed securitisation (ABS) refers to the securitisation of non-mortgage retail loans through an intermediary (called a special-purpose
Issue 24 MICROMETER Data as of 31st Dec 2017
 Issue 24 MICROMETER Data as of 31st Dec 2017 All rights reserved. No part of this publication may be reproduced or transmitted in any form or by any means without written permission from MFIN. However,
UNDERSTANDING THE COMPANY CREDIT REPORT
 1 How to read your CIBIL Company Credit Report (CCR) CCR is a record of your company s credit history which is created from data submitted to CIBIL by lending institutions across India. Your past payment
Think Of Us Before You Invest
 Think Of Us Before You Invest DATE OF ALLOTMENT March 31,1996 BENCHMARK S&P BSE Sensex FUND SIZE Rs.679.21 (Rs. in Cr.) MONTHLY AVERAGE AUM Rs.668.51 (Rs. in Cr.) EXIT LOAD Nil (Compulsory lock-in period
(CIN: L65922DL2005PLC136029)
") Indiabulls Housing Finance Limited (CIN: L65922DL2005PLC136029) Unaudited Consolidated Financial Results for the quarter and six months ended September 30, 2018 (Rupees in Crores) Statement of Consolidated
Indiabulls Housing Finance Limited (CIN: L65922DL2005PLC136029) Unaudited Consolidated Financial Results for the quarter and six months ended September 30, 2018 (Rupees in Crores) Statement of Consolidated
Business Cycle Index July 2010
 Business Cycle Index July 2010 Bureau of Trade and Economic Indices, Ministry of Commerce, Tel. 0 2507 5805, Fax. 0 2507 5806, www.price.moc.go.th Thailand economic still expansion. Medium-run Leading
How much will your current lifestyle cost at 60?
 (PROGRESSIVE PLAN) How much will your current lifestyle cost at 60? DATE OF ALLOTMENT November 01, 2011 BENCHMARK S&P BSE Sensex TRI (WEF From 1st February 2018) FUND SIZE Rs.467.54 (Rs. in Cr.) MONTHLY
ABI MONTHLY REPORT 1 March 2018 (Main evidence)
") ABI MONTHLY REPORT 1 March 2018 (Main evidence) LOANS AND DEPOSITS 1. In February 2018, loans to customers granted by banks operating in Italy, totalling 1,777.2 billion euro (cf. Table 1) was almost 70
ABI MONTHLY REPORT 1 March 2018 (Main evidence) LOANS AND DEPOSITS 1. In February 2018, loans to customers granted by banks operating in Italy, totalling 1,777.2 billion euro (cf. Table 1) was almost 70
April Mortgage Guarantee A Concept Paper
 April 2013 Mortgage Guarantee A Concept Paper Contents I. Introduction... 3 II. Overview of the Product... 4 III. Benefits of MG Product On Balance Sheet Funding... 5 A. Relief on Regulatory Capital Adequacy...
M2i s Experience in Microfinance
 M2i s Experience in Microfinance Title Duration Client Page Implementation of Risk Management International Finance June 2012-May 2015 Framework in 5 MFIs Corporation 3 Adaptation of Global Risk International
CreditMark. Corporate Loan Transparency: Transitioning From Accrual Accounting To Mark-To-Market Valuation
 CreditMark Corporate Loan Transparency: Transitioning From Accrual Accounting To Mark-To-Market Valuation February 2004 The Traditional Approach To Bank Lending Accrual accounting Loans valued at par until
of which : Shortfall in the equity capital of majority owned financial entities which have not been consolidated
 Basel III common disclosure March 31, 2018 Pillar 3 Table DF11 Composition of Capital Common Equity Tier 1 capital : instruments and reserves 1 Directly issued qualifying common share capital plus related
(Internet version) Financial & Statistical Report November 2018
 Financial & Statistical Report November 2018") (Internet version) Financial & Statistical Report November 2018 12/17/2018 Statement of Operations For the Period Ended November 30, 2018 (in millions) Current Month Year-to-Date Operating Revenue $ 31.4
(Internet version) Financial & Statistical Report November 2018 12/17/2018 Statement of Operations For the Period Ended November 30, 2018 (in millions) Current Month Year-to-Date Operating Revenue $ 31.4
PUBLIC DEBT MANAGEMENT QUARTERLY REPORT JANUARY-MARCH 2018
 PUBLIC DEBT MANAGEMENT QUARTERLY REPORT JANUARY-MARCH 2018 GOVERNMENT OF INDIA MINISTRY OF FINANCE BUDGET DIVISION DEPARTMENT OF ECONOMIC AFFAIRS JUNE 2018 www.dea.gov.in ii CONTENTS Section Page No. Introduction
Review of Registered Charites Compliance Rates with Annual Reporting Requirements 2016
 Review of Registered Charites Compliance Rates with Annual Reporting Requirements 2016 October 2017 The Charities Regulator, in accordance with the provisions of section 14 of the Charities Act 2009, carried
Key IRS Interest Rates After PPA
 Key IRS Rates - After PPA - thru 2011 Page 1 of 10 Key IRS Interest Rates After PPA (updated upon release of figures in IRS Notice usually by the end of the first full business week of the month) Below
Comparative Annuity Reports Your guide to comparing data about Single Premium Immediate Annuity programs
 Comparative Annuity Reports Your guide to comparing data about Single Premium Immediate Annuity programs January 2016 1-800-872-6684 www.immediateannuities.com/comparativeannuityreports/ Volume 37 Issue
6 th Capital Markets Day 12 December 2008, Vienna
 , Vienna An in-depth look at assets and asset quality Bernhard Spalt, Chief Risk Officer Presentation topics Analysing customer loans Overview CEE loan book in detail Real estate loans in detail Non-performing
OTHER DEPOSITS FINANCIAL INSTITUTIONS DEPOSIT BARKAT SAVING ACCOUNT
 WEIGHTAGES JAN FEB MAR APR MAY JUN JUL AUG SEPT OCT NOV DEC ANNOUNCEMENT DATE 19.Dez.14 27.Jän.15 24.Feb.15 26.Mär.15 27.Apr.15 26.Mai.15 25.Jun.15 28.Jul.15 26.Aug.15 23.Sep.15 27.Okt.15 25.Nov.15 MUDARIB
Jana Small Finance Bank Limited
 Summary of rated instruments Instrument Jana Small Finance Bank Limited Previous Rated mount (Rs. crore) July 20, 2018 Long-term Bank Facilities 1,300.00 270.00 Current Rated mount (Rs. crore) Non-convertible
(Internet version) Financial & Statistical Report September 2017
 Financial & Statistical Report September 2017") (Internet version) Financial & Statistical Report September 2017 10/23/2017 Statement of Operations For the Period Ended September 30, 2017 (in millions) Current Month Year-to-Date Operating Revenue &
(Internet version) Financial & Statistical Report September 2017 10/23/2017 Statement of Operations For the Period Ended September 30, 2017 (in millions) Current Month Year-to-Date Operating Revenue &
(Internet version) Financial & Statistical Report December 2017
 Financial & Statistical Report December 2017") (Internet version) Financial & Statistical Report December 2017 01/22/2018 Statement of Operations For the Period Ended December 31, 2017 (in millions) Current Month Year-to-Date Operating Revenue & Patronage
(Internet version) Financial & Statistical Report December 2017 01/22/2018 Statement of Operations For the Period Ended December 31, 2017 (in millions) Current Month Year-to-Date Operating Revenue & Patronage
(Internet version) Financial & Statistical Report December 2016
 Financial & Statistical Report December 2016") (Internet version) Financial & Statistical Report December 2016 1/23/2017 Statement of Operations For the Period Ended December 31, 2016 (in millions) Current Month Year-to-Date Operating Revenue & Patronage
(Internet version) Financial & Statistical Report December 2016 1/23/2017 Statement of Operations For the Period Ended December 31, 2016 (in millions) Current Month Year-to-Date Operating Revenue & Patronage
Issue 26 MICROMETER Data as of 30 June 2018
 Issue 26 MICROMETER Data as of 30 June 2018 All rights reserved. No part of this publication may be reproduced or transmitted in any form or by any means without written permission from MFIN. However,
U.S. Subprime Rating Surveillance Update
 U.S. Subprime Rating Surveillance Update Glenn Costello Managing Director July 2007 Agenda Rating Actions And The July 2007 Under Analysis List Risk Factors Affecting Performance and Ratings Going Forward
Equitas Holdings Limited Investor Presentation Q1FY19 Quarter ended 30 June 2018
 Equitas Holdings Limited Investor Presentation Q1FY19 Quarter ended 30 June 2018 1 MISSION Empowering through Financial Inclusion VISION To Serve 5% of Indian Households by 2025 VALUES Fair and Transparent
Business & Financial Services December 2017
 Business & Financial Services December 217 Completed Procurement Transactions by Month 2 4 175 15 125 1 75 5 2 1 Business Days to Complete 25 Jan Feb Mar Apr May Jun Jul Aug Sep Oct Nov Dec 217 Procurement
Major Economic Indicators: Monthly Update
 Volume 08/2018 August 2018 BANGLADESH BANK Contents Page No. Executive summary 1-2 1. Monetary and credit developments 3 2. Reserve money developments 4 3. CPI and inflation 5 4. Liquidity position of
Axis Bank Ltd. For private circulation only. Volume No.. III Issue No October 08, 2018
 Oct-17 Nov-17 Dec-17 Jan-18 Feb-18 Mar-18 Apr-18 May-18 Jun-18 Jul-18 Aug-18 Sep-18 Oct-18 Volume No.. III Issue No. 188. Axis Bank Ltd. October 08, 2018 BSE Code: 532215 NSE Code: AXISBANK Reuters Code:
Issue 06. MFIN micrometer. data as of 30 th June 2013
 Issue 06 MFIN micrometer data as of 30 th June 2013 All rights reserved. No part of this publication may be reproduced or transmitted in any form or by any means without written permission from MFIN. However,
Rating Rationale Western India Transport Finance Company Pvt. Ltd. (WITFIN) Ratings
 Ratings") Rating Rationale Western India Transport Finance Company Pvt. Ltd. (WITFIN) Ratings Instrument Amount (Rs. crore) Long Term Bank Facilities 35.00 (Rupees Thirty Five crore only) Rating 1 CARE BBB- (Triple
Rating Rationale Western India Transport Finance Company Pvt. Ltd. (WITFIN) Ratings Instrument Amount (Rs. crore) Long Term Bank Facilities 35.00 (Rupees Thirty Five crore only) Rating 1 CARE BBB- (Triple
Natalia Nekipelova (212) Ivan Gjaja (212)
 Ivan Gjaja (212)") Natalia Nekipelova (212) 816-8075 natalia.nekipelova@ssmb.com Ivan Gjaja (212) 816-8320 ivan.m.gjaja@ssmb.com We find that defaults and loss severity rates are significantly lower for Saxon than for the
Natalia Nekipelova (212) 816-8075 natalia.nekipelova@ssmb.com Ivan Gjaja (212) 816-8320 ivan.m.gjaja@ssmb.com We find that defaults and loss severity rates are significantly lower for Saxon than for the
Spheria Australian Smaller Companies Fund
 29-Jun-18 $ 2.7686 $ 2.7603 $ 2.7520 28-Jun-18 $ 2.7764 $ 2.7681 $ 2.7598 27-Jun-18 $ 2.7804 $ 2.7721 $ 2.7638 26-Jun-18 $ 2.7857 $ 2.7774 $ 2.7690 25-Jun-18 $ 2.7931 $ 2.7848 $ 2.7764 22-Jun-18 $ 2.7771
Mahindra & Mahindra Financial Services Limited
 Rating Rationale Mahindra & Mahindra Financial Services Limited 12 June 2017 Brickwork Ratings assigns rating for the Proposed Unsecured issue up to ` 2000 Crores and reaffirms the existing ratings for
Big Walnut Local School District
 Big Walnut Local School District Monthly Financial Report for the month ended September 30, 2013 Prepared By: Felicia Drummey Treasurer BIG WALNUT LOCAL SCHOOL DISTRICT SUMMARY OF YEAR TO DATE FINANCIAL
Equitas Holdings Limited Investor Presentation Q3FY17
 Equitas Holdings Limited Investor Presentation Q3FY17 1 Mission Empowering through Financial Inclusion Vision To Serve 5% of Indian Households by 2025 Values Fair and Transparent 2 Highlights Q3FY17 Rs.7,181
All India Benchmark Tables
 All India Benchmark Tables India Microfinance Sector: FY 2013-14 All India Benchmark Tables India Microfinance Sector: FY 2013-14 Contents Acknowledgement i Foreword ii About MIX iii Introduction iv Data
Modes of Investing in Mutual Funds
 Modes of Investing in Mutual Funds An Investor Education & Awareness Initiative By Franklin Templeton Mutual Fund Popular Modes of Investing in a Mutual Fund Lump Sum or One Time Investment Systematic
Aims to achieve the right blend of Growth and Tax Saving
 Aims to achieve the right blend of Growth and Tax Saving DATE OF ALLOTMENT March 31,1996 BENCHMARK S&P BSE Sensex FUND SIZE Rs.981.23 (Rs. in Cr.) MONTHLY AVERAGE AUM Rs.939.37 (Rs. in Cr.) EXIT LOAD Nil
Calcom Vision Limited. FY18-19 Q2 (July-Sept 18) Investors Release 29 th October, 2018
 Investors Release 29 th October, 2018") Vision Limited FY18-19 Q2 (July-Sept 18) Investors Release 29 th October, 2018 Index FY2018-19 Q2 Performance - Review FY2018-19 Sales Review Key Focus Area of the Past Quarter: Materials Requirement Planning
Vision Limited FY18-19 Q2 (July-Sept 18) Investors Release 29 th October, 2018 Index FY2018-19 Q2 Performance - Review FY2018-19 Sales Review Key Focus Area of the Past Quarter: Materials Requirement Planning
` 750 Cr (out of the rated amount of ` 1500 Cr due to non-utilization)
") Rating Rationale Punjab National Bank 05 th July Brickwork Ratings () assigns rating for Punjab National Bank s proposed fresh issue of Basel III compliant Additional Tier I Bond amounting to ` 3000 Crores,
Rating Rationale Punjab National Bank 05 th July Brickwork Ratings () assigns rating for Punjab National Bank s proposed fresh issue of Basel III compliant Additional Tier I Bond amounting to ` 3000 Crores,
CENTRAL BANK OF INDIA FINANCIAL HIGHLIGHTS FOR THE HALF YEAR
 CENTRAL BANK OF INDIA FINANCIAL HIGHLIGHTS FOR THE HALF YEAR ENDED SEPTEMBER 2011 30 th Performance Highlights Sept 2011-12(` in crore) Parameters Q2FY2012 Q2FY2011 YOY Growth (%) FY2011 Total Business
Manappuram Finance. Institutional Equities. 3QFY18 Result Update. The Glitter Is Back In Gold Loans BUY. 9 February 2018
 3QFY18 Result Update Institutional Equities Manappuram Finance 9 February 2018 Reuters: MNFL.BO; Bloomberg: MGFL IN The Glitter Is Back In Gold Loans Manappuram Finance (MFL) reported its 3QFY18 results
How much will your current lifestyle cost at 60?
 (MODERATE PLAN) How much will your current lifestyle cost at 60? DATE OF ALLOTMENT November 01,2011 BENCHMARK CRISIL Hybrid 25+75 - Aggressive Index (WEF From 1st February 2018) FUND SIZE: Rs.733.18 (Rs.
Union Bank of India NEUTRAL. Performance Highlights CMP. `393 Target Price - 2QFY2011 Result Update Banking. Investment Period -
 2QFY2011 Result Update Banking October 27, 2010 Union Bank of India Performance Highlights Particulars (` cr) 2QFY11 1QFY11 % chg (qoq) 2QFY10 % chg (yoy) NII 1,536 1,348 13.9 863 77.9 Pre-prov. profit
CANARA ROBECO DYNAMIC BOND FUND JULY 2018
 CANARA ROBECO DYNAMIC BOND FUND JULY 2018 Canara Robeco Dynamic Bond Fund An open ended dynamic debt scheme investing across duration This product is suitable for investors who are seeking* Income/ Capital
ICICI Group: Strategy & Performance. February 2010
 ICICI Group: Strategy & Performance February 2010 Certain statements in these slides are forward-looking statements. These statements are based on management's current expectations and are subject to uncertainty
CARE RATINGS DEFAULT AND TRANSITION STUDY
 January 2018 Default Study CARE RATINGS DEFAULT AND TRANSITION STUDY 2017 (For the period March 31, 2007 March 31, 2017) Summary CARE commenced its rating activity in 1993, and has over the years acquired