National Rural Utilities Cooperative Finance Corporation (CFC) Overview. November 2017
|
|
|
- Delilah Boyd
- 5 years ago
- Views:
Transcription
1 National Rural Utilities Cooperative Finance Corporation (CFC) Overview November 2017
2 Forward-Looking Statements This presentation contains forward-looking statements within the Securities Act of 1933, as amended, and the Exchange Act of 1934, as amended. Forward looking statements, which are based on certain assumptions and describe our future plans, strategies and expectations, are generally identified by our use of words such as intend, plan, may, should, will, project, estimate, anticipate, believe, expect, continue, potential, opportunity and similar expressions, whether in the negative or affirmative. All statements about future expectations or projections are forward-looking statements. Although we believe that the expectations reflected in our forward-looking statements are based on reasonable assumptions, actual results and performance may differ materially from our forward-looking statements. Factors that could cause future results to vary from forward-looking statements about our current expectations are included in our annual and quarterly periodic reports previously filed with the U.S. Securities and Exchange Commission. Except as required by law, we undertake no obligation to update or publicly release any revisions to forwardlooking statements to reflect events, circumstances or changes in expectations after the date on which the statement is made. 2
3 Non-GAAP Financial Measures During our discussion today we will review certain non- GAAP adjusted financial measures. Please refer to our Forms 10-K and/or 10-Q for a discussion of why we believe the adjusted measures are useful information in analyzing CFC s financial performance and the reconciliation to the related GAAP measures. 3
4 Table of Contents A. Business Overview & Strategy B. Operating Results, Liquidity & Funding C. Electric Cooperative Lending Landscape & Portfolio Overview D. Conclusion E. Appendix 1. Electric Cooperative Overview 2. Rated Electric Cooperatives 3. Corporate Governance, Organization Chart & Bios 4
5 A. Business Overview & Strategy

6 CFC Overview Formed 1969 Entity Type Ownership Headquarter Members * Largest private lender in the electric cooperative industry * Primary Objective Tax-exempt, member-owned cooperative Created, owned and governed by rural electric cooperatives Dulles, Virginia Total Loans $24.6 billion at 8/31/2017 Total Assets $25.5 billion at 8/31/2017 1,680 in consolidated total for distribution and G&T cooperatives for statewide & regional associations, NRECA, CFC & NCSC associates, RTFC members and associates To provide member-owners with an assured source of capital and financial products and services 6
7 Business Strategies Focus on lending to the electric cooperative sector Maintain solid credit quality of loan portfolio Manage cost structure to maintain competitiveness in loan pricing and protect net margins Retain member investments and grow members equity Balance loan growth and leverage objectives Maintain healthy liquidity and funding diversity GOAL: Continue to be the dominant lender to the electric cooperative sector 7


8 CFC Members 8
9 CFC Members G&T Service Area 9


10 CFC Company Overview CFC Member-Owners Distribution Cooperatives Most electric cooperatives are distribution utilities purchasing wholesale power from others to distribute over their own lines to the ultimate customer. Power Supply Cooperatives (G&T Cooperatives) Generation and transmission cooperatives carry high voltage electricity from generation facilities over long distances. G&Ts provide both generation and transmission functions. Statewide and Associate Members Most states have statewide associations supported by local cooperatives in that state. They provide a variety of services and legislative representation for members. Management Agreement CFC Affiliates Affiliated business line for providing financing to CFC members and their affiliates Affiliated business line for lending to rural telephone companies and their affiliates 10
11 Credit Ratings & Debt Instrument CFC s Management compensation is based on the long-term success of CFC Long-term incentives are tied to CFC s credit ratings. Fitch Moody s S&P Debt Instrument Ratings Outlook Stable Stable Stable Last Commented 9/8/ /30/ /20/2017 Collateral Trust Bonds Medium Term Notes & InterNotes Subordinated Notes Commercial Paper Guarantee of Taxexempt Bonds Offer a direct pledge of electric distribution mortgage notes Offer a direct general corporate obligation of CFC Offer a direct general corporate obligation of CFC; Obligations are subordinated to other senior debt but senior to CFC s members subordinated certificates Offer a direct general corporate obligation of CFC with backup lines of credit provided by a group of banks CFC acts as guarantor and a stand-by liquidity provider. A+ A1 A A A2 A BBB+ A3 BBB+ F1 P-1 A-1 A/F1 A2/P-1 A/A-1 11
12 CFC Capital Structure All of CFC s Members Subordinated Certificates are subordinated to all CFC non-member debt issuances (senior and subordinated) $2,797 million of cushion Senior Secured Debt (o/s) (including Collateral Trust Bonds, Farmer Mac Notes, GUP Notes) $15,227 million Senior Unsecured Debt (o/s) (including Medium Term Notes, Commercial Paper, Daily Liquidity Funds, Select Notes, other debt) $6,277 million Subordinated Deferrable Notes (o/s) $742 million Members Subordinated Certificates (o/s) Membership Subordinated Certificates ($630 million), Loans and Guarantee Subordinated Certificates ($567 million), Member Capital Securities ($221 million) $1,418 million Members Equity* $1,379 million (As of August 31, 2017) Minimum Loss Given Default Maximum * Members' Equity = GAAP equity AOCI Noncontrolling interests Cumulative derivative forward value losses 12

13 Members Equity * Members' Equity = GAAP equity AOCI Noncontrolling interests Cumulative derivative forward value losses 13

14 Collateral Trust Bonds (CTBs) Secured by the pledge of permitted investments and eligible senior secured mortgage notes from distribution system borrowers. Principal amount of eligible mortgage notes pledged must be in an amount at least equal to the outstanding principal amount of CTBs. Trustee Description of Collateral Electric distribution cooperative senior secured mortgage notes: Lien on all utility assets, a pledge of revenue and after acquired property. Eligible Mortgage Notes Criteria: -The borrower must be performing and in good standing with CFC -Notes of distribution members where 50% or more of the operating revenues are derived from direct sales of electricity -Distribution members having equity ratios of at least 20% and average debt service coverage ratios of at least 1.35x -All eligible mortgage notes of any one member cannot exceed 10% of the aggregate amount of all eligible collateral CFC Members/Borrowers Collateral Collateral $$$ $$$ Investors/CTBs Buyers 14
15 B. Operating Results, Liquidity & Funding
16 FY2017 in Review Lending Funding & Liquidity Loan Demand: Made $2.3 billion of new term loan advances Distribution Sector - $1.8 billion new term loan advances G&T Sector - $353 million new term loan advances Net Loan Volume: Increased nearly $1.2 billion during FY17 Loan Repricing: $987 million fixed-rate loans repriced during FY17 Loan Retention: $963 million or 98% of the re-priced loans were retained during FY17 100% Borrowers: Continued to gain additional100% borrowers during FY17(a total of % borrowers at FYE17) Funding: Smaller tranche, secured and unsecured, opportunistic issuances through various funding vehicles at attractive spreads Liquidity: Maintained an adequate level of highly liquid assets consisting cash and time deposits on balance sheet Maintained outstanding dealer commercial paper at an amount below $1.25 billion Extended the maturity dates of committed bank lines Continued to receive additional funding commitments under the Guaranteed Underwriter Program Portfolio Management Electric Lending: Continued to focus on lending to the rural electric cooperative sector with 99% of loans to this sector Maintained high quality portfolio with no non-performing loans at FYE17 and 0.01% net charge-offs during FY17 16


17 Historical Financial Performance 17
18 Balance Sheet Summary Growing GAAP equity through net margins accumulation Long-term goal of maintaining an adjusted debt-to-equity ratio of around 6.0 to 1 (dollar amounts in thousands) 05/31/13 05/31/14 05/31/15 05/31/16 05/31/ to 2017 change Change in % Cash and Cash Equivalents $184,758 $339,235 $249,321 $209,168 $188,421 ($20,747) -10% Investments 731, , , , ,554 (109,386) -26% Gross Loans to Members 20,305,874 20,476,642 21,469,017 23,162,696 24,367,044 1,204,348 5% Less: Allowance for Loan Losses (54,325) (56,429) (33,690) (33,258) (37,376) (4,118) 12% Loans to Members, Net 20,251,549 20,420,213 21,435,327 23,129,438 24,329,668 1,200,230 5% Foreclosed Assets 261, , , ,967 0 (102,967) -100% Derivative Assets 257, , ,276 80,095 49,481 (30,614) -38% Other Assets 345, , , , ,568 (1,024) 0% Total Assets $22,032,702 $22,190,685 $22,846,059 $24,270,200 $25,205,692 $935,492 4% Short-term Debt $4,557,434 $4,099,331 $3,127,754 $2,938,848 $3,342,900 $404,052 14% Long-term Debt¹ 13,787,254 14,475,635 16,244,794 17,473,603 17,955, ,991 3% Subordinated Deferrable Debt 395, , , , , % Members' Subordinated Certificates 1,765,776 1,612,191 1,505,420 1,443,810 1,419,025 (24,785) -2% Total Debt Outstanding 20,506,193 20,582,784 21,273,667 22,598,473 23,459, ,320 4% Derivative Liabilities 475, , , , ,337 (209,483) -35% Other Liabilities 239, , , , ,757 2,228 1% Total Equity 811, , , ,378 1,098, ,427 34% Total Liabilities & Equity $22,032,702 $22,190,685 $22,846,059 $24,270,200 $25,205,692 $935,492 4% Members' Equity 2 $998,115 $1,112,300 $1,167,319 $1,298,138 $1,389,303 $91,165 7% Key Financial Ratios Adjusted Liabilities 3 $18,373,843 $18,622,422 $19,445,531 $20,498,466 $21,392,856 $894,390 4% Adjusted Total Equity 4 $3,190,201 $3,157,053 $3,106,808 $3,519,270 $3,597,378 $78,108 2% Adjusted Debt-to-Equity Ratio % ¹Includes long-term debt maturities due within twelve months ²Members' Equity = GAAP equity AOCI Noncontrolling interests Cumulative derivative forward value losses 3 Adjusted Liabilities = Total Liabilities - (Derivative Liabilities + Debt used to fund loans guaranteed by RUS + Subordinated Deferrable Debt + Subordinated Certificates) 4 Adjusted Equity = Total Equity - (Prior Year Cumulative Derivative Forward Value and Foreign Currency Adjustments + Year to Date Derivative Forward Value, net + Accumulated Other Comprehensive Income) + (Subordinated Deferrable Debt + Subordinated Certificates) 18
19 Income Statement Summary Tax exempt, cost-plus based cooperative lender Design rates to earn an adjusted TIER of 1.10x or higher For the 12 months ended May 31, (dollar amounts in thousands) to 2017 Change Change in % Interest Income $955,753 $957,540 $952,976 $1,012,636 $1,036,634 $23,998 2% Interest Expense (692,025) (654,655) (635,684) (681,850) (741,738) (59,888) 9% Derivative Cash Settlements (56,461) (73,962) (82,906) (88,758) (84,478) 4,280-5% Adjusted Net Interest Income 207, , , , ,418 (31,610) -13% Recovery of (Provision for) Loan Losses 70,091 (3,498) 21, (5,978) (6,624) -1025% Other Non-Interest (Loss) Income 37,284 4,268 (83,365) 14,886 17,964 3,078 21% Non-Interest Expense (97,859) (76,308) (77,809) (87,993) (89,686) (1,693) 2% Adjusted Net Income 216, ,385 95, , ,718 (36,849) -22% Derivative Forward Value 141,304 39,541 (114,093) (221,083) 179, , % Net Income (Loss) $358,087 $192,926 ($18,927) ($51,516) $312,099 $363, % Adjusted TIER (1) (0.06) -5% (1) Adjusted TIER = [(Interest Expense + Derivative Cash Settlements) + (Net Income +/- Derivative Forward Value Losses/Gains)] (Interest Expense + Derivative Cash Settlements) 19
20 1QFY18 Results Balance Sheet (dollar amounts in thousands) 05/31/17 08/31/17 Change % Change Cash and Cash Equivalents $188,421 $292,661 $104,240 55% Time Deposits 226, ,000 (100,000) -44% Investments 92,554 91,404 (1,150) -1% Gross Loans to Members 24,367,044 24,642, ,033 1% Less: Allowance for Loan Losses (37,376) (37,078) 298-1% Loans to Members, Net $24,329,668 $24,604,999 $275,331 1% Derivative Assets 49,481 40,466 (9,015) -18% Other Assets 319, ,996 5,428 2% Total Assets $25,205,692 $25,480,526 $274,834 1% Short-term Debt 3,342,900 3,074,660 (268,240) -8% Long-term Debt 17,955,594 18,428, ,225 3% Subordinated Deferrable Debt 742, , % Members' Subordinated Certificates 1,419,025 1,418,207 (818) 0% Total Debt Outstanding $23,459,793 $23,663,993 $204,200 1% Derivative Liabilities 385, ,423 17,086 4% Other Liabilities 261, ,530 90,773 35% Total Equity 1,098,805 1,061,580 (37,225) -3% Total Liabilities & Equity $25,205,692 $25,480,526 $274,834 1% Members' Equity 1 $1,389,303 $1,378,971 ($10,332) -1% Key Financial Metrics Adjusted Liabilities 2 $21,392,856 $21,690,216 $297,360 1% Adjusted Total Equity 3 $3,597,378 $3,585,537 ($11,841) 0% Adjusted Debt-to-Equity Ratio % 1 - Members' Equity = GAAP equity AOCI Noncontrolling interests Cumulative derivative forward value losses 2- Adjusted Liabilities = Total Liabilities - (Derivative Liabilities + Debt Used to Fund Loans Guaranteed by RUS + Subordinated Deferrable Debt + Subordinated Certificates) 3- Adjusted Equity = Total Equity - (Prior-Year Cumulative Derivative Forward Value and Foreign Currency Adjustments + Year-to-Date Derivative Forward Value Gains (Losses) + Accumulated Other Comprehensive Income) + (Subordinated Deferrable Debt + Subordinated Certificates) 20
21 1QFY18 Results Income Statement Three Months Ended $ % (dollar amounts in thousands) 8/31/2016 8/31/2017 Change Change Interest Income $256,835 $265,915 $9,080 4% Interest Expense (181,080) (192,731) (11,651) 6% Derivative Cash Settlements (23,390) (20,222) 3,168-14% Adjusted Net Interest Income $52,365 $52,962 $597 1% (Provision) Benefit for Loan Losses (1,928) 298 2, % Other Non-Interest Income 3,418 3, % Non-Interest Expense (21,213) (22,190) (977) 5% Adjusted Net Income $32,642 $34,991 $2,349 7% Derivative Forward Value Losses (164,903) (25,976) 138,927 84% Net Income (Loss) ($132,261) $9,015 $141, % Adjusted TIER (1) % (1) Adjusted TIER = [(Interest Expense + Derivative Cash Settlements) + (Net Income +/- Derivative Forward Value Losses/Gains)] (Interest Expense + Derivative Cash Settlements) 21
22 Debt Funding Sources 49% from Capital Markets 21% from Guaranteed Underwriter Program 19% from Member-Owners 11% from Farmer Mac Debt Instrument Maturity Range 5/31/2016 5/31/2017 8/31/2017 Change from % % % Amount ($000s) Amount ($000s) Amount ($000s) 5/31/17 Daily Liquidity Fund Demand note $525, % $527, % $585, % $57,634 Member Commercial Paper 1 to 270 days $848, % $928, % $1,049, % $121,671 Member Select Notes 30 to 270 days $701, % $696, % $729, % $32,595 Member Medium-term Notes Up to 30 years $654, % $612, % $618, % $5,539 Member Capital Securities Up to 35 years $220, % $221, % $221, % $0 Membership Certificates Up to 100 years $630, % $630, % $630, % $0 Loan and Guarantee Certificates Up to 100 years $593, % $567, % $567, % ($818) Total - Members $4,173, % $4,185, % $4,401, % $216,621 Guaranteed Underwriter Program Up to 20 years $4,777, % $4,985, % $5,073, % $87,872 Notes Payable (Farmer Mac) Up to 30 years $2,303, % $2,513, % $2,502, % ($10,922) Other Up to 30 years $40, % $35, % $35, % $55 Total - Other $7,121, % $7,534, % $7,611, % $77,005 Non-member Commercial Paper 1 to 270 days $659, % $999, % $509, % ($489,841) Non-member Medium-term Notes Up to 30 years $2,648, % $2,364, % $2,760, % $396,302 Collateral Trust Bonds Up to 30 years $7,253, % $7,634, % $7,638, % $4,080 Subordinated Deferrable Debt Up to 30 years $742, % $742, % $742, % $33 Total - Capital Markets $11,303, % $11,740, % $11,651, % ($89,426) Total Debt Outstanding $22,598, % $23,459, % $23,663, % $204,200 22
23 Revolving Credit Facilities Availability as of 8/31/2017 ($ in Thousands) Total Commitment Letter of Credit Outstanding Available Commitment Three-year 11/19/19 maturity $1,532,500 $0 $1,532,500 Five-year 11/19/21 maturity 1,632,500 1,436 1,631,064 Total $3,165,000 $1,436 $3,163,564 Compliance Average TIER Actual (minimum adjusted TIER over the six most recent fiscal quarters) Leverage Ratio Actual (maximum ratio of senior debt to total equity) 11/30/16 2/28/17 5/31/17 8/31/17 Requirement Max In Compliance? 23

24 Liquidity Management At August 31, 2017, CFC had the following projected liquidity sources available: CFC is a well-known seasoned issuer and believes it has adequate access to both long-term and short-term funding options. Total Liquidity Total Short-Term Debt Maturities = 1.8x Total Liquidity Total Nonmember Related Short-Term Debt Maturities = 5.1x (1) Scheduled to expire on 7/31/2018 (2) Subject to market conditions for debt issued by Farmer Mac. (3) Anticipated loan repayments over the next 12 months. (4) Short-term debt maturities include long-term debt maturities over the next 12 months. 24
25 Liquidity Position at 8/31/2017 Projected Sources of Liquidity Projected Uses of Liquidity ($ in Mils.) LT Debt Issuance Anticipated Loan Repayments Total Projected Sources of Liquidity LT Debt Maturities (1) LT Loan Advances Total Projected Uses of Liquidity Other Sources/ (Uses) of Liquidity (2) Net LT Loan Growth (3) 11/30/17 $90 $311 $401 $176 $426 $602 $149 $115 2/28/ $1, $1, $187 5/31/ $ $598 (374) ($62) 8/31/ $ $ ($3) 11/30/18 1, $1,895 1, $1, $109 2/28/ $1, $1,093 (68) $117 Totals $4,040 $1,845 $5,885 $3,642 $2,308 $5,950 ($90) $463 (1) Long-term debt maturities includes medium-term notes with an original maturity of one year or less. (2) Includes net increase or decrease to dealer commercial paper, and purchases and maturity of investments. (3) Cumulativ e LT Loan Adv ances minus Anticipated Loan Repayments including scheduled loan amortizations, repricings and sales. 25
26 FY17 & FY18 Major Financing Activities Revolvers November 2016 Amended and extended maturities of the credit facilities by one year to November 2019 and November MTNs November 2016 Issued $300 million 3-year fixed-rate 1.50%. April 2017 Issued $350 million 2-year floating-rate 3ML + 20 bps. August 2017 Issued $350 million 5-year fixed-rate 2.30%. InterNotes FY17 - $197 million InterNotes issued with a weighted-average life of years and weightedaverage rate of 2.87%. CTBs February 2017 Issued a $450 million 7-year 2.95%. April 2017 Issued a $450 million 5-year 2.40%, and a $350 million 10-year GUP August 2016 Advanced $ %, with a 20-year final maturity. December 2016 Closed on the previously approved $375 million funding under the GUP. February 2017 Advanced $ % with a 20-year final maturity. August 2017 Advanced $ % with a 20-year final maturity. August 2017 Received an approval for additional $750 million funding under the GUP (anticipated closing by the end of 2017). Farmer Mac February 2017 Advanced a $250 million, 30-year 3ML + 84 bps and a $100 million short-term 1ML + 25 bps under the note purchase agreements. 26

27 Monthly LT Debt Maturity Schedule $700 million CTB Coupon: 5.45%, CUSIP: 63743KT1 $175 million CTB Coupon: 6.55%, CUSIP: CG8 $200 million Dealer MTN Coupon: 3ML + 35, CUSIP: 63743HEL2 $1 billion CTB Coupon: %, CUSIP: LR4 Note: Our members traditionally roll over their MTN investments at maturity. Data as of 10/31/

28 Annual LT Debt Maturity Schedule ($ in millions) Note: Our members traditionally roll over their MTN investments at maturity. Data as of 10/31/2017 Calendar Year 28
29 Funding Strategy Member Investments Attract additional and retain existing investments from members Dealer CP Issuance Minimize wholesale funding risk by maintaining dealer CP at a maximum balance of $1.25 billion CTB and MTN Issuance Smaller tranches and more frequent issuances with strategic balance between secured and unsecured issuances InterNotes Issuance Unsecured issuances targeting retail investors GUP & Farmer Mac Issuance Maintain flexibility and preserve availability 29
30 Interest Rate Management Overview CFC Loan Portfolio Characteristics: o 92% of the loans are fixed-rate amortizing loans with maturities up to 35 years o Borrowers have the option to fix the interest rate period from one year up to the maturity date of the loan o Borrowers pay make-whole and prepayment fees if they decide to prepay the loan prior to the repricing date (if not fixed to maturity) CFC Interest rate management objectives: o Match fund balance sheet targeting no more than a 5-10% mismatch o Maintain cash flow stability o Manage loan portfolio flexibility o Maintain funding flexibility Asset Liability Committee monitors interest rate risk and funding mismatch on the monthly basis 30
31 Interest Rate Management Overview Interest rate swaps with CFC s bank relationships synthetically and cost efficiently mitigate the balance sheet s exposure to interest rate risk CFC is an end-user of interest rate swaps and does not engage in derivative trading or speculative activities CFC receives U.S. Commodity Futures Trading Commission clearing and margin exemption on interest rate swaps a recognition of the low risk nature of CFC s business activities and the benefits swaps afford to CFC and its member-owners via competitive interest rates on loans Hedge accounting treatment on interest rate swaps does not apply to CFC swaps Accounting treatment of CFC s interest rate swaps under GAAP: o All CFC s derivatives are recorded at fair value as either assets or liabilities on the balance sheet (no off balance sheet derivatives) o Both unrealized gains and losses from changes in fair value and realized gains and losses from cash settlements are recorded in the derivative gains (losses) line on the consolidated statement of operations for each reporting period o As a result, both unrealized and realized gains/losses impact CFC s total equity at the end of each reporting period The covenant calculations in all CFC debt indentures and loan agreements exclude the impact of unrealized derivative gains/losses from CFC s key financial results 31
32 Interest Rate Swaps Impact on Financial Statements Notional outstanding for interest rate swaps: ($ in 000s) FY15 % FY16 % FY17 % Q1FY18 % Pay fixed/receiv e floating $5,776,533 60% $6,661,471 66% $6,807,013 65% $7,090,088 65% Pay floating/receiv e fixed $3,849,000 40% $3,499,000 34% $3,699,000 35% $3,849,000 35% Total - Notional Amount Outstanding $9,625, % $10,160, % $10,506, % $10,939, % Derivative Gains/(Losses) on the income statement: ($ in 000s) FY15 FY16 FY17 Q1FY18 Deriv ativ e Cash Settlements $ (82,906) $ (88,758) $ (84,478) $ (20,222) Represents realized gains/losses Deriv ativ e Forw ard Value $ (114,093) $ (221,083) $ 179,381 $ (25,976) Represents unrealized gains/losses Derivative Gains (Losses) $ (196,999) $ (309,841) $ 94,903 $ (46,198) 32
33 C. Electric Cooperative Lending Landscape & Portfolio Overview
34 Electric Cooperative Lending Landscape CFC ($22 billion in long-term loans O/S) Rural Utilities Service ( RUS ) ($39 billion in long-term loans O/S) $ $ Electric Cooperatives $ Capital Markets ($34 billion in long-term loans O/S) ($95 billion in long-term loans O/S) RUS: Largest lender to electric cooperatives CFC: Largest private lender to electric cooperatives and 100% owned by electric cooperatives Capital Markets: Banks, insurance companies, pension funds, etc. Data as of 12/31/2016; Except for CFC amount, other reported amounts are based on member-provided information. 34
35 CFC Market Share Loans Outstanding ($ in billions) $20.0 $15.0 $10.0 $5.0 CFC Loans Outstanding $17.7 $16.1 $14.1 $14.9 $15.0 $3.6 $4.0 $4.1 $4.2 $4.4 $4.5 $18.8 # of 100% Borrowers CFC 100% Borrowers Long-Term Debt Outsranding $ /31/12 5/31/13 5/31/14 5/31/15 5/31/16 5/31/17 5/31/12 5/31/13 5/31/14 5/31/15 5/31/16 5/31/17 G&T Distribution ($ in billions) $40.0 $35.0 $30.0 Non-RUS Borrowers & LTD $ $ $32.9 $33.5 $ $23.0 $25.2 $25.7 $27.0 $ $ $- 0 12/31/11 12/31/12 12/31/13 12/31/14 12/31/15 12/31/16 Non-RUS Long-Term Debt Outstanding Non-RUS Borrowers Total Borrowers Total Long-Term Debt ($ in billions) $60.0 $50.0 Total LTD by Lender 23% 23% 21% 21% 21% 20% $40.0 $42.5 $42.7 $39.1 $39.7 $39.0 $39.3 $30.0 $32.5 $33.9 $26.8 $26.9 $27.8 $20.0 $24.0 $16.5 $17.1 $18.5 $19.1 $21.0 $22.1 $10.0 $- 12/31/11 12/31/12 12/31/13 12/31/14 12/31/15 12/31/16 CFC RUS Other CFC Market Share 25% 20% 15% 10% 5% 0% Except for CFC-related data, other reported data are based on member-provided information. 35


36 CFC Portfolio Overview Strategy: Focus on lending to the rural electric cooperative sector 92% of loans are on a senior secured basis. 99% of loans are to the electric utility sector. Loan portfolio consists of primarily longterm fixed rate loans. 98% of repricing loans were retained. 36
37 r CFC Portfolio Overview Strategy: Focus on lending to the rural electric cooperative sector High quality asset portfolio During CFC s 48-year history, there have only been 16 defaults and six losses in the electric utility portfolio; net write-offs for the electric portfolio totaled $86 million. At 1QFY18, CFC did not have any nonperforming loans. During 1QFY18, CFC had no charge-offs. 37
38 Consolidated Loans Outstanding by State & Territory at May 31, 2017 (Sorted by Loan Balance) Top 10 States - FY16-17 Loan Growth State/Territory Loan Balance ($ in 000s) Loan Balance % Number of Borrowers State/Territory Loan Balance ($ in 000s) Loan Balance % Number of Borrowers State/Territory FY16-FY17 Loan Growth ($ in 000s) % of FY16-FY17 Total Loan Growth Texas $ 3,619, % 73 Virginia $ 346, % 18 Texas $ 186, % Georgia $ 1,404, % 44 Nevada $ 327, % 5 Colorado $ 120, % Missouri $ 1,284, % 48 Washington $ 321, % 11 Kansas $ 114, % Colorado $ 1,282, % 26 Louisiana $ 293, % 10 North Carolina $ 113, % Kansas $ 1,112, % 31 Wyoming $ 265, % 15 Hawaii $ 102, % North Dakota $ 881, % 18 South Dakota $ 226, % 32 Indiana $ 90, % Alaska $ 879, % 16 Arizona $ 198, % 11 Kentucky $ 86, % Illinois $ 836, % 27 Montana $ 173, % 25 Florida $ 79, % Florida $ 773, % 17 Michigan $ 151, % 14 Maryland $ 66, % North Carolina $ 772, % 28 Hawaii $ 146, % 2 Missouri $ 61, % South Carolina $ 759, % 23 Idaho $ 136, % 12 All Other States $ 180, % Indiana $ 740, % 38 Delaware $ 118, % 3 Total Loan Growth $ 1,203, % Kentucky $ 735, % 24 New Hampshire $ 90, % 1 Minnesota $ 726, % 54 Tennessee $ 86, % 17 Oklahoma $ 720, % 26 New Mexico $ 71, % 16 Loans Outstanding to 20 Largest Borrowers Arkansas $ 573, % 21 Massachusetts $ 60, % 1 Amount % of Total Alabama $ 549, % 27 Vermont $ 46, % 4 Loans Outstanding $5.75 billion 23% Ohio $ 521, % 28 California $ 34, % 4 Maryland $ 501, % 2 Nebraska $ 32, % 16 Pennsylvania $ 491, % 17 New York $ 29, % 6 Iowa $ 462, % 39 New Jersey $ 16, % 2 Wisconsin $ 409, % 24 West Virginia $ 14, % 2 Utah $ 392, % 6 Maine $ 9, % 3 Mississippi $ 378, % 18 Washington DC $ 1, % 1 Oregon $ 347, % 22 Total $ 24,356, % 928 (Less Loans covered under Farmer Mac Agreement) ($352 million) (1%) Net Loans Outstanding Exposure $5.40 billion 22% = Top 10 State - FY16-17 Loan Growth 38
39 D. Conclusion
40 Key Takeaways at 8/31/2017 Credit Ratings Fitch: F1(Short-Term); A+ (Senior Secured); A (Senior Unsecured); Stable Outlook (Last commented on 9/8/17) Moody s: P-1 (Short-Term); A1 (Senior Secured); A2 (Senior Unsecured); Stable Outlook (Last commented on 11/30/16) S&P: A-1 (Short-Term); A (Senior Secured); A (Senior Unsecured); Stable Outlook (Last commented on 10/20/17) Management s long-term incentives are tied to CFC credit ratings High-Quality Portfolio 99% of loans are to rural electric systems 92% of loans are on a senior secured basis No loans in the portfolio are classified as nonperforming as of 8/31/2017 Stable Member Investment & Strong Member Support 19% of funding is from member-owners Historically low reinvestment risk on member investments Total members equity at $1,379 million at 8/31/2017, a 106% increase from $669 million at 5/31/2010 Liquidity and Funding Diversity Maintain dealer commercial paper balance at the $1 $1.25 billion level 1.8 times liquidity coverage ratio over the next 12 months 5.1 times liquidity coverage ratio over the next 12 months, excluding short-term debt maturities related to member investments 40
41 E. Appendix 1. Electric Cooperative Overview 2. Rated Electric Cooperatives 3. Corporate Governance, Organization Chart & Bios
42 U.S. Electric Utilities Overview In the U.S., there are primarily three kinds of utilities that are distinguished by their business structure. They are electric cooperatives, investor-owned utilities ( IOUs ), and municipal systems. An electric cooperative is owned by the members it serves. Therefore, all of the owners live in the cooperative's service territory, with most customers living in rural or semi-rural areas. A cooperative operates on a non-profit, cost-of-service basis. An IOU is owned by stockholders who may or may not be customers and who may or may not live in the service area. The IOU is a forprofit enterprise. Municipal systems are usually owned by a city, a state or federal government agency. Municipal customers are usually located in urban or semi-urban areas. 42
43 U.S. Electric Utilities Overview IOUs Municipals Cooperatives Rate regulated Not rate regulated Most are not rate regulated Profit seeking; operated for the benefit of public shareholders with obligations to serve regulated ratepayers Most are large and may have multiple subsidiaries Subject to competition in the wholesale market, with some competition in the retail market Tend to have comparable rates to cooperatives and higher rates compared to municipals Private shareholder equity; no government support Operated for public benefit for the region served with obligation to serve customers Most are small relative to IOUs Little retail competition although subject to competition in the wholesale market Tend to have lower rates than G&T cooperatives and IOUs No private equity; may have access to local government fiscal support in times of fiscal stress Not-for-profit; operated for the benefit of their member owners All are small relative to IOUs Little competition Rates tend to be comparable to IOUs Most borrow from the RUS and cooperative financial institutions; larger issuers access the capital markets 43
44 U.S. Electric Utilities Overview IOUs Municipals Cooperatives Total Total Revenue ($ billions) $285 $60 $44 $389 Number of organizations 200 2, ,100 Number of total customers (in millions) Size (median number of customers) 450,000 2,000 14,000 Customers, % of total 72% 15% 13% Revenues, % of total 73% 15% 12% Kilowatt-hour sales, % of total 73% 15% 12% Sales (billions of kilowatt-hours) IOUs Municipals Cooperatives Total Residential ,404 Commercial 1, ,354 Industrial Total 2, ,704 IOUs Municipals Cooperatives Total Percentage of distribution line owned 50% 7% 42% Customers per mile of line (density) Revenue per mile of line ($) $75,500 $113,000 $16,000 Distribution plant per customer ($) $2,798 $2,740 $3,290 Assets ($ billions) $1,060 $295 $176 $1,531 Equity ($ billions) $336 $93 $58 $487 Equity % 32% 32% 33% Source: NRECA and EIA 44
45 U.S. Electric Utilities Comparison Share of Customers Miles of Distribution Line Coop, 42% Coop, 13% IOU, 72% Muni, 15% IOU, 50% Muni, 7% Share of Generation Miles of Transmission Line IOU, 37% Nonutility,41% Coop, 5% Muni, 6% PPD, 4% Federal, 7% IOU, 77% Coop, 6% Muni, 6% Federal, 11% Source: NRECA and EIA 45
46 Electric Cooperative Facts and Figures 836 distribution and 65 G&T cooperatives serve: 42 million people in 47 states 19 million businesses, homes, schools, churches, farms, irrigation systems, and other establishments in 2,500 of 3,141 counties in the United States Nearly 13% of the U.S. population To perform their mission, electric cooperatives: Own assets worth $176 billion (distribution and G&T co-ops combined); Own and maintain 2.6 million miles, or 42%, of the nation s electric distribution lines, covering 75% of the U.S. landmass; Deliver 11% of the total kilowatt-hours sold in the U.S. each year; Generate nearly 5% of the total electricity produced in the U.S. each year ; Employ 70,000 people in the U.S.; Retire over $1 billion in capital credits annually; Pay over $1.3 billion in state and local taxes. Compared with Other Electric Utilities Source: NRECA (February 2017) Co-ops serve an average of 7.4 consumers per mile of line and collect annual revenue of approximately $16,000 per mile of line IOUs average 34 customers per mile of line and collect $75,500 per mile of line Municipals average 48 consumers per mile of line and collect $113,000 per mile of line 46
47 Electric Cooperative Facts and Figures Coops Serve Primarily Farms & Families (kwh Residential Sales) Other Utilities Serve Primarily Businesses (kwh Commercial & Industrial Sales) 60% 50% 40% 30% 20% 10% 54% 36% 37% 70% 60% 50% 40% 30% 20% 10% 46% 64% 63% 0% Coop IOU Muni 0% Coop IOU Muni Coops Serve the Most Rural Areas & Have Fewest Customers Per Mile Coops Have The Least Amount of Revenue Per Mile $120,000 $100,000 $80,000 $60,000 $75,500 $113, $40, $20,000 $16, Coop IOU Muni $- Coop IOU Muni Source: NRECA and EIA 47


48 G&T Cooperatives Generation Profile Data Source: CFC KPI as of 7/26/
49 Distribution Electric Cooperative Credit Ratings Cooperative State Type L-T Credit Ratings (S&P/Moody's/Fitch) Brunswick E.M.C. NC DIST A//A+ Stable/Not Rated/Stable Outlook CoServ TX DIST //AA- Not Rated/Not Rated/Stable Delaware Electric Cooperative, Inc. DE DIST A// Stable/Not Rated/Not Rated Diverse Power GA DIST A// Stable/Not Rated/Not Rated Guadalupe Valley Elec TX DIST AA-//AA- Stable/Not Rated/Stable Lakeview Light & Power WA DIST /Baa2/ Not Rated/Stable/Not Rated New Hampshire Electric NH DIST A+// Positive/Not Rated/Not Rated Overton Power District #5 NV DIST /Baa1/BBB+ Not Rated/None/Positive Sulphur Springs Valley Electric AZ DIST A-//A- Stable/Not Rated/Stable Vermont Electric VT DIST A+//A- Stable/Ratings Withdrawn/Stable (As of 8/31/2017; Source: CFC, S&P, Moody s, Fitch) 49
50 Generation & Transmission Electric Cooperative Credit Ratings Cooperative State Type L-T Credit Ratings (S&P/Moody's/Fitch) Outlook Arizona Electric AZ G&T //A- Not Rated/Not Rated/Stable Arkansas Electric AR G&T AA/A1/A+ Stable/Positive/Positive Associated Electric MO G&T AA/A1/AA- Stable/Stable/Stable Basin Electric Power ND G&T A/Baa1/A+ Stable/Stable/Stable Big Rivers Electric Corp. KY G&T BB-/Ba2/BB Stable/Stable/Stable Brazos Electric TX G&T A//A Stable/Not Rated/Stable Brazos Sandy Creek TX G&T A// Stable/Not Rated/Not Rated Buckeye Power, Inc. OH G&T A/A3/A Stable/Stable/Stable Central Electric SC G&T AA-// Stable/Not Rated/Not Rated Central Iowa Power IA G&T A//A Stable/Not Rated/Stable Corn Belt Power IA G&T A// Stable/Not Rated/Withdrawn Chugach Electric AK DIST A-//A Stable/Withdrawn/Stable East Kentucky Power KY G&T A-//BBB+ Stable/Not Rated/Positive Georgia Transmission Corp. GA G&T AA-/A2/AA- Stable/Stable/Stable Golden Spread Elec TX G&T A+/A3/A Stable/Stable/Stable Great River Energy MN G&T A-/Baa1/A- Stable/Stable/Stable Hoosier Energy IN G&T A/A3/ Stable/Stable/Not Rated Kansas Electric KS G&T A+// Not Meaningful/Not Rated/Not Rated North Carolina Electric NC G&T A-//A- Stable/Not Rated/Positive Oglethorpe Power GA G&T A/Baa2/A Negative/Stable/Negative PowerSouth Energy AL G&T A-/Baa1/A- Stable/Stable/Stable Rayburn Country Electric TX G&T A-// Stable/Not Rated/Not Rated San Miguel Electric TX G&T A-//A- Stable/Not Rated/Positive Seminole Electric FL G&T A-/A3/ Stable/Stable/Not Rated South Mississippi Electric MS G&T A-/A3/A- Stable/Stable/Stable South Texas EC TX G&T A-//A- Stable/Not Rated/Positive Southern Illinois Power IL G&T BBB//BBB Stable/Not Rated/Stable Square Butte Electric ND G&T A-/Baa1/ Stable/Positive/Not Rated Tri-State Generation CO G&T A/Baa1/A- Stable/Stable/Negative Wabash Valley Power IN G&T A-// Stable/Not Rated/Not Rated Western Farmers OK G&T A-//A- Stable/Not Rated/Stable (As of 8/31/2017; Source: CFC, S&P, Moody s, Fitch) 50
51 Corporate Governance CFC is committed to strong corporate governance. Board of directors consists of up to 23 members 20 managers and directors elected from 10 geographic districts 2 from the industry s trade association, National Rural Electric Cooperative Association ( NRECA ) 1 at-large position elected from general membership that meets the requirements of the audit committee financial expert as defined by Section 407 of the Sarbanes Oxley Act of 2002 No members of CFC management hold board seats. Elected board members serve a 3-year term; limited to a maximum of 2 consecutive terms. Audit, finance advisory, executive, loan, compensation and corporate relations committees are maintained by the board. Audit committee consists of no less than 7 board members. Meetings held up to 5 times annually. 51

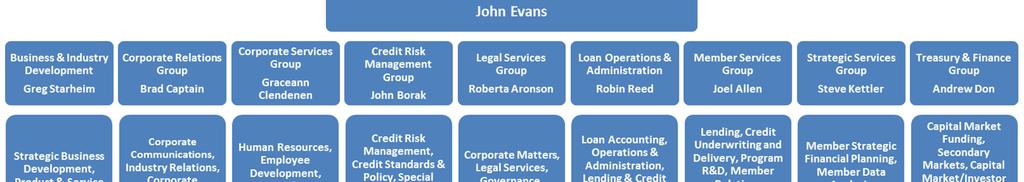


52 Organization Chart 248 Employees as of 5/31/
53 CFC Leadership Board of Directors of_directors.html CFC Senior Leadership 53
54 This slide is intentionally left blank 54

55 55
National Rural Utilities Cooperative Finance Corporation (CFC) Overview
 Overview") National Rural Utilities Cooperative Finance Corporation (CFC) Overview September 2015 CFC: Forward-Looking Statements This presentation contains forward-looking statements, which are based on certain
National Rural Utilities Cooperative Finance Corporation (CFC) Overview September 2015 CFC: Forward-Looking Statements This presentation contains forward-looking statements, which are based on certain
Investor Conference Call
 Investor Conference Call Fiscal Year 2017 Second Quarter November 30, 2016 January 25, 2017 at 11 am ET Forward-Looking Statements This presentation contains forward-looking statements within the Securities
Investor Conference Call FY2019 First Quarter Ended August 31, October 16, 2018 at 11 a.m. ET
 Investor Conference Call FY2019 First Quarter Ended August 31, 2018 October 16, 2018 at 11 a.m. ET Forward-Looking Statements This presentation contains certain statements that are considered forwardlooking
ACORD Forms Updated in AMS R1
 ACORD Forms Updated in AMS360 2017 R1 The following forms will use the ACORD form viewer, also new in this release. Forms with an indicate they were added because of requests in the Product Enhancement
LIFE AND ACCIDENT AND HEALTH
 201 FOR THE YEAR ENDED DECEMBER 1, 201 LIFE AND ACCIDENT AND HEALTH 201 Schedule A - Part 1 - Real Estate Owned Schedule A - Part 2 - Real Estate Acquired and Additions Made Schedule A - Part - Real Estate
Ability-to-Repay Statutes
 Ability-to-Repay Statutes FEDERAL ALABAMA ALASKA ARIZONA ARKANSAS CALIFORNIA STATUTE Truth in Lending, Regulation Z Consumer Credit Secure and Fair Enforcement for Bankers, Brokers, and Loan Originators
NCSL Midwest States Fiscal Leaders Forum. March 10, 2017
 NCSL Midwest States Fiscal Leaders Forum March 10, 2017 Public Pensions: 50-State Overview David Draine, Senior Officer Public Sector Retirement Systems Project The Pew Charitable Trusts More than 40 active,
Age of Insured Discount
 A discount may apply based on the age of the insured. The age of each insured shall be calculated as the policyholder s age as of the last day of the calendar year. The age of the named insured in the
Aetna Individual Direct Pay Commissions Schedule
 Aetna Individual Direct Pay Commissions Schedule Cards Issued Broker Rate Broker Tier Per Year 1st Yr 2nd Yr 3+ Yrs Levels 11-Jan 4.00% 4.00% 3.00% Bronze 24-Dec 6.00% 4.00% 3.00% Silver 25-49 8.00% 4.00%
medicaid a n d t h e How will the Medicaid Expansion for Adults Impact Eligibility and Coverage? Key Findings in Brief
 on medicaid a n d t h e uninsured July 2012 How will the Medicaid Expansion for Adults Impact Eligibility and Coverage? Key Findings in Brief Effective January 2014, the ACA establishes a new minimum Medicaid
Kentucky , ,349 55,446 95,337 91,006 2,427 1, ,349, ,306,236 5,176,360 2,867,000 1,462
 TABLE B MEMBERSHIP AND BENEFIT OPERATIONS OF STATE-ADMINISTERED EMPLOYEE RETIREMENT SYSTEMS, LAST MONTH OF FISCAL YEAR: MARCH 2003 Beneficiaries receiving periodic benefit payments Periodic benefit payments
Installment Loans CHARTS. No cap other than unconscionability:
 NCLC NATIONAL CONSUMER LAW CENTER Installment Loans WILL STATES PROTECT BORROWERS FROM A NEW WAVE OF PREDATORY LENDING? Copyright 2015, National Consumer Law Center, Inc. CHARTS CHART 1 Full APRs Allowed
ACORD Forms in ebixasp (03/2004)
") ACORD Forms in ebixasp (03/2004) Form number Form Name Edition Date 1 Property Loss Notice 2002/1 2 Automobile Loss Notice 2002/1 3 General Liability Notice of Occurrence/Claim 2002/1 4 Workers Compensation
ACORD Forms in ebixasp (03/2004) Form number Form Name Edition Date 1 Property Loss Notice 2002/1 2 Automobile Loss Notice 2002/1 3 General Liability Notice of Occurrence/Claim 2002/1 4 Workers Compensation
STATE TAX WITHHOLDING GUIDELINES
 STATE TAX WITHHOLDING GUIDELINES ( Guardian Insurance & Annuity Company, Inc. and Guardian Life Insurance Company of America (hereafter collectively referred to as Company )) (Last Updated 11/2/215) state
Sales Tax Return Filing Thresholds by State
 Thanks to R&M Consulting for assistance in putting this together Sales Tax Return Filing Thresholds by State State Alabama Alaska Arizona Arkansas California Colorado Connecticut Delaware Filing Thresholds
Annual Costs Cost of Care. Home Health Care
 2017 Cost of Care Home Health Care USA National $18,304 $47,934 $114,400 3% $18,304 $49,192 $125,748 3% Alaska $33,176 $59,488 $73,216 1% $36,608 $63,492 $73,216 2% Alabama $29,744 $38,553 $52,624 1% $29,744
Income from U.S. Government Obligations
 Baird s ----------------------------------------------------------------------------------------------------------------------------- --------------- Enclosed is the 2017 Tax Form for your account with
Impacts of Prepayment Penalties and Balloon Loans on Foreclosure Starts, in Selected States: Supplemental Tables
 THE UNIVERSITY NORTH CAROLINA at CHAPEL HILL T H E F R A N K H A W K I N S K E N A N I N S T I T U T E DR. MICHAEL A. STEGMAN, DIRECTOR T 919-962-8201 OF PRIVATE ENTERPRISE CENTER FOR COMMUNITY CAPITALISM
Pay Frequency and Final Pay Provisions
 Pay Frequency and Final Pay Provisions State Pay Frequency Minimum Final Pay Resign Final Pay Terminated Alabama Bi-weekly or semi-monthly No Provision No Provision Alaska Semi-monthly or monthly Next
Motor Vehicle Sales/Use, Tax Reciprocity and Rate Chart-2005
 The following is a Motor Vehicle Sales/Use Tax Reciprocity and Rate Chart which you may find helpful in determining the Sales/Use Tax liability of your customers who either purchase vehicles outside of
36 Million Without Health Insurance in 2014; Decreases in Uninsurance Between 2013 and 2014 Varied by State
 36 Million Without Health Insurance in 2014; Decreases in Uninsurance Between 2013 and 2014 Varied by State An estimated 36 million people in the United States had no health insurance in 2014, approximately
Checkpoint Payroll Sources All Payroll Sources
 Checkpoint Payroll Sources All Payroll Sources Alabama Alaska Announcements Arizona Arkansas California Colorado Connecticut Source Foreign Account Tax Compliance Act ( FATCA ) Under Chapter 4 of the Code
Union Members in New York and New Jersey 2018
 For Release: Friday, March 29, 2019 19-528-NEW NEW YORK NEW JERSEY INFORMATION OFFICE: New York City, N.Y. Technical information: (646) 264-3600 BLSinfoNY@bls.gov www.bls.gov/regions/new-york-new-jersey
Household Income for States: 2010 and 2011
 Household Income for States: 2010 and 2011 American Community Survey Briefs By Amanda Noss Issued September 2012 ACSBR/11-02 INTRODUCTION Estimates from the 2010 American Community Survey (ACS) and the
American Memorial Contract
 American Memorial Contract Please complete all pages of the contract and send it back to Stephens- Matthews with a copy of each state license you choose to appoint in. You are required to submit with the
Insufficient and Negative Equity
 Insufficient and Negative Equity Lack Of Equity Impedes The Real Estate Market Mark Fleming Chief Economist December, 2011 70% 60% 50% 40% 30% Negative Equity Highly Concentrated Negative Equity Share,
State Individual Income Taxes: Personal Exemptions/Credits, 2011
 Individual Income Taxes: Personal Exemptions/s, 2011 Elderly Handicapped Blind Deaf Disabled FEDERAL Exemption $3,700 $7,400 $3,700 $7,400 $0 $3,700 $0 $0 $0 $0 Alabama Exemption $1,500 $3,000 $1,500 $3,000
State, Local and Net Tuition Revenue Supporting General Operating Expenses of Higher Education, U.S., Fiscal Year 2010, Current (unadjusted) Dollars
 Dollars") State, Local and Net Tuition Revenue Supporting General Operating Expenses of Higher Education, U.S., Fiscal Year 2010, Current (unadjusted) Dollars Net Tuition $51.3 Billion 37% All State Support $73.7
State, Local and Net Tuition Revenue Supporting General Operating Expenses of Higher Education, U.S., Fiscal Year 2010, Current (unadjusted) Dollars Net Tuition $51.3 Billion 37% All State Support $73.7
STANDARD MANUALS EXEMPTIONS
 STANDARD MANUALS EXEMPTIONS The manual exemptions permits a security to be distributed in a particular state without being registered if the company issuing the security has a listing for that security
Health Insurance Price Index for October-December February 2014
 Health Insurance Price Index for October-December 2013 February 2014 ehealth 2.2014 Table of Contents Introduction... 3 Executive Summary and Highlights... 4 Nationwide Health Insurance Costs National
HAC USDA RURAL DEVELOPMENT HOUSING ACTIVITY. Rural Research Report. Housing Assistance Council FISCAL YEAR 2017 YEAR-END REPORT
 USDA RURAL DEVELOPMENT HOUSING ACTIVITY FISCAL YEAR 217 YEAR-END REPORT HAC Rural Research Report Since the 195s. the United States Department of Agriculture has financed the construction, repair, and
Data Note: What if Per Enrollee Medicaid Spending Growth Had Been Limited to CPI-M from ?
 Data Note: What if Per Enrollee Medicaid Spending Growth Had Been Limited to CPI-M from 2001-2011? Rachel Garfield, Robin Rudowitz, and Katherine Young Congress is currently debating the American Health
Highlights. Percent of States with a Decrease in MH Expenditures from Prior Year: FY2001 to 2010
 FY 2010 State Mental Health Revenues and Expenditures Information from the National Association of State Mental Health Program Directors Research Institute, Inc (NRI) Sept 2012 Highlights SMHA Funding
Federal Registry. NMLS Federal Registry Quarterly Report Quarter I
 Federal Registry NMLS Federal Registry Quarterly Report 2012 Quarter I Updated June 6, 2012 Conference of State Bank Supervisors 1129 20 th Street, NW, 9 th Floor Washington, D.C. 20036-4307 NMLS Federal
STATE BOND COMMISSION DEPARTMENT OF TREASURY. March 15, 2018
 STATE BOND COMMISSION DEPARTMENT OF TREASURY March 15, 2018 1 Overview In accordance with the Comprehensive Capital Outlay Budget, cash lines of credit provide a mechanism to cash flow capital outlay projects
NASRA Issue Brief: Employee Contributions to Public Pension Plans
 NASRA Issue Brief: Employee Contributions to Public Pension Plans September 2017 Unlike in the private sector, nearly all employees of state and local government are required to share in the cost of their
Undocumented Immigrants are:
 Immigrants are: Current vs. Full Legal Status for All Immigrants Appendix 1: Detailed State and Local Tax Contributions of Total Immigrant Population Current vs. Full Legal Status for All Immigrants
Insurer Participation on ACA Marketplaces,
 November 2018 Issue Brief Insurer Participation on ACA Marketplaces, 2014-2019 Rachel Fehr, Cynthia Cox, Larry Levitt Since the Affordable Care Act health insurance marketplaces opened in 2014, there have
Federal Rates and Limits
 Federal s and Limits FICA Social Security (OASDI) Base $118,500 Medicare (HI) Base No Limit Social Security (OASDI) Percentage 6.20% Medicare (HI) Percentage Maximum Employee Social Security (OASDI) Withholding
Media Alert. First American CoreLogic Releases Q3 Negative Equity Data
 Contact Information Below Media Alert First American CoreLogic Releases Q3 Negative Equity Data First American CoreLogic, the first company to develop a national, state and city-level negative equity report,
Long-Term Care Partnership Overview & Training Requirements Guide
 Long-Term Care Partnership Overview & Training Requirements Guide Version Sept. 12, 2012 M28108 Contents LONG-TERM CARE PARTNERSHIP OVERVIEW & TRAINING REQUIREMENTS GUIDE Long-Term Care Partnership Overview...4
The Effect of the Federal Cigarette Tax Increase on State Revenue
 FISCAL April 2009 No. 166 FACT The Effect of the Federal Cigarette Tax Increase on State Revenue By Patrick Fleenor Today the federal cigarette tax will rise from 39 cents to $1.01 per pack. The proceeds
Financing Unemployment Benefits in Today s Tough Economic Times
 Financing Unemployment Benefits in Today s Tough Economic Times Maurice Emsellem 7 th Annual Workers Voice State Legislative Issues Conference July 19, 2003. Today s Funding Situation The Good, the Bad
AIG Benefit Solutions Producer Licensing and Appointment Requirements by State
 3600 Route 66, Mail Stop 4J, Neptune, NJ 07754 AIG Benefit Solutions Producer Licensing and Appointment Requirements by State As an industry leader in the group insurance benefits market, AIG is firmly
Non-Financial Change Form
 Non-Financial Change Form Please Print All Information Below Section 1. Contract Owner s Information Administrative Offices: PO BOX 19097 Greenville, SC 29602-9097 Phone number (800) 449-0523 Overnight
FISCAL YEAR 2016 AT A GLANCE Number of Authorized Firms
 FISCAL YEAR 2016 AT A GLANCE Number of Authorized Firms 300,000 275,000 250,000 225,000 200,000 175,000 150,000 125,000 100,000 246,565 252,962 261,150 258,632 260,115 FY 2012 FY 2013 FY 2014 FY 2015 FY
Quarterly Banking Profile
 INSURED INSTITUTION PERFORMANCE Quarterly Net Income Rises to $43 Billion Higher Revenues, Lower Expenses Boost Earnings Loan Growth Remains Steady Only One Bank Fails in the Quarter Improving Earnings
Systematic Distribution Form
 Systematic Distribution Form (To be used for all Qualified Plans, IRA s and Non-Qualified Plans) (This form is not applicable to a Required Minimum Distribution ( RMD ). If you are older than 70 ½, refer
Update: 50-State Survey of Retiree Health Care Liabilities Most recent data show changes to benefits, funding policies could help manage rising costs
 A fact sheet from Dec 2018 Update: 50-State Survey of Retiree Health Care Liabilities Most recent data show changes to benefits, funding policies could help manage rising costs Getty Images Overview States
BY THE NUMBERS 2016: Another Lackluster Year for State Tax Revenue
 BY THE NUMBERS 2016: Another Lackluster Year for State Tax Revenue Jim Malatras May 2017 Lucy Dadayan and Donald J. Boyd 2016: Another Lackluster Year for State Tax Revenue Lucy Dadayan and Donald J. Boyd
The table below reflects state minimum wages in effect for 2014, as well as future increases. State Wage Tied to Federal Minimum Wage *
 State Minimum Wages The table below reflects state minimum wages in effect for 2014, as well as future increases. Summary: As of Jan. 1, 2014, 21 states and D.C. have minimum wages above the federal minimum
State Postal Abbreviation Codes
 State Postal Areviation Codes State Areviation State Areviation Alaama AL Montana MT Alaska AK Neraska NE Arizona AZ Nevada NV Arkansas AR New Hampshire NH California CA New Jersey NJ Colorado CO New Mexico
State Income Tax Tables
 ALABAMA 1 st $1,000... 2% Next 5,000... 4% Over 6,000... 5% ALASKA... 0% ARIZONA 1 1 st $10,000... 2.87% Next 15,000... 3.2% Next 25,000... 3.74% Next 100,000... 4.72% Over 150,000... 5.04% ARKANSAS 1
Long-Term Care Partnership Overview & Training Requirements Guide
 Long-Term Care Insurance Mutual of Omaha Insurance Company SM Long-Term Care Partnership Overview & Training Requirements Guide 75014 Version November 16, 2015 For producer use only. Not for use with the
ATHENE Performance Elite Series of Fixed Index Annuities
 Rates Effective August 8, 05 ATHE Performance Elite Series of Fixed Index Annuities State Availability Alabama Alaska Arizona Arkansas Product Montana Nebraska Nevada New Hampshire California PE New Jersey
Required Minimum Distribution Election Form for IRA s, 403(b)/TSA and other Qualified Plans
/TSA and other Qualified Plans") Required Minimum Distribution Election Form for IRA s, 403(b)/TSA and other Qualified Plans For Policyholders who have not annuitized their deferred annuity contracts Zurich American Life Insurance Company
Required Minimum Distribution Election Form for IRA s, 403(b)/TSA and other Qualified Plans For Policyholders who have not annuitized their deferred annuity contracts Zurich American Life Insurance Company
Metrics and Measurements for State Pension Plans. November 17, 2016 Greg Mennis
 Metrics and Measurements for State Pension Plans November 17, 2016 Greg Mennis Fiscal Sustainability Metrics Net Amortization Measures whether contributions are sufficient to reduce pension debt if plan
Housing Market Update. September 23, 2013
 Housing Market Update September 23, 2013 Overview Housing market gradually recovering from the deepest and longest downturn since the Great Depression. Excess supply of housing largely worked off. Underlying
Research. Market Summary. December Contributors
 Research Municipal Bond Credit Report The Municipal Bond Credit Report synthesizes, analyzes and presents aggregate credit information and trends in the municipal bond market. The report includes municipal
Required Training Completion Date. Asset Protection Reciprocity
 Completion Alabama Alaska Arizona Arkansas California State Certification: must complete initial 16 hours (8 hrs of general LTC CE and 8 hrs of classroom-only CE specifically on the CA for LTC prior to
kaiser medicaid and the uninsured commission on The Cost and Coverage Implications of the ACA Medicaid Expansion: National and State-by-State Analysis
 kaiser commission on medicaid and the uninsured The Cost and Coverage Implications of the ACA Expansion: National and State-by-State Analysis Executive Summary John Holahan, Matthew Buettgens, Caitlin
Frequency and Severity Results by State
 Frequency and Severity Results by State Based on Data Valued as of December 31, 2016 TABLE OF CONTENTS Executive Summary 2 Comparison to Trend Factors Used in Ratemaking 3 Method of Calculation 4 Caveats
A Study of Factors Impacting Resiliency
 A Study of Factors Impacting Resiliency Place cover image here Brian Lewandowski Associate Director, Business Research Division June 13, 2017 Project Team Colorado Research Team: Brian Lewandowski Richard
Mutual Fund Tax Information
 Mutual Fund Tax Information We have provided this information as a service to our shareholders. Thornburg Investment Management cannot and does not give tax or accounting advice. If you have further questions
State Retiree Health Care Liabilities: An Update Increased obligations in 2015 mirrored rise in overall health care costs
 A brief from Sept 207 State Retiree Health Care Liabilities: An Update Increased obligations in 205 mirrored rise in overall health care costs Overview States paid a total of $20.8 billion in 205 for nonpension
MainStay Funds Income Tax Information Notice
 MainStay Funds Income Tax Information Notice The information contained in this brochure is being furnished to shareholders of the MainStay Funds for informational purposes only. Please consult your own
NOTICE TO MEMBERS CANADIAN DERIVATIVES CORPORATION CANADIENNE DE. Trading by U.S. Residents
 NOTICE TO MEMBERS CANADIAN DERIVATIVES CORPORATION CANADIENNE DE CLEARING CORPORATION COMPENSATION DE PRODUITS DÉRIVÉS NOTICE TO MEMBERS No. 2002-013 January 28, 2002 Trading by U.S. Residents This is
Credit Suisse First Boston Mortgage Securities Corp. Home Equity Mortgage Pass-Through Certificates, HEMT Series
 FILED: NEW YORK COUNTY CLERK 5/12/216 1:9 AM INDEX NO. 63751/29 NYSCEF DOC. NO. 887 RECEIVED NYSCEF: 5/12/216 Credit Suisse First Boston Mortgage Securities Corp. Monthly Report for Distribution dated
The Costs and Benefits of Half a Loaf: The Economic Effects of Recent Regulation of Debit Card Interchange Fees. Robert J. Shapiro
 The Costs and Benefits of Half a Loaf: The Economic Effects of Recent Regulation of Debit Card Interchange Fees Robert J. Shapiro October 1, 2013 The Costs and Benefits of Half a Loaf: The Economic Effects
# of Credit Unions As of March 31, 2011
 # of Credit Unions # of Credit Unins # of Credit Unions As of March 31, 2011 8,600 8,400 8,200 8,000 8,478 8,215 7,800 7,909 7,600 7,400 7,651 7,442 7,200 7,000 6,800 # of Credit Unions -Trend By Asset-Based
Final Paycheck Laws by State
 ALABAMA AL No Provision No Provision ALASKA AK 23.05.140(b) ARIZONA AZ Ariz. Rev. Stat. 23-350, 23-353 ARKANSAS AR Ark. Code Ann. 11-4-405 CALIFORNIA CA Cal. Lab. Code 201 to 202, 227.3 COLORADO CO Colo.
SECTION 109 HOST STATE LOAN-TO-DEPOSIT RATIOS. The Board of Governors of the Federal Reserve System, the Federal Deposit Insurance
 SECTION 109 HOST STATE LOAN-TO-DEPOSIT RATIOS The Board of Governors of the Federal Reserve System, the Federal Deposit Insurance Corporation, and the Office of the Comptroller of the Currency (the agencies)
Committee on Ways and Means Democrats
 DRAFT Committee on Ways and Means Democrats Representative Sandy Levin - Ranking Member Report November 7, 2013 Millions of Unemployed Americans Will Lose Benefits Unless Congress Acts Over 3 Million Will
TA X FACTS NORTHERN FUNDS 2O17
 TA X FACTS 2O17 Northern Funds Tax Facts provides specific information about your Northern Funds investment income and capital gain distributions for 2017. If you have any questions about how to apply
DFA INVESTMENT DIMENSIONS GROUP INC. DIMENSIONAL INVESTMENT GROUP INC. Institutional Class Shares January 2018
 DFA INVESTMENT DIMENSIONS GROUP INC. DIMENSIONAL INVESTMENT GROUP INC. Institutional Class Shares January 2018 Supplementary Tax Information 2017 The following supplementary information may be useful in
State Corporate Income Tax Collections Decline Sharply
 Corporate Income Tax Collections Decline Sharply Nicholas W. Jenny and Donald J. Boyd The Rockefeller Institute Fiscal News: Vol. 1, No. 3 July 26, 2001 According to a report from the Congressional Budget
FHA Manual Underwriting Exceeding 31% / 43% DTI Eligibility Quick Reference
 Credit Score/ Compensating Factor(s)* No Compensating Factor One Compensating Factor Two Compensating Factors No Discretionary Debt Maximum DTI 31% / 43% 37% / 47% 40% / 50% 40% / 40% *Acceptable compensating
Providing Subprime Consumers with Access to Credit: Helpful or Harmful? James R. Barth Auburn University
 Providing Subprime Consumers with Access to Credit: Helpful or Harmful? James R. Barth Auburn University FICO Scores: Identifying Subprime Consumers Category FICO Score Range Super-prime 740 and Higher
Nation s Uninsured Rate for Children Drops to Another Historic Low in 2016
 Nation s Rate for Children Drops to Another Historic Low in 2016 by Joan Alker and Olivia Pham The number of uninsured children nationwide dropped to another historic low in 2016 with approximately 250,000
Eaton Vance Open-End Funds
 Eaton Vance Eaton Vance Open-End Funds 2016 Additional Tax Information Our Investment Affiliates Eaton Vance Management Contents Income by State 2 Tax-Exempt Income and AMT by Fund 9 Dividends-Received
Mutual Fund Tax Information
 2008 Mutual Fund Tax Information We have provided this information as a service to our shareholders. Thornburg Investment Management cannot and does not give tax or accounting advice. If you have further
State Estate Taxes BECAUSE YOU ASKED ADVANCED MARKETS
 ADVANCED MARKETS State Estate Taxes In 2001, President George W. Bush signed the Economic Growth and Tax Reconciliation Act (EGTRRA) into law. This legislation began a phaseout of the federal estate tax,
Termination Final Pay Requirements
 State Involuntary Termination Voluntary Resignation Vacation Payout Requirement Alabama No specific regulations currently exist. No specific regulations currently exist. if the employer s policy provides
FAPRI Analysis of Dairy Policy Options for the 2002 Farm Bill Conference
 FAPRI Analysis of Dairy Policy Options for the 2002 Farm Bill Conference FAPRI-UMC Report #04-02 April 11, 2002 Food and Agricultural Policy Research Institute University of Missouri 101 South Fifth Street
Merrill Lynch Mortgage Investors Trust Mortgage Loan Asset-Backed Certificates Series 2006-HE3 DISTRIBUTION PACKAGE. Issuance Parties.
 DISTRIBUTION PACKAGE Distribution Package Includes: * Issuance Dates - Payment Date Statement Page 1 - Remittance Summary Group Page 5 - Mortgage Loan Characteristics Page 6 - Delinquency Report Page 11
MINIMUM WAGE INCREASE GUIDE
 2017-2018 MINIMUM WAGE INCREASE GUIDE The Federal minimum wage has been $7.25 since 2009, but many states and localities have passed their own minimum wage laws. Employers must pay non-exempt employees
MINIMUM WAGE WORKERS IN HAWAII 2013
 WEST INFORMATION OFFICE San Francisco, Calif. For release Wednesday, June 25, 2014 14-898-SAN Technical information: (415) 625-2282 BLSInfoSF@bls.gov www.bls.gov/ro9 Media contact: (415) 625-2270 MINIMUM
SURVEY OF STATE FUNDING FOR PUBLIC TRANSPORTATION
 SURVEY OF STATE FUNDING FOR PUBLIC TRANSPORTATION SURVEY OF STATE FUNDING FOR PUBLIC TRANSPORTATION Characteristics of State Funding for Public Transportation The following report provides a summary of
MINIMUM WAGE INCREASE GUIDE
 2017-2018 MINIMUM WAGE INCREASE GUIDE The Federal minimum wage has been $7.25 since 2009, but many states and localities have passed their own minimum wage laws. Employers must pay non-exempt employees
MEDICAID BUY-IN PROGRAMS
 MEDICAID BUY-IN PROGRAMS Under federal law, states have the option of creating Medicaid buy-in programs that enable employed individuals with disabilities who make more than what is allowed under Section
TThe Supplemental Nutrition Assistance
 STATE SUPPLEMENTAL NUTRITION ASSISTANCE PROGRAM PARTICIPATION RATES IN 2010 TThe Supplemental Nutrition Assistance Program (SNAP) is a central component of American policy to alleviate hunger and poverty.
AUGUST MORTGAGE INSURANCE DATA AT A GLANCE
 AUGUST MORTGAGE INSURANCE DATA AT A GLANCE CONTENTS 4 OVERVIEW 32 PRITE-LABEL SECURITIES Mortgage Insurance Market Composition 6 AGENCY MORTGAGE MARKET Defaults : 90+ Days Delinquent Loss Severity GSE
Research. Market Summary. March Contributors
 Research Municipal Bond Credit Report The Municipal Bond Credit Report synthesizes, analyzes and presents aggregate credit information and trends in the municipal bond market. The report includes municipal
# of Credit Unions As of September 30, 2011
 # of Credit Unions # of Credit Unions # of Credit Unions As of September 30, 2011 8,400 8,200 8,000 7,800 7,600 7,400 7,200 8,332 8,065 7,794 7,556 7,325 7,000 6,800 9,000 8,000 7,000 6,000 5,000 4,000
Federal Reserve Bank of Dallas. July 15, 2005 SUBJECT. Banking Agencies Issue Host State Loan-to-Deposit Ratios DETAILS
 Federal Reserve Bank of Dallas 2200 N. PEARL ST. DALLAS, TX 75201-2272 July 15, 2005 Notice 05-37 TO: The Chief Executive Officer of each financial institution and others concerned in the Eleventh Federal
STATE AND FEDERAL MINIMUM WAGES
 2017 STATE AND FEDERAL MINIMUM WAGES STATE AND FEDERAL MINIMUM WAGES The federal Fair Labor Standards Act (FLSA) establishes minimum wage and overtime requirements for most employers in the private sector
Financial Transaction Form for IRA and Non-Qualified Contracts Only
 Financial Transaction Form for IRA and Non-Qualified Contracts Only (Note: See Form ZA-8642 dealing with Financial Transactions for 403(b)/TSA s) Please Print All Information Below Zurich American Life
Q Homeowner Confidence Survey Results. May 20, 2010
 Q1 2010 Homeowner Confidence Survey Results May 20, 2010 The Zillow Homeowner Confidence Survey is fielded quarterly to determine the confidence level of American homeowners when it comes to the value
Recourse for Employees Misclassified as Independent Contractors Department for Professional Employees, AFL-CIO
 Recourse for Employees Misclassified as Independent Contractors Department for Professional Employees, AFL-CIO State Relevant Agency Contact Information Online Resources Online Filing Alabama Department
Year-End Tax Tables Applicable to Form 1099-DIV Page 2 Qualified Dividend Income
 Year-End Tax Tables This document contains general information to assist you in completing your 2016 tax returns. You should consult your tax advisor to determine the appropriate use of these tables. This