Topic 8: Model Diagnostics
|
|
|
- Phillip Bishop
- 5 years ago
- Views:
Transcription
1 Topic 8: Model Diagnostics
2 Outline Diagnostics to check model assumptions Diagnostics concerning X Diagnostics using the residuals
3 Diagnostics and remedial measures Diagnostics: look at the data to diagnose situations where the assumptions of our model are violated Violations inference cannot be trusted Remedies: changes in analytic strategy to fix / adjust for these problems
4 Look at the data Before trying to describe the relationship between a response variable (Y) and an explanatory variable (X), we should look at the distributions of these variables We should always look at X If Y depends on X, looking at Y alone may not be very informative looking marginally at Y is a common mistake
5 Diagnostics for X If X has many values, use Proc Univariate to get numerical summaries (e.g., mean, median, quartiles) If X has only a few values, use Proc Freq or the Freq option in Proc Univariate to get summaries (e.g., percentages, counts)
6 Diagnostics for X Examine the distribution of X Is it skewed? Are there outliers? Do the values of X depend on time (i.e., the order in which they were collected)? Suggests possible confounding factors
7 What s the concern? Model estimates based on means and sums of squares These numerical summaries are not robust to outliers Can inflate variance or influence trend Confounders may alter the relation between X and Y
8 Important Statistics Mean Standard deviation Skewness Kurtosis Range
9 Example: Toluca lot size data toluca; infile../data/ch01ta01.txt'; input lotsize hours; seq=_n_; proc univariate data=toluca plot; var lotsize; run;
10 Crude Plots Stem Leaf # Boxplot *--+--* Multiply Stem.Leaf by 10**+1
11 Moments Moments N 25 Sum Weights 25 Mean 70 Sum Observations 1750 Std Deviation Variance 825 Skewness Kurtosis Uncorrected SS Corrected SS Coeff Variation Std Error Mean
12 Location and Spread Basic Statistical Measures Location Variability Mean Std Deviation Median Variance Mode Range Interquartile Range
13 Quantiles (Definition 5) Quantile Estimate 100% Max % % % % Q % Median 70 25% Q % 30 5% 30 1% 20 0% Min 20
14 Extreme Observations Lowest Highest Value Obs Value Obs
15 SAS CODE FOR TREND IN ORDER? symbol1 v=circle i=sm70; proc gplot data=a1; plot lotsize*seq; run;
16
17 Normal distributions Regression model does not state that X come from a single Normal distribution X can follow any distribution Regression model does not state that Y come from a single Normal distribution Assume Y X i is Normal In some cases, however, X and/or Y may be Normal and it can be useful to know this
18 Common plots Histograms Bell-shaped? Symmetric? Can often fit Normal curve on top of histogram to assess fit Box plots Normal quantile plots
19 Normal quantile plots Consider n=5 observations iid N(0,1) From Table B.1, we find P(z -.84) =.20 P(-.84 < z -.25) =.20 P(-.25 < z.25) =.20 P(.25 < z.84) =.20 P(z >.84) =.20
20 Normal quantile plots So we expect One observation -.84 One observation in (-.84, -.25) One observation in (-.25,.25) One observation in (25,.84) One observation >.84
21 Normal quantile plots Use similar idea to define expected Normal scores for given sample size n Z i = Φ -1 ((i-.375)/(n+.25)), i=1 to n Plot the order statistics X (i) vs Z i KNNL plots X (i) vs s Z i Doesn t affect nature of the plot
22 Normal quantile plots The standardized X variable is z = (X - μ)/σ So, X = μ + σ z If the data are approximately Normal, the relationship will be approximately linear with slope close to σ and intercept close to μ.
23 SAS CODE proc univariate data=toluca plot; var lotsize; qqplot lotsize; run;
24
25 Diagnostics for residuals Model: Y i = β 0 + β 1 X i + e i Predicted values: Ŷ i = b 0 + b 1 X i Residuals: e i = Y i Ŷ i So, Y i = Ŷ i + e i The e i should be similar to the e i The model assumes e i iid N(0, σ 2 )
26 Plot Plot Plot PLOT PLOT PLOT Plot
27 Questions addressed by diagnostics for residuals Is the relationship linear? Is the variance constant? Are the errors Normal? Are the errors dependent? Are there outliers?
28 Is the Relationship Linear? Plot Y vs X Plot e vs X (residual plot) Residual plot better emphasizes deviations from linear pattern Recall Topic 2 plots of scatterplot and residual plot
29 SAS CODE: Fake #1 libname xxx../data ; Data xxx.a100; do x=1 to 30; y=x*x-10*x+30+25*normal(0); output; end; run; Generates data set where Y=X 2-10X+30 Errors are Normally distributed with s=25
30 SAS CODE proc reg data=xxx.a100; model y=x; output out=a2 r=resid; run;
31 OUTPUT Analysis of Variance Source DF Sum of Squares Mean Square F Value Pr > F Model <.0001 Error Corrected Total Parameter Estimates Variable DF Parameter Estimate Standard Error t Value Pr > t Intercept <.0001 x <.0001 A significant positive relationship!!
32 SAS CODE: Visual Checks symbol1 v=circle i=rl; proc gplot data=a2; plot y*x; run; symbol1 v=circle i=sm60; proc gplot data=a2; plot y*x; proc gplot data=a2; plot resid*x/ vref=0; run; Scatterplot with regression line Scatterplot with smoothed curve Residual plot
33 Does not appear to be linear
34
35 Nonlinear behavior easier to see here?!
36 Does the variance differ across X? Plot Y vs X Plot e vs X Plot of e vs X will emphasize problems with the variance assumption
37 SAS CODE: Fake #2 libname xxx../data'; Data xxx.a100a; do x=1 to 100; y=30+100*x+10*x*normal(0); output; end; run; Generates data set where Y= X Errors are Normally distributed with s=10x
38 SAS CODE proc reg data=xxx.a100a; model y=x; output out=a2 r=resid; run;
39 OUTPUT Analysis of Variance Source DF Sum of Squares Mean Square F Value Pr > F Model <.0001 Error Corrected Total Parameter Estimates Variable DF Parameter Estimate Standard Error t Value Pr > t Intercept x <.0001 A significant positive relationship!! Estimate close to the true value!!
40 SAS CODE: Visual Checks symbol1 v=circle i=sm60; proc gplot data=a2; plot y*x; Scatterplot with smoothed curve proc gplot data=a2; plot resid*x / vref=0; run; Residual plot
41
42
43 So what?! Why is non-constant variance an issue here? Trend appears linear Estimates close to the truth Answer:
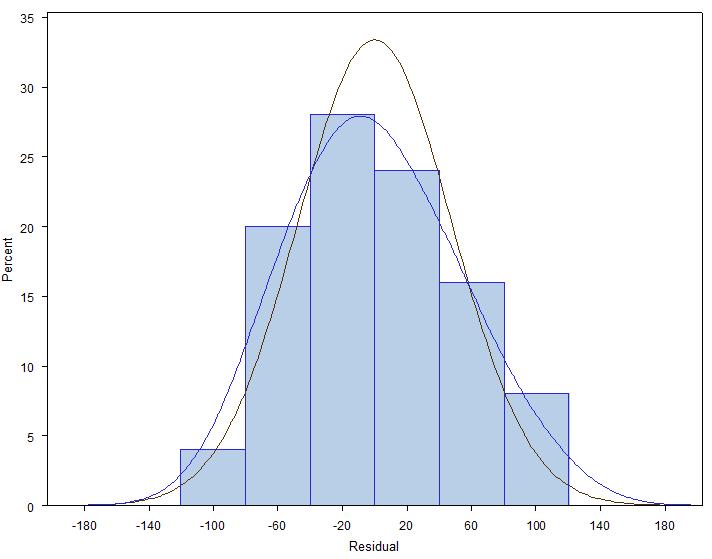
44 Are the errors Normal? The real question is whether the distribution of the errors is far enough away from Normal to invalidate our confidence intervals and significance tests Look at the residuals distribution Use a Normal quantile plot Be wary of tests of Normality
45 SAS CODE data a1; infile..\data\ch01ta01.txt'; input lotsize hours; proc reg data=a1; model hours=lotsize; output out=a2 r=resid; proc univariate data=a2 plot normal; var resid; histogram resid / normal kernel; qqplot resid;
46
47
48 Univariate Output Fitted Normal Distribution for resid Parameters for Normal Distribution Parameter Symbol Estimate Mean Mu 0 Std Dev Sigma Goodness-of-Fit Tests for Normal Distribution Test ----Statistic p Value Kolmogorov-Smirnov D Pr > D >0.150 Cramer-von Mises W-Sq Pr > W-Sq >0.250 Anderson-Darling A-Sq Pr > A-Sq >0.250 No obvious deviations from normality as P-values are greater than 0.05
49 Dependent Errors Usually we see this in a plot of residuals vs time order (KNNL) or seq (our SAS variable) We can have trends and/or cyclical effects in the residuals Observations not independent If you are interested read KNNL pgs
50 Are there outliers? Plot Y vs X Plot e vs X Plot of e vs X should emphasize an outlier
51 SAS CODE: Fake #3 Data xxx.a100b1; do x=1 to 100 by 5; y=30+50*x+200*normal(0); output; end; x=50; y=30+50* ; d='out'; output; run; Generates data set where Y=30+50X Errors are Normally distributed with s=200
52 SAS CODE proc reg data=xxx.a100b1; model y=x; where d ne 'out'; run; proc reg data=xxx.a100b1; model y=x; output out=a2 r=resid; run;
53 Without Outlier Analysis of Variance Source DF Sum of Squares Mean Square F Value Pr > F Model <.0001 Error Corrected Total Parameter Estimates Variable DF Parameter Estimate Standard Error t Value Pr > t Intercept x <.0001 s=217.8
54 With Outlier Analysis of Variance Source DF Sum of Squares Mean Square F Value Pr > F Model Error Corrected Total Parameter Estimates Variable DF Parameter Estimate Standard Error t Value Pr > t Intercept x s=2250.2
55 SAS CODE: Visual Checks symbol1 v=circle i=rl; proc gplot data=a2; plot y*x; proc gplot data=a2; plot resid*x/ vref=0; run;
56
57
58 Different kinds of outliers The outlier in the last example influenced the intercept but not the slope It inflated all of our standard errors Here is an example of an outlier that influences the slope
59 SAS CODE Data xxx.a100c1; do x=1 to 100 by 5; y=30+50*x+200*normal(0); output; end; x=100; y=30+50* ; d='out'; output; run;
60 SAS CODE proc reg data=xxx.a100c1; model y=x; where d ne 'out'; run; proc reg data=xxx.a100c1; model y=x; output out=a2 r=resid; run;
61 Without Outlier Analysis of Variance Source DF Sum of Squares Mean Square F Value Pr > F Model <.0001 Error Corrected Total Parameter Estimates Variable DF Parameter Estimate Standard Error t Value Pr > t Intercept x <.0001
62 With Outlier Analysis of Variance Source DF Sum of Squares Mean Square F Value Pr > F Model Error Corrected Total Parameter Estimates Variable DF Parameter Estimate Standard Error t Value Pr > t Intercept x
63 SAS CODE: Visual Checks symbol1 v=circle i=rl; proc gplot data=a2; plot y*x; proc gplot data=a2; plot resid*x/ vref=0; run;
64
65
66 Background Reading Program topic8.sas has code for the proc univariate diagnostics of X Program residualchecks.sas have the residual analysis The permanent sas data sets are a100.sas7bdat, a100a.sas7bdat, a100b1.sas7bdat, and a100c1.sas7bdat. Read Sections 3.8 and 3.9
Notice that X2 and Y2 are skewed. Taking the SQRT of Y2 reduces the skewness greatly.
 Notice that X2 and Y2 are skewed. Taking the SQRT of Y2 reduces the skewness greatly. The MEANS Procedure Variable Mean Std Dev Minimum Maximum Skewness ƒƒƒƒƒƒƒƒƒƒƒƒƒƒƒƒƒƒƒƒƒƒƒƒƒƒƒƒƒƒƒƒƒƒƒƒƒƒƒƒƒƒƒƒƒƒƒƒƒƒƒƒƒƒƒƒƒƒƒƒƒƒƒƒƒƒƒƒƒƒƒƒƒƒƒƒƒƒƒƒƒƒƒƒƒƒƒƒ
1. Distinguish three missing data mechanisms:
 1 DATA SCREENING I. Preliminary inspection of the raw data make sure that there are no obvious coding errors (e.g., all values for the observed variables are in the admissible range) and that all variables
Empirical Rule (P148)
") Interpreting the Standard Deviation Numerical Descriptive Measures for Quantitative data III Dr. Tom Ilvento FREC 408 We can use the standard deviation to express the proportion of cases that might fall
Interpreting the Standard Deviation Numerical Descriptive Measures for Quantitative data III Dr. Tom Ilvento FREC 408 We can use the standard deviation to express the proportion of cases that might fall
Chapter 11 : Model checking and refinement An example: Blood-brain barrier study on rats
 EXST3201 Chapter 11b Geaghan Fall 2005: Page 1 Chapter 11 : Model checking and refinement An example: Blood-brain barrier study on rats This study investigates the permeability of the blood-brain barrier
Homework 0 Key (not to be handed in) due? Jan. 10
 due? Jan. 10") Homework 0 Key (not to be handed in) due? Jan. 10 The results of running diamond.sas is listed below: Note: I did slightly reduce the size of some of the graphs so that they would fit on the page. The
Homework 0 Key (not to be handed in) due? Jan. 10 The results of running diamond.sas is listed below: Note: I did slightly reduce the size of some of the graphs so that they would fit on the page. The
The SAS System 11:03 Monday, November 11,
 The SAS System 11:3 Monday, November 11, 213 1 The CONTENTS Procedure Data Set Name BIO.AUTO_PREMIUMS Observations 5 Member Type DATA Variables 3 Engine V9 Indexes Created Monday, November 11, 213 11:4:19
Topic 30: Random Effects Modeling
 Topic 30: Random Effects Modeling Outline One-way random effects model Data Model Inference Data for one-way random effects model Y, the response variable Factor with levels i = 1 to r Y ij is the j th
SAS Simple Linear Regression Example
 SAS Simple Linear Regression Example This handout gives examples of how to use SAS to generate a simple linear regression plot, check the correlation between two variables, fit a simple linear regression
2 Exploring Univariate Data
 2 Exploring Univariate Data A good picture is worth more than a thousand words! Having the data collected we examine them to get a feel for they main messages and any surprising features, before attempting
Review: Chebyshev s Rule. Measures of Dispersion II. Review: Empirical Rule. Review: Empirical Rule. Auto Batteries Example, p 59.
 Review: Chebyshev s Rule Measures of Dispersion II Tom Ilvento STAT 200 Is based on a mathematical theorem for any data At least ¾ of the measurements will fall within ± 2 standard deviations from the
GGraph. Males Only. Premium. Experience. GGraph. Gender. 1 0: R 2 Linear = : R 2 Linear = Page 1
 GGraph 9 Gender : R Linear =.43 : R Linear =.769 8 7 6 5 4 3 5 5 Males Only GGraph Page R Linear =.43 R Loess 9 8 7 6 5 4 5 5 Explore Case Processing Summary Cases Valid Missing Total N Percent N Percent
Lecture Week 4 Inspecting Data: Distributions
 Lecture Week 4 Inspecting Data: Distributions Introduction to Research Methods & Statistics 2013 2014 Hemmo Smit So next week No lecture & workgroups But Practice Test on-line (BB) Enter data for your
Stat 101 Exam 1 - Embers Important Formulas and Concepts 1
 1 Chapter 1 1.1 Definitions Stat 101 Exam 1 - Embers Important Formulas and Concepts 1 1. Data Any collection of numbers, characters, images, or other items that provide information about something. 2.
SOLUTIONS TO THE LAB 1 ASSIGNMENT
 SOLUTIONS TO THE LAB 1 ASSIGNMENT Question 1 Excel produces the following histogram of pull strengths for the 100 resistors: 2 20 Histogram of Pull Strengths (lb) Frequency 1 10 0 9 61 63 6 67 69 71 73
Overview/Outline. Moving beyond raw data. PSY 464 Advanced Experimental Design. Describing and Exploring Data The Normal Distribution
 PSY 464 Advanced Experimental Design Describing and Exploring Data The Normal Distribution 1 Overview/Outline Questions-problems? Exploring/Describing data Organizing/summarizing data Graphical presentations
Introduction to Computational Finance and Financial Econometrics Descriptive Statistics
 You can t see this text! Introduction to Computational Finance and Financial Econometrics Descriptive Statistics Eric Zivot Summer 2015 Eric Zivot (Copyright 2015) Descriptive Statistics 1 / 28 Outline
Descriptive Analysis
 Descriptive Analysis HERTANTO WAHYU SUBAGIO Univariate Analysis Univariate analysis involves the examination across cases of one variable at a time. There are three major characteristics of a single variable
Lecture 1: Review and Exploratory Data Analysis (EDA)
") Lecture 1: Review and Exploratory Data Analysis (EDA) Ani Manichaikul amanicha@jhsph.edu 16 April 2007 1 / 40 Course Information I Office hours For questions and help When? I ll announce this tomorrow
Lecture 1: Review and Exploratory Data Analysis (EDA) Ani Manichaikul amanicha@jhsph.edu 16 April 2007 1 / 40 Course Information I Office hours For questions and help When? I ll announce this tomorrow
Chapter 3. Numerical Descriptive Measures. Copyright 2016 Pearson Education, Ltd. Chapter 3, Slide 1
 Chapter 3 Numerical Descriptive Measures Copyright 2016 Pearson Education, Ltd. Chapter 3, Slide 1 Objectives In this chapter, you learn to: Describe the properties of central tendency, variation, and
AP STATISTICS FALL SEMESTSER FINAL EXAM STUDY GUIDE
 AP STATISTICS Name: FALL SEMESTSER FINAL EXAM STUDY GUIDE Period: *Go over Vocabulary Notecards! *This is not a comprehensive review you still should look over your past notes, homework/practice, Quizzes,
Introduction to Statistical Data Analysis II
 Introduction to Statistical Data Analysis II JULY 2011 Afsaneh Yazdani Preface Major branches of Statistics: - Descriptive Statistics - Inferential Statistics Preface What is Inferential Statistics? Preface
Describing Data: One Quantitative Variable
 STAT 250 Dr. Kari Lock Morgan The Big Picture Describing Data: One Quantitative Variable Population Sampling SECTIONS 2.2, 2.3 One quantitative variable (2.2, 2.3) Statistical Inference Sample Descriptive
DATA SUMMARIZATION AND VISUALIZATION
 APPENDIX DATA SUMMARIZATION AND VISUALIZATION PART 1 SUMMARIZATION 1: BUILDING BLOCKS OF DATA ANALYSIS 294 PART 2 PART 3 PART 4 VISUALIZATION: GRAPHS AND TABLES FOR SUMMARIZING AND ORGANIZING DATA 296
Basic Procedure for Histograms
 Basic Procedure for Histograms 1. Compute the range of observations (min. & max. value) 2. Choose an initial # of classes (most likely based on the range of values, try and find a number of classes that
Some estimates of the height of the podium
 Some estimates of the height of the podium 24 36 40 40 40 41 42 44 46 48 50 53 65 98 1 5 number summary Inter quartile range (IQR) range = max min 2 1.5 IQR outlier rule 3 make a boxplot 24 36 40 40 40
Chapter 3. Descriptive Measures. Copyright 2016, 2012, 2008 Pearson Education, Inc. Chapter 3, Slide 1
 Chapter 3 Descriptive Measures Copyright 2016, 2012, 2008 Pearson Education, Inc. Chapter 3, Slide 1 Chapter 3 Descriptive Measures Mean, Median and Mode Copyright 2016, 2012, 2008 Pearson Education, Inc.
1 Describing Distributions with numbers
 1 Describing Distributions with numbers Only for quantitative variables!! 1.1 Describing the center of a data set The mean of a set of numerical observation is the familiar arithmetic average. To write
STAT 113 Variability
 STAT 113 Variability Colin Reimer Dawson Oberlin College September 14, 2017 1 / 48 Outline Last Time: Shape and Center Variability Boxplots and the IQR Variance and Standard Deviaton Transformations 2
EXST7015: Multiple Regression from Snedecor & Cochran (1967) RAW DATA LISTING
 RAW DATA LISTING") Multiple (Linear) Regression Introductory example Page 1 1 options ps=256 ls=132 nocenter nodate nonumber; 3 DATA ONE; 4 TITLE1 ''; 5 INPUT X1 X2 X3 Y; 6 **** LABEL Y ='Plant available phosphorus' 7 X1='Inorganic
Multiple (Linear) Regression Introductory example Page 1 1 options ps=256 ls=132 nocenter nodate nonumber; 3 DATA ONE; 4 TITLE1 ''; 5 INPUT X1 X2 X3 Y; 6 **** LABEL Y ='Plant available phosphorus' 7 X1='Inorganic
Some Characteristics of Data
 Some Characteristics of Data Not all data is the same, and depending on some characteristics of a particular dataset, there are some limitations as to what can and cannot be done with that data. Some key
Linear regression model
 Regression Model Assumptions (Solutions) STAT-UB.0003: Regression and Forecasting Models Linear regression model 1. Here is the least squares regression fit to the Zagat restaurant data: 10 15 20 25 10
Measures of Center. Mean. 1. Mean 2. Median 3. Mode 4. Midrange (rarely used) Measure of Center. Notation. Mean
 Measure of Center. Notation. Mean") Measure of Center Measures of Center The value at the center or middle of a data set 1. Mean 2. Median 3. Mode 4. Midrange (rarely used) 1 2 Mean Notation The measure of center obtained by adding the values
Measure of Center Measures of Center The value at the center or middle of a data set 1. Mean 2. Median 3. Mode 4. Midrange (rarely used) 1 2 Mean Notation The measure of center obtained by adding the values
Numerical Descriptions of Data
 Numerical Descriptions of Data Measures of Center Mean x = x i n Excel: = average ( ) Weighted mean x = (x i w i ) w i x = data values x i = i th data value w i = weight of the i th data value Median =
Descriptive Statistics Bios 662
 Descriptive Statistics Bios 662 Michael G. Hudgens, Ph.D. mhudgens@bios.unc.edu http://www.bios.unc.edu/ mhudgens 2008-08-19 08:51 BIOS 662 1 Descriptive Statistics Descriptive Statistics Types of variables
Chapter 3. Populations and Statistics. 3.1 Statistical populations
 Chapter 3 Populations and Statistics This chapter covers two topics that are fundamental in statistics. The first is the concept of a statistical population, which is the basic unit on which statistics
Chapter 4 Variability
 Chapter 4 Variability PowerPoint Lecture Slides Essentials of Statistics for the Behavioral Sciences Seventh Edition by Frederick J Gravetter and Larry B. Wallnau Chapter 4 Learning Outcomes 1 2 3 4 5
CHAPTER 6. ' From the table the z value corresponding to this value Z = 1.96 or Z = 1.96 (d) P(Z >?) =
 P(Z >?) =") Solutions to End-of-Section and Chapter Review Problems 225 CHAPTER 6 6.1 (a) P(Z < 1.20) = 0.88493 P(Z > 1.25) = 1 0.89435 = 0.10565 P(1.25 < Z < 1.70) = 0.95543 0.89435 = 0.06108 (d) P(Z < 1.25) or Z
Solutions to End-of-Section and Chapter Review Problems 225 CHAPTER 6 6.1 (a) P(Z < 1.20) = 0.88493 P(Z > 1.25) = 1 0.89435 = 0.10565 P(1.25 < Z < 1.70) = 0.95543 0.89435 = 0.06108 (d) P(Z < 1.25) or Z
Percentiles, STATA, Box Plots, Standardizing, and Other Transformations
 Percentiles, STATA, Box Plots, Standardizing, and Other Transformations Lecture 3 Reading: Sections 5.7 54 Remember, when you finish a chapter make sure not to miss the last couple of boxes: What Can Go
2018 AAPM: Normal and non normal distributions: Why understanding distributions are important when designing experiments and analyzing data
 Statistical Failings that Keep Us All in the Dark Normal and non normal distributions: Why understanding distributions are important when designing experiments and Conflict of Interest Disclosure I have
IOP 201-Q (Industrial Psychological Research) Tutorial 5
 Tutorial 5") IOP 201-Q (Industrial Psychological Research) Tutorial 5 TRUE/FALSE [1 point each] Indicate whether the sentence or statement is true or false. 1. To establish a cause-and-effect relation between two variables,
IOP 201-Q (Industrial Psychological Research) Tutorial 5 TRUE/FALSE [1 point each] Indicate whether the sentence or statement is true or false. 1. To establish a cause-and-effect relation between two variables,
Terms & Characteristics
 NORMAL CURVE Knowledge that a variable is distributed normally can be helpful in drawing inferences as to how frequently certain observations are likely to occur. NORMAL CURVE A Normal distribution: Distribution
Statistics I Chapter 2: Analysis of univariate data
 Statistics I Chapter 2: Analysis of univariate data Numerical summary Central tendency Location Spread Form mean quartiles range coeff. asymmetry median percentiles interquartile range coeff. kurtosis
Stat 328, Summer 2005
 Stat 328, Summer 2005 Exam #2, 6/18/05 Name (print) UnivID I have neither given nor received any unauthorized aid in completing this exam. Signed Answer each question completely showing your work where
AP Statistics Chapter 6 - Random Variables
 AP Statistics Chapter 6 - Random 6.1 Discrete and Continuous Random Objective: Recognize and define discrete random variables, and construct a probability distribution table and a probability histogram
STATISTICAL DISTRIBUTIONS AND THE CALCULATOR
 STATISTICAL DISTRIBUTIONS AND THE CALCULATOR 1. Basic data sets a. Measures of Center - Mean ( ): average of all values. Characteristic: non-resistant is affected by skew and outliers. - Median: Either
Midterm Exam. b. What are the continuously compounded returns for the two stocks?
 University of Washington Fall 004 Department of Economics Eric Zivot Economics 483 Midterm Exam This is a closed book and closed note exam. However, you are allowed one page of notes (double-sided). Answer
Models of Patterns. Lecture 3, SMMD 2005 Bob Stine
 Models of Patterns Lecture 3, SMMD 2005 Bob Stine Review Speculative investing and portfolios Risk and variance Volatility adjusted return Volatility drag Dependence Covariance Review Example Stock and
Data Distributions and Normality
 Data Distributions and Normality Definition (Non)Parametric Parametric statistics assume that data come from a normal distribution, and make inferences about parameters of that distribution. These statistical
Business Statistics 41000: Probability 3
 Business Statistics 41000: Probability 3 Drew D. Creal University of Chicago, Booth School of Business February 7 and 8, 2014 1 Class information Drew D. Creal Email: dcreal@chicagobooth.edu Office: 404
Simple Descriptive Statistics
 Simple Descriptive Statistics These are ways to summarize a data set quickly and accurately The most common way of describing a variable distribution is in terms of two of its properties: Central tendency
Math 2311 Bekki George Office Hours: MW 11am to 12:45pm in 639 PGH Online Thursdays 4-5:30pm And by appointment
 Math 2311 Bekki George bekki@math.uh.edu Office Hours: MW 11am to 12:45pm in 639 PGH Online Thursdays 4-5:30pm And by appointment Class webpage: http://www.math.uh.edu/~bekki/math2311.html Math 2311 Class
Chapter 6. y y. Standardizing with z-scores. Standardizing with z-scores (cont.)
") Starter Ch. 6: A z-score Analysis Starter Ch. 6 Your Statistics teacher has announced that the lower of your two tests will be dropped. You got a 90 on test 1 and an 85 on test 2. You re all set to drop
Starter Ch. 6: A z-score Analysis Starter Ch. 6 Your Statistics teacher has announced that the lower of your two tests will be dropped. You got a 90 on test 1 and an 85 on test 2. You re all set to drop
Both the quizzes and exams are closed book. However, For quizzes: Formulas will be provided with quiz papers if there is any need.
 Both the quizzes and exams are closed book. However, For quizzes: Formulas will be provided with quiz papers if there is any need. For exams (MD1, MD2, and Final): You may bring one 8.5 by 11 sheet of
Key Objectives. Module 2: The Logic of Statistical Inference. Z-scores. SGSB Workshop: Using Statistical Data to Make Decisions
 SGSB Workshop: Using Statistical Data to Make Decisions Module 2: The Logic of Statistical Inference Dr. Tom Ilvento January 2006 Dr. Mugdim Pašić Key Objectives Understand the logic of statistical inference
CHAPTER 2 Describing Data: Numerical
 CHAPTER Multiple-Choice Questions 1. A scatter plot can illustrate all of the following except: A) the median of each of the two variables B) the range of each of the two variables C) an indication of
Frequency Distribution and Summary Statistics
 Frequency Distribution and Summary Statistics Dongmei Li Department of Public Health Sciences Office of Public Health Studies University of Hawai i at Mānoa Outline 1. Stemplot 2. Frequency table 3. Summary
4. DESCRIPTIVE STATISTICS
 4. DESCRIPTIVE STATISTICS Descriptive Statistics is a body of techniques for summarizing and presenting the essential information in a data set. Eg: Here are daily high temperatures for Jan 16, 2009 in
We will also use this topic to help you see how the standard deviation might be useful for distributions which are normally distributed.
 We will discuss the normal distribution in greater detail in our unit on probability. However, as it is often of use to use exploratory data analysis to determine if the sample seems reasonably normally
Data that can be any numerical value are called continuous. These are usually things that are measured, such as height, length, time, speed, etc.
 Chapter 8 Measures of Center Data that can be any numerical value are called continuous. These are usually things that are measured, such as height, length, time, speed, etc. Data that can only be integer
Financial Econometrics (FinMetrics04) Time-series Statistics Concepts Exploratory Data Analysis Testing for Normality Empirical VaR
 Time-series Statistics Concepts Exploratory Data Analysis Testing for Normality Empirical VaR") Financial Econometrics (FinMetrics04) Time-series Statistics Concepts Exploratory Data Analysis Testing for Normality Empirical VaR Nelson Mark University of Notre Dame Fall 2017 September 11, 2017 Introduction
Financial Econometrics (FinMetrics04) Time-series Statistics Concepts Exploratory Data Analysis Testing for Normality Empirical VaR Nelson Mark University of Notre Dame Fall 2017 September 11, 2017 Introduction
Establishing a framework for statistical analysis via the Generalized Linear Model
 PSY349: Lecture 1: INTRO & CORRELATION Establishing a framework for statistical analysis via the Generalized Linear Model GLM provides a unified framework that incorporates a number of statistical methods
Data Analysis and Statistical Methods Statistics 651
 Data Analysis and Statistical Methods Statistics 651 http://www.stat.tamu.edu/~suhasini/teaching.html Lecture 10 (MWF) Checking for normality of the data using the QQplot Suhasini Subba Rao Review of previous
STAT Chapter 6 The Standard Deviation (SD) as a Ruler and The Normal Model
 as a Ruler and The Normal Model") STAT 203 - Chapter 6 The Standard Deviation (SD) as a Ruler and The Normal Model In Chapter 5, we introduced a few measures of center and spread, and discussed how the mean and standard deviation are good
STAT 203 - Chapter 6 The Standard Deviation (SD) as a Ruler and The Normal Model In Chapter 5, we introduced a few measures of center and spread, and discussed how the mean and standard deviation are good
Loss Simulation Model Testing and Enhancement
 Loss Simulation Model Testing and Enhancement Casualty Loss Reserve Seminar By Kailan Shang Sept. 2011 Agenda Research Overview Model Testing Real Data Model Enhancement Further Development Enterprise
Table of Contents. New to the Second Edition... Chapter 1: Introduction : Social Research...
 iii Table of Contents Preface... xiii Purpose... xiii Outline of Chapters... xiv New to the Second Edition... xvii Acknowledgements... xviii Chapter 1: Introduction... 1 1.1: Social Research... 1 Introduction...
David Tenenbaum GEOG 090 UNC-CH Spring 2005
 Simple Descriptive Statistics Review and Examples You will likely make use of all three measures of central tendency (mode, median, and mean), as well as some key measures of dispersion (standard deviation,
Section3-2: Measures of Center
 Chapter 3 Section3-: Measures of Center Notation Suppose we are making a series of observations, n of them, to be exact. Then we write x 1, x, x 3,K, x n as the values we observe. Thus n is the total number
Valid Missing Total. N Percent N Percent N Percent , ,0% 0,0% 2 100,0% 1, ,0% 0,0% 2 100,0% 2, ,0% 0,0% 5 100,0%
 dimension1 GET FILE= validacaonestscoremédico.sav' (só com os 59 doentes) /COMPRESSED. SORT CASES BY UMcpEVA (D). EXAMINE VARIABLES=UMcpEVA BY NoRespostasSignif /PLOT BOXPLOT HISTOGRAM NPPLOT /COMPARE
Analysis Variable : Y Analysis Variable : Y E
 Here is the output from the SAS program in the document Skewness, Kurtosis, and the Normal Curve *g1g2.sas; data EDA; infile 'C:\Users\Vati\Documents\StatData\EDA.dat'; input Y; proc means mean skewness
9/17/2015. Basic Statistics for the Healthcare Professional. Relax.it won t be that bad! Purpose of Statistic. Objectives
 Basic Statistics for the Healthcare Professional 1 F R A N K C O H E N, M B B, M P A D I R E C T O R O F A N A L Y T I C S D O C T O R S M A N A G E M E N T, LLC Purpose of Statistic 2 Provide a numerical
Measures of Central Tendency Lecture 5 22 February 2006 R. Ryznar
 Measures of Central Tendency 11.220 Lecture 5 22 February 2006 R. Ryznar Today s Content Wrap-up from yesterday Frequency Distributions The Mean, Median and Mode Levels of Measurement and Measures of Central
Unit 2 Statistics of One Variable
 Unit 2 Statistics of One Variable Day 6 Summarizing Quantitative Data Summarizing Quantitative Data We have discussed how to display quantitative data in a histogram It is useful to be able to describe
Descriptive Statistics
 Petra Petrovics Descriptive Statistics 2 nd seminar DESCRIPTIVE STATISTICS Definition: Descriptive statistics is concerned only with collecting and describing data Methods: - statistical tables and graphs
Statistical Models of Stocks and Bonds. Zachary D Easterling: Department of Economics. The University of Akron
 Statistical Models of Stocks and Bonds Zachary D Easterling: Department of Economics The University of Akron Abstract One of the key ideas in monetary economics is that the prices of investments tend to
Ti 83/84. Descriptive Statistics for a List of Numbers
 Ti 83/84 Descriptive Statistics for a List of Numbers Quiz scores in a (fictitious) class were 10.5, 13.5, 8, 12, 11.3, 9, 9.5, 5, 15, 2.5, 10.5, 7, 11.5, 10, and 10.5. It s hard to get much of a sense
Biostatistics and Design of Experiments Prof. Mukesh Doble Department of Biotechnology Indian Institute of Technology, Madras
 Biostatistics and Design of Experiments Prof. Mukesh Doble Department of Biotechnology Indian Institute of Technology, Madras Lecture - 05 Normal Distribution So far we have looked at discrete distributions
Standardized Data Percentiles, Quartiles and Box Plots Grouped Data Skewness and Kurtosis
 Descriptive Statistics (Part 2) 4 Chapter Percentiles, Quartiles and Box Plots Grouped Data Skewness and Kurtosis McGraw-Hill/Irwin Copyright 2009 by The McGraw-Hill Companies, Inc. Chebyshev s Theorem
σ e, which will be large when prediction errors are Linear regression model
 Linear regression model we assume that two quantitative variables, x and y, are linearly related; that is, the population of (x, y) pairs are related by an ideal population regression line y = α + βx +
1 Small Sample CI for a Population Mean µ
 Lecture 7: Small Sample Confidence Intervals Based on a Normal Population Distribution Readings: Sections 7.4-7.5 1 Small Sample CI for a Population Mean µ The large sample CI x ± z α/2 s n was constructed
The data definition file provided by the authors is reproduced below: Obs: 1500 home sales in Stockton, CA from Oct 1, 1996 to Nov 30, 1998
 Economics 312 Sample Project Report Jeffrey Parker Introduction This project is based on Exercise 2.12 on page 81 of the Hill, Griffiths, and Lim text. It examines how the sale price of houses in Stockton,
Handout 4 numerical descriptive measures part 2. Example 1. Variance and Standard Deviation for Grouped Data. mf N 535 = = 25
 Handout 4 numerical descriptive measures part Calculating Mean for Grouped Data mf Mean for population data: µ mf Mean for sample data: x n where m is the midpoint and f is the frequency of a class. Example
Lecture 6: Non Normal Distributions
 Lecture 6: Non Normal Distributions and their Uses in GARCH Modelling Prof. Massimo Guidolin 20192 Financial Econometrics Spring 2015 Overview Non-normalities in (standardized) residuals from asset return
Categorical. A general name for non-numerical data; the data is separated into categories of some kind.
 Chapter 5 Categorical A general name for non-numerical data; the data is separated into categories of some kind. Nominal data Categorical data with no implied order. Eg. Eye colours, favourite TV show,
Quantile regression and surroundings using SAS
 Appendix B Quantile regression and surroundings using SAS Introduction This appendix is devoted to the presentation of the main commands available in SAS for carrying out a complete data analysis, that
Data Analysis and Statistical Methods Statistics 651
 Data Analysis and Statistical Methods Statistics 651 http://www.stat.tamu.edu/~suhasini/teaching.html Lecture 10 (MWF) Checking for normality of the data using the QQplot Suhasini Subba Rao Checking for
STAT Chapter 6 The Standard Deviation (SD) as a Ruler and The Normal Model
 as a Ruler and The Normal Model") STAT 203 - Chapter 6 The Standard Deviation (SD) as a Ruler and The Normal Model In Chapter 5, we introduced a few measures of center and spread, and discussed how the mean and standard deviation are good
STAT 203 - Chapter 6 The Standard Deviation (SD) as a Ruler and The Normal Model In Chapter 5, we introduced a few measures of center and spread, and discussed how the mean and standard deviation are good
Rand Final Pop 2. Name: Class: Date: Multiple Choice Identify the choice that best completes the statement or answers the question.
 Name: Class: Date: Rand Final Pop 2 Multiple Choice Identify the choice that best completes the statement or answers the question. Scenario 12-1 A high school guidance counselor wonders if it is possible
Subject CS1 Actuarial Statistics 1 Core Principles. Syllabus. for the 2019 exams. 1 June 2018
 ` Subject CS1 Actuarial Statistics 1 Core Principles Syllabus for the 2019 exams 1 June 2018 Copyright in this Core Reading is the property of the Institute and Faculty of Actuaries who are the sole distributors.
appstats5.notebook September 07, 2016 Chapter 5
 Chapter 5 Describing Distributions Numerically Chapter 5 Objective: Students will be able to use statistics appropriate to the shape of the data distribution to compare of two or more different data sets.
Hypothesis Tests: One Sample Mean Cal State Northridge Ψ320 Andrew Ainsworth PhD
 Hypothesis Tests: One Sample Mean Cal State Northridge Ψ320 Andrew Ainsworth PhD MAJOR POINTS Sampling distribution of the mean revisited Testing hypotheses: sigma known An example Testing hypotheses:
Chapter 11: Inference for Distributions Inference for Means of a Population 11.2 Comparing Two Means
 Chapter 11: Inference for Distributions 11.1 Inference for Means of a Population 11.2 Comparing Two Means 1 Population Standard Deviation In the previous chapter, we computed confidence intervals and performed
Quantitative Analysis and Empirical Methods
 3) Descriptive Statistics Sciences Po, Paris, CEE / LIEPP Introduction Data and statistics Introduction to distributions Measures of central tendency Measures of dispersion Skewness Data and Statistics
Normal Probability Distributions
 Normal Probability Distributions Properties of Normal Distributions The most important probability distribution in statistics is the normal distribution. Normal curve A normal distribution is a continuous
Regression Review and Robust Regression. Slides prepared by Elizabeth Newton (MIT)
") Regression Review and Robust Regression Slides prepared by Elizabeth Newton (MIT) S-Plus Oil City Data Frame Monthly Excess Returns of Oil City Petroleum, Inc. Stocks and the Market SUMMARY: The oilcity
Regression Review and Robust Regression Slides prepared by Elizabeth Newton (MIT) S-Plus Oil City Data Frame Monthly Excess Returns of Oil City Petroleum, Inc. Stocks and the Market SUMMARY: The oilcity
Financial Time Series and Their Characteristics
 Financial Time Series and Their Characteristics Egon Zakrajšek Division of Monetary Affairs Federal Reserve Board Summer School in Financial Mathematics Faculty of Mathematics & Physics University of Ljubljana
Probability & Statistics Modular Learning Exercises
 Probability & Statistics Modular Learning Exercises About The Actuarial Foundation The Actuarial Foundation, a 501(c)(3) nonprofit organization, develops, funds and executes education, scholarship and
Variance, Standard Deviation Counting Techniques
 Variance, Standard Deviation Counting Techniques Section 1.3 & 2.1 Cathy Poliak, Ph.D. cathy@math.uh.edu Department of Mathematics University of Houston 1 / 52 Outline 1 Quartiles 2 The 1.5IQR Rule 3 Understanding
Data screening, transformations: MRC05
 Dale Berger Data screening, transformations: MRC05 This is a demonstration of data screening and transformations for a regression analysis. Our interest is in predicting current salary from education level
Measures of Variation. Section 2-5. Dotplots of Waiting Times. Waiting Times of Bank Customers at Different Banks in minutes. Bank of Providence
 Measures of Variation Section -5 1 Waiting Times of Bank Customers at Different Banks in minutes Jefferson Valley Bank 6.5 6.6 6.7 6.8 7.1 7.3 7.4 Bank of Providence 4. 5.4 5.8 6. 6.7 8.5 9.3 10.0 Mean
Chapter 7 Sampling Distributions and Point Estimation of Parameters
 Chapter 7 Sampling Distributions and Point Estimation of Parameters Part 1: Sampling Distributions, the Central Limit Theorem, Point Estimation & Estimators Sections 7-1 to 7-2 1 / 25 Statistical Inferences