Data Distributions and Normality
|
|
|
- Anna Bell
- 5 years ago
- Views:
Transcription
1 Data Distributions and Normality
2 Definition (Non)Parametric Parametric statistics assume that data come from a normal distribution, and make inferences about parameters of that distribution. These statistical tests are based on comparing the means (central tendency) of the distributions, as a function of their variability (spread). Non-parametric statistics do not depend on fitting a parameterized distribution, based on normality. These statistical tests are based on comparing the medians (50 % of data distributions) and the ranks of the observations amongst the samples.

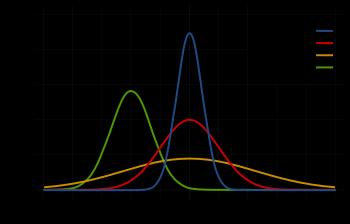
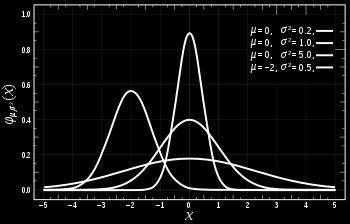
3 The Normal Distribution X ~ N (µ, σ) Every Normal Distribution can be described using only two parameters: Mean and S.D.

4 Is the Basis of Parametric Statistics 68% 96% 99% Parametric statistical methods require that numerical variables approximate a normal distribution. They compare the means & S.D.s In a normal distribution: ~ 68% observations within 1 standard deviation of mean ~ 96% within 2 standard deviations ~ 99% within 3 standard deviations
5 Non-Significant = Normal data Assessing Normality Three ways to assess the normality of the data 1) Graphical Displays Histogram, Density plot Boxplot, Q-Q Plot 2) Skewness / Kurtosis - Are they different from 0? (normal distribution) - Rule of Thumb: Too Large (> 1) or too small (< -1) 3) Shapiro Wilk Tests Tests if data differ from a normal distribution Significant = non-normal data

 Graphical")

6 Assessing Normality Three ways to assess the normality of the data 1) Graphical Displays Histogram, Density plot, Boxplot
 Graphical Displays Histogram, Density plot,")
7 Assessing Normality Three ways to assess the normality of the data 1) Graphical Displays Histogram, Density plot, Boxplot


8 Assessing Normality 1) More Graphical Displays Q-Q Plot: quantile / quantile plot compares observed data and theoretical data, from a normal distribution OPTIONS tab: Select the type and the parameters of theoretical data distribution. Default: Normal
9 Assessing Normality Q-Q Plot: quantile / quantile plot Things to Look For: How many points plotted? Are there any outliers?
10 Quantifying Distributions 2) Skewness: Distribution symmetry (skew) Skew: Measure of the symmetry of a distribution. Symmetric distributions have a skew = 0. Positive skew: the mean is larger than the median, skewness > 0 Negative skew: the mean is smaller than the median, skewness < 0
11 Quantifying Distributions 2) Kurtosis: Distribution of data in peak / tails Kurtosis: Measure of the degree to which observations cluster in the tails or the center of the distribution. Positive kurtosis: Less values in tails and more values close to mean. Leptokurtic. Negative kurtosis: More values in tails and less values close to mean. Platykurtic.
12 Assessing Normality - Example Use Normality.Example.xls Dataset (posted on class web-site) Follow along this example using Rcmdr Open Rstudio and activate Rcmdr Import dataset and start exploring
13 An Example in Estimation How old is your professor? N = 18 guesses Range = Age (yrs)
14 An Example in Estimation How old is your professor? N = 18 guesses What is the Midpoint Value = Age (yrs)
15 An Example in Estimation N = 18 guesses Mean = 39.6 Median = 39.5 S.D. = 3.1 value frequency sum 18 relative frequency
16 An Example in Estimation N = 18 guesses 50% = % = 34 25% = 38 75% = 42 95% = 48 value sum relative freq cumulative freq


17 Data Summary with Rcmdr Summaries: - Active data set

18 Data Summary with Rcmdr Summaries: - Numerical summaries


19 Normality Test with Rcmdr Test of Normality Select data Use Shapiro-Wilk Test multiple data using by groups
20 Normality Test with Rcmdr Test of Normality: SW (Wilk Sidak) Test Null Hypothesis: Data ARE Normal Alternate Hypothesis: Data ARE NOT Normal
21 Normality Test with Rcmdr Test of Normality: SW (Wilk Sidak) Test Is this Result Significant? How Can You Tell? P value > 0.05 (alpha). Result is NOT Significant Null is not Rejected. Data ARE Normally Distributed What do you Need to Report? Test Name, Sample Size (n OR df), test statistic, p value
 Upper bound: Mean + (1.")
22 Confidence Intervals Many Tests Formulation = 95% confidence intervals Lower bound: Mean (1.96 * SE) Upper bound: Mean + (1.96 * SE) By definition: 95% of the confidence intervals (from different experiments) will overlap the real parameter µ
23 NOTE: Estimates Depend on Sample Size C.I. Formulation: Mean +/- (Z score * SE) Mean +/- (1.96 * SE) S.E. = S.D. / sqrt (n) = / (sqrt(18)) = n mean SD sqrt(n) SE 95% CI
24 NOTE: Estimates are influenced by chance Age Estimate: 39.6 years (SD = 3.1) C.I. Formulation: Mean +/- (Z score * SE) Mean +/- (1.96 * SE) S.E. = S.D. / sqrt (n) n mean SD sqrt(n) SE 95% CI lower upper Are these two samples from the same population?
25 Interpreting Confidence Intervals The (CI) is the interval that includes the estimated parameter, with a probability determined by confidence level (usually 95%). NOTE
26 Interpreting Confidence Intervals Case 1. Two samples indistinguishable. They are from same population Case 2. Two samples different. They are not from same population
27 Summary - Parametric Statistics Benefits and Costs: - Parametric methods make more assumptions than nonparametric methods. If the extra assumptions are correct, parametric methods have more statistical power (produce more accurate and precise estimates.) - However, if those assumptions are incorrect, parametric methods can be very misleading. They can cause false positives (type I errors). Thus, they are often not considered robust.
28 Summary Normality Indicators of a normal (Gaussian) distribution A. Mean = Median = Mode B. Skewness: Measures asymmetry of the distribution. A value of zero indicates symmetry. Skewness absolute value > 1 indicates non-normal skewed distribution. C. Kurtosis: Measures the distribution of mass in the distribution. A value of zero indicates a normal distribution. Kurtosis absolute value > 1 indicates non-normal unbalanced distribution.
29 Suggested Approach: Summary Approach - Use parametric tests whenever possible. -Take care to examine diagnostic statistics and to determine if extra assumptions are met. - If you are in doubt Perform the matching non-parametric test and compare results. If they agree: go with results of normal test If they disagree: what caused the disagreement
Parametric Statistics: Exploring Assumptions.
 Parametric Statistics: Exploring Assumptions http://www.pelagicos.net/classes_biometry_fa17.htm Reading - Field: Chapter 5 R Packages Used in This Chapter For this chapter, you will use the following packages:
Hypothesis Tests: One Sample Mean Cal State Northridge Ψ320 Andrew Ainsworth PhD
 Hypothesis Tests: One Sample Mean Cal State Northridge Ψ320 Andrew Ainsworth PhD MAJOR POINTS Sampling distribution of the mean revisited Testing hypotheses: sigma known An example Testing hypotheses:
Descriptive Analysis
 Descriptive Analysis HERTANTO WAHYU SUBAGIO Univariate Analysis Univariate analysis involves the examination across cases of one variable at a time. There are three major characteristics of a single variable
Overview/Outline. Moving beyond raw data. PSY 464 Advanced Experimental Design. Describing and Exploring Data The Normal Distribution
 PSY 464 Advanced Experimental Design Describing and Exploring Data The Normal Distribution 1 Overview/Outline Questions-problems? Exploring/Describing data Organizing/summarizing data Graphical presentations
9/17/2015. Basic Statistics for the Healthcare Professional. Relax.it won t be that bad! Purpose of Statistic. Objectives
 Basic Statistics for the Healthcare Professional 1 F R A N K C O H E N, M B B, M P A D I R E C T O R O F A N A L Y T I C S D O C T O R S M A N A G E M E N T, LLC Purpose of Statistic 2 Provide a numerical
Chapter 11: Inference for Distributions Inference for Means of a Population 11.2 Comparing Two Means
 Chapter 11: Inference for Distributions 11.1 Inference for Means of a Population 11.2 Comparing Two Means 1 Population Standard Deviation In the previous chapter, we computed confidence intervals and performed
Terms & Characteristics
 NORMAL CURVE Knowledge that a variable is distributed normally can be helpful in drawing inferences as to how frequently certain observations are likely to occur. NORMAL CURVE A Normal distribution: Distribution
Lectures delivered by Prof.K.K.Achary, YRC
 Lectures delivered by Prof.K.K.Achary, YRC Given a data set, we say that it is symmetric about a central value if the observations are distributed symmetrically about the central value. In symmetrically
Some Characteristics of Data
 Some Characteristics of Data Not all data is the same, and depending on some characteristics of a particular dataset, there are some limitations as to what can and cannot be done with that data. Some key
Lecture Week 4 Inspecting Data: Distributions
 Lecture Week 4 Inspecting Data: Distributions Introduction to Research Methods & Statistics 2013 2014 Hemmo Smit So next week No lecture & workgroups But Practice Test on-line (BB) Enter data for your
Fundamentals of Statistics
 CHAPTER 4 Fundamentals of Statistics Expected Outcomes Know the difference between a variable and an attribute. Perform mathematical calculations to the correct number of significant figures. Construct
Basic Procedure for Histograms
 Basic Procedure for Histograms 1. Compute the range of observations (min. & max. value) 2. Choose an initial # of classes (most likely based on the range of values, try and find a number of classes that
Two-Sample T-Test for Superiority by a Margin
 Chapter 219 Two-Sample T-Test for Superiority by a Margin Introduction This procedure provides reports for making inference about the superiority of a treatment mean compared to a control mean from data
Two-Sample T-Test for Non-Inferiority
 Chapter 198 Two-Sample T-Test for Non-Inferiority Introduction This procedure provides reports for making inference about the non-inferiority of a treatment mean compared to a control mean from data taken
The Normal Distribution
 Stat 6 Introduction to Business Statistics I Spring 009 Professor: Dr. Petrutza Caragea Section A Tuesdays and Thursdays 9:300:50 a.m. Chapter, Section.3 The Normal Distribution Density Curves So far we
Financial Econometrics (FinMetrics04) Time-series Statistics Concepts Exploratory Data Analysis Testing for Normality Empirical VaR
 Time-series Statistics Concepts Exploratory Data Analysis Testing for Normality Empirical VaR") Financial Econometrics (FinMetrics04) Time-series Statistics Concepts Exploratory Data Analysis Testing for Normality Empirical VaR Nelson Mark University of Notre Dame Fall 2017 September 11, 2017 Introduction
Financial Econometrics (FinMetrics04) Time-series Statistics Concepts Exploratory Data Analysis Testing for Normality Empirical VaR Nelson Mark University of Notre Dame Fall 2017 September 11, 2017 Introduction
2018 AAPM: Normal and non normal distributions: Why understanding distributions are important when designing experiments and analyzing data
 Statistical Failings that Keep Us All in the Dark Normal and non normal distributions: Why understanding distributions are important when designing experiments and Conflict of Interest Disclosure I have
Unit 2 Statistics of One Variable
 Unit 2 Statistics of One Variable Day 6 Summarizing Quantitative Data Summarizing Quantitative Data We have discussed how to display quantitative data in a histogram It is useful to be able to describe
Frequency Distribution and Summary Statistics
 Frequency Distribution and Summary Statistics Dongmei Li Department of Public Health Sciences Office of Public Health Studies University of Hawai i at Mānoa Outline 1. Stemplot 2. Frequency table 3. Summary
Simple Descriptive Statistics
 Simple Descriptive Statistics These are ways to summarize a data set quickly and accurately The most common way of describing a variable distribution is in terms of two of its properties: Central tendency
Copyright 2005 Pearson Education, Inc. Slide 6-1
 Copyright 2005 Pearson Education, Inc. Slide 6-1 Chapter 6 Copyright 2005 Pearson Education, Inc. Measures of Center in a Distribution 6-A The mean is what we most commonly call the average value. It is
Module Tag PSY_P2_M 7. PAPER No.2: QUANTITATIVE METHODS MODULE No.7: NORMAL DISTRIBUTION
 Subject Paper No and Title Module No and Title Paper No.2: QUANTITATIVE METHODS Module No.7: NORMAL DISTRIBUTION Module Tag PSY_P2_M 7 TABLE OF CONTENTS 1. Learning Outcomes 2. Introduction 3. Properties
KARACHI UNIVERSITY BUSINESS SCHOOL UNIVERSITY OF KARACHI BS (BBA) VI
 VI") 88 P a g e B S ( B B A ) S y l l a b u s KARACHI UNIVERSITY BUSINESS SCHOOL UNIVERSITY OF KARACHI BS (BBA) VI Course Title : STATISTICS Course Number : BA(BS) 532 Credit Hours : 03 Course 1. Statistical
88 P a g e B S ( B B A ) S y l l a b u s KARACHI UNIVERSITY BUSINESS SCHOOL UNIVERSITY OF KARACHI BS (BBA) VI Course Title : STATISTICS Course Number : BA(BS) 532 Credit Hours : 03 Course 1. Statistical
Key Objectives. Module 2: The Logic of Statistical Inference. Z-scores. SGSB Workshop: Using Statistical Data to Make Decisions
 SGSB Workshop: Using Statistical Data to Make Decisions Module 2: The Logic of Statistical Inference Dr. Tom Ilvento January 2006 Dr. Mugdim Pašić Key Objectives Understand the logic of statistical inference
Lecture 2 Describing Data
 Lecture 2 Describing Data Thais Paiva STA 111 - Summer 2013 Term II July 2, 2013 Lecture Plan 1 Types of data 2 Describing the data with plots 3 Summary statistics for central tendency and spread 4 Histograms
GGraph. Males Only. Premium. Experience. GGraph. Gender. 1 0: R 2 Linear = : R 2 Linear = Page 1
 GGraph 9 Gender : R Linear =.43 : R Linear =.769 8 7 6 5 4 3 5 5 Males Only GGraph Page R Linear =.43 R Loess 9 8 7 6 5 4 5 5 Explore Case Processing Summary Cases Valid Missing Total N Percent N Percent
E.D.A. Exploratory Data Analysis E.D.A. Steps for E.D.A. Greg C Elvers, Ph.D.
 E.D.A. Greg C Elvers, Ph.D. 1 Exploratory Data Analysis One of the most important steps in analyzing data is to look at the raw data This allows you to: find observations that may be incorrect quickly
Analysis of 2x2 Cross-Over Designs using T-Tests for Non-Inferiority
 Chapter 235 Analysis of 2x2 Cross-Over Designs using -ests for Non-Inferiority Introduction his procedure analyzes data from a two-treatment, two-period (2x2) cross-over design where the goal is to demonstrate
MATHEMATICS APPLIED TO BIOLOGICAL SCIENCES MVE PA 07. LP07 DESCRIPTIVE STATISTICS - Calculating of statistical indicators (1)
") LP07 DESCRIPTIVE STATISTICS - Calculating of statistical indicators (1) Descriptive statistics are ways of summarizing large sets of quantitative (numerical) information. The best way to reduce a set of
LP07 DESCRIPTIVE STATISTICS - Calculating of statistical indicators (1) Descriptive statistics are ways of summarizing large sets of quantitative (numerical) information. The best way to reduce a set of
Chapter 3. Numerical Descriptive Measures. Copyright 2016 Pearson Education, Ltd. Chapter 3, Slide 1
 Chapter 3 Numerical Descriptive Measures Copyright 2016 Pearson Education, Ltd. Chapter 3, Slide 1 Objectives In this chapter, you learn to: Describe the properties of central tendency, variation, and
Valid Missing Total. N Percent N Percent N Percent , ,0% 0,0% 2 100,0% 1, ,0% 0,0% 2 100,0% 2, ,0% 0,0% 5 100,0%
 dimension1 GET FILE= validacaonestscoremédico.sav' (só com os 59 doentes) /COMPRESSED. SORT CASES BY UMcpEVA (D). EXAMINE VARIABLES=UMcpEVA BY NoRespostasSignif /PLOT BOXPLOT HISTOGRAM NPPLOT /COMPARE
A LEVEL MATHEMATICS ANSWERS AND MARKSCHEMES SUMMARY STATISTICS AND DIAGRAMS. 1. a) 45 B1 [1] b) 7 th value 37 M1 A1 [2]
![A LEVEL MATHEMATICS ANSWERS AND MARKSCHEMES SUMMARY STATISTICS AND DIAGRAMS. 1. a) 45 B1 [1] b) 7 th value 37 M1 A1 [2]](/thumbs/81/83043398.jpg "A LEVEL MATHEMATICS ANSWERS AND MARKSCHEMES SUMMARY STATISTICS AND DIAGRAMS. 1. a) 45 B1 [1] b) 7 th value 37 M1 A1 [2]") 1. a) 45 [1] b) 7 th value 37 [] n c) LQ : 4 = 3.5 4 th value so LQ = 5 3 n UQ : 4 = 9.75 10 th value so UQ = 45 IQR = 0 f.t. d) Median is closer to upper quartile Hence negative skew [] Page 1 . a) Orders
1. a) 45 [1] b) 7 th value 37 [] n c) LQ : 4 = 3.5 4 th value so LQ = 5 3 n UQ : 4 = 9.75 10 th value so UQ = 45 IQR = 0 f.t. d) Median is closer to upper quartile Hence negative skew [] Page 1 . a) Orders
NCSS Statistical Software. Reference Intervals
 Chapter 586 Introduction A reference interval contains the middle 95% of measurements of a substance from a healthy population. It is a type of prediction interval. This procedure calculates one-, and
Introduction to Descriptive Statistics
 Introduction to Descriptive Statistics 17.871 Types of Variables ~Nominal (Quantitative) Nominal (Qualitative) categorical Ordinal Interval or ratio Describing data Moment Non-mean based measure Center
Describing Uncertain Variables
 Describing Uncertain Variables L7 Uncertainty in Variables Uncertainty in concepts and models Uncertainty in variables Lack of precision Lack of knowledge Variability in space/time Describing Uncertainty
David Tenenbaum GEOG 090 UNC-CH Spring 2005
 Simple Descriptive Statistics Review and Examples You will likely make use of all three measures of central tendency (mode, median, and mean), as well as some key measures of dispersion (standard deviation,
Statistics I Chapter 2: Analysis of univariate data
 Statistics I Chapter 2: Analysis of univariate data Numerical summary Central tendency Location Spread Form mean quartiles range coeff. asymmetry median percentiles interquartile range coeff. kurtosis
Exploratory Data Analysis (EDA)
") Exploratory Data Analysis (EDA) Introduction A Need to Explore Your Data The first step of data analysis should always be a detailed examination of the data. The examination of your data is called Exploratory
Exploratory Data Analysis (EDA) Introduction A Need to Explore Your Data The first step of data analysis should always be a detailed examination of the data. The examination of your data is called Exploratory
Descriptive Statistics
 Petra Petrovics Descriptive Statistics 2 nd seminar DESCRIPTIVE STATISTICS Definition: Descriptive statistics is concerned only with collecting and describing data Methods: - statistical tables and graphs
Web Science & Technologies University of Koblenz Landau, Germany. Lecture Data Science. Statistics and Probabilities JProf. Dr.
 Web Science & Technologies University of Koblenz Landau, Germany Lecture Data Science Statistics and Probabilities JProf. Dr. Claudia Wagner Data Science Open Position @GESIS Student Assistant Job in Data
1 Exercise One. 1.1 Calculate the mean ROI. Note that the data is not grouped! Below you find the raw data in tabular form:
 1 Exercise One Note that the data is not grouped! 1.1 Calculate the mean ROI Below you find the raw data in tabular form: Obs Data 1 18.5 2 18.6 3 17.4 4 12.2 5 19.7 6 5.6 7 7.7 8 9.8 9 19.9 10 9.9 11
Introduction to Statistical Data Analysis II
 Introduction to Statistical Data Analysis II JULY 2011 Afsaneh Yazdani Preface Major branches of Statistics: - Descriptive Statistics - Inferential Statistics Preface What is Inferential Statistics? Preface
Statistical Intervals. Chapter 7 Stat 4570/5570 Material from Devore s book (Ed 8), and Cengage
, and Cengage") 7 Statistical Intervals Chapter 7 Stat 4570/5570 Material from Devore s book (Ed 8), and Cengage Confidence Intervals The CLT tells us that as the sample size n increases, the sample mean X is close to
7 Statistical Intervals Chapter 7 Stat 4570/5570 Material from Devore s book (Ed 8), and Cengage Confidence Intervals The CLT tells us that as the sample size n increases, the sample mean X is close to
Lecture 1: Review and Exploratory Data Analysis (EDA)
") Lecture 1: Review and Exploratory Data Analysis (EDA) Ani Manichaikul amanicha@jhsph.edu 16 April 2007 1 / 40 Course Information I Office hours For questions and help When? I ll announce this tomorrow
Lecture 1: Review and Exploratory Data Analysis (EDA) Ani Manichaikul amanicha@jhsph.edu 16 April 2007 1 / 40 Course Information I Office hours For questions and help When? I ll announce this tomorrow
DATA SUMMARIZATION AND VISUALIZATION
 APPENDIX DATA SUMMARIZATION AND VISUALIZATION PART 1 SUMMARIZATION 1: BUILDING BLOCKS OF DATA ANALYSIS 294 PART 2 PART 3 PART 4 VISUALIZATION: GRAPHS AND TABLES FOR SUMMARIZING AND ORGANIZING DATA 296
Week 1 Variables: Exploration, Familiarisation and Description. Descriptive Statistics.
 Week 1 Variables: Exploration, Familiarisation and Description. Descriptive Statistics. Convergent validity: the degree to which results/evidence from different tests/sources, converge on the same conclusion.
2 DESCRIPTIVE STATISTICS
 Chapter 2 Descriptive Statistics 47 2 DESCRIPTIVE STATISTICS Figure 2.1 When you have large amounts of data, you will need to organize it in a way that makes sense. These ballots from an election are rolled
MEASURES OF CENTRAL TENDENCY & VARIABILITY + NORMAL DISTRIBUTION
 MEASURES OF CENTRAL TENDENCY & VARIABILITY + NORMAL DISTRIBUTION 1 Day 3 Summer 2017.07.31 DISTRIBUTION Symmetry Modality 单峰, 双峰 Skewness 正偏或负偏 Kurtosis 2 3 CHAPTER 4 Measures of Central Tendency 集中趋势
1) 3 points Which of the following is NOT a measure of central tendency? a) Median b) Mode c) Mean d) Range
 3 points Which of the following is NOT a measure of central tendency? a) Median b) Mode c) Mean d) Range") February 19, 2004 EXAM 1 : Page 1 All sections : Geaghan Read Carefully. Give an answer in the form of a number or numeric expression where possible. Show all calculations. Use a value of 0.05 for any
February 19, 2004 EXAM 1 : Page 1 All sections : Geaghan Read Carefully. Give an answer in the form of a number or numeric expression where possible. Show all calculations. Use a value of 0.05 for any
2 Exploring Univariate Data
 2 Exploring Univariate Data A good picture is worth more than a thousand words! Having the data collected we examine them to get a feel for they main messages and any surprising features, before attempting
Lecture Data Science
 Web Science & Technologies University of Koblenz Landau, Germany Lecture Data Science Statistics Foundations JProf. Dr. Claudia Wagner Learning Goals How to describe sample data? What is mode/median/mean?
Confidence Interval and Hypothesis Testing: Exercises and Solutions
 Confidence Interval and Hypothesis Testing: Exercises and Solutions You can use the graphical representation of the normal distribution to solve the problems. Exercise 1: Confidence Interval A sample of
CSC Advanced Scientific Programming, Spring Descriptive Statistics
 CSC 223 - Advanced Scientific Programming, Spring 2018 Descriptive Statistics Overview Statistics is the science of collecting, organizing, analyzing, and interpreting data in order to make decisions.
IOP 201-Q (Industrial Psychological Research) Tutorial 5
 Tutorial 5") IOP 201-Q (Industrial Psychological Research) Tutorial 5 TRUE/FALSE [1 point each] Indicate whether the sentence or statement is true or false. 1. To establish a cause-and-effect relation between two variables,
IOP 201-Q (Industrial Psychological Research) Tutorial 5 TRUE/FALSE [1 point each] Indicate whether the sentence or statement is true or false. 1. To establish a cause-and-effect relation between two variables,
SPSS I: Menu Basics Practice Exercises Target Software & Version: SPSS V Last Updated on January 17, 2007 Created by Jennifer Ortman
 SPSS I: Menu Basics Practice Exercises Target Software & Version: SPSS V. 14.02 Last Updated on January 17, 2007 Created by Jennifer Ortman PRACTICE EXERCISES Exercise A Obtain descriptive statistics (mean,
On Some Test Statistics for Testing the Population Skewness and Kurtosis: An Empirical Study
 Florida International University FIU Digital Commons FIU Electronic Theses and Dissertations University Graduate School 8-26-2016 On Some Test Statistics for Testing the Population Skewness and Kurtosis:
Chapter 6. y y. Standardizing with z-scores. Standardizing with z-scores (cont.)
") Starter Ch. 6: A z-score Analysis Starter Ch. 6 Your Statistics teacher has announced that the lower of your two tests will be dropped. You got a 90 on test 1 and an 85 on test 2. You re all set to drop
Starter Ch. 6: A z-score Analysis Starter Ch. 6 Your Statistics teacher has announced that the lower of your two tests will be dropped. You got a 90 on test 1 and an 85 on test 2. You re all set to drop
Establishing a framework for statistical analysis via the Generalized Linear Model
 PSY349: Lecture 1: INTRO & CORRELATION Establishing a framework for statistical analysis via the Generalized Linear Model GLM provides a unified framework that incorporates a number of statistical methods
Quantitative Analysis and Empirical Methods
 3) Descriptive Statistics Sciences Po, Paris, CEE / LIEPP Introduction Data and statistics Introduction to distributions Measures of central tendency Measures of dispersion Skewness Data and Statistics
chapter 2-3 Normal Positive Skewness Negative Skewness
 chapter 2-3 Testing Normality Introduction In the previous chapters we discussed a variety of descriptive statistics which assume that the data are normally distributed. This chapter focuses upon testing
Measures of Central tendency
 Elementary Statistics Measures of Central tendency By Prof. Mirza Manzoor Ahmad In statistics, a central tendency (or, more commonly, a measure of central tendency) is a central or typical value for a
Normal Probability Distributions
 Normal Probability Distributions Properties of Normal Distributions The most important probability distribution in statistics is the normal distribution. Normal curve A normal distribution is a continuous
Handout 4 numerical descriptive measures part 2. Example 1. Variance and Standard Deviation for Grouped Data. mf N 535 = = 25
 Handout 4 numerical descriptive measures part Calculating Mean for Grouped Data mf Mean for population data: µ mf Mean for sample data: x n where m is the midpoint and f is the frequency of a class. Example
Previously, when making inferences about the population mean, μ, we were assuming the following simple conditions:
 Chapter 17 Inference about a Population Mean Conditions for inference Previously, when making inferences about the population mean, μ, we were assuming the following simple conditions: (1) Our data (observations)
MEASURES OF DISPERSION, RELATIVE STANDING AND SHAPE. Dr. Bijaya Bhusan Nanda,
 MEASURES OF DISPERSION, RELATIVE STANDING AND SHAPE Dr. Bijaya Bhusan Nanda, CONTENTS What is measures of dispersion? Why measures of dispersion? How measures of dispersions are calculated? Range Quartile
Honor Code: By signing my name below, I pledge my honor that I have not violated the Booth Honor Code during this examination.
 Name: OUTLINE SOLUTIONS University of Chicago Graduate School of Business Business 41000: Business Statistics Special Notes: 1. This is a closed-book exam. You may use an 8 11 piece of paper for the formulas.
DESCRIBING DATA: MESURES OF LOCATION
 DESCRIBING DATA: MESURES OF LOCATION A. Measures of Central Tendency Measures of Central Tendency are used to pinpoint the center or average of a data set which can then be used to represent the typical
The Two-Sample Independent Sample t Test
 Department of Psychology and Human Development Vanderbilt University 1 Introduction 2 3 The General Formula The Equal-n Formula 4 5 6 Independence Normality Homogeneity of Variances 7 Non-Normality Unequal
SPSS t tests (and NP Equivalent)
") SPSS t tests (and NP Equivalent) Descriptive Statistics To get all the descriptive statistics you need: Analyze > Descriptive Statistics>Explore. Enter the IV into the Factor list and the DV into the Dependent
SPSS t tests (and NP Equivalent) Descriptive Statistics To get all the descriptive statistics you need: Analyze > Descriptive Statistics>Explore. Enter the IV into the Factor list and the DV into the Dependent
1. Variability in estimates and CLT
 Unit3: Foundationsforinference 1. Variability in estimates and CLT Sta 101 - Fall 2015 Duke University, Department of Statistical Science Dr. Çetinkaya-Rundel Slides posted at http://bit.ly/sta101_f15
DESCRIPTIVE STATISTICS
 DESCRIPTIVE STATISTICS INTRODUCTION Numbers and quantification offer us a very special language which enables us to express ourselves in exact terms. This language is called Mathematics. We will now learn
LAB 2 INSTRUCTIONS PROBABILITY DISTRIBUTIONS IN EXCEL
 LAB 2 INSTRUCTIONS PROBABILITY DISTRIBUTIONS IN EXCEL There is a wide range of probability distributions (both discrete and continuous) available in Excel. They can be accessed through the Insert Function
Chapter 3: Displaying and Describing Quantitative Data Quiz A Name
 Chapter 3: Displaying and Describing Quantitative Data Quiz A Name 3.1.1 Find summary statistics; create displays; describe distributions; determine 1. Following is a histogram of salaries (in $) for a
MAS1403. Quantitative Methods for Business Management. Semester 1, Module leader: Dr. David Walshaw
 MAS1403 Quantitative Methods for Business Management Semester 1, 2018 2019 Module leader: Dr. David Walshaw Additional lecturers: Dr. James Waldren and Dr. Stuart Hall Announcements: Written assignment
Standardized Data Percentiles, Quartiles and Box Plots Grouped Data Skewness and Kurtosis
 Descriptive Statistics (Part 2) 4 Chapter Percentiles, Quartiles and Box Plots Grouped Data Skewness and Kurtosis McGraw-Hill/Irwin Copyright 2009 by The McGraw-Hill Companies, Inc. Chebyshev s Theorem
Engineering Mathematics III. Moments
 Moments Mean and median Mean value (centre of gravity) f(x) x f (x) x dx Median value (50th percentile) F(x med ) 1 2 P(x x med ) P(x x med ) 1 0 F(x) x med 1/2 x x Variance and standard deviation
Chapter 7. Inferences about Population Variances
 Chapter 7. Inferences about Population Variances Introduction () The variability of a population s values is as important as the population mean. Hypothetical distribution of E. coli concentrations from
Math 2311 Bekki George Office Hours: MW 11am to 12:45pm in 639 PGH Online Thursdays 4-5:30pm And by appointment
 Math 2311 Bekki George bekki@math.uh.edu Office Hours: MW 11am to 12:45pm in 639 PGH Online Thursdays 4-5:30pm And by appointment Class webpage: http://www.math.uh.edu/~bekki/math2311.html Math 2311 Class
Moments and Measures of Skewness and Kurtosis
 Moments and Measures of Skewness and Kurtosis Moments The term moment has been taken from physics. The term moment in statistical use is analogous to moments of forces in physics. In statistics the values
The Mode: An Example. The Mode: An Example. Measure of Central Tendency: The Mode. Measure of Central Tendency: The Median
 Chapter 4: What is a measure of Central Tendency? Numbers that describe what is typical of the distribution You can think of this value as where the middle of a distribution lies (the median). or The value
Statistics & Statistical Tests: Assumptions & Conclusions
 Degrees of Freedom Statistics & Statistical Tests: Assumptions & Conclusions Kinds of degrees of freedom Kinds of Distributions Kinds of Statistics & assumptions required to perform each Normal Distributions
Lecture 6: Non Normal Distributions
 Lecture 6: Non Normal Distributions and their Uses in GARCH Modelling Prof. Massimo Guidolin 20192 Financial Econometrics Spring 2015 Overview Non-normalities in (standardized) residuals from asset return
Chapter 8 Estimation
 Chapter 8 Estimation There are two important forms of statistical inference: estimation (Confidence Intervals) Hypothesis Testing Statistical Inference drawing conclusions about populations based on samples
Statistical Analysis of Data from the Stock Markets. UiO-STK4510 Autumn 2015
 Statistical Analysis of Data from the Stock Markets UiO-STK4510 Autumn 2015 Sampling Conventions We observe the price process S of some stock (or stock index) at times ft i g i=0,...,n, we denote it by
Tutorial 1. Review of Basic Statistics
 Tutorial 1 Review of Basic Statistics While we assume that readers will have had at least one prior course in statistics, it may be helpful for some to have a review of some basic concepts, if only to
One sample z-test and t-test
 One sample z-test and t-test January 30, 2017 psych10.stanford.edu Announcements / Action Items Install ISI package (instructions in Getting Started with R) Assessment Problem Set #3 due Tu 1/31 at 7 PM
A continuous random variable is one that can theoretically take on any value on some line interval. We use f ( x)
") Section 6-2 I. Continuous Probability Distributions A continuous random variable is one that can theoretically take on any value on some line interval. We use f ( x) to represent a probability density
Section 6-2 I. Continuous Probability Distributions A continuous random variable is one that can theoretically take on any value on some line interval. We use f ( x) to represent a probability density
Mean GMM. Standard error
 Table 1 Simple Wavelet Analysis for stocks in the S&P 500 Index as of December 31 st 1998 ^ Shapiro- GMM Normality 6 0.9664 0.00281 11.36 4.14 55 7 0.9790 0.00300 56.58 31.69 45 8 0.9689 0.00319 403.49
Exploring Data and Graphics
 Exploring Data and Graphics Rick White Department of Statistics, UBC Graduate Pathways to Success Graduate & Postdoctoral Studies November 13, 2013 Outline Summarizing Data Types of Data Visualizing Data
Power of t-test for Simple Linear Regression Model with Non-normal Error Distribution: A Quantile Function Distribution Approach
 Available Online Publications J. Sci. Res. 4 (3), 609-622 (2012) JOURNAL OF SCIENTIFIC RESEARCH www.banglajol.info/index.php/jsr of t-test for Simple Linear Regression Model with Non-normal Error Distribution:
Measures of Dispersion (Range, standard deviation, standard error) Introduction
 Introduction") Measures of Dispersion (Range, standard deviation, standard error) Introduction We have already learnt that frequency distribution table gives a rough idea of the distribution of the variables in a sample
Measures of Dispersion (Range, standard deviation, standard error) Introduction We have already learnt that frequency distribution table gives a rough idea of the distribution of the variables in a sample
Monte Carlo Simulation (Random Number Generation)
") Monte Carlo Simulation (Random Number Generation) Revised: 10/11/2017 Summary... 1 Data Input... 1 Analysis Options... 6 Summary Statistics... 6 Box-and-Whisker Plots... 7 Percentiles... 9 Quantile Plots...
Monte Carlo Simulation (Random Number Generation) Revised: 10/11/2017 Summary... 1 Data Input... 1 Analysis Options... 6 Summary Statistics... 6 Box-and-Whisker Plots... 7 Percentiles... 9 Quantile Plots...
Measures of Central Tendency: Ungrouped Data. Mode. Median. Mode -- Example. Median: Example with an Odd Number of Terms
 Measures of Central Tendency: Ungrouped Data Measures of central tendency yield information about particular places or locations in a group of numbers. Common Measures of Location Mode Median Percentiles
Measures of Variation. Section 2-5. Dotplots of Waiting Times. Waiting Times of Bank Customers at Different Banks in minutes. Bank of Providence
 Measures of Variation Section -5 1 Waiting Times of Bank Customers at Different Banks in minutes Jefferson Valley Bank 6.5 6.6 6.7 6.8 7.1 7.3 7.4 Bank of Providence 4. 5.4 5.8 6. 6.7 8.5 9.3 10.0 Mean
Table of Contents. New to the Second Edition... Chapter 1: Introduction : Social Research...
 iii Table of Contents Preface... xiii Purpose... xiii Outline of Chapters... xiv New to the Second Edition... xvii Acknowledgements... xviii Chapter 1: Introduction... 1 1.1: Social Research... 1 Introduction...
CHAPTER 6. ' From the table the z value corresponding to this value Z = 1.96 or Z = 1.96 (d) P(Z >?) =
 P(Z >?) =") Solutions to End-of-Section and Chapter Review Problems 225 CHAPTER 6 6.1 (a) P(Z < 1.20) = 0.88493 P(Z > 1.25) = 1 0.89435 = 0.10565 P(1.25 < Z < 1.70) = 0.95543 0.89435 = 0.06108 (d) P(Z < 1.25) or Z
Solutions to End-of-Section and Chapter Review Problems 225 CHAPTER 6 6.1 (a) P(Z < 1.20) = 0.88493 P(Z > 1.25) = 1 0.89435 = 0.10565 P(1.25 < Z < 1.70) = 0.95543 0.89435 = 0.06108 (d) P(Z < 1.25) or Z
SOLUTIONS TO THE LAB 1 ASSIGNMENT
 SOLUTIONS TO THE LAB 1 ASSIGNMENT Question 1 Excel produces the following histogram of pull strengths for the 100 resistors: 2 20 Histogram of Pull Strengths (lb) Frequency 1 10 0 9 61 63 6 67 69 71 73
starting on 5/1/1953 up until 2/1/2017.
 An Actuary s Guide to Financial Applications: Examples with EViews By William Bourgeois An actuary is a business professional who uses statistics to determine and analyze risks for companies. In this guide,
MODELLING OF INCOME AND WAGE DISTRIBUTION USING THE METHOD OF L-MOMENTS OF PARAMETER ESTIMATION
 International Days of Statistics and Economics, Prague, September -3, MODELLING OF INCOME AND WAGE DISTRIBUTION USING THE METHOD OF L-MOMENTS OF PARAMETER ESTIMATION Diana Bílková Abstract Using L-moments
Lecture 9 - Sampling Distributions and the CLT
 Lecture 9 - Sampling Distributions and the CLT Sta102/BME102 Colin Rundel September 23, 2015 1 Variability of Estimates Activity Sampling distributions - via simulation Sampling distributions - via CLT