Web Science & Technologies University of Koblenz Landau, Germany. Lecture Data Science. Statistics and Probabilities JProf. Dr.
|
|
|
- James Derrick Blair
- 5 years ago
- Views:
Transcription

1 Web Science & Technologies University of Koblenz Landau, Germany Lecture Data Science Statistics and Probabilities JProf. Dr. Claudia Wagner
2 Data Science Open Student Assistant Job in Data Science at GESIS in Cologne Requirements: Good programming skills in python Some data mining experience Be able to work on a Unix Server Payment: 11,64 EUR per Hour 8-20 hours per week are possible If interested, send me an with CV and transcript of records Claudia Wagner 2
3 Exam WED pm E011 WED pm D018 Claudia Wagner 3
4 Science Science is an evolutionary process which possibly allows us to gain knowledge about the world. Lets assume we have a question: Do first babies arrive later than other babies? How can we answer it scientifically? Collect data e.g. via a survey Analyze data using statistics Chapter 1, Think Stats Claudia Wagner 6
5 Science We test our hypothesis by creating a null-hypothesis which would falsify our hypothesis if it was true. Then we try to reject the null hypothesis (with a certain probability). If our hypothesis is true, we will be able to reject the null hypothesis in most experiments Example My hypothesis: First babies arrive later than other babies Null hypothesis: First babies arrive at the same time or earlier than other babies Claudia Wagner 7
6 Where do hypothesis come from? Theory (deduction) Observations (induction) Claudia Wagner 8

7 Claudia Wagner 9
8 WHAT SKILLS DO DATA SCIENTISTS NEED? Claudia Wagner 11

9 Data Science Claudia Wagner 12
10 Definition A data scientist is someone who knows more statistics than a computer scientist and more computer science than a statistician. - Josh Blumenstock Skills needed Statistics, machine learning, ability to handle big data Scientific curiosity & methodology, story telling, creativity, visualization skills and so on Claudia Wagner 13
11 What will you learn? Statistics & Probability Theory Descriptive Statistic Probability Theory Bayesian versus Frequentist thinking Statistical Inference Causal Inference Probabilistic Graphical Models Data Collection Methods Visualizing Data, Interpretations and Data Story Telling Claudia Wagner 15
12 Last Time Compare pregnancy length for first babies and later babies Claudia Wagner 16
13 Mode Applies to nominals already! Can be used for all types of data. The mode is the value that appears most often in a set of data. What is the mode of X = [17, 19, 20, 21, 22, 23, 23, 23, 23] Claudia Wagner 17
14 Mean (expected value) Applies to interval scales and ratios: Example: X = [17, 19, 20, 21, 22, 23, 23, 23, 23, 25] Claudia Wagner 18
15 Median X = [17, 19, 20, 21, 22, 23, 23, 23, 23, 25] Median of X is 22.5 X = [17, 19, 20, 21, 22, 23, 23, 23, 23] Median of X is 22 Median is useful for skewed distribution where mean is meaningless Applies to ordinals, intervals and ratios Claudia Wagner 19
16 Variance and Standard Deviation Variance = Standard Deviation is just the square root of variance Claudia Wagner 20
17 Mode, median, mean two log-normal distributions; Claudia Wagner 21
18 Probability Mass Function (PMF) Transform absolute frequencies into normalized ones (probabilities) Claudia Wagner 22

19 Limits of PMF PMFs work well if the number of values is small. As the number of values increases, the probability associated with each value gets smaller and the effect of random noise increases. Chapter 3, Think Stats Claudia Wagner 23
20 Solutions Choose different visualization techniques Boxplot Cumulative Distribution Function (CDF) Claudia Wagner 24
21 Percentile Claudia Wagner 25
22 Boxplots IQR = Q 3 Q 1 Outliers are usually 3 IQR or more above the third quartile or 3 IQR or more below the first quartile. Image: Claudia Wagner 26
23 Cumulative Distribution Function (CDF) To find CDF(x) for a particular value of x, we compute the fraction of the values in the sample that are less than (or equal to) x. Claudia Wagner 28 Chapter 3, Think Stats
24 CDF Why are CDFs useful? We overcome the binning issue by grouping all values equal or lower x We can easily answer the following questions: What is the probability of observing a value of x or lower? Given a probability p, computes the corresponding value, x; that is, the inverse CDF of p. Claudia Wagner 29
25 Shape of Distribution Skewness quantifies how symmetrical a distribution is. A symmetrical distribution has a skewness of zero. Negative values for the skewness indicate data is skewed left. Positive values for the skewness indicate data is skewed right. Skewness < 0 Left skew skewness=0 Skewness > 0 Right skew Claudia Wagner 32
26 Kurtosis Kurtosis quantifies how peaky a distribution is compared to a normal distribution A normal distribution has a kurtosis of 3. A flatter distribution has a negative kurtosis, A distribution more peaked than a Normal distribution has a positive kurtosis. - 3 kurtosis<0 kurtosis=0 kurtosis>0 Claudia Wagner 34
27 Normal Distribution More peaky than normal distribution! Positive Kurtosis! Claudia Wagner 35
28 Normal Distribution Flatter than normal distribution! Neg. Kurtosis! Slight left skew! But almost normal. Claudia Wagner 36
29 Normal Distribution Flatter than normal distribution! Neg. Kurtosis! Left skew! But almost normal. Claudia Wagner 37
30 Normal Distribution Flatter than normal distribution! Neg. Kurtosis! Slight right skew! Pos. Skewness! Claudia Wagner 38

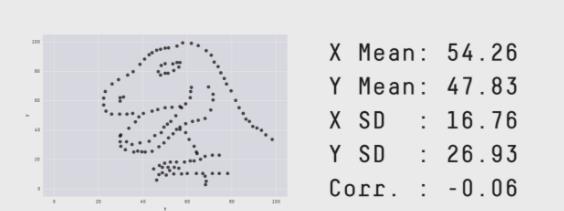
31 Statistics src: Claudia Wagner 40
32 Statistics Simulation Population Probability Sample Descriptive Statistics Sample mean is called sample statistic Population mean is called parameter Inference Find good estimator Claudia Wagner 41
33 Most of the time we do not know the parameter of the true distribution that generated our sample data 1. But we can estimate the parameter from the observed sample data Inference! If we observe 5 times head in 6 coin tosses what was the parameter p of the coin? What is out best guess for p? How uncertain are we? 2. And we can test hypothesis about the parameter If we observe 5 times head in 6 coin tosses what is the probability that the coin was fair? Claudia Wagner 42
34 PARAMETER ESTIMATION Claudia Wagner 43
35 I flip a coin twice. What will come up next? Claudia Wagner 44
36 I flip a coin 100 times. What will come up next? Claudia Wagner 45

37 I flip a coin 100 times. 52 heads and 48 tails.what will come up next? P(head)=52/100 But confidence is low Claudia Wagner 46
38 Confidence Confidence in our parameter estimates depends upon two things Size of sample (e.g., 100 versus 2) Variance of sample (e.g., all heads versus 52 heads) As the variance grows, we need larger samples to have the same degree of confidence Claudia Wagner 47
39 Law of Large Numbers In repeated independent tests with the same actual probability p of a particular outcome in each test, the chance that the fraction of times that outcome occurs differs from p converges to zero as the number of trials goes to infinity Claudia Wagner 51

40 Law of Large Numbers In other words: the average of the results obtained from a large number of trials should be close to the expected value, and will tend to become closer as more trials are performed. Claudia Wagner 52
41 Parameter Estimation Based on empirical observations (trials, experiments) Observe outcome of coin flips Observe survey data Based on simulations (Monte Carlo simulation) simulate data generation process (e.g. flip coins, spin roullette wheel, roll die) Point estimates and confidence intervals Claudia Wagner 53
42 HYPOTHESIS TESTING Claudia Wagner 54

43 Hypothesis Testing Example: my hypothesis is that the coin is unfair (p!=0.5). We create a null-hypothesis which would falsify our hypothesis if it was true. H0: p=0.5 Can I reject H0? Claudia Wagner 55
44 Hypothesis testing When can we reject H0? Distribution of outcomes of a Bernoulli random variable follows a binomial distribution with parameter p and n Claudia Wagner 56


45 Bernoulli Random Variable Binary Outcome Probability Mass Function Bernoulli Distribution has only one parameter p=0.6 Claudia Wagner 57
46 Bernoulli distribution with parameter p describes the probability distribution of a binary random variable (e.g., success/failure, yes/no, head/tail, red/not-red) Binomial distribution with parameters n and p is the discrete probability distribution of the number of successes in a sequence of n independent Bernoulli experiments (i.e., binary outcomes) Claudia Wagner 58
47 Single experiment: toss coin multiple times Repeat experiment n times PMF of the Binomial distribution defines the probability that you have k successes within n trails: Probability of observing 3 heads when we toss a fair coin 4 times? Claudia Wagner 59
48 Binomial Coefficient Number of ways to choose an (unordered) subset of k elements from a set of n elements Number of outcomes that give 3 heads = 4!/(3!*1!) = 4 4/16= 0.25 Claudia Wagner 60
49 Example Probability of observing 3 heads when we toss a fair coin 4 times: 4!/(3! 1!) = 0.25 Claudia Wagner 61
50 What is the probability of observing 3 heads when we toss the coin 4 times? #favorable outcome #all outcomes Claudia Wagner 62
51 Example One Experiment: Toss one coin 4 times (n=4) Coin shows either head H or tail T Number of all possible outcomes (with order)? 2 4 = 16 Claudia Wagner 63
52 Discrete Random Variable X What is the probability of observing 3 heads? #favorable outcome #all outcomes Probability of observing 3 heads: 4/16= 0.25 Claudia Wagner 64
53 QUESTIONS Claudia Wagner 80
Lecture Data Science
 Web Science & Technologies University of Koblenz Landau, Germany Lecture Data Science Statistics Foundations JProf. Dr. Claudia Wagner Learning Goals How to describe sample data? What is mode/median/mean?
Week 1 Variables: Exploration, Familiarisation and Description. Descriptive Statistics.
 Week 1 Variables: Exploration, Familiarisation and Description. Descriptive Statistics. Convergent validity: the degree to which results/evidence from different tests/sources, converge on the same conclusion.
The following content is provided under a Creative Commons license. Your support
 MITOCW Recitation 6 The following content is provided under a Creative Commons license. Your support will help MIT OpenCourseWare continue to offer high quality educational resources for free. To make
Lecture 2. Probability Distributions Theophanis Tsandilas
 Lecture 2 Probability Distributions Theophanis Tsandilas Comment on measures of dispersion Why do common measures of dispersion (variance and standard deviation) use sums of squares: nx (x i ˆµ) 2 i=1
The normal distribution is a theoretical model derived mathematically and not empirically.
 Sociology 541 The Normal Distribution Probability and An Introduction to Inferential Statistics Normal Approximation The normal distribution is a theoretical model derived mathematically and not empirically.
KARACHI UNIVERSITY BUSINESS SCHOOL UNIVERSITY OF KARACHI BS (BBA) VI
 VI") 88 P a g e B S ( B B A ) S y l l a b u s KARACHI UNIVERSITY BUSINESS SCHOOL UNIVERSITY OF KARACHI BS (BBA) VI Course Title : STATISTICS Course Number : BA(BS) 532 Credit Hours : 03 Course 1. Statistical
88 P a g e B S ( B B A ) S y l l a b u s KARACHI UNIVERSITY BUSINESS SCHOOL UNIVERSITY OF KARACHI BS (BBA) VI Course Title : STATISTICS Course Number : BA(BS) 532 Credit Hours : 03 Course 1. Statistical
The Bernoulli distribution
 This work is licensed under a Creative Commons Attribution-NonCommercial-ShareAlike License. Your use of this material constitutes acceptance of that license and the conditions of use of materials on this
Prof. Thistleton MAT 505 Introduction to Probability Lecture 3
 Sections from Text and MIT Video Lecture: Sections 2.1 through 2.5 http://ocw.mit.edu/courses/electrical-engineering-and-computer-science/6-041-probabilistic-systemsanalysis-and-applied-probability-fall-2010/video-lectures/lecture-1-probability-models-and-axioms/
Data Distributions and Normality
 Data Distributions and Normality Definition (Non)Parametric Parametric statistics assume that data come from a normal distribution, and make inferences about parameters of that distribution. These statistical
TABLE OF CONTENTS - VOLUME 2
 TABLE OF CONTENTS - VOLUME 2 CREDIBILITY SECTION 1 - LIMITED FLUCTUATION CREDIBILITY PROBLEM SET 1 SECTION 2 - BAYESIAN ESTIMATION, DISCRETE PRIOR PROBLEM SET 2 SECTION 3 - BAYESIAN CREDIBILITY, DISCRETE
Business Statistics 41000: Probability 3
 Business Statistics 41000: Probability 3 Drew D. Creal University of Chicago, Booth School of Business February 7 and 8, 2014 1 Class information Drew D. Creal Email: dcreal@chicagobooth.edu Office: 404
Part V - Chance Variability
 Part V - Chance Variability Dr. Joseph Brennan Math 148, BU Dr. Joseph Brennan (Math 148, BU) Part V - Chance Variability 1 / 78 Law of Averages In Chapter 13 we discussed the Kerrich coin-tossing experiment.
2011 Pearson Education, Inc
 Statistics for Business and Economics Chapter 4 Random Variables & Probability Distributions Content 1. Two Types of Random Variables 2. Probability Distributions for Discrete Random Variables 3. The Binomial
Binomial and Normal Distributions
 Binomial and Normal Distributions Bernoulli Trials A Bernoulli trial is a random experiment with 2 special properties: The result of a Bernoulli trial is binary. Examples: Heads vs. Tails, Healthy vs.
Lecture 1: Review and Exploratory Data Analysis (EDA)
") Lecture 1: Review and Exploratory Data Analysis (EDA) Ani Manichaikul amanicha@jhsph.edu 16 April 2007 1 / 40 Course Information I Office hours For questions and help When? I ll announce this tomorrow
Lecture 1: Review and Exploratory Data Analysis (EDA) Ani Manichaikul amanicha@jhsph.edu 16 April 2007 1 / 40 Course Information I Office hours For questions and help When? I ll announce this tomorrow
Module 4: Probability
 Module 4: Probability 1 / 22 Probability concepts in statistical inference Probability is a way of quantifying uncertainty associated with random events and is the basis for statistical inference. Inference
Business Statistics 41000: Probability 4
 Business Statistics 41000: Probability 4 Drew D. Creal University of Chicago, Booth School of Business February 14 and 15, 2014 1 Class information Drew D. Creal Email: dcreal@chicagobooth.edu Office:
STAT 157 HW1 Solutions
 STAT 157 HW1 Solutions http://www.stat.ucla.edu/~dinov/courses_students.dir/10/spring/stats157.dir/ Problem 1. 1.a: (6 points) Determine the Relative Frequency and the Cumulative Relative Frequency (fill
Review for Final Exam Spring 2014 Jeremy Orloff and Jonathan Bloom
 Review for Final Exam 18.05 Spring 2014 Jeremy Orloff and Jonathan Bloom THANK YOU!!!! JON!! PETER!! RUTHI!! ERIKA!! ALL OF YOU!!!! Probability Counting Sets Inclusion-exclusion principle Rule of product
Theoretical Foundations
 Theoretical Foundations Probabilities Monia Ranalli monia.ranalli@uniroma2.it Ranalli M. Theoretical Foundations - Probabilities 1 / 27 Objectives understand the probability basics quantify random phenomena
STATISTICAL DISTRIBUTIONS AND THE CALCULATOR
 STATISTICAL DISTRIBUTIONS AND THE CALCULATOR 1. Basic data sets a. Measures of Center - Mean ( ): average of all values. Characteristic: non-resistant is affected by skew and outliers. - Median: Either
DATA SUMMARIZATION AND VISUALIZATION
 APPENDIX DATA SUMMARIZATION AND VISUALIZATION PART 1 SUMMARIZATION 1: BUILDING BLOCKS OF DATA ANALYSIS 294 PART 2 PART 3 PART 4 VISUALIZATION: GRAPHS AND TABLES FOR SUMMARIZING AND ORGANIZING DATA 296
MVE051/MSG Lecture 7
 MVE051/MSG810 2017 Lecture 7 Petter Mostad Chalmers November 20, 2017 The purpose of collecting and analyzing data Purpose: To build and select models for parts of the real world (which can be used for
A random variable (r. v.) is a variable whose value is a numerical outcome of a random phenomenon.
 is a variable whose value is a numerical outcome of a random phenomenon.") Chapter 14: random variables p394 A random variable (r. v.) is a variable whose value is a numerical outcome of a random phenomenon. Consider the experiment of tossing a coin. Define a random variable
Chapter 14: random variables p394 A random variable (r. v.) is a variable whose value is a numerical outcome of a random phenomenon. Consider the experiment of tossing a coin. Define a random variable
Statistics for IT Managers
 Statistics for IT Managers 95-796, Fall 212 Course Overview Instructor: Daniel B. Neill (neill@cs.cmu.edu) TAs: Eli (Han) Liu, Kats Sasanuma, Sriram Somanchi, Skyler Speakman, Quan Wang, Yiye Zhang (see
Introduction to Probability and Inference HSSP Summer 2017, Instructor: Alexandra Ding July 19, 2017
 Introduction to Probability and Inference HSSP Summer 2017, Instructor: Alexandra Ding July 19, 2017 Please fill out the attendance sheet! Suggestions Box: Feedback and suggestions are important to the
Point Estimation. Some General Concepts of Point Estimation. Example. Estimator quality
 Point Estimation Some General Concepts of Point Estimation Statistical inference = conclusions about parameters Parameters == population characteristics A point estimate of a parameter is a value (based
ME3620. Theory of Engineering Experimentation. Spring Chapter III. Random Variables and Probability Distributions.
 ME3620 Theory of Engineering Experimentation Chapter III. Random Variables and Probability Distributions Chapter III 1 3.2 Random Variables In an experiment, a measurement is usually denoted by a variable
Math 361. Day 8 Binomial Random Variables pages 27 and 28 Inv Do you have ESP? Inv. 1.3 Tim or Bob?
 Math 361 Day 8 Binomial Random Variables pages 27 and 28 Inv. 1.2 - Do you have ESP? Inv. 1.3 Tim or Bob? Inv. 1.1: Friend or Foe Review Is a particular study result consistent with the null model? Learning
Lecture 2 Describing Data
 Lecture 2 Describing Data Thais Paiva STA 111 - Summer 2013 Term II July 2, 2013 Lecture Plan 1 Types of data 2 Describing the data with plots 3 Summary statistics for central tendency and spread 4 Histograms
Financial Econometrics (FinMetrics04) Time-series Statistics Concepts Exploratory Data Analysis Testing for Normality Empirical VaR
 Time-series Statistics Concepts Exploratory Data Analysis Testing for Normality Empirical VaR") Financial Econometrics (FinMetrics04) Time-series Statistics Concepts Exploratory Data Analysis Testing for Normality Empirical VaR Nelson Mark University of Notre Dame Fall 2017 September 11, 2017 Introduction
Financial Econometrics (FinMetrics04) Time-series Statistics Concepts Exploratory Data Analysis Testing for Normality Empirical VaR Nelson Mark University of Notre Dame Fall 2017 September 11, 2017 Introduction
5.1 Personal Probability
 5. Probability Value Page 1 5.1 Personal Probability Although we think probability is something that is confined to math class, in the form of personal probability it is something we use to make decisions
Chapter 3. Numerical Descriptive Measures. Copyright 2016 Pearson Education, Ltd. Chapter 3, Slide 1
 Chapter 3 Numerical Descriptive Measures Copyright 2016 Pearson Education, Ltd. Chapter 3, Slide 1 Objectives In this chapter, you learn to: Describe the properties of central tendency, variation, and
DESCRIBING DATA: MESURES OF LOCATION
 DESCRIBING DATA: MESURES OF LOCATION A. Measures of Central Tendency Measures of Central Tendency are used to pinpoint the center or average of a data set which can then be used to represent the typical
Unit 5: Sampling Distributions of Statistics
 Unit 5: Sampling Distributions of Statistics Statistics 571: Statistical Methods Ramón V. León 6/12/2004 Unit 5 - Stat 571 - Ramon V. Leon 1 Definitions and Key Concepts A sample statistic used to estimate
Unit 5: Sampling Distributions of Statistics
 Unit 5: Sampling Distributions of Statistics Statistics 571: Statistical Methods Ramón V. León 6/12/2004 Unit 5 - Stat 571 - Ramon V. Leon 1 Definitions and Key Concepts A sample statistic used to estimate
Lecture 9: Plinko Probabilities, Part III Random Variables, Expected Values and Variances
 Physical Principles in Biology Biology 3550 Fall 2018 Lecture 9: Plinko Probabilities, Part III Random Variables, Expected Values and Variances Monday, 10 September 2018 c David P. Goldenberg University
Stat 20: Intro to Probability and Statistics
 Stat 20: Intro to Probability and Statistics Lecture 13: Binomial Formula Tessa L. Childers-Day UC Berkeley 14 July 2014 By the end of this lecture... You will be able to: Calculate the ways an event can
Descriptive Statistics
 Petra Petrovics Descriptive Statistics 2 nd seminar DESCRIPTIVE STATISTICS Definition: Descriptive statistics is concerned only with collecting and describing data Methods: - statistical tables and graphs
ECON Introductory Econometrics. Lecture 1: Introduction and Review of Statistics
 ECON4150 - Introductory Econometrics Lecture 1: Introduction and Review of Statistics Monique de Haan (moniqued@econ.uio.no) Stock and Watson Chapter 1-2 Lecture outline 2 What is econometrics? Course
1/2 2. Mean & variance. Mean & standard deviation
 Question # 1 of 10 ( Start time: 09:46:03 PM ) Total Marks: 1 The probability distribution of X is given below. x: 0 1 2 3 4 p(x): 0.73? 0.06 0.04 0.01 What is the value of missing probability? 0.54 0.16
Sampling Distributions and the Central Limit Theorem
 Sampling Distributions and the Central Limit Theorem February 18 Data distributions and sampling distributions So far, we have discussed the distribution of data (i.e. of random variables in our sample,
Contents Part I Descriptive Statistics 1 Introduction and Framework Population, Sample, and Observations Variables Quali
 Part I Descriptive Statistics 1 Introduction and Framework... 3 1.1 Population, Sample, and Observations... 3 1.2 Variables.... 4 1.2.1 Qualitative and Quantitative Variables.... 5 1.2.2 Discrete and Continuous
Chapter 7 Sampling Distributions and Point Estimation of Parameters
 Chapter 7 Sampling Distributions and Point Estimation of Parameters Part 1: Sampling Distributions, the Central Limit Theorem, Point Estimation & Estimators Sections 7-1 to 7-2 1 / 25 Statistical Inferences
CS145: Probability & Computing
 CS145: Probability & Computing Lecture 8: Variance of Sums, Cumulative Distribution, Continuous Variables Instructor: Eli Upfal Brown University Computer Science Figure credits: Bertsekas & Tsitsiklis,
Model Paper Statistics Objective. Paper Code Time Allowed: 20 minutes
 Model Paper Statistics Objective Intermediate Part I (11 th Class) Examination Session 2012-2013 and onward Total marks: 17 Paper Code Time Allowed: 20 minutes Note:- You have four choices for each objective
Midterm Exam III Review
 Midterm Exam III Review Dr. Joseph Brennan Math 148, BU Dr. Joseph Brennan (Math 148, BU) Midterm Exam III Review 1 / 25 Permutations and Combinations ORDER In order to count the number of possible ways
Some Characteristics of Data
 Some Characteristics of Data Not all data is the same, and depending on some characteristics of a particular dataset, there are some limitations as to what can and cannot be done with that data. Some key
Lecture 17: More on Markov Decision Processes. Reinforcement learning
 Lecture 17: More on Markov Decision Processes. Reinforcement learning Learning a model: maximum likelihood Learning a value function directly Monte Carlo Temporal-difference (TD) learning COMP-424, Lecture
9/17/2015. Basic Statistics for the Healthcare Professional. Relax.it won t be that bad! Purpose of Statistic. Objectives
 Basic Statistics for the Healthcare Professional 1 F R A N K C O H E N, M B B, M P A D I R E C T O R O F A N A L Y T I C S D O C T O R S M A N A G E M E N T, LLC Purpose of Statistic 2 Provide a numerical
Chapter 3 - Lecture 5 The Binomial Probability Distribution
 Chapter 3 - Lecture 5 The Binomial Probability October 12th, 2009 Experiment Examples Moments and moment generating function of a Binomial Random Variable Outline Experiment Examples A binomial experiment
Basic Data Analysis. Stephen Turnbull Business Administration and Public Policy Lecture 4: May 2, Abstract
 Basic Data Analysis Stephen Turnbull Business Administration and Public Policy Lecture 4: May 2, 2013 Abstract Introduct the normal distribution. Introduce basic notions of uncertainty, probability, events,
A Skewed Truncated Cauchy Logistic. Distribution and its Moments
 International Mathematical Forum, Vol. 11, 2016, no. 20, 975-988 HIKARI Ltd, www.m-hikari.com http://dx.doi.org/10.12988/imf.2016.6791 A Skewed Truncated Cauchy Logistic Distribution and its Moments Zahra
Key Objectives. Module 2: The Logic of Statistical Inference. Z-scores. SGSB Workshop: Using Statistical Data to Make Decisions
 SGSB Workshop: Using Statistical Data to Make Decisions Module 2: The Logic of Statistical Inference Dr. Tom Ilvento January 2006 Dr. Mugdim Pašić Key Objectives Understand the logic of statistical inference
Probability is the tool used for anticipating what the distribution of data should look like under a given model.
 AP Statistics NAME: Exam Review: Strand 3: Anticipating Patterns Date: Block: III. Anticipating Patterns: Exploring random phenomena using probability and simulation (20%-30%) Probability is the tool used
Econ 6900: Statistical Problems. Instructor: Yogesh Uppal
 Econ 6900: Statistical Problems Instructor: Yogesh Uppal Email: yuppal@ysu.edu Lecture Slides 4 Random Variables Probability Distributions Discrete Distributions Discrete Uniform Probability Distribution
1) 3 points Which of the following is NOT a measure of central tendency? a) Median b) Mode c) Mean d) Range
 3 points Which of the following is NOT a measure of central tendency? a) Median b) Mode c) Mean d) Range") February 19, 2004 EXAM 1 : Page 1 All sections : Geaghan Read Carefully. Give an answer in the form of a number or numeric expression where possible. Show all calculations. Use a value of 0.05 for any
February 19, 2004 EXAM 1 : Page 1 All sections : Geaghan Read Carefully. Give an answer in the form of a number or numeric expression where possible. Show all calculations. Use a value of 0.05 for any
Basic Procedure for Histograms
 Basic Procedure for Histograms 1. Compute the range of observations (min. & max. value) 2. Choose an initial # of classes (most likely based on the range of values, try and find a number of classes that
Review: Population, sample, and sampling distributions
 Review: Population, sample, and sampling distributions A population with mean µ and standard deviation σ For instance, µ = 0, σ = 1 0 1 Sample 1, N=30 Sample 2, N=30 Sample 100000000000 InterquartileRange
1 Exercise One. 1.1 Calculate the mean ROI. Note that the data is not grouped! Below you find the raw data in tabular form:
 1 Exercise One Note that the data is not grouped! 1.1 Calculate the mean ROI Below you find the raw data in tabular form: Obs Data 1 18.5 2 18.6 3 17.4 4 12.2 5 19.7 6 5.6 7 7.7 8 9.8 9 19.9 10 9.9 11
CS 237: Probability in Computing
 CS 237: Probability in Computing Wayne Snyder Computer Science Department Boston University Lecture 10: o Cumulative Distribution Functions o Standard Deviations Bernoulli Binomial Geometric Cumulative
Chapter 4: Commonly Used Distributions. Statistics for Engineers and Scientists Fourth Edition William Navidi
 Chapter 4: Commonly Used Distributions Statistics for Engineers and Scientists Fourth Edition William Navidi 2014 by Education. This is proprietary material solely for authorized instructor use. Not authorized
The binomial distribution
 The binomial distribution The coin toss - three coins The coin toss - four coins The binomial probability distribution Rolling dice Using the TI nspire Graph of binomial distribution Mean & standard deviation
Data Analysis and Statistical Methods Statistics 651
 Data Analysis and Statistical Methods Statistics 651 http://www.stat.tamu.edu/~suhasini/teaching.html Lecture 10 (MWF) Checking for normality of the data using the QQplot Suhasini Subba Rao Review of previous
Some estimates of the height of the podium
 Some estimates of the height of the podium 24 36 40 40 40 41 42 44 46 48 50 53 65 98 1 5 number summary Inter quartile range (IQR) range = max min 2 1.5 IQR outlier rule 3 make a boxplot 24 36 40 40 40
Wk 2 Hrs 1 (Tue, Jan 10) Wk 2 - Hr 2 and 3 (Thur, Jan 12)
 Wk 2 - Hr 2 and 3 (Thur, Jan 12)") Wk 2 Hrs 1 (Tue, Jan 10) Wk 2 - Hr 2 and 3 (Thur, Jan 12) Descriptive statistics: - Measures of centrality (Mean, median, mode, trimmed mean) - Measures of spread (MAD, Standard deviation, variance) -
Wk 2 Hrs 1 (Tue, Jan 10) Wk 2 - Hr 2 and 3 (Thur, Jan 12) Descriptive statistics: - Measures of centrality (Mean, median, mode, trimmed mean) - Measures of spread (MAD, Standard deviation, variance) -
Probability Models.S2 Discrete Random Variables
 Probability Models.S2 Discrete Random Variables Operations Research Models and Methods Paul A. Jensen and Jonathan F. Bard Results of an experiment involving uncertainty are described by one or more random
Describing Data: One Quantitative Variable
 STAT 250 Dr. Kari Lock Morgan The Big Picture Describing Data: One Quantitative Variable Population Sampling SECTIONS 2.2, 2.3 One quantitative variable (2.2, 2.3) Statistical Inference Sample Descriptive
Variance, Standard Deviation Counting Techniques
 Variance, Standard Deviation Counting Techniques Section 1.3 & 2.1 Cathy Poliak, Ph.D. cathy@math.uh.edu Department of Mathematics University of Houston 1 / 52 Outline 1 Quartiles 2 The 1.5IQR Rule 3 Understanding
Binomial Random Variable - The count X of successes in a binomial setting
 6.3.1 Binomial Settings and Binomial Random Variables What do the following scenarios have in common? Toss a coin 5 times. Count the number of heads. Spin a roulette wheel 8 times. Record how many times
Data that can be any numerical value are called continuous. These are usually things that are measured, such as height, length, time, speed, etc.
 Chapter 8 Measures of Center Data that can be any numerical value are called continuous. These are usually things that are measured, such as height, length, time, speed, etc. Data that can only be integer
We use probability distributions to represent the distribution of a discrete random variable.
 Now we focus on discrete random variables. We will look at these in general, including calculating the mean and standard deviation. Then we will look more in depth at binomial random variables which are
Chapter 8: Binomial and Geometric Distributions
 Chapter 8: Binomial and Geometric Distributions Section 8.1 Binomial Distributions The Practice of Statistics, 4 th edition For AP* STARNES, YATES, MOORE Section 8.1 Binomial Distribution Learning Objectives
Probability and Statistics
 Kristel Van Steen, PhD 2 Montefiore Institute - Systems and Modeling GIGA - Bioinformatics ULg kristel.vansteen@ulg.ac.be CHAPTER 3: PARAMETRIC FAMILIES OF UNIVARIATE DISTRIBUTIONS 1 Why do we need distributions?
Subject CS1 Actuarial Statistics 1 Core Principles. Syllabus. for the 2019 exams. 1 June 2018
 ` Subject CS1 Actuarial Statistics 1 Core Principles Syllabus for the 2019 exams 1 June 2018 Copyright in this Core Reading is the property of the Institute and Faculty of Actuaries who are the sole distributors.
CABARRUS COUNTY 2008 APPRAISAL MANUAL
 STATISTICS AND THE APPRAISAL PROCESS PREFACE Like many of the technical aspects of appraising, such as income valuation, you have to work with and use statistics before you can really begin to understand
Chapter 6: Random Variables
 Chapter 6: Random Variables Section 6.3 The Practice of Statistics, 4 th edition For AP* STARNES, YATES, MOORE Chapter 6 Random Variables 6.1 Discrete and Continuous Random Variables 6.2 Transforming and
Lecture Week 4 Inspecting Data: Distributions
 Lecture Week 4 Inspecting Data: Distributions Introduction to Research Methods & Statistics 2013 2014 Hemmo Smit So next week No lecture & workgroups But Practice Test on-line (BB) Enter data for your
Binomial Random Variables. Binomial Random Variables
 Bernoulli Trials Definition A Bernoulli trial is a random experiment in which there are only two possible outcomes - success and failure. 1 Tossing a coin and considering heads as success and tails as
2017 Fall QMS102 Tip Sheet 2
 Chapter 5: Basic Probability 2017 Fall QMS102 Tip Sheet 2 (Covering Chapters 5 to 8) EVENTS -- Each possible outcome of a variable is an event, including 3 types. 1. Simple event = Described by a single
Review of the Topics for Midterm I
 Review of the Topics for Midterm I STA 100 Lecture 9 I. Introduction The objective of statistics is to make inferences about a population based on information contained in a sample. A population is the
Random Variables CHAPTER 6.3 BINOMIAL AND GEOMETRIC RANDOM VARIABLES
 Random Variables CHAPTER 6.3 BINOMIAL AND GEOMETRIC RANDOM VARIABLES Essential Question How can I determine whether the conditions for using binomial random variables are met? Binomial Settings When the
MANAGEMENT PRINCIPLES AND STATISTICS (252 BE)
") MANAGEMENT PRINCIPLES AND STATISTICS (252 BE) Normal and Binomial Distribution Applied to Construction Management Sampling and Confidence Intervals Sr Tan Liat Choon Email: tanliatchoon@gmail.com Mobile:
MANAGEMENT PRINCIPLES AND STATISTICS (252 BE) Normal and Binomial Distribution Applied to Construction Management Sampling and Confidence Intervals Sr Tan Liat Choon Email: tanliatchoon@gmail.com Mobile:
Part 1 In which we meet the law of averages. The Law of Averages. The Expected Value & The Standard Error. Where Are We Going?
 1 The Law of Averages The Expected Value & The Standard Error Where Are We Going? Sums of random numbers The law of averages Box models for generating random numbers Sums of draws: the Expected Value Standard
2 Exploring Univariate Data
 2 Exploring Univariate Data A good picture is worth more than a thousand words! Having the data collected we examine them to get a feel for they main messages and any surprising features, before attempting
Appendix A. Selecting and Using Probability Distributions. In this appendix
 Appendix A Selecting and Using Probability Distributions In this appendix Understanding probability distributions Selecting a probability distribution Using basic distributions Using continuous distributions
Math 2311 Bekki George Office Hours: MW 11am to 12:45pm in 639 PGH Online Thursdays 4-5:30pm And by appointment
 Math 2311 Bekki George bekki@math.uh.edu Office Hours: MW 11am to 12:45pm in 639 PGH Online Thursdays 4-5:30pm And by appointment Class webpage: http://www.math.uh.edu/~bekki/math2311.html Math 2311 Class
Basic Principles of Probability and Statistics. Lecture notes for PET 472 Spring 2010 Prepared by: Thomas W. Engler, Ph.D., P.E
 Basic Principles of Probability and Statistics Lecture notes for PET 472 Spring 2010 Prepared by: Thomas W. Engler, Ph.D., P.E Definitions Risk Analysis Assessing probabilities of occurrence for each possible
Chapter 3 Discrete Random Variables and Probability Distributions
 Chapter 3 Discrete Random Variables and Probability Distributions Part 3: Special Discrete Random Variable Distributions Section 3.5 Discrete Uniform Section 3.6 Bernoulli and Binomial Others sections
Copyright 2005 Pearson Education, Inc. Slide 6-1
 Copyright 2005 Pearson Education, Inc. Slide 6-1 Chapter 6 Copyright 2005 Pearson Education, Inc. Measures of Center in a Distribution 6-A The mean is what we most commonly call the average value. It is
Chapter 7. Inferences about Population Variances
 Chapter 7. Inferences about Population Variances Introduction () The variability of a population s values is as important as the population mean. Hypothetical distribution of E. coli concentrations from
Describing Uncertain Variables
 Describing Uncertain Variables L7 Uncertainty in Variables Uncertainty in concepts and models Uncertainty in variables Lack of precision Lack of knowledge Variability in space/time Describing Uncertainty
Shifting our focus. We were studying statistics (data, displays, sampling...) The next few lectures focus on probability (randomness) Why?
 The next few lectures focus on probability (randomness) Why?") Probability Introduction Shifting our focus We were studying statistics (data, displays, sampling...) The next few lectures focus on probability (randomness) Why? What is Probability? Probability is used
Probability Introduction Shifting our focus We were studying statistics (data, displays, sampling...) The next few lectures focus on probability (randomness) Why? What is Probability? Probability is used
Example - Let X be the number of boys in a 4 child family. Find the probability distribution table:
 Chapter8 Probability Distributions and Statistics Section 8.1 Distributions of Random Variables tthe value of the result of the probability experiment is a RANDOM VARIABLE. Example - Let X be the number
Statistics & Flood Frequency Chapter 3. Dr. Philip B. Bedient
 Statistics & Flood Frequency Chapter 3 Dr. Philip B. Bedient Predicting FLOODS Flood Frequency Analysis n Statistical Methods to evaluate probability exceeding a particular outcome - P (X >20,000 cfs)
Chapter 4 and 5 Note Guide: Probability Distributions
 Chapter 4 and 5 Note Guide: Probability Distributions Probability Distributions for a Discrete Random Variable A discrete probability distribution function has two characteristics: Each probability is
CPSC 540: Machine Learning
 CPSC 540: Machine Learning Monte Carlo Methods Mark Schmidt University of British Columbia Winter 2019 Last Time: Markov Chains We can use Markov chains for density estimation, d p(x) = p(x 1 ) p(x }{{}
23.1 Probability Distributions
 3.1 Probability Distributions Essential Question: What is a probability distribution for a discrete random variable, and how can it be displayed? Explore Using Simulation to Obtain an Empirical Probability
The Range, the Inter Quartile Range (or IQR), and the Standard Deviation (which we usually denote by a lower case s).
, and the Standard Deviation (which we usually denote by a lower case s).") We will look the three common and useful measures of spread. The Range, the Inter Quartile Range (or IQR), and the Standard Deviation (which we usually denote by a lower case s). 1 Ameasure of the center
We will look the three common and useful measures of spread. The Range, the Inter Quartile Range (or IQR), and the Standard Deviation (which we usually denote by a lower case s). 1 Ameasure of the center
Chapter 7: SAMPLING DISTRIBUTIONS & POINT ESTIMATION OF PARAMETERS
 Chapter 7: SAMPLING DISTRIBUTIONS & POINT ESTIMATION OF PARAMETERS Part 1: Introduction Sampling Distributions & the Central Limit Theorem Point Estimation & Estimators Sections 7-1 to 7-2 Sample data