Phoenix Management Services Lending Climate in America Survey
|
|
|
- Jerome Walters
- 5 years ago
- Views:
Transcription

1 Phoenix Management Services Lending Climate in America Survey 1st Quarter 2013 Summary, Trends and Implications
2 PHOENIX LENDING CLIMATE IN AMERICA QUARTERLY SURVEY 1st Quarter 2013 SUMMARY, TRENDS AND IMPLICATIONS 1. The IRS did not begin accepting and processing 2012 tax returns until January 30th This delay was a result of the last minute January 1st tax deal passed by Congress. How do you see the delay in tax refunds impacting consumer discretionary spending in the first and second quarters? As people rang in the New Year across the country, the politicians in Washington DC spent the countdown to 2013 holed up on Capitol Hill bickering back and forth over the Fiscal Cliff. The lenders who participated in this quarter s lending survey were fairly split regarding the theatrics that took place. Thirty-two percent of the respondents thought that future uncertainty regarding tax increases would dampen consumer spending and the eight day delay would have little impact. The next camp of respondents, at thirty percent, believes there will be a negative effect on Q1 discretionary spending, however, any reduction in spending will be recouped in Q2. There were some optimists in the survey, sixteen percent, who thought the U.S. consumer was resilient in January and the delay would have little impact based on strong consumer demand going forward. Another sixteen percent of respondents were a little gloomier. They thought the delay in tax refunds would create a domino effect, impacting retailer s earnings thus negatively impacting their supply chain and ultimately the retailer s cash flow. One lender believed that lower end retailers would feel an impact while higher end retailers would be relatively unscathed. 2. In 2012 we saw housing starts increase for the 3rd consecutive year to 780,000 homes (Bloomberg), home prices increase by 5.5% per the S&P/Case-Shiller 20 city composite index (for the 12 months ending 11/30/12), and the unemployment rate ended the year at 7.80%. Which of the following best describes your belief? The unprecedented financial downturn has been followed by a tepid recovery in what some are calling the New Normal. Job growth has been slow, with unemployment decreasing from the peak of 10% reached during the depth of the financial crisis. Real Estate has continued to improve in recent years however, to put in to perspective, as of the fourth quarter of 2012, average home prices across the United States were only back at their autumn 2003 levels. So our survey wanted to know which of these factors was going to drive the economy out of the recovery. The highest percentage of respondents, at forty-one percent, believes the unemployment rate will play a more prominent role than either housing starts or home prices in an economic recovery. Thirty percent of the respondents said they think housing starts will play a bigger role than home prices or the unemployment rate. The smallest camp of lenders believes home prices will be the driving force in the recovery. It was noted by one lender that both housing starts and home price appreciation will contribute to employment growth. Another perspective highlighted the fact that the unemployment reduction would have to come from additional jobs and not people rejoining the workforce. 3. According to a recent Bloomberg survey, consumer credit in the U.S. increased in December, marking five consecutive months of increases. Another highlight from the report included a significant increase in non-revolving credit. It should be noted the survey did not include debt secured by real estate. What do you anticipate regarding consumer credit levels in 2013? At forty-six percent, the highest of any response, lenders believe that the December consumer credit data was inflated due to the holiday season and future consumer debt growth will be suppressed by

3 further tax increases. On the other end, there were lenders who believe there is something to this consumer credit trend. Thirty percent of the responses said the pick-up in consumer credit was driven by new vehicle purchases and believe this demand will continue throughout the year. Nine percent of the lenders believe improved payroll numbers have given consumers the confidence to begin borrowing again but remain cautious that a macro-event could cause setbacks. Ten percent of our lenders shared their own response, which included thoughts such as: Pent up demand and increased consumer confidence led to a temporary blip in Q4 Increases in student loans comprise a large portion of the increase People are borrowing due to income growth running below inflation This metric will continue to increase, driven by college borrowing. It is the next bubble Quarterly update reveals huge change in domestic sentiment. This quarter s diffusion index increased dramatically over the last quarter, marking a turnaround for the index which has been steadily declining for the prior nine months. The diffusion index had slid thirty-three percentage points over the prior nine months before jumping ahead forty-two percentage points in the 1Q 2013, the largest increase in the survey s history. Forty-eight percent of respondents feel that domestic lending will increase versus eighteen percent in the fourth quarter of Only six percent of lenders thought domestic lending would decrease compared to eighteen percent in the prior quarter. Approximately forty-five percent of survey takers think that there will be no change over the next six months. 5. Leverage ratio impact on loan consideration remains consistent quarter over quarter. Lender responses in the x category still maintained the largest percentage of responses. This category increased two percentage points relative to last quarter s survey (thirty-two percent in the current survey versus thirty percent in Q4 2012). Thirteen percent of surveyed lenders indicated that collateral supersedes senior debt to EBITDA ratio when considering a loan request, a decrease from twenty percent last quarter. Eighteen percent of lenders also indicated that they would consider a loan with a senior leverage ratio between x, which represents a two percentage point decrease over last quarter (twenty percent). Sixteen percent of lenders responded that their institution would consider senior debt to EBITDA ratios in excess of 3.5x, this leverage metric increased from ten percent of all responses last quarter. Eleven percent of lenders would consider providing senior term loans in the 2-2.5x ratio category, a one percentage point decrease from last

4 quarter s twelve percent. Seven percent of those surveyed did not know the highest leverage ratio their institution would consider, the same as last quarter. 6. Senior debt to EBITDA lending ratios should remain consistent for the next six months according to survey results. The majority (fifty-seven percent) of respondents believe their institution will experience no change in the next six months compared to sixty percent that shared the same sentiment last quarter. Thirteen percent of respondents indicated they were collateral lenders and did not specifically focus on senior debt to EBITDA multiple (down four percentage points from the previous survey). Eleven percent of lenders believe there will be an increase less than.5x. Seven percent of lenders specified that they do not know how senior leverage ratios will change at their financial institutions in the next six months. 7. Unstable energy prices and the U.S. budget deficit are the biggest risk factors facing the economy. When asked to choose two factors that could have the strongest potential to affect the economy in the next six months, sixty-one percent (versus eighty percent in the previous quarter) chose the U.S. budget deficit. Unstable energy price concerns were the second greatest response, with fiftynine percent of those polled showing concern (twenty-five percent chose this factor in the last survey). Stability in the stock market garnered twenty percent of responses compared to twentythree percent last quarter. Thirty-one percent of lenders cited both other concerns and a sluggish housing market as possible economic headwinds. Constrained liquidity in capital markets rounded out the remaining risk factors with seven percent of total responses. 8. Retail trade remains the most likely to experience volatility while the public sector begins to climb. When asked to identify three industries that will experience the most volatility in the next six months, forty-nine percent of lenders agree that Retail Trade will experience the greatest volatility, the exact same amount as the prior quarter s survey. Healthcare and Social Assistance followed next with thirty-one percent of those polled thinking the Healthcare and Social Assistance industry could experience volatility over the next six months. Similar to the Healthcare and Social Assistance industry, thirty percent of the lenders believe the Public Administration industry could be volatile in the upcoming months. Finance and Insurance followed close behind with twenty-six percent of those polled (a decrease of twelve percentage points from last quarter). The Construction industry also garnered twenty-six percent of the vote and continued its decline in the

5 volatility rankings after being atop the list for two years. Mining decreased fourteen percent from the prior quarter to arrive at thirteen percent of the survey. Real Estate Rental and Leasing comprised seven percent of survey taker s responses down from twenty-five percent in the last quarter. Rounding out the industries receiving greater than ten percent of responses included manufacturing and educational services. The remaining industries yielded responses of ten percent or less. 9. Borrowers maintain new capital investment plans and acquisitions for future growth. This quarter showed a twenty-three percentage point increase in lenders believing their customers will introduce a new product or service garnering fifty-six percent of the lenders. Making new capital investments decreased from fifty percent to forty-four percent, still a high expectation. The other significant expectation, at forty-two percent of the survey, is the expectation for lender s customers to start making acquisitions. Thirty-five percent of lenders believe their customers will enter new markets during the next six months, a twelve percentage point increase. Hiring new employees increased nine percentage points quarter over quarter to twenty-nine percent of the lenders. Raising additional capital yielded the same percentage of lenders as hiring new employees at twenty-nine percent, an increase of twelve percentage points over the prior quarter. Twelve percent of respondents believe their customers will conduct other activities in the near term, which included such responses as: Reducing number of employees Trying to maintain and survive Hunkering down due to uncertainty over lack of leadership from the Obama Admin. Cutting expenses / people 10. Near term economic performance rises for the quarter. Economic growth sentiment remained an overall C- grade this quarter, however, the index rose for the first time in four quarters by thirteen basis points relative to Q The majority of lenders (seventy-four percent) still believe the economy will perform at a C level or better over the next six months, compared to sixty-six percent in the previous survey. Nineteen percent of respondents agreed that the economy will perform at a D grade in the next six months. Only six


6 percent of lenders believe the economy will perform at a B level. Since more lenders responded with a D grade rather than a B, the overall weighted average grade remained a C-. * Rate of Change of 1.0 is at equilibrium and signifies no change from the corresponding prior period of comparison. 11. Longer term economic growth outlook trends higher. Lenders growth expectations for the U.S. economy beyond six months grew by five basis points according to survey results. This quarter yielded a C grade, which is the same as last quarter. Eighty-seven percent of lenders believe the economy will perform at a C level or better in the six to twelve month period, compared to eighty-five percent in the previous quarter. Lender expectations have remained relatively flat hovering around equilibrium for the past few years. * Rate of Change of 1.0 is at equilibrium and signifies no change from the corresponding prior period of comparison. 12. Lenders expect Unemployment, Bankruptcies and Loan Losses to decrease in the next six months. All three of these categories decreased with nineteen, twenty-eight, and twenty-four percentage point decreases, respectively.


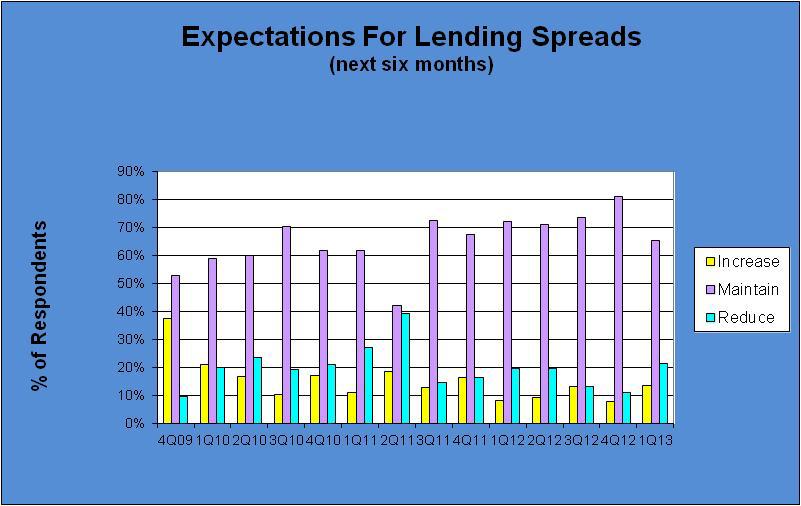
7 13. Lenders expect to slightly relax loan structures. The percentage of respondents planning to maintain their current loan structures decreased by four percentage points compared to last quarter of Lenders who expect to tighten their loan structures remained flat with the prior quarter. Lenders anticipating relaxing their client s loan structures increased by four percentage points from Q More lenders expect interest rate spreads to change. Sixty-five percent of respondents (versus eighty-one percent in the previous quarter) anticipate maintaining lending spreads at their current levels. The percentage of lenders expecting to reduce their current credit spreads increased ten percentage points, representing twenty-one percent of total responses this quarter. Thirteen percent of lenders anticipate increasing their credit spreads in the next six months versus eight percent in Q
8
9 Phoenix Management Services Lending Climate in America 1 st Quarter 2013 Survey Results 1. The delay in tax refunds will have little impact on discretionary spending in the first two quarters according to the survey. The IRS did not begin accepting and processing 2012 tax returns until January 30th This delay was a result of the last minute January 1st tax deal passed by Congress. Lenders were asked: How do you see the delay in tax refunds impacting consumer discretionary spending in the first and second quarters? Thirty-two percent believe uncertainty regarding future tax increases will prevent consumers from spending freely, so the delay will have little effect on spending in Q1 and Q2. Thirty percent believe the average tax rebate check is approximately $3,000. The delay of a few weeks will have an impact on Q1 discretionary spending however any loss in Q1 should result in a Q2 gain. Sixteen percent believe retailers are reporting January sales that topped analyst estimates, this news coupled with high consumer confidence should continue through Q1 and Q2. The tax refund delay will have minimal effect on demand. Sixteen percent believe the delay will have a noticeable impact on retailer's first quarter earnings. Inventory issues may result with availability and timing issues affecting cash flow. Five percent have other feelings toward how the delay in tax refunds will impact consumer discretionary spending in the first and second quarters. 2. Employment rates will be the lead driver in the economic recovery according to the survey. In 2012 we saw housing starts increase for the 3rd consecutive year to 780,000 homes (Bloomberg), home prices increase by 5.5% per the S&P/Case-Shiller 20 city composite index (for the 12 months ending 11/30/12), and the unemployment rate ended the year at 7.80%. Lenders were asked: Will housing starts, home prices or employment have the greatest impact on the economic recovery? Forty-one percent believe a reduction in the unemployment rate will have more of an impact on the economic recovery than either housing starts or home prices. Thirty percent believe housing starts will have more of an impact on the economic recovery than either home prices or the unemployment rate. Twenty-one percent believe rebounding home prices will have more of an impact on the economic recovery than either housing starts or the unemployment rate. Five percent believe other factors will lead the recovery.
10 3. Consumers will still be hesitant to increase borrowing in 2013 according to the survey. According to a recent Bloomberg survey, consumer credit in the U.S. increased in December, marking five straight months of increases. Another highlight from the report included a significant increase in non-revolving credit. It should be noted the survey did not include debt secured by real estate. Lenders were asked: What do you anticipate regarding consumer credit levels in 2013? Forty-six percent believe December's data is inflated as a result of the holiday season and consumer's willingness to borrow during this time period. January may see some lingering borrowing effects, but the reality of uncertain macro tax issues will suppress future growth. Thirty percent believe auto manufacturers are the driving force behind the increase in consumer credit. Continued demand for new vehicles should keep the monthly increases continuing through most of the calendar year. Nine percent believe payroll numbers have given consumers the security to borrow for expensive capital expenditures. Any macro setback regarding consumer confidence will immediately prevent further monthly increases. Eleven percent have other opinions regarding consumer credit levels in Highest Senior Debt to EBITDA Leverage Institutions Would Consider Respondents were asked the highest multiple of Senior Debt to EBITDA their financial institution would consider with regard to a loan request. Thirty-two percent indicated their institution would consider a loan request with a leverage multiple as high as the 3.0x 3.5x range (previous survey: 30 percent). Eighteen percent believed their institution would consider a loan request with a Senior Debt to EBITDA multiple as high as the 2.5x 3.0x range (previous survey: 20 percent). Sixteen percent of lenders opined their financial institution would consider a loan request with a leverage multiple of greater than 3.5x (previous survey: 10 percent). Thirteen percent of respondents replied they are collateral lenders and, therefore, do not make credit decisions based on cash flow/leverage multiples (previous survey: 20 percent). Eleven percent of lenders believed their institution would consider a loan request with a Senior Debt to EBITDA multiple as high as 2.0x 2.5x range (previous survey: 12 percent). Seven percent of lenders either did not know or did not respond with regard to how their institution s senior leverage ratio would change. (previous survey: 7 percent) Zero percent of lenders indicated that their financial institution would only consider a loan request with a Senior Debt to EBITDA ratio of less than 2.0x (previous survey: 1 percent). 5. Anticipated Change in Senior Debt to EBITDA Multiple
11 Respondents were asked, over the next six months, how the Senior Debt to EBITDA multiple would change at their financial institution. Fifty-seven percent indicated that the Senior Debt to EBITDA multiple will not change at their financial institution over the next six months (previous survey: 60 percent). Thirteen percent of respondents replied they are collateral lenders and, therefore, do not make credit decisions based on cash flow/leverage multiples (previous survey: 17 percent). Eleven percent of lenders believe that the leverage multiple will increase less than 0.5x during the next six months (previous survey: 5 percent). Seven percent of lenders responded Do Not Know regarding how senior leverage ratios would change at their financial institution in the next six months. (previous survey: 7 percent) Five percent conclude that the leverage multiple will increase greater than 0.5x during the next six months (previous survey: 5 percent). Four percent conclude that the leverage multiple will decrease less than 0.5x during the next six months (previous survey: 5 percent). Zero percent believe that the leverage multiple will decrease greater than 0.5x during the next six months (previous survey: 1 percent). 6. Factors with Strongest Potential to Affect Near-Term Economy Respondents were asked, over the next six months, which TWO factors had the strongest potential to affect the economy. Sixty-one percent of respondents selected the U.S. budget deficit as having the strongest potential to affect the economy over the next six months (previous survey: 80 percent). Fifty-nine percent concluded that unstable energy prices have the strongest potential to affect the economy during the next six months (previous survey: 25 percent). Twenty percent opined that the stability of the stock market has the strongest potential to affect the economy during the next six months (previous survey: 23 percent). Nineteen percent designated the sluggish housing market as the factor with the strongest potential to affect the near-term economy (previous survey: 22 percent). Thirteen percent chose other factors as having the strongest potential to affect the economy during the next six months (previous survey: 22 percent). Seven percent indicated constrained liquidity in the capital markets as the factor with the strongest potential to affect the near-term economy (previous survey: 10 percent). Zero percent indicated the war in Iraq as the factor with the strongest potential to affect the near-term economy (previous survey: 5 percent). 7. Industries Expected to Experience Greatest Volatility Respondents were asked, over the next six months, which industries will experience the most volatility (i.e. Chapter 11 filings, mergers and acquisitions, declining profits, etc.). Respondents were asked to select the top three industries.
12 Forty-nine percent believe the Retail Trade industry will experience the most volatility over the next six months (previous survey: 48 percent). Thirty percent of lenders feel that the Public Administration industry will face increasing volatility in the near term (previous survey: 20 percent). Thirty-two percent of respondents chose the Healthcare and Social Assistance industry to experience the greatest volatility (previous survey: 27 percent). Twenty-six percent of respondents believe the Finance and Insurance industry will experience the greatest volatility over the next six months (previous survey: 38 percent). Twenty-six percent designated the Construction industry as the industry expected to have the greatest volatility in the near term (previous survey: 28 percent). Fifteen percent of lenders believe the Manufacturing industry to experience the greatest volatility (previous survey: 17 percent). Fifteen percent of survey takers are of the opinion Educational Services will experience significant volatility in the short term (previous survey: 17 percent). Thirteen percent of respondents believe the Mining industry will experience significant volatility in the next six months (previous survey: 27 percent). Eleven percent of lenders feel that the Arts, Entertainment and Recreation will experience the greatest volatility (previous survey: 3 percent). Eight percent responded that the Real Estate and Rental/Leasing industry would experience the most volatility during the next six months (previous survey: 25 percent). The balance of the industry choices registered ten percent or less from the respondents. 8. Customers Plans in the Next Six to Twelve Months Respondents were asked which of the following actions their customers planned in the next six months. Lenders were asked to designate all potential customer actions that applied. Fifty-six percent of lenders believe their customers are planning on introducing new products or services (previous survey: 33 percent). Forty-four percent of lenders believe their customers will be making new capital investments (previous survey: 50 percent). Forty-two percent of lenders indicated their customers are planning on making an acquisition in the next six months (previous survey: 43 percent). Thirty-five percent responded their customers are planning on entering new markets in the near term (previous survey: 23 percent). Twenty-nine percent of respondents indicated their customers plan on hiring new employees in the next six months (previous survey: 20 percent).
. 9.")
13 Twenty-nine percent indicated their customers are planning on raising additional capital in the near term (previous survey: 17 percent). Twelve percent of lenders believe their customers are planning other initiatives in the next six months (previous survey: 10 percent). 9. Economic Indicators Respondents were asked whether they expected the following economic indicators to be up, down, or remain the same over the next six months. Overall sentiment regarding lending economic indicators improved for the first quarter in the last twelve months. Forty-one percent of respondents view the entire lending universe as improving compared to fourteen percent of respondents from the previous quarter. The overall lending diffusion index for all lending categories was dramatically higher by forty-one percentage points compared to Q The domestic lending diffusion index was equally higher as well this quarter. The index increased by forty-two percentage points relative to last quarter. 1Q/2013 4Q/2012 Up Down Same Up Down Same Corporate Lending 45% 9% 45% 11% 17% 72% Middle Market Lending 48% 4% 48% 19% 15% 66% Small Business Lending 52% 6% 43% 23% 22% 55% International Lending 17% 23% 60% 3% 46% 51% This quarter illustrated lenders trending towards believing that there will be decreased losses, bankruptcies, and unemployment in the next six months. 1Q/2013 4Q/2012 Up Down Same Up Down Same Loan Losses 15% 39% 46% 23% 25% 52% Bankruptcies 9% 35% 56% 23% 22% 55% Interest Rates 19% 0% 81% 3% 3% 94% Unemployment 11% 30% 59% 20% 17% 63%
14 10. U.S. Economy Grade Next Six Months Respondents were asked how they expected the U.S. economy to perform during the next six months on a grading scale of A through F. Responses strengthened this quarter with respect to the economic growth grade point average. In the current quarter, seventy-four percent of respondents believe the economy will perform at a C level, which represents an increase of eleven percentage points from the previous quarter. This increase in expectations to a C grade level from a D level was the largest driver of the weighted average grade improvement. Grade 1Q/2013 4Q/2012 A 0% 0% B 6% 3% C 74% 63% D 19% 34% F 2% 0% Weighted Average Grade U.S. Economy Grade Beyond the Next Six Months Respondents were asked how they expected the U.S. economy to perform beyond the next six months on a grading scale of A through F. Lenders expectations for the U.S. economy s performance in the longer term improved slightly relative to the previous quarter. The weighted average improved five basis points and eightyseven percent of lenders feel as though in the longer term the economy will perform at a C or better level (compared to eighty-four percent last quarter). Grade 1Q/2013 4Q/2012 A 0% 0% B 30% 25% C 57% 59% D 11% 16% F 2% 0% Weighted Average Customers Future Growth Expectations Lenders assessed their customers growth expectations for the next six months to a year. The percentage of respondents indicating their customers have moderate growth expectations for the next six months to one year increased by thirteen percentage points from Q Lenders expectations for their customers to experience no growth decreased in approximately the same amount, while two percent of the lenders anticipate strong growth expectations for their customers. Indication 1Q/2013 4Q/2012 Very Strong 0% 0% Strong 2% 0%
15 Moderate 85% 72% No Growth 13% 28% 13. Loan Structure Respondents were asked whether their financial institutions planned to tighten, relax, or maintain their loan structures (collateral requirements, guarantees, advance rates, loan covenants, etc.) in each of four different-sized loan categories. Similar to last quarter, the vast majority of respondents anticipate maintaining the current loan structures in place. However, this quarter did show a slight shift towards loosening loan standards, according to survey results. 1Q/2013 4Q/2012 Tighten Maintain Relax Tighten Maintain Relax Loans> $25 million 9% 71% 20% 7% 84% 9% $15 25 million 6% 83% 10% 7% 84% 9% $5-15 million 10% 76% 14% 9% 84% 7% Under $5 million 10% 82% 8% 10% 78% 12% Overall Average 9% 78% 13% 8% 82% 9% 14. Interest Rate Spread Lenders were asked whether their financial institutions planned to reduce, maintain or increase their interest rate spreads and fee structures on similar credit quality loans. The majority of respondents, sixty-five percent, plan to maintain their current interest rate spreads and fee structures; however that is a sixteen percent decrease from the prior quarter. On average thirteen percent expect to increase rates while twenty-one percent are expecting further reductions in pricing. 1Q/2013 4Q/2012 Reduce Maintain Increase Reduce Maintain Increase Loans> $25 million 28% 65% 7% 15% 80% 5% $15 25 million 25% 65% 10% 9% 86% 5% $5-15 million 17% 67% 17% 11% 83% 6% Under $5 million 16% 65% 20% 10% 76% 14% Overall Average 21% 65% 13% 11% 81% 8% 15. The Fed and Interest Rates Respondents were asked in what direction the Fed would move interest rates and by how much in the coming six months. Consistent with the previous survey, a significant majority of lenders, eighty-seven percent, believe that the Fed will not change interest rate during the next six months. See the next page for the response spread.
16 Bps Change 1Q/2013 1Q/2012 -More than 1.0 0% 0% % 0% % 0% % 1% % 2% 0 87% 90% % 7% % 0% % 0% % 0% More than 1.0 0% 0% Weighted Average 0.02 basis points basis points 16. Current Competition Respondents were asked to identify the segment of the industry from which they were experiencing the most competition. Similar to last quarter, local commercial/community banks served as the greatest competition for lenders this quarter with forty-five percent of all responses. Factor competition also continued to increase this quarter relative to the single digits earlier in the year. 1Q/2013 4Q/2012 Money Center Banks 11% 8% Local Commercial/ Community Banks 45% 55% Factors 22% 20% Regional Banks 15% 13% Commercial Finance Organizations 0% 0% Other 7% 4%
Phoenix Management Services Lending Climate in America Survey
 Phoenix Management Services Lending Climate in America Survey 3 rd Quarter 2013 Summary, Trends and Implications PHOENIX LENDING CLIMATE IN AMERICA QUARTERLY SURVEY 3 rd Quarter 2013 SUMMARY, TRENDS AND
Phoenix Management Services Lending Climate in America Survey
 Phoenix Management Services Lending Climate in America Survey 2 nd Quarter 2016 Summary, Trends and Implications PHOENIX LENDING CLIMATE IN AMERICA 2 nd Quarter 2016 SUMMARY, TRENDS AND IMPLICATIONS 1.
NFIB SMALL BUSINESS. William C. Dunkelberg Holly Wade SMALL BUSINESS OPTIMISM INDEX COMPONENTS
 NFIB SMALL BUSINESS ECONOMIC TRENDS William C. Dunkelberg Holly Wade January 211 Based on a Survey of Small and Independent Business Owners SMALL BUSINESS OPTIMISM INDEX COMPONENTS Seasonally Change From
Survey of Credit Underwriting Practices 2010
 Survey of Credit Underwriting Practices 2010 Office of the Comptroller of the Currency August 2010 Contents Introduction...1 Part I: Overall Results...2 Primary Findings... 2 Commentary on Credit Risk...
AICPA Business & Industry U.S. Economic Outlook Survey 4Q 2014
 AICPA Business & Industry U.S. Economic Outlook Survey 4Q 2014 The CPA Outlook Index The CPA Outlook Index (CPAOI) is a broad-based indicator of the strength of US business activity and economic direction
Credit Underwriting Practices
 Comptroller of the Currency Administrator of National Banks US Department of the Treasury 2011 Survey of OF THE R C LE UR R EN C Y CO M P T R O L Credit Underwriting Practices 186 3 Contents Introduction...
Manufacturing Barometer
 www.pwc.com Manufacturing Barometer Business outlook report April 2013 Special topic: Fiscal policy uncertainties Contents 1 Quarterly highlights Page 1.1 Key indicators for the business outlook 5 1.1
2016 Business Outlook Survey
 NJBIA S 57 TH ANNUAL BUSINESS OUTLOOK SURVEY 2016 Business Outlook Survey Optimism continues going into 2016, with sales, profits and hiring continuing on an upward trajectory. However, members are cautious
Manufacturing Barometer
 www.pwc.com Manufacturing Barometer Business outlook report April 2014 Special topic: Energy costs Contents 1 Quarterly highlights Page 1.1 Key indicators for the business outlook 6 1.1 Manufacturing current
Manufacturing Barometer
 Special topic: Year 2016 major challenges Manufacturing Barometer Business outlook report January 2016 Contents 1 Quarterly highlights 1.1 Key indicators for the business outlook 7 1.2 PwC global manufacturing
ECONOMIC TRENDS IN THIS ISSUE
 NFIB SMALL BUSINESS ECONOMIC TRENDS NFIB Research Center has collected Small BusinessEconomicTrendsDatawithQuarterly surveyssince1973andmonthlysurveyssince 1986.Thesampleisdrawnfromthemembership filesofthenationalfederationofindependent
FINC 664 ECONOMIC REPORT 9/5/11 9/9/11 9/7/11. MBA Mortgage Applications
 FINC 664 ECONOMIC REPORT 9/5/11 9/7/11 MBA Mortgage Applications MBA Mortgage Applications 2-Sep - - -4.90% -9.60% - - For the third consecutive week, mortgage applications in the U.S. fell. Fewer Americans
Manufacturing Barometer
 Special topic: Triggers to growth Manufacturing Barometer Business outlook report October 2014 Contents 1 Quarterly highlights 1.1 Key indicators for the business outlook 5 1.2 Manufacturing current assessment
2014 Business Outlook Survey
 NEW JERSEY BUSINESS & INDUSTRY ASSOCIATION S 55 TH ANNUAL BUSINESS OUTLOOK SURVEY 2014 Business Outlook Survey New Jersey s business outlook is the best in many years sales, profits and hiring on the upswing.
William C. Dunkelberg Holly Wade SMALL BUSINESS OPTIMISM INDEX COMPONENTS
 NFIB Small Business Economic Trends William C. Dunkelberg Holly Wade September 9 Based on a Survey of Small and Independent Business Owners SMALL BUSINESS OPTIMISM INDEX COMPONENTS Seasonally Change From
William C. Dunkelberg Holly Wade SMALL BUSINESS OPTIMISM INDEX COMPONENTS
 NFIB Small Business Economic Trends William C. Dunkelberg Holly Wade June 9 Based on a Survey of Small and Independent Business Owners SMALL BUSINESS OPTIMISM INDEX COMPONENTS Seasonally Change From Contribution
NFIB SMALL BUSINESS. William C. Dunkelberg Holly Wade SMALL BUSINESS OPTIMISM INDEX COMPONENTS. Seasonally Adjusted Level
 NFIB SMALL BUSINESS ECONOMIC TRENDS William C. Dunkelberg Holly Wade April 218 Based on a Survey of Small and Independent Business Owners SMALL BUSINESS OPTIMISM INDEX COMPONENTS Index Component Seasonally
NFIB SMALL BUSINESS. William C. Dunkelberg Holly Wade SMALL BUSINESS OPTIMISM INDEX COMPONENTS. Seasonally Adjusted Level
 NFIB SMALL BUSINESS ECONOMIC TRENDS William C. Dunkelberg Holly Wade 21 Based on a Survey of Small and Independent Business Owners SMALL BUSINESS OPTIMISM INDEX COMPONENTS Index Component Seasonally Adjusted
Comptroller of the Currency Administrator of National Banks SURVEY OF CREDIT UNDERWRITING PRACTICES 2000
 Comptroller of the Currency Administrator of National Banks SURVEY OF CREDIT UNDERWRITING PRACTICES 2000 SURVEY OF CREDIT UNDERWRITING PRACTICES 2000 Office of the Comptroller of the Currency Credit
Metro Milwaukee Business Outlook Survey First-Quarter, 2018
 Metro Milwaukee Business Outlook Survey First-Quarter, 2018 Prepared by: Economic Research Division January 23, 2018 Metropolitan Milwaukee Association of Commerce www.mmac.org www.mmac.org Metro Milwaukee
A report by the Sonoma County Economic Development Board Ben Stone, Director
 Sonoma County Business Confidence Report December 2000 A report by the Sonoma County Economic Development Board Ben Stone, Director Table of Contents OVERVIEW 3 HIGHLIGHTS 4 I. EXPECTED BUSINESS CHANGES
NJBIA s 60 th Annual Business Outlook Survey
 NJBIA s 60 th Annual Business Outlook Survey Employers hope to carry momentum of a positive 2018, but concerns about New Jersey s economic challenges are also growing for the new year. SALES Outlook Summary:
NFIB SMALL BUSINESS. William C. Dunkelberg Holly Wade S M A L L B U S I N E S S O P T I M I S M I N D E X C O M P O N E N T S
 NFIB SMALL BUSINESS ECONOMIC TRENDS William C. Dunkelberg Holly Wade December 29 Based on a Survey of Small and Independent Business Owners S M A L L B U S I N E S S O P T I M I S M I N D E X C O M P O
Jones Lang LaSalle ULI Investor Sentiment Survey
 ULI Investor Sentiment Survey 3Q 2010 Page 1 Jones Lang LaSalle ULI Investor Sentiment Survey Results: 3Q 2010 ULI Investor Sentiment Survey 3Q 2010 Page 2 Jones Lang LaSalle Investor Sentiment Survey
NFIB SMALL BUSINESS ECONOMIC TRENDS
 NFIB SMALL BUSINESS ECONOMIC TRENDS William C. Dunkelberg Holly Wade January 28 Based on a Survey of Small and Independent Business Owners SMALL BUSINESS OPTIMISM INDEX COMPONENTS Seasonally Change From
CDFI Market Conditions Report First Quarter Published June 2009
 CDFI Market Conditions Report First Quarter 2009 Published June 2009 The CDFI Market Conditions Report is a quarterly publication based on quarterly surveys of community development financial institutions
ADDENDUM TO THE COLLECTIVE AGREEMENT COPRESSED WORK WEEK BETWEEN <NURSING HOME> CANADIAN UNION OF PUBLIC EMPLOYEES LOCAL <####>.
 ADDENDUM TO THE COLLECTIVE AGREEMENT COPRESSED WORK WEEK BETWEEN ET CANADIAN UNION OF PUBLIC EMPLOYEES LOCAL . A compressed work week has been developed for employees subject to this
Manufacturing Barometer Business outlook report July 2014
 www.pwc.com Manufacturing Barometer Business outlook report July 2014 Contents 1 Quarterly highlights Page 1.1 Key indicators for the business outlook 5 1.1 Manufacturing current assessment and outlook
Manufacturing Barometer Business outlook report October 2012
 www.pwc.com Manufacturing Barometer Business outlook report October 2012 Contents 1 Quarterly highlights Page 1.1 Key indicators for the business outlook 5 1.1 Manufacturing current assessment and outlook
Manufacturing Barometer
 Special topic: Robotics systems Manufacturing Barometer Business outlook report April 2015 Contents 1 Quarterly highlights 1.1 Key indicators for the business outlook 7 1.2 Manufacturing current assessment
Business English- Financial Vocabulary- Numbers Guessing Pairwork Student A Make a sentence below into a question, e.g. What percentage of?
 Business English- Financial Vocabulary- Numbers Guessing Pairwork Student A Make a sentence below into a question, e.g. What percentage of? or How many? Give hints like Far higher / Very slightly lower
AICPA Business & Industry U.S. Economic Outlook Survey 1Q 2014
 AICPA Business & Industry U.S. Economic Outlook Survey 1Q 2014 The CPA Outlook Index The CPA Outlook Index (CPAOI) is a broad-based indicator of the strength of US business activity and economic direction
Survey of Credit Underwriting Practices 2005 Office of the Comptroller of the Currency National Credit Committee
 Survey of Credit Underwriting Practices 25 Office of the Comptroller of the Currency National Credit Committee June 25 1 Table of Contents Introduction 3 Part I: Overall Results Primary Findings 4 Commentary...6
NFIB SMALL BUSINESS. William C. Dunkelberg Holly Wade SMALL BUSINESS OPTIMISM INDEX COMPONENTS
 NFIB SMALL BUSINESS ECONOMIC TRENDS William C. Dunkelberg Holly Wade May 21 Based on a Survey of Small and Independent Business Owners SMALL BUSINESS OPTIMISM INDEX COMPONENTS Seasonally Change From Contribution
Manufacturing Barometer Business outlook report January 2012
 www.pwc.com Manufacturing Barometer Business outlook report January 2012 Contents 1 Quarterly highlights Page 1.1 Key indicators for the business outlook 5 2 Economic views 2.1 View of US economy, this
NFIB SMALL BUSINESS. William C. Dunkelberg Holly Wade SMALL BUSINESS OPTIMISM INDEX COMPONENTS
 NFIB SMALL BUSINESS ECONOMIC TRENDS William C. Dunkelberg Holly Wade 21 Based on a Survey of Small and Independent Business Owners SMALL BUSINESS OPTIMISM INDEX COMPONENTS Index Component Seasonally Adjusted
Beyond Wages. Delaware Job Benefits. Includes: Day Care Telecommuting Holidays Vacation. Health Care. Retirement Tuition Assistance.
 Beyond Wages Delaware Job Benefits Includes: Day Care Telecommuting Holidays Vacation Health Care Retirement Tuition Assistance Retirement Day Care Health Care Office of Occupational & Labor Market Information
William C. Dunkelberg Holly Wade SMALL BUSINESS OPTIMISM INDEX COMPONENTS
 NFIB Small Business Economic Trends William C. Dunkelberg Holly Wade January 21 Based on a Survey of Small and Independent Business Owners SMALL BUSINESS OPTIMISM INDEX COMPONENTS Seasonally Change From
William C. Dunkelberg Holly Wade SMALL BUSINESS OPTIMISM INDEX COMPONENTS
 NFIB Small Business Economic Trends William C. Dunkelberg Holly Wade November 29 Based on a Survey of Small and Independent Business Owners SMALL BUSINESS OPTIMISM INDEX COMPONENTS Seasonally Change From
William C. Dunkelberg Holly Wade SMALL BUSINESS OPTIMISM INDEX COMPONENTS
 NFIB Small Business Economic Trends William C. Dunkelberg Holly Wade May 9 Based on a Survey of Small and Independent Business Owners SMALL BUSINESS OPTIMISM INDEX COMPONENTS Seasonally Change From Contribution
Economic Outlook Survey
 Economic Outlook Survey 3rd quarter executive summary The CPA Outlook Index The CPA Outlook Index (CPAOI) is a broad-based indicator of the strength of U.S. business activity and economic direction that
2012 Business Outlook
 New Jersey Business & Industry Association (NJBIA) 53rd Annual Business Outlook Survey 2012 Business Outlook Slow, Steady Gains in Sales, Profits & Spending in 2011. Matched by Expectations for More of
2015 American Express OPEN Small Business Monitor Outlook of Small Business Owners by Sector
 2015 American Express OPEN Small Business Monitor Outlook of Small Business Owners by Sector Services industry businesses have the most positive outlook compared to other industries; Construction industry
NAM MANUFACTURERS OUTLOOK SURVEY THIRD QUARTER 2017 September 29, 2017
 NAM MANUFACTURERS OUTLOOK SURVEY THIRD QUARTER 2017 September 29, 2017 Percentage of Respondents Positive in Their Own Company s Outlook 89.8% (June: 89.5%) Small Manufacturers: 85.1% (June: 84.8%) Medium-Sized
Metro Milwaukee Business Outlook Survey First-Quarter, 2019
 Metro Milwaukee Business Outlook Survey First-Quarter, 2019 Prepared by: Economic Research Division January 21, 2018 Metropolitan Milwaukee Association of Commerce www.mmac.org www.mmac.org Metro Milwaukee
Second Quarter 2016 Volume 9, number 2 colorado.edu/business/brd
 Second Quarter 2016 Volume 9, number 2 colorado.edu/business/brd Summary Stable Expectations The panel of business leaders surveyed in the Leeds Business Confidence Index (LBCI) reported steady optimism
Baseline U.S. Economic Outlook, Summary Table*
 January 19 Gus Faucher Stuart Hoffman William Adams Kurt Rankin Abbey Omodunbi Chief Economist Senior Economic Advisor Senior Economist Economist Economist Executive Summary Great December Jobs Report;
58 th Annual Business Outlook Survey
 58 th Annual Business Outlook Survey Navigating 2017: Optimism continues with sales, profits and hiring expected to rise. Executive Summary NJBIA s 58 th annual Business Outlook Survey tells a vivid story
NFIB SMALL BUSINESS ECONOMIC TRENDS
 NFIB SMALL BUSINESS ECONOMIC TRENDS William C. Dunkelberg Holly Wade November 218 SMALL BUSINESS OPTIMISM INDEX COMPONENTS Index C omponent Seasonally A djusted Level Change from Last Month Contribution
Empire State Manufacturing Survey
 December 16 Empire State Manufacturing Survey Business activity grew modestly in New York State, according to firms responding to the December 16 Empire State Manufacturing Survey. The headline general
NFIB SMALL BUSINESS. William C. Dunkelberg Holly Wade SMALL BUSINESS OPTIMISM INDEX COMPONENTS. Seasonally Adjusted Level
 NFIB SMALL BUSINESS ECONOMIC TRENDS William C. Dunkelberg Holly Wade 21 Based on a Survey of Small and Independent Business Owners SMALL BUSINESS OPTIMISM INDEX COMPONENTS Index Component Seasonally Adjusted
NEW ORLEANS REGIONAL COUNCIL FOR BUSINESS ECONOMICS
 Monthly Non-Farm Employment Jan. 2008 Apr Jul Jan.2009 Jan. 2010 Jan.2011 Jan.2012 Jan.2013 Jan.2014 Jan. 2015 Jan. 2016 Jan.2017 2017 THE NEW ORLEANS REGIONAL ECONOMIC INDEX NEW ORLEANS REGIONAL COUNCIL
QUARTERLY INDICATORS Southern Nevada Business Confidence Index
 Second Quarter 2018 Economic Outlook: Global, National, and Local U.S. real gross domestic product (GDP) for the fourth quarter of 2017 expanded at an annualized rate of 2.9 percent, after two consecutive
NFIB SMALL BUSINESS. William C. Dunkelberg Holly Wade SMALL BUSINESS OPTIMISM INDEX COMPONENTS
 NFIB SMALL BUSINESS ECONOMIC TRENDS William C. Dunkelberg Holly Wade October 21 Based on a Survey of Small and Independent Business Owners SMALL BUSINESS OPTIMISM INDEX COMPONENTS Seasonally Change From
SURVEY OF GOVERNMENT CONTRACTOR SALES EXPECTATIONS
 SURVEY OF GOVERNMENT CONTRACTOR SALES EXPECTATIONS 2017-18 Executive Summary... 03 Introduction... 05 Profile of Government Contractors Surveyed... 06 TABLE OF CONTENTS Onvia Government Contractor Confidence
NFIB SMALL BUSINESS ECONOMIC TRENDS
 NFIB SMALL BUSINESS ECONOMIC TRENDS William C. Dunkelberg Holly Wade August 218 SMALL BUSINESS OPTIMISM INDEX COMPONENTS Index C omponent Seasonally A djusted Level Change from Last Month Contribution
The Outlook for the U.S. Economy March Summary View. The Current State of the Economy
 The Outlook for the U.S. Economy March 2010 Summary View The Current State of the Economy 8% 6% Quarterly Change (SAAR) Chart 1. The Economic Outlook History Forecast The December 2007-2009 recession is
Florida: An Economic Overview
 Florida: An Economic Overview July 23, 2010 Presented by: The Florida Legislature Office of Economic and Demographic Research 850.487.1402 http://edr.state.fl.us Economy Lost Ground in 2008 Florida s growth
Empire State Manufacturing Survey.
 October 217 Empire State Manufacturing Survey Business activity grew at a robust pace in New York State, according to firms responding to the October 217 Empire State Manufacturing Survey. The headline
NFIB SMALL BUSINESS. William C. Dunkelberg Holly Wade SMALL BUSINESS OPTIMISM INDEX COMPONENTS
 NFIB SMALL BUSINESS ECONOMIC TRENDS William C. Dunkelberg Holly Wade April 211 Based on a Survey of Small and Independent Business Owners SMALL BUSINESS OPTIMISM INDEX COMPONENTS Seasonally Change From
Comptroller of the Currency Administrator of National Banks. Survey of Credit Underwriting Practices 2001
 Comptroller of the Currency Administrator of National Banks Survey of Credit Underwriting Practices Comptroller of the Currency Administrator of National Banks Washington, DC 20219 June To: Board Members
AICPA Business & Industry U.S. Economic Outlook Survey 3Q 2014
 AICPA Business & Industry U.S. Economic Outlook Survey 3Q 2014 The CPA Outlook Index The CPA Outlook Index (CPAOI) is a broad-based indicator of the strength of US business activity and economic direction
NFIB SMALL BUSINESS. William C. Dunkelberg Holly Wade SMALL BUSINESS OPTIMISM INDEX COMPONENTS. Seasonally Adjusted Level
 NFIB SMALL BUSINESS ECONOMIC TRENDS William C. Dunkelberg Holly Wade January 218 Based on a Survey of Small and Independent Business Owners SMALL BUSINESS OPTIMISM INDEX COMPONENTS Index Component Seasonally
ECO155L19.doc 1 OKAY SO WHAT WE WANT TO DO IS WE WANT TO DISTINGUISH BETWEEN NOMINAL AND REAL GROSS DOMESTIC PRODUCT. WE SORT OF
 ECO155L19.doc 1 OKAY SO WHAT WE WANT TO DO IS WE WANT TO DISTINGUISH BETWEEN NOMINAL AND REAL GROSS DOMESTIC PRODUCT. WE SORT OF GOT A LITTLE BIT OF A MATHEMATICAL CALCULATION TO GO THROUGH HERE. THESE
Leeds Business Confidence Index
 Fourth Quarter 2017 Volume 10, number 4 colorado.edu/business/brd Leeds Business Confidence Index Cools Ahead of Q4 2017 The Leeds Business Confidence Index (LBCI) captures Colorado business leaders expectations
NFIB SMALL BUSINESS. William C. Dunkelberg Holly Wade SMALL BUSINESS OPTIMISM INDEX COMPONENTS
 NFIB SMALL BUSINESS ECONOMIC TRENDS William C. Dunkelberg Holly Wade June 21 Based on a Survey of Small and Independent Business Owners SMALL BUSINESS OPTIMISM INDEX COMPONENTS Seasonally Change From Contribution
61.0% (June: 61.7%) 41.8 (June: 42.3) 1.9% 2.1% 0.4% 0.8% 0.4% 0.8% 0.7% 1.7% 8.5% Manufacturing Outlook. Expected Growth Rate Over the Next 12 Months
 41.8 (June: 42.3) 1.9% 2.1% 0.4% 0.8% 0.4% 0.8% 0.7% 1.7% 8.5% Manufacturing Outlook. Expected Growth Rate Over the Next 12 Months") Manufacturing Outlook PERCENTAGE OF RESPONDENTS POSITIVE IN THEIR OWN COMPANY S OUTLOOK 61.0% (June: 61.7%) Small Manufacturers: 48.7% (June: 56.1%) Medium-Sized Manufacturers: 64.0% (June: 64.2%) Large
Manufacturing Outlook PERCENTAGE OF RESPONDENTS POSITIVE IN THEIR OWN COMPANY S OUTLOOK 61.0% (June: 61.7%) Small Manufacturers: 48.7% (June: 56.1%) Medium-Sized Manufacturers: 64.0% (June: 64.2%) Large
NFIB SMALL BUSINESS. William C. Dunkelberg Holly Wad SMALL BUSINESS OPTIMISM INDEX COMPONENTS. Seasonally Adjusted Level
 NFIB SMALL BUSINESS ECONOMIC TRENDS William C. Dunkelberg Holly Wad November 212 Based on a Survey of Small and Independent Business Owners SMALL BUSINESS OPTIMISM INDEX COMPONENTS Index Component Seasonally
CPA Canada Q Business Monitor
 CPA Canada Q3 Business Monitor Background document On behalf of: Chartered Professional Accountants of Canada October 13, Study Information The CPA Canada Business Monitor is issued quarterly, based on
AICPA Business & Industry U.S. Economic Outlook Survey 2Q 2014
 AICPA Business & Industry U.S. Economic Outlook Survey 2Q 2014 The CPA Outlook Index The CPA Outlook Index (CPAOI) is a broad-based indicator of the strength of US business activity and economic direction
WELCOME TO THE FOURTH QUARTER
 LPL RESEARCH WEEKLY MARKET COMMENTARY IBG FINANCIAL ADVISORS October 3 2016 WELCOME TO THE FOURTH QUARTER Burt White Chief Investment Officer, LPL Financial Ryan Detrick, CMT Senior Market Strategist,
RETAIL CONCERN GROWS
 MEDIA RELEASE Embargoed 1:am Tuesday 3 April 12 RETAIL CONCERN GROWS Concerns over staffing costs and online competition dampen retail outlook ers are increasingly concerned over the pressure staffing
NFIB SMALL BUSINESS. William C. Dunkelberg Holly Wade SMALL BUSINESS OPTIMISM INDEX COMPONENTS. Seasonally Adjusted Level
 NFIB SMALL BUSINESS ECONOMIC TRENDS William C. Dunkelberg Holly Wade November 213 Based on a Survey of Small and Independent Business Owners SMALL BUSINESS OPTIMISM INDEX COMPONENTS Index Component Seasonally
NFIB SMALL BUSINESS. William C. Dunkelberg Holly Wade SMALL BUSINESS OPTIMISM INDEX COMPONENTS. Seasonally Adjusted Level
 NFIB SMALL BUSINESS ECONOMIC TRENDS William C. Dunkelberg Holly Wade March 218 Based on a Survey of Small and Independent Business Owners SMALL BUSINESS OPTIMISM INDEX COMPONENTS Index Component Seasonally
2011 Year-End Economic Report
 2011 Year-End Economic Report 2011 Year-End Economic Report 2 National Small Business Association Started in 1937, NSBA is the nation s oldest small-business advocacy group representing employers in every
Empire State Manufacturing Survey.
 March 218 Empire State Manufacturing Survey Business activity grew robustly in New York State, according to firms responding to the March 218 Empire State Manufacturing Survey. The headline general business
NIELSEN: HONG KONG EXPERIENCES HIGHEST RISE IN CONSUMER CONFIDENCE AMONG 29 COUNTRIES SURVEYED IN THE FOURTH QUARTER
 The Nielsen Company www.nielsen.com News Release FOR IMMEDIATE RELEASE CONTACT: Acky Chan Tel: (852) 2856 7337 / 9223 5793 Email: acky.chan@nielsen.com NIELSEN: HONG KONG EXPERIENCES HIGHEST RISE IN CONSUMER
59 th Annual Business Outlook Survey
 59 th Annual Business Outlook Survey Optimistic outlook reported on many fronts, but pending issues and existing challenges a concern in the new year. Executive Summary The results of NJBIA s 59 th Annual
Survey of Credit Underwriting Practices Office of the Comptroller of the Currency National Credit Committee October 2004
 Survey of Credit Underwriting Practices 2004 Office of the Comptroller of the Currency National Credit Committee October 2004 Table of Contents Introduction 3 Part I: Overall Results Primary Findings 4
BUSINESS ROUNDTABLE ANNOUNCES FOURTH QUARTER CEO ECONOMIC OUTLOOK SURVEY RESULTS
 BUSINESS ROUNDTABLE ANNOUNCES FOURTH QUARTER CEO ECONOMIC OUTLOOK SURVEY RESULTS SPEAKER: TERRY MCGRAW, CHAIRMAN, BUSINESS ROUNDTABLE CHAIRMAN, PRESIDENT AND CEO, THE MCGRAW-HILL COMPANIES THURSDAY, DECEMBER
NFIB SMALL BUSINESS ECONOMIC TRENDS
 NFIB SMALL BUSINESS ECONOMIC TRENDS William C. Dunkelberg Holly Wade February 19 SMALL BUSINESS OPTIMISM INDEX COMPONENTS Index C omponent Seasonally A djusted Level Change from Last Month Contribution
Banks at a Glance: Economic and Banking Highlights by State 2Q 2018
 Economic and Banking Highlights by State 2Q 2018 These semi-annual reports highlight key indicators of economic and banking conditions within each of the nine states comprising the 12th Federal Reserve
NFIB SMALL BUSINESS. William C. Dunkelberg Holly Wade SMALL BUSINESS OPTIMISM INDEX COMPONENTS
 NFIB SMALL BUSINESS ECONOMIC TRENDS William C. Dunkelberg Holly Wade February 211 Based on a Survey of Small and Independent Business Owners SMALL BUSINESS OPTIMISM INDEX COMPONENTS Seasonally Change From
BANK EXECUTIVE BUSINESS OUTLOOK SURVEY 2018, Q1
 BANK EXECUTIVE BUSINESS OUTLOOK SURVEY 2018, INTRODUCTION What a difference three months make. After a fourth quarter jump in, both the Bank Experience Index SM and the Bank Confidence Index SM dropped
Florida: An Economic Overview
 Florida: An Economic Overview November 15, 2010 Presented by: The Florida Legislature Office of Economic and Demographic Research 850.487.1402 http://edr.state.fl.us Economy Lost Ground in 2008 Florida
2012 Automotive Industry Outlook Survey:
 12 Automotive Industry Outlook Survey: Bullish Industry Faces Headwinds kpmg.com KPMG s 12 Industry Outlook Survey KPMG LLP, the audit, tax, and advisory firm, surveyed more than C-suite and other top-level
Empire State Manufacturing Survey
 November 216 Empire State Manufacturing Survey Business activity stabilized in New York State, according to firms responding to the November 216 Empire State Manufacturing Survey. The headline general
Commercial real estate investors came
 A Special Research Report Déjà vu: Investor Sentiment Resets to Pre-Tax Reform Levels Investors are confident about property performance outlook, even as they prepare for a rising interest rate climate.
Florida: An Economic Overview
 Florida: An Economic Overview June 17, 2010 Presented by: The Florida Legislature Office of Economic and Demographic Research 850.487.1402 http://edr.state.fl.us Economy Lost Ground in 2008 Florida s growth
NFIB SMALL BUSINESS ECONOMIC TRENDS
 NFIB SMALL BUSINESS ECONOMIC TRENDS William C. Dunkelberg Holly Wade January 19 SMALL BUSINESS OPTIMISM INDEX COMPONENTS Index C omponent Seasonally A djusted Level Change from Last Month Contribution
NFIB SMALL BUSINESS. William C. Dunkelberg Holly Wad SMALL BUSINESS OPTIMISM INDEX COMPONENTS. Seasonally Adjusted Level
 NFIB SMALL BUSINESS ECONOMIC TRENDS William C. Dunkelberg Holly Wad December 214 Based on a Survey of Small and Independent Business Owners SMALL BUSINESS OPTIMISM INDEX COMPONENTS Index Component Seasonally
EXECUTIVE BUSINESS CLIMATE SURVEY REPORT
 EXECUTIVE BUSINESS CLIMATE SURVEY REPORT Fourth Quarter, 2018 Prepared in partnership with: and The Regional Economic Research Institute Florida Gulf Coast University Project Staff Dr. Christopher Westley,
Manufacturing Barometer
 Special topic: Diversity and inclusion Manufacturing Barometer Business outlook report July 2016 Contents 1 Quarterly highlights 1.1 Key indicators for the business outlook 8 2 Economic views 2.1 View
RSM US MIDDLE MARKET BUSINESS INDEX IN PARTNERSHIP WITH THE U.S. CHAMBER OF COMMERCE Q4 2018
 BUSINESS INDEX IN PARTNERSHIP WITH THE U.S. CHAMBER OF COMMERCE IN PARTNERSHIP WITH THE U.S. CHAMBER OF COMMERCE RSM US LLP and The Harris Poll have collected data on middle market firms from a quarterly
Metro Milwaukee Business Outlook Survey Fourth-Quarter, 2016
 Metro Milwaukee Business Outlook Survey Fourth-Quarter, 2016 Prepared by: Economic Research Division September 27, 2016 Metropolitan Milwaukee Association of Commerce www.mmac.org www.mmac.org Metro Milwaukee
Quality of Life in Nonmetropolitan Nebraska: Perceptions of Well-Being and Church Life: 2012 Nebraska Rural Poll Results: A Research Report
 University of Nebraska - Lincoln DigitalCommons@University of Nebraska - Lincoln Publications from the Center for Applied Rural Innovation (CARI) CARI: Center for Applied Rural Innovation 7-2012 Quality
Community and Economic Development
 192 193 194 195 196 197 198 199 2 21 22 23 24 2-1 Lycoming County Comprehensive Plan Update 218 Community and Economic Development At a Glance Over the last ten years, has experienced a decline in population,
Economic and Financial Markets Monthly Review & Outlook Detailed Report October 2017
 Economic and Financial Markets Monthly Review & Outlook Detailed Report October 17 NOT FDIC INSURED NO BANK GUARANTEE MAY LOSE VALUE Overview of the Economy Business and economic confidence indicators
NFIB SMALL BUSINESS. William C. Dunkelberg Holly Wad SMALL BUSINESS OPTIMISM INDEX COMPONENTS. Seasonally Adjusted Level
 NFIB SMALL BUSINESS ECONOMIC TRENDS William C. Dunkelberg Holly Wad January 214 Based on a Survey of Small and Independent Business Owners SMALL BUSINESS OPTIMISM INDEX COMPONENTS Index Component Seasonally
EMBARGOED UNTIL DECEMBER 6, US-China Business Council 2017 Member Survey
 UNTIL DECEMBER 6, 2017 US-China Business Council 2017 Member Survey Two main takeaways 1. MARKET IMPROVEMENT (IF YOU HAVE ACCESS) Improved sales performance versus a year ago: 75 percent expect revenue