Colorado and Eagle County
|
|
|
- Noreen Philomena Barnett
- 5 years ago
- Views:
Transcription
1 Colorado and Eagle County Population and Economic Transitions Vail Symposium 2017 Elizabeth Garner State Demography Office Colorado Department of Local Affairs Demography.dola.colorado.gov
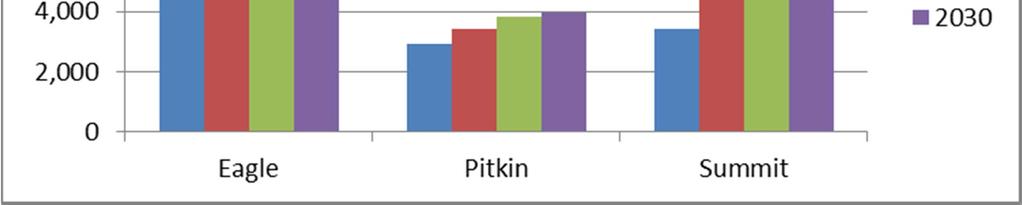
2 Ideas Demographics Trends in growth, aging, workforce Comparison to other rural resort Pitkin, Summit, Routt, Front range, Eagle comparison to whole Trends impacting Eagle, Labor Market
3 Transitions to Watch Migration attracting and retaining the best and brightest. Industrial transitions Retail consolidation Manufacturing, Transportation, Construction more automation Aging will impact economy. Increase racial and ethnic diversity Slowing labor force growth Growing and slowing
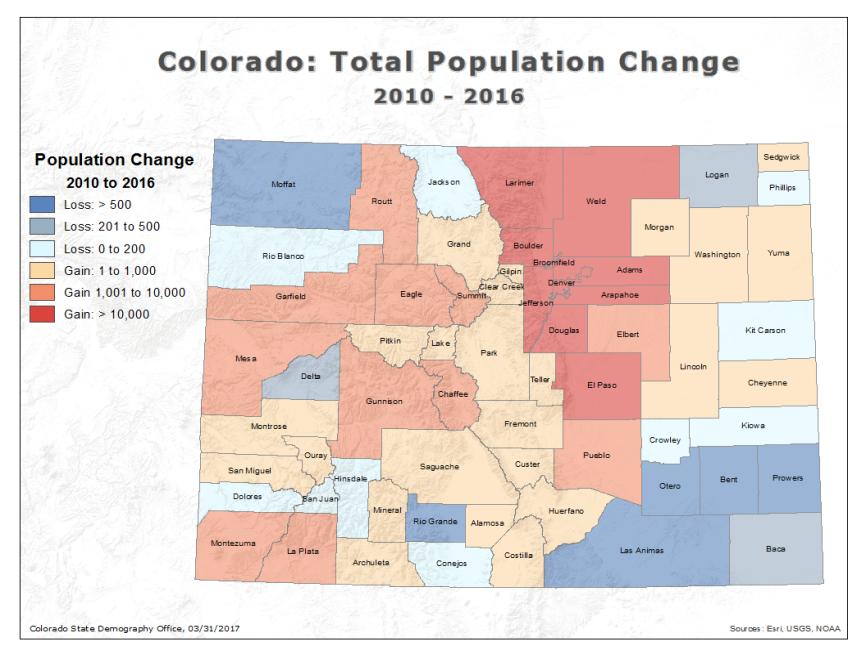
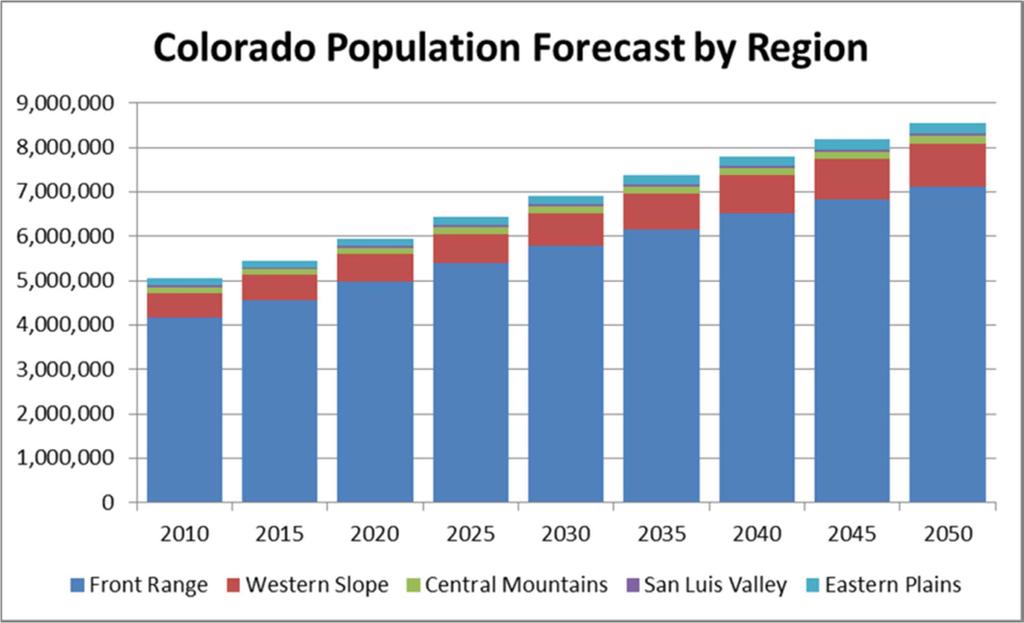
4 Big Picture Pop Change US million, million or.7% Colorado - 5,540,500 Ranked 7 th fastest 1.7% - UT, NV, ID, FL, WA, OR 8 th absolute growth 91,700 TX, FL, CA, WA, AZ, NC, GA Range in Colorado +14,000-50
5 Eagle Population Trends Eagle County Population Change by Place Ch Ann. Ave Ch. Unincorp. Area 23,167 22,976 23,077 23,252 23,411 23,592 23, % Gypsum 6,475 6,445 6,468 6,628 6,748 6,856 6, % Eagle 6,491 6,447 6,471 6,511 6,573 6,661 6, % Avon 6,425 6,372 6,399 6,441 6,484 6,523 6, % Vail 5,288 5,240 5,254 5,297 5,322 5,439 5, % Basalt (Part) 2,918 2,889 2,897 2,914 2,925 2,937 2, % Minturn 1,027 1,017 1,019 1,025 1,029 1,033 1, % Red Cliff % Eagle County 52,057 51,649 51,849 52,334 52,761 53,320 53,928 1, %
6
7
8
9
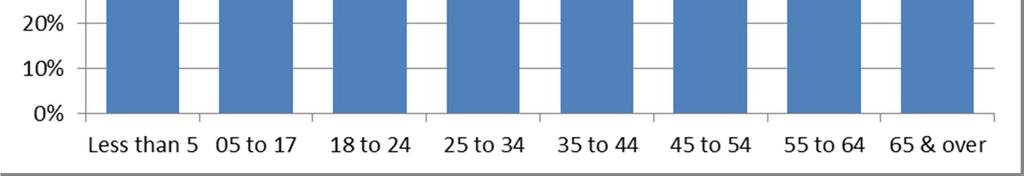
10 Age
11 Eagle Migration by Age Source: State Demography Office
12 Colorado State to State Migration 2015 State to State Migration In Out Net California Texas California Texas California Illinois Florida Arizona Wisconsin Illinois Florida Virginia Arizona Wyoming Florida ACS 2015, Census Bureau
13 Eagle Migration Trends In Out Net Pitkin Denver Custer Denver Arapahoe Hampshire, MA Europe Garfield Delta Custer Pitkin Anchorage, AK Hampshire, MA El Paso Charlotte, FL Jefferson Jefferson Miami-Dade. FL Delta Yavapai, AZ San Diego, CA Anchorage, AK Beaufort, SC Pitkin Charlotte, FL Larimer Johnson, IA Miami-Dade, FL Ellis, KS Douglas Source: ACS
14 100,000 80,000 Colorado New Jobs and Net Migration New Jobs Net Migration 60,000 40,000 20, ,000 40,000 State Demography Office v2015
15 State Demography Office v2015

16
17
18
19 Eagle Employment Pre-Recession to Current QCEW Employment Change from Peak OYT Chg OTY % Total, All Industries 32,256 31,714 (542) -1.7% Accommodation and Food Services 7,412 7, % Arts, Entertainment, and Recreation 4,953 3,795 (1,158) -23.4% Retail Trade 3,466 3, % Construction 3,456 3,193 (263) -7.6% Administrative and Waste Services 1,814 2, % Health Care and Social Assistance 1,754 2, % Real Estate and Rental and Leasing 1,588 1, % Public Administration 1,393 1, % Educational Services 1,393 1, % Professional and Technical Services 1,186 1, % Other Services, Ex. Public Admin 1,116 1,027 (89) -8.0% Transportation and Warehousing % Wholesale Trade (9) -1.7% Finance and Insurance % Manufacturing (13) -3.2% Information (63) -16.6% Utilities % Management of Companies (63) -41.7% Agriculture, Forestry, Fishing & Hunting (8) -13.1% Mining %


20 Eagle Over The Year Change
21 AGE
22
23
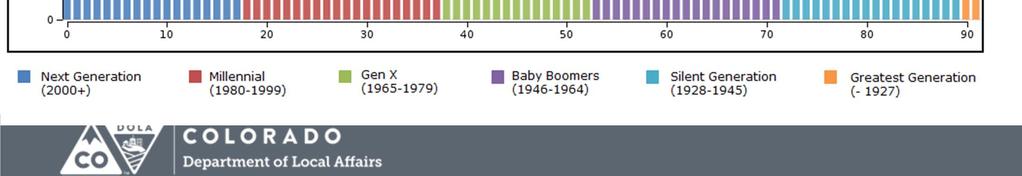
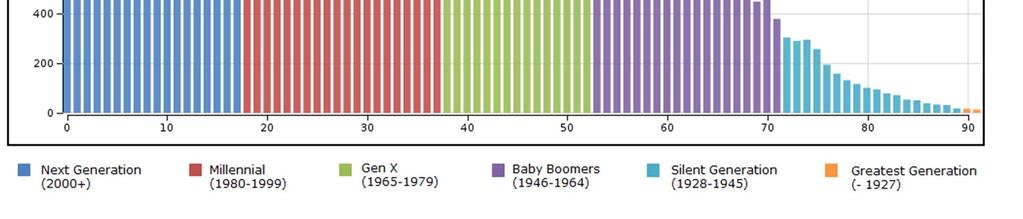
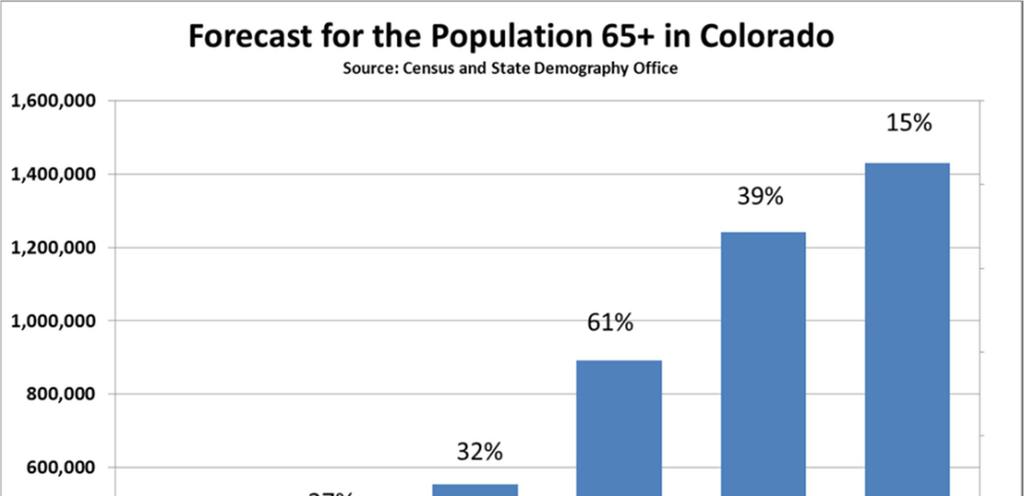
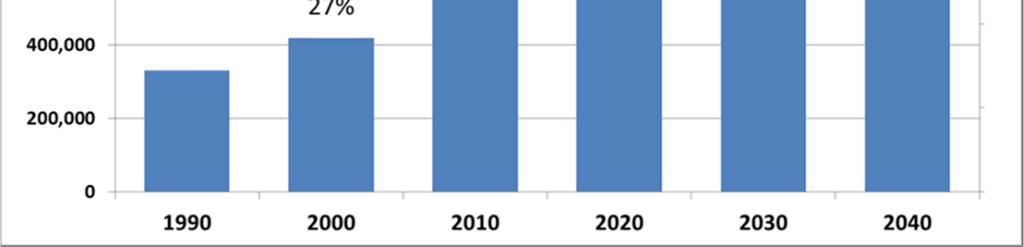
24 Why Are We Getting Old Fast? Currently very few people over the age th lowest share of all states in US (13%) in 2015 Baby Boomers Born ,360,000 Boomers in Colorado (25% of pop. in 2015) By 2030, Colorado s population 65+ will be 77% larger than it was in 2015 growing from 719,000 to 1,270,000. (primarily from aging) Transition age distribution from young to more US average between 2015 and State Demography Office, Census Bureau
25


26 Growth in young adults due to migration Demographic Dividend AGE
27
28 Aging Issues Numbers Economic Driver - wealthier. depends Impact on occupational mix. Growing at 6% per year Labor Force Housing Income Downward Pressure Health Disabilities Transportation Public Finance Downward Pressure
29 Population 65+ Trends Migration of the Eagle Pitkin Routt Summit Population Turning Eagle Pitkin Routt Summit
30 Labor Force Boomers are 37% of the labor force (2010) Staying longer in workforce want and need to Participation rates for ages 65+ increasing. Age relations in the workplace Approx. 1,000,000 workers aging out the next 20 years. Increase demands on labor force Demands will vary by industry Education, Health, Utilities, Mining, Govt. Current low numbers of Long Term Care Workers and Gerontologist Doctors accepting Medicare Increase in demand for caregivers informal sector Metro/urban demands will impact rural areas
31 Labor Force tightening forces Female share of the labor force peaked in 2010 at 46%. Structural labor force participation rates peaked in Growth in Leavers (exiting the labor force) will create more demand for workers. Fewer Gen X Higher un/under employment for year olds. Other states experiencing same concerns. Aging around the world.

32 APRIL 2017 UNEMPLOYMENT RATES (UNADJUSTED) Routt 1.8% Summit 1.3% Garfield 2.3% Pitkin 2.3%
33
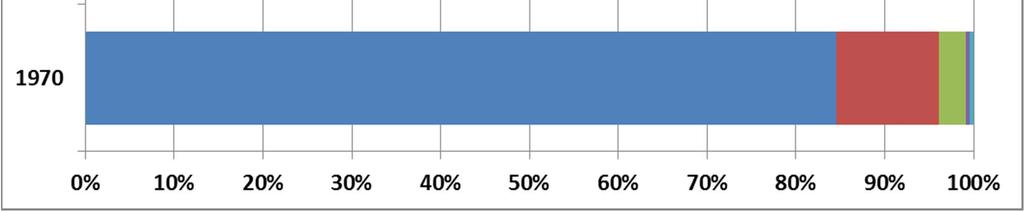
34 More Ethnically Diverse

35

36 Census Bureau
37 Share of Net Increase in Working Age Population, American Indian, NH Black, NH White, NH Asian, NH Hispanic 0% 20% 40% 60% 80%
38 Growing and Slowing
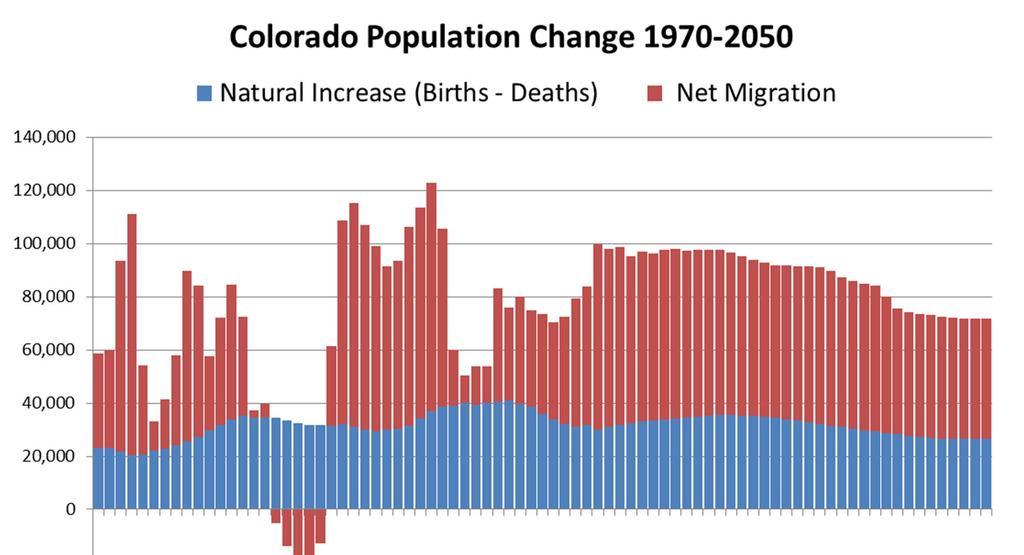
39 Population forecast methodology Economic forecast Jobs -2 nd & 3 rd job - Commuters Cohort-component +Births - Deaths + Net Migration X LFPR Labor Demand Labor Supply Differences resolved by net migration
40 100,000 80,000 Colorado New Jobs and Net Migration New Jobs Net Migration 60,000 40,000 20, ,000 40,000 State Demography Office v2015
41
42

43
44
45 Eagle Forecast Current Conditions Growth TRADITIONAL INDUSTRIAL 1,972 2,021 2,207 2,366 2,506 2, REGIONAL & NATIONAL SERVICES 3,108 3,392 3,694 3,936 4,190 4,387 1,279 TOURISM 16,195 17,815 18,222 18,977 19,637 20,579 4,384 COMMUTING JOBS 532 (266) (313) (448) (615) (845) NA RETIREE GENERATED JOBS 2,188 3,485 4,852 5,867 6,606 7,147 4,959 PUBLIC ASST. GENERATED JOBS INVESTMENT INCOME & WEALTH 2,894 3,426 3,780 4,241 4,747 5,311 2,417 TOTAL DIRECT BASIC JOBS 27,487 30,514 33,146 35,698 37,908 40,130 12,643 NON BASIC RESIDENT SV. JOBS 12,275 14,871 17,096 19,567 21,994 24,489 12,214 TOTAL JOBS 39,762 45,385 50,243 55,265 59,902 64,619 24,858 JOBS HELD BY RESIDENTS 35,257 38,575 43,186 48,693 54,390 59,189 23,933 POPULATION 53,580 60,579 68,393 76,581 85,174 93,481 39,901

46 Home to Work in Eagle Commuting Source: OntheMap 2014

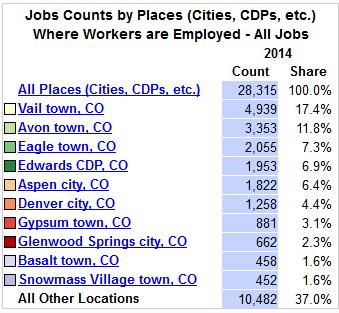
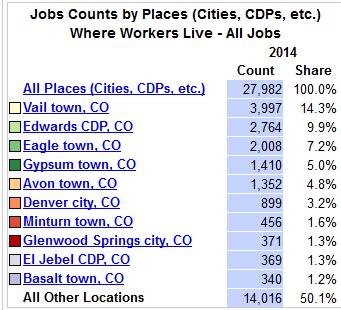
47 Commuting in Eagle
48 To Ponder Migration how much, where, and can we compete for the best and the brightest? Aging we are getting old fast, is the state ready for the opportunities and changes to the labor force, income, industrial mix, housing, etc. Growth disparate across the state, what is causing it and what can be done? Can linkages be created between Metro and Non-Metro Ethnic/race diversity increasing and aging into labor force. Educational attainment gap continues putting downward pressure on income.
49 Thank you State Demography Office Department of Local Affairs Elizabeth Garner Demography.dola.colorado.gov
Transitions. Population and Economic Trends For Northern Colorado
 Transitions Population and Economic Trends For Northern Colorado EDCC 2017 Elizabeth Garner State Demography Office Colorado Department of Local Affairs Demography.dola.colorado.gov Transitions to Watch
Transitions. Population and Economic Trends for Colorado and Garfield County
 Transitions Population and Economic Trends for Colorado and Garfield County Elizabeth Garner State Demography Office Colorado Department of Local Affairs Summer 2016 www.colorado.gov/demography Main Points
Growing Colorado. Population Transitions In Boulder
 Growing Colorado Population Transitions In Boulder Elizabeth Garner State Demography Office Colorado Department of Local Affairs 2018 Demography.dola.colorado.gov Transitions to Watch Disparate growth
Regional Issues Forum Labor Force Trends in Northern Colorado
 Regional Issues Forum Labor Force Trends in Northern Colorado Elizabeth Garner State Demography Office Colorado Department of Local Affairs 2015 www.colorado.gov/demography Big Picture - 2013-2014 Pop
Transitions. Population and Economic Trends for Colorado
 Transitions Population and Economic Trends for Colorado Cindy DeGroen State Demography Office Colorado Department of Local Affairs 2016 www.colorado.gov/demography State Demography Office State agency
POPULATION AND ECONOMIC OVERVIEW. State Demography Office Colorado Department of Local Affairs February 2014
 POPULATION AND ECONOMIC OVERVIEW State Demography Office Colorado Department of Local Affairs February 2014 Big Picture 2011-2012 Pop Change US 313 million, + 2.3 million or.7% Colorado 5,189,458, + 70,157
Rifle city Demographic and Economic Profile
 Rifle city Demographic and Economic Profile Community Quick Facts Population (2014) 9,289 Population Change 2010 to 2014 156 Place Median HH Income (ACS 10-14) $52,539 State Median HH Income (ACS 10-14)
NORTH CENTRAL COLORADO
 DOLA Planning and Management Region 2 Socioeconomic Profile Regional Profile NORTH CENTRAL COLORADO The central work of the State Demography Office is the research and production of population data and
Monte Vista Population, ,744 4,651 4,564 4,467 4,458 4,432 4,451
 1 Monte Vista 4,8 4,7 4,6 4,5 4,4 4,3 4,2 4,1 4,61 4,612 4,61 4,676 Monte Vista, 2-213 4,744 4,651 4,564 4,467 4,458 4,432 4,451 4,418 4,412 4,355 2 21 22 23 24 25 26 27 28 29 21 211 212 213 Year Monte
ECONOMIC OUTLOOK GROWING BUT SLOWING. Chris Akers State Demography Office November 4, 2016
 z ECONOMIC OUTLOOK GROWING BUT SLOWING Chris Akers State Demography Office November 4, 2016 OVERVIEW Global Economic Outlook Better in 2017 U.S. Economic Overview Slowing Job Growth Colorado 2015 Economic
BROWARD COUNTY LABOR FORCE
 BROWARD COUNTY LABOR FORCE Broward County s has a workforce of 978,000 people, including 54,000 self-employed. Twenty-three percent of residents commute to a job outside Broward County and five percent
Regional Socio-Economic Profile
 Overview The central work of the State Demography Office is the research and production of population data and information and of the forces (fertility, mortality, migration) that lead to population change.
Minnesota Energy Industry
 Energy Industry Jobs Q3 2000 Q3 2001 Q3 2002 Q3 2003 Q3 2004 Q3 2005 Q3 2006 Q3 2007 Q3 2008 Q3 2009 Q3 2010 Q3 2011 Q3 Q3 Q3 Q3 Q3 2016 Minnesota Energy Consortium April 13, 2017 Cameron Macht DEED Labor
TABLE OF CONTENTS INTRODUCTION... 1
 TABLE OF CONTENTS INTRODUCTION... GENERAL WORKFORCE TRENDS... 3 General Workforce Trends and Comparisons Overview... 5 State Government Employees to State Population... 6 State Government Full-Time Equivalent
DEMOGRAPHY AND THE ECONOMY
 DEMOGRAPHY AND THE ECONOMY David Keyser State Demography Office September 22, 2011 Colorado.gov/demography Demography Powerful Big changes often predictable Informative Today Information about us Role
Economic Overview City of Tyler, TX. January 8, 2018
 Economic Overview City of Tyler, TX January 8, 2018 DEMOGRAPHIC PROFILE...3 EMPLOYMENT TRENDS...5 WAGE TRENDS...5 COST OF LIVING INDEX...6 INDUSTRY SNAPSHOT...7 OCCUPATION SNAPSHOT...9 INDUSTRY CLUSTERS...
Economic Overview York County, South Carolina. February 14, 2018
 Economic Overview York County, February 14, 2018 DEMOGRAPHIC PROFILE... 3 EMPLOYMENT TRENDS... 5 UNEMPLOYMENT RATE... 5 WAGE TRENDS... 6 COST OF LIVING INDEX... 6 INDUSTRY SNAPSHOT... 7 OCCUPATION SNAPSHOT...
Economic Overview. Lawrence, KS MSA
 Economic Overview Lawrence, KS MSA March 5, 2019 DEMOGRAPHIC PROFILE... 3 EMPLOYMENT TRENDS... 5 UNEMPLOYMENT RATE... 5 WAGE TRENDS... 6 COST OF LIVING INDEX... 7 INDUSTRY SNAPSHOT... 8 OCCUPATION SNAPSHOT...
TABLE OF CONTENTS INTRODUCTION... 1
 TABLE OF CONTENTS INTRODUCTION... GENERAL WORKFORCE TRENDS... 3 General Workforce Trends and Comparisons Overview... 5 State Government Employees to State Population... 6 State Government Full-Time Equivalent
TABLE OF CONTENTS INTRODUCTION... 1
 TABLE OF CONTENTS INTRODUCTION... GENERAL WORKFORCE TRENDS... 3 General Workforce Trends and Comparisons Overview... 5 State Government Employees to State Population... 6 State Government Full-Time Equivalent
TABLE OF CONTENTS INTRODUCTION... 1
 TABLE OF CONTENTS INTRODUCTION... GENERAL WORKFORCE TRENDS... 3 General Workforce Trends and Comparisons Overview... 5 State Government Employees to State Population... 6 State Government Full-Time Equivalent
Economic Overview 45-Minute Commute From Airport Park. June 6, 2017
 Economic Overview 45-Minute Commute From Airport Park June 6, 2017 DEMOGRAPHIC PROFILE... 3 EMPLOYMENT TRENDS... 5 WAGE TRENDS... 5 COST OF LIVING INDEX... 6 INDUSTRY SNAPSHOT... 7 OCCUPATION SNAPSHOT...
THREE DISPARATE CHICAGO-AREA HOUSING MARKETS
 Manufactured Housing Community Council ULI 2008 FALL MEETING MIAMI, FLA OCTOBER 27-28, 2008 Understanding Demographics/Market Analysis: THREE DISPARATE CHICAGO-AREA HOUSING MARKETS Three Disparate Chicago-area
Health and Health Coverage in the South: A Data Update
 February 2016 Issue Brief Health and Health Coverage in the South: A Data Update Samantha Artiga and Anthony Damico With its recent adoption of the Affordable Care Act (ACA) Medicaid expansion to adults,
Economic Overview New York
 Report created on October 20, 2015 Economic Overview Created using: Contact: Lisa.Montiel@suny.edu DEMOGRAPHIC PROFILE...3 EMPLOYMENT TRENDS...5 UNEMPLOYMENT RATE...5 WAGE TRENDS...6 COST OF LIVING INDEX...6
ECONOMIC OVERVIEW DuPage County, Illinois
 ECONOMIC OVERVIEW DuPage County, Illinois DEMOGRAPHIC PROFILE... 3 EMPLOYMENT TRENDS... 5 UNEMPLOYMENT RATE... 5 WAGE TRENDS... 6 COST OF LIVING INDEX... 7 INDUSTRY SNAPSHOT... 8 OCCUPATION SNAPSHOT...
Economic Overview Long Island
 Report created on October 20, 2015 Economic Overview Long Island Created using: Contact: Lisa.Montiel@suny.edu DEMOGRAPHIC PROFILE...3 EMPLOYMENT TRENDS...5 UNEMPLOYMENT RATE...5 WAGE TRENDS...6 COST OF
Demographic and Economic Profile. Florida. Updated May 2006
 Demographic and Economic Profile Florida Updated May 2006 Metro and Nonmetro Counties in Florida Based on the most recent listing of core based statistical areas by the Office of Management and Budget
State Postal Abbreviation Codes
 State Postal Areviation Codes State Areviation State Areviation Alaama AL Montana MT Alaska AK Neraska NE Arizona AZ Nevada NV Arkansas AR New Hampshire NH California CA New Jersey NJ Colorado CO New Mexico
Texas Mid-Year Economic Outlook: Strong Growth Continues
 Texas Mid-Year Economic Outlook: Strong Growth Continues Keith Phillips Assistant Vice President and Senior Economist 9/27/18 The views expressed in this presentation are strictly those of the presenter
Economic Overview Plant City Region. April 5, 2017
 Economic Overview Plant City Region April 5, 2017 DEMOGRAPHIC PROFILE... 3 EMPLOYMENT TRENDS... 5 WAGE TRENDS... 5 COST OF LIVING INDEX... 6 INDUSTRY SNAPSHOT... 7 OCCUPATION SNAPSHOT... 9 INDUSTRY CLUSTERS...
Economic Overview Fairfax / Falls Church. October 23, 2017
 Economic Overview Fairfax / Falls Church October 23, 2017 DEMOGRAPHIC PROFILE... 3 EMPLOYMENT TRENDS... 5 UNEMPLOYMENT RATE... 5 WAGE TRENDS... 6 COST OF LIVING INDEX... 6 INDUSTRY SNAPSHOT... 7 OCCUPATION
June 9, Economic Overview Billings, MT MSA
 June 9, 2016 Economic Overview Billings, MT MSA DEMOGRAPHIC PROFILE... 3 EMPLOYMENT TRENDS... 5 UNEMPLOYMENT RATE... 5 WAGE TRENDS... 6 COST OF LIVING INDEX... 6 INDUSTRY SNAPSHOT... 7 OCCUPATION SNAPSHOT...
Ravenna s most significant growth occurred before Between 1960 and 1980 the city s population declined by 8.5%.
 DRAFT Ravenna Comprehensive Plan Draft May 2008 1 A Profile of Ravenna This section examines demographic trends that will affect Ravenna. The analysis examines population and demographic dynamics, including
Percent of Employees Waiving Coverage 27.0% 30.6% 29.1% 23.4% 24.9%
 Number of Health Plans Reported 18,186 3,561 681 2,803 3,088 Offer HRA or HSA 34.0% 42.7% 47.0% 39.7% 35.0% Annual Employer Contribution $1,353 $1,415 $1,037 $1,272 $1,403 Percent of Employees Waiving
While one in five Californians overall is uninsured, the rate among those who work is even higher: one in four.
 : By the Numbers December 2013 Introduction California had the greatest number of uninsured residents of any state, 7 million, and the seventh largest percentage of uninsured residents under 65 in the
Economic Overview Monterey County, California. July 22, 2016
 Economic Overview Monterey July 22, 2016 DEMOGRAPHIC PROFILE... 3 EMPLOYMENT TRENDS... 5 UNEMPLOYMENT RATE... 5 WAGE TRENDS... 6 COST OF LIVING INDEX... 6 INDUSTRY SNAPSHOT... 7 OCCUPATION SNAPSHOT...
2016 Labor Market Profile
 2016 Labor Market Profile Prepared by The Tyler Economic Development Council Tyler Area Sponsor June 2016 The ability to demonstrate a regions availability of talented workers has become a vital tool
DEMOGRAPHIC PROFILE...3 EMPLOYMENT TRENDS...5 UNEMPLOYMENT RATE...5 WAGE TRENDS...6 COST OF LIVING INDEX...6 INDUSTRY SNAPSHOT...7
 March 14, 2017 DEMOGRAPHIC PROFILE...3 EMPLOYMENT TRENDS...5 UNEMPLOYMENT RATE...5 WAGE TRENDS...6 COST OF LIVING INDEX...6 INDUSTRY SNAPSHOT...7 OCCUPATION SNAPSHOT...9 INDUSTRY CLUSTERS... 12 EDUCATION
Economic Overview Loudoun County, Virginia. October 23, 2017
 Economic Overview October 23, 2017 DEMOGRAPHIC PROFILE... 3 EMPLOYMENT TRENDS... 5 UNEMPLOYMENT RATE... 5 WAGE TRENDS... 6 COST OF LIVING INDEX... 6 INDUSTRY SNAPSHOT... 7 OCCUPATION SNAPSHOT... 9 INDUSTRY
Economic Overview Long Island
 Report created on August 29, 2017 Economic Overview Long Island Contact: Lisa.Montiel@suny.edu DEMOGRAPHIC PROFILE... 3 EMPLOYMENT TRENDS... 5 UNEMPLOYMENT RATE... 5 WAGE TRENDS... 6 COST OF LIVING INDEX...
Demographic and Economic Profile. Nevada. Updated May 2006
 Demographic and Economic Profile Nevada Updated May 2006 Metro and Nonmetro Counties in Nevada Based on the most recent listing of core based statistical areas by the Office of Management and Budget (December
Uinta Basin Energy Summit Economic Overview September 10, 2015
 Uinta Basin Energy Summit Economic Overview September 10, 2015 Overview National Economic Conditions Utah Economic Conditions Utah is One of the Fastest Growing CA States in the Country Percent Change
Economic Overview Western New York
 Report created on August 29, 2017 Economic Overview Western New Contact: Lisa.Montiel@suny.edu DEMOGRAPHIC PROFILE... 3 EMPLOYMENT TRENDS... 5 UNEMPLOYMENT RATE... 5 WAGE TRENDS... 6 COST OF LIVING INDEX...
October 28, Economic Overview Yellowstone County, Montana
 October 28, 2016 Economic Overview Yellowstone DEMOGRAPHIC PROFILE...3 EMPLOYMENT TRENDS...5 UNEMPLOYMENT RATE...5 WAGE TRENDS...6 COST OF LIVING INDEX...6 INDUSTRY SNAPSHOT...7 OCCUPATION SNAPSHOT...9
From Crisis to Transition Demographic trends and American housing futures, with lessons from Texas
 From Crisis to Transition Demographic trends and American housing futures, with lessons from Texas Rolf Pendall, Ph.D. The Urban Institute Presentation to the Bipartisan Housing Commission, San Antonio,
Utah. Demographic and Economic Profile. Metro and Nonmetro Counties in Utah
 Demographic and Economic Profile Utah Updated July 2006 Metro and Nonmetro Counties in Utah Based on the most recent listing of core based statistical areas by the Office of Management and Budget (December
Economic Overview Prince William/Manassas. October 23, 2017
 Economic Overview Prince William/Manassas October 23, 2017 DEMOGRAPHIC PROFILE... 3 EMPLOYMENT TRENDS... 5 UNEMPLOYMENT RATE... 5 WAGE TRENDS... 6 COST OF LIVING INDEX... 6 INDUSTRY SNAPSHOT... 7 OCCUPATION
Economic Overview Marlboro County Labor Shed. June 29, 2016
 Economic Overview Marlboro County Labor June 29, 2016 DEMOGRAPHIC PROFILE...3 EMPLOYMENT TRENDS...5 UNEMPLOYMENT RATE...5 WAGE TRENDS...6 COST OF LIVING INDEX...6 INDUSTRY SNAPSHOT...7 OCCUPATION SNAPSHOT...9
Demographic and Economic Profile. North Dakota. Updated June 2006
 Demographic and Economic Profile North Dakota Updated June 2006 Metro and Nonmetro Counties in North Dakota Based on the most recent listing of core based statistical areas by the Office of Management
Economic Overview Capital District
 August 29, 2017 Economic Overview Capital District Contact: Lisa.Montiel@suny.edu DEMOGRAPHIC PROFILE... 3 EMPLOYMENT TRENDS... 5 UNEMPLOYMENT RATE... 5 WAGE TRENDS... 6 COST OF LIVING INDEX... 6 INDUSTRY
City of Edmonton Population Change by Age,
 Population Change by Age, 1996-2001 2001 Edmonton Demographic Profile The City of Edmonton s 2001population increased by 49,800 since the 1996 census. Migration figures are not available at the municipal
Economic Overview Mohawk Valley
 Report created on August 29, 2017 Economic Overview Mohawk Valley Contact: Lisa.Montiel@suny.edu DEMOGRAPHIC PROFILE... 3 EMPLOYMENT TRENDS... 5 UNEMPLOYMENT RATE... 5 WAGE TRENDS... 6 COST OF LIVING INDEX...
Town Profiles: Demographic, Economic, and Housing Statistics for De Smet City and Wall Town, SOuth Dakota
 South Dakota State University Open PRAIRIE: Open Public Research Access Institutional Repository and Information Exchange Census Data Center News Releases SDSU Census Data Center 12-7-2017 Town Profiles:
THE BROWARD BENCHMARKS
 Our Economy 61 Our Economy THE BROWARD BENCHMARKS 2002 Steady employment, competitive wages and a good standard of living are important to people in Broward County, as changing economic conditions affect
Age of Insured Discount
 A discount may apply based on the age of the insured. The age of each insured shall be calculated as the policyholder s age as of the last day of the calendar year. The age of the named insured in the
Demographic and Economic Profile. New Mexico. Updated June 2006
 Demographic and Economic Profile New Mexico Updated June 2006 Metro and Nonmetro Counties in New Mexico Based on the most recent listing of core based statistical areas by the Office of Management and
Economic Overview Charlotte-Concord-Gastonia, NC-SC MSA. October 27, 2017
 Economic Overview Charlotte-Concord-Gastonia, NC-SC MSA October 27, 2017 DEMOGRAPHIC PROFILE...3 EMPLOYMENT TRENDS...5 UNEMPLOYMENT RATE...5 WAGE TRENDS...6 COST OF LIVING INDEX...6 INDUSTRY SNAPSHOT...7
A SocioEconomic Profile
 www.headwaterseconomics.org A SocioEconomic Profile Bernalillo County, New Mexico Produced by the Economic Profile System (EPS) April 6, 2007 About EPS About The Economic Profile System (EPS) This profile
Who s Above the Social Security Payroll Tax Cap? BY NICOLE WOO, JANELLE JONES, AND JOHN SCHMITT*
 Issue Brief September 2011 Center for Economic and Policy Research 1611 Connecticut Ave, NW Suite 400 Washington, DC 20009 tel: 202-293-5380 fax: 202-588-1356 www.cepr.net Who s Above the Social Security
Health Coverage for the Black Population Today and Under the Affordable Care Act
 fact sheet Health Coverage for the Black Population Today and Under the Affordable Care Act July 2013 As of 2011, 37 million individuals living in the United States identified as Black or African American.
Household Income for States: 2010 and 2011
 Household Income for States: 2010 and 2011 American Community Survey Briefs By Amanda Noss Issued September 2012 ACSBR/11-02 INTRODUCTION Estimates from the 2010 American Community Survey (ACS) and the
The Future is Here: Aging PA Taxpayers and Voters Affect Education Funding
 The Future is Here: Aging PA Taxpayers and Voters Affect Education Funding Maureen W. McClure (Ed) University of Pittsburgh Vera Krekanova (GSPIA) October 21, 2014 2 The Future We Knew Was Coming Is Here
REGIONAL SNAPSHOT. Eastern Shore Region, Virginia
 REGIONAL SNAPSHOT Eastern Shore Region, Virginia Table of contents 01 Overview 04 Labor force 02 Demography 05 Industry and occupation 03 Human capital 01 overview Eastern Shore Region, VA What is a regional
National Vital Statistics Reports
 National Vital Statistics Reports Volume 60, Number 9 September 14, 2012 U.S. Decennial Life Tables for 1999 2001: State Life Tables by Rong Wei, Ph.D., Office of Research and Methodology; Robert N. Anderson,
Uninsured Children : Charting the Nation s Progress
 Uninsured Children 2009-2011: Charting the Nation s Progress by Joan Alker, Tara Mancini, and Martha Heberlein Key Findings 1. 2. 3. While nationally children s coverage rates continued to improve, more
Health Insurance Coverage: 2001
 Health Insurance Coverage: 200 Consumer Income Issued September 2002 P60-220 Reversing 2 years of falling uninsured rates, the share of the population without health insurance rose in 200. An estimated
Demographic and Economic Profile. Kentucky. Updated June 2006
 Demographic and Economic Profile Kentucky Updated June 2006 Metro and Nonmetro Counties in Kentucky Based on the most recent listing of core based statistical areas by the Office of Management and Budget
Small Businesses in Broward There are 33,400 small businesses in Broward County, which provide 135,000 jobs and have a combined payroll of $4 billion.
 Planning Services Division February 2006 Number 43 Small Businesses in Broward There are 33,400 small businesses in Broward County, which provide 135,000 jobs and have a combined payroll of $4 billion.
Pennsylvania. Demographic and Economic Profile. Metro and Nonmetro Counties in Pennsylvania
 Demographic and Economic Profile Pennsylvania Updated June 2006 Metro and Nonmetro Counties in Pennsylvania Based on the most recent listing of core based statistical areas by the Office of Management
CURRENT DEMOGRAPHICS & CONTEXT GROWTH FORECAST SOUTHERN CALIFORNIA ASSOCIATION OF GOVERNMENTS APPENDIX
 CURRENT DEMOGRAPHICS & CONTEXT GROWTH FORECAST SOUTHERN CALIFORNIA ASSOCIATION OF GOVERNMENTS APPENDIX PROPOSED FINAL MARCH 2016 INTRODUCTION 1 FORECASTING PROCESS 1 GROWTH TRENDS 2 REGIONAL GROWTH FORECAST
A SocioEconomic Profile
 www.headwaterseconomics.org A SocioEconomic Profile Kern County, California Produced by the Economic Profile System (EPS) October 9, 2008 About EPS About The Economic Profile System (EPS) This profile
SOUTH DAKOTA KIDS COUNT BEACOM SCHOOL OF BUSINESS UNIVERSITY OF SOUTH DAKOTA 414 E. CLARK STREET VERMILLION, SD
 Brookings County Compared to o SDSD Undergrad Enrollment approximately 11,225 o USD Undergrad Enrollment approximately 7,600 o Brookings County 1 year population estimate for 2013 is 32,968 o 1 year population
Latinas Access to Health Insurance
 FACT SHEET Latinas Access to Health Insurance APRIL 2018 Data released by the U.S. Census Bureau show that, despite significant health insurance gains since the Affordable Care Act (ACA) was implemented,
EMPLOYER COSTS FOR EMPLOYEE COMPENSATION JUNE 2010
 For release 10:00 a.m. (EDT) Wednesday, September 8, 2010 USDL-10-1241 Technical information: Media contact: (202) 691-6199 NCSinfo@bls.gov www.bls.gov/ect (202) 691-5902 PressOffice@bls.gov EMPLOYER COSTS
medicaid a n d t h e How will the Medicaid Expansion for Adults Impact Eligibility and Coverage? Key Findings in Brief
 on medicaid a n d t h e uninsured July 2012 How will the Medicaid Expansion for Adults Impact Eligibility and Coverage? Key Findings in Brief Effective January 2014, the ACA establishes a new minimum Medicaid
Texas Economic Outlook: Cruising in Third Gear
 Texas Economic Outlook: Cruising in Third Gear Keith Phillips Assistant Vice President and Senior Economist 1/19/17 The views expressed in this presentation are strictly those of the presenter and do not
REGIONAL SNAPSHOT. Foothills Region, North Carolina
 REGIONAL SNAPSHOT Foothills Region, North Carolina Table of contents 01 Overview 04 Labor force 02 Demography 05 Industry and occupation 03 Human capital 01 overview Foothills Region, NC What is a regional
36 Million Without Health Insurance in 2014; Decreases in Uninsurance Between 2013 and 2014 Varied by State
 36 Million Without Health Insurance in 2014; Decreases in Uninsurance Between 2013 and 2014 Varied by State An estimated 36 million people in the United States had no health insurance in 2014, approximately
ECONOMIC CONTRIBUTIONS OF COLORADO S NONPROFIT SECTOR
 ECONOMIC CONTRIBUTIONS OF COLORADO S NONPROFIT SECTOR E x e c u t i v e S u m m a r y This economic impact study is a component of a larger effort to demonstrate the contributions that the nonprofit sector
Wisconsin Economic Development Corporation
 Wisconsin Economic Development Corporation 201 W. Washington Ave. Madison, Wisconsin 53707 608.267.4417 Analyst Report Economic Modeling Specialists, Inc. www.economicmodeling.com 1 Region Info Region:
Update: 50-State Survey of Retiree Health Care Liabilities Most recent data show changes to benefits, funding policies could help manage rising costs
 A fact sheet from Dec 2018 Update: 50-State Survey of Retiree Health Care Liabilities Most recent data show changes to benefits, funding policies could help manage rising costs Getty Images Overview States
Demographic and Economic Profile. Delaware. Updated December 2006
 Demographic and Economic Profile Delaware Updated December 2006 Metro and Nonmetro Counties in Delaware Based on the most recent listing of core based statistical areas by the Office of Management and
Metro Houston Population Forecast
 Metro Houston Population Forecast Projections to 2050 Prepared by the Greater Houston Partnership Research Department Data from Texas Demographic Center www.houston.org April 2017 Greater Houston Partnership
Small Business Credit Outlook
 2016 Q1 Small Business Credit Outlook Risk-Off Keeps the Expansion Intact March confirms the current wait and see mood of private companies. On a macro level, private companies are maintaining current
Zions Bank Economic Overview
 Zions Bank Economic Overview Jackson Hole Mountain Resort March 20, 2018 National Economic Conditions When Good News is Bad News Is Good News?? Dow Tops 26,000 Up 44% Since 2016 Election Source: Wall Street
Minnesota s Economics & Demographics Looking To 2030 & Beyond. Tom Stinson, State Economist Tom Gillaspy, State Demographer July 2008
 Minnesota s Economics & Demographics Looking To 2030 & Beyond Tom Stinson, State Economist Tom Gillaspy, State Demographer July 2008 Minnesota Has Been Very Successful (Especially For A Cold Weather State
Housing Needs Assessment Update 2012
 Housing Needs Assessment Update 2012 Venturoni Surveys & Research, Inc. Linda Venturoni, President Jim Westkott, Senior Economist and Demographer Economic Council of Eagle County Kathy Chandler-Henry,
State, Local and Net Tuition Revenue Supporting General Operating Expenses of Higher Education, U.S., Fiscal Year 2010, Current (unadjusted) Dollars
 Dollars") State, Local and Net Tuition Revenue Supporting General Operating Expenses of Higher Education, U.S., Fiscal Year 2010, Current (unadjusted) Dollars Net Tuition $51.3 Billion 37% All State Support $73.7
State, Local and Net Tuition Revenue Supporting General Operating Expenses of Higher Education, U.S., Fiscal Year 2010, Current (unadjusted) Dollars Net Tuition $51.3 Billion 37% All State Support $73.7
REGIONAL SNAPSHOT. Northern Shenandoah Valley Regional Partnership (NSVRP), Virginia
, Virginia") REGIONAL SNAPSHOT Northern Shenandoah Valley Regional Partnership (NSVRP), Virginia Table of contents 01 Overview 04 Labor force 02 Demography 05 Industry and occupation 03 Human capital 01 overview Northern
REGIONAL SNAPSHOT Northern Shenandoah Valley Regional Partnership (NSVRP), Virginia Table of contents 01 Overview 04 Labor force 02 Demography 05 Industry and occupation 03 Human capital 01 overview Northern
Raising the Minimum Wage in California. Ken Jacobs UC Berkeley Center for Labor Research and Education Policy Insights 2016 March 9, 2016
 Raising the Minimum Wage in California Ken Jacobs UC Berkeley Center for Labor Research and Education Policy Insights 2016 March 9, 2016 Real wages have fallen for the bottom half of the workforce 40%
Comparative Revenues and Revenue Forecasts Prepared By: Bureau of Legislative Research Fiscal Services Division State of Arkansas
 Comparative Revenues and Revenue Forecasts 2010-2014 Prepared By: Bureau of Legislative Research Fiscal Services Division State of Arkansas Comparative Revenues and Revenue Forecasts This data shows tax
2013 ECONOMY REPORT. Produced by the Research Division, January Alvaro Lima, Director of Research Mark Melnik John Avault Gregory Perkins
 2013 ECONOMY REPORT Produced by the Research Division, January 2013 Alvaro Lima, Director of Research Mark Melnik John Avault Gregory Perkins PETER MEADE, DIRECTOR AS WE ENTER 2013, Boston s population
Demographic and Economic Profile. Texas. Updated April 2006
 Demographic and Economic Profile Texas Updated April 2006 Metro and Nonmetro Counties in Texas Based on the most recent listing of core based statistical areas by the Office of Management and Budget (December
REGIONAL SNAPSHOT. Crossing Borders Region (CBR), Oklahoma
, Oklahoma") REGIONAL SNAPSHOT Crossing Borders Region (CBR), Oklahoma Table of contents 01 Overview 04 Labor force 02 Demography 05 Industry and occupation 03 Human capital 01 overview Crossing Borders Region, OK
REGIONAL SNAPSHOT Crossing Borders Region (CBR), Oklahoma Table of contents 01 Overview 04 Labor force 02 Demography 05 Industry and occupation 03 Human capital 01 overview Crossing Borders Region, OK
EBRI Databook on Employee Benefits Chapter 6: Employment-Based Retirement Plan Participation
 EBRI Databook on Employee Benefits Chapter 6: Employment-Based Retirement Plan Participation UPDATED July 2014 This chapter looks at the percentage of American workers who work for an employer who sponsors
Nevada County Population Projections 2010 to 2030 October 2010
 Nevada County Projections 2010 to 2030 October 2010 Prepared By: The Nevada State Demographer s Office Jeff Hardcastle, AICP NV State Demographer University of NV Reno MS/032 Reno, NV 89557 (775) 784-6353
Demographic and Economic Profile. Ohio. Updated June Metro and Nonmetro Counties in Ohio
 Demographic and Economic Profile Ohio Updated June 2006 Metro and Nonmetro Counties in Ohio Based on the most recent listing of core based statistical areas by the Office of Management and Budget (December
State Retiree Health Care Liabilities: An Update Increased obligations in 2015 mirrored rise in overall health care costs
 A brief from Sept 207 State Retiree Health Care Liabilities: An Update Increased obligations in 205 mirrored rise in overall health care costs Overview States paid a total of $20.8 billion in 205 for nonpension
CENTER FOR ECONOMIC AND POLICY RESEARCH. Union Membership Byte 2018
 CEPR CENTER FOR ECONOMIC AND POLICY RESEARCH Union Membership Byte 2018 By Brian Dew* January 2018 Center for Economic and Policy Research 1611 Connecticut Ave. NW Suite 400 Washington, DC 20009 tel: 202-293-5380