EDELMAN TRUST BAROMETER PRESENTATION TO LA TROBE ASIA
|
|
|
- Esther Randall
- 5 years ago
- Views:
Transcription


1 2014 EDELMAN TRUST BAROMETER PRESENTATION TO LA TROBE ASIA
2 EDELMAN'S 14TH ANNUAL SURVEY, LARGEST GLOBAL EXPLORATION OF TRUST ONLINE SURVEY IN 27 COUNTRIES 33,000+ respondents 6 years in 20+ markets 9 years in 10+ markets GENERAL POPULATION 1000 respondents per country surveyed Ages years of data INFORMED PUBLICS 500 respondents in U.S. and China & 200 in other countries Ages College-educated In top 25% of household income per age group in each country Report significant media consumption and engagement in business news and public policy 14 years of data 2

3 EDELMAN TRUST BAROMETER IN RETROSPECT BUSINESS TO LEAD THE DEBATE FOR CHANGE 2013 CRISIS OF LEADERSHIP 2012 FALL OF GOVERNMENT 2011 RISE OF AUTHORITY FIGURES 2010 TRUST IS NOW AN ESSENTIAL LINE OF BUSINESS 2009 BUSINESS MUST PARTNER WITH GOVERNMENT TO REGAIN TRUST 2008 YOUNG INFLUENCERS HAVE MORE TRUST IN BUSINESS 2007 BUSINESS MORE TRUSTED THAN GOVERNMENT AND MEDIA 2006 A PERSON LIKE ME EMERGES AS CREDIBLE SPOKESPERSON 2005 TRUST SHIFTS FROM AUTHORITIES TO PEERS 2004 U.S. COMPANIES IN EUROPE SUFFER TRUST DISCOUNT 2003 EARNED MEDIA MORE CREDIBLE THAN ADVERTISING 2002 FALL OF THE CELEBRITY CEO 2001 RISING INFLUENCE OF NGOS

4 ONE The State of Trust
5 TRUST IN BUSINESS AND NGOS REMAINS STABLE, TRUST IN GOVERNMENT AND MEDIA DECREASES TRUST IN THE FOUR INSTITUTIONS OF GOVERNMENT, BUSINESS, MEDIA AND NGOS, 2013 VS TOTAL TRUST TRUST A GREAT DEAL 63% 64% 58% 58% NGOS #1 22% 23% #2 17% 16% BUSINESS MEDIA 57% #3 52% 17% 16% 48% 44% #4 16% 15% GOVERNMENT Q [TRACKING] Below is a list of institutions. For each one, please indicate how much you trust that institution to do what is right using a 9-point scale where one means that you 'do not trust them at all' and nine means that you 'trust them a great deal'. (Top 2 Box, Trust a great deal and Top 4 Box, Trust) Informed Publics in 20- country global total.

6 THE TRUST INDEX: SLIGHT DECLINE IN TRUST OVER THE PAST YEAR WITH STRONG REGIONAL VARIATIONS; MAJOR DECLINES IN POLAND, U.S. & MEXICO TRUSTERS NEUTRAL DISTRUSTERS GLOBAL 57 China 80 Singapore 76 India 71 Mexico 68 Hong Kong 67 UAE 66 Malaysia 64 Canada 62 Indonesia 62 U.S. 59 Netherlands 59 Brazil 55 Germany 55 France 54 Sweden 54 U.K. 53 Italy 51 Australia 50 Poland 48 S. Korea 47 Ireland 46 Argentina 45 Spain 42 Turkey 42 Japan 41 Russia 36 Trust Index is an average of a country s trust in the four institutions of government, business, media and NGOs. 20-country global total (does not include Argentina, Hong Kong, Malaysia, Singapore, South Africa, Turkey, UAE). GLOBAL 54 UAE 79 China 79 Singapore 73 Indonesia 72 India 69 Malaysia 65 Canada 60 Netherlands 60 Mexico 59 Hong Kong 59 Australia 58 Brazil 57 Germany 57 Argentina 53 U.K. 52 Sweden 51 S. Korea 51 S. Africa 50 U.S. 49 France 46 Japan 44 Italy 43 Turkey 41 Spain 39 Ireland 39 Russia 37 Poland 35 BIG TRUST INCREASES FROM 2013 UAE +13 pts. Indonesia +10 pts. Australia + 8 pts. Argentina + 8 pts. BIG TRUST DECREASES FROM 2013 Poland -13 pts. U.S. -10 pts. Mexico -9 pts.

7 SUBSTANTIALLY LOWER TRUST AMONG GENERAL PUBLIC THAN INFORMED PUBLIC TRUSTERS NEUTRAL DISTRUSTERS GLOBAL 56 UAE 79 China 79 Singapore 73 Indonesia 72 India 69 Malaysia 65 Canada 60 Netherlands 60 Mexico 59 Hong Kong 59 Australia 58 Brazil 57 Germany 57 Argentina 53 U.K. 52 Sweden 51 S. Korea 51 S. Africa 50 U.S. 49 France 46 Japan 44 Italy 43 Turkey 41 Spain 39 Ireland 39 Russia 37 Poland 35 GLOBAL 47 China 67 UAE 64 Singapore 64 Indonesia 62 India 61 Malaysia 57 Canada 54 Mexico 53 Netherlands 51 Hong Kong 50 Brazil 49 Argentina 49 Australia 44 Germany 44 S. Korea 43 U.K. 42 S. Africa 42 U.S. 42 Italy 41 Japan 40 Turkey 39 Sweden 38 Spain 36 Ireland 35 France 33 Poland 32 Russia 31 GLOBAL TRUST DIFFERENCE OF 9 points MARKETS WITH LARGEST PERCEPTION GAPS: UAE (15 pts.) Australia (14 pts.) Germany (13 pts.) France (13 pts.) Sweden (13 pts.) Trust Index is an average of a country s trust in the four institutions of government, business, media and NGOs. 27-country global total.
8 TRUST IN NGOS ON THE RISE, WITH MAJORITY OF MARKETS AT OR ABOVE 60% TRUST LEVEL TRUST IN NON-GOVERNMENTAL ORGANIZATIONS (NGOS), 2013 VS % 64% 66% 51% 73% 57% NGOs most trusted institution in 20 of the 27 countries surveyed in 2014 HIGHER TRUST IN 17 COUNTRIES 76% 76% 75% 70% 69% 70% 69% 67% 66% 67% 67% 66% 64% 64% 61% 55% 62% 59% 59% 84% 81% 58% 56% 76% 77% 75% 76% 46% 47% 40% 41% 37% 37% LOWER/EQUAL TRUST IN 9 COUNTRIES 76% 75% 69% 63% 62% 64% 63% 58% 73% 67% 83% 74% 70% 62% 61% 50% 47% N.A. 8 Q [NON-GOVERNMENTAL ORGANIZATIONS] Below is a list of institutions. For each one, please indicate how much you trust that institution to do what is right using a 9-point scale where one means that you 'do not trust them at all' and nine means that you 'trust them a great deal'. (Top 4 Box, Trust) Informed Publics, 20-country global total.
9 ENVIRONMENTAL NGOS RANKED IN TOP TIER OF NGOS TRUST IN NGOS GLOBAL % 64% 63% 59% 56% 46% Disaster Relief and Development Health Environmental Social Justice/Human Rights Labor Faith-Based 9 Q Thinking about different types of non-governmental organizations, please indicate how much you trust each type of NGO to do what is right using a 9-point scale where one means that you do not trust them at all and nine means that you trust them a great deal

10 TRUST IN BUSINESS STABILIZES; WESTERN SKEPTICISM ENTRENCHED, DEVELOPING MARKETS SOAR TRUST IN BUSINESS, 2013 VS HIGHER TRUST IN 12 COUNTRIES LOWER/EQUAL TRUST IN 15 COUNTRIES 82% 72% 74% 82% 70% 74% 77% 81% 79% 77% 71% 82% 73% 58% 58% 63% 65% 63% 59% 58% 57% 48% 49% 48% 39% 64% 62% 58% 45% 40% 56% 56% 52% 53% 44% 43% 62% 58% 47% 44% 43% 44% 41% 38% 61% 58% 54% 51% 60% 56% 56% 49% 50% 45% 45% 31% N.A. 10 Q [BUSINESS IN GENERAL] Below is a list of institutions. For each one, please indicate how much you trust that institution to do what is right using a 9-point scale where one means that you 'do not trust them at all' and nine means that you 'trust them a great deal'. (Top 4 Box, Trust) Informed Publics, 20-country global total.

11 FAMILY-OWNED AND SMALL- AND MEDIUM-SIZED BUSINESSES HAVE A TRUST ADVANTAGE EXCEPT IN ASIA; STATE-OWNED LEAST TRUSTED GLOBALLY TRUST IN DIFFERENT TYPES OF BUSINESS BY REGION FAMILY-OWNED SMALL- & MEDIUM-SIZED PUBLICLY-TRADED PRIVATELY-HELD BIG BUSINESS STATE-OWNED 74% 71% 73% 68% 63% 65% 62% 61% 62% 62% 63% 54% 85% 83% 76% 78% 80% 72% 74% 68% 70% 63% 60% 57% 48% 47% 47% 45% 46% 45% GLOBAL APAC EU NORTH AMERICA LATIN AMERICA 11 Q15-17C. Thinking about different types of businesses, please indicate how much you trust each type of business to do what is right using a 9-point scale where one means that you do not trust them at all and nine means that you trust them a great deal. (Top 4 Box, Trust) Informed Publics, 27-country global total.
12 GLOBAL TRUST IN MEDIA REVERTS TO 2010 LEVELS; NEARLY 80% OF COUNTRIES REPORT TRUSTING MEDIA LESS OVER THE LAST YEAR TRUST IN MEDIA, 2013 VS HIGHER TRUST IN 5 COUNTRIES 78% 77% 81% 79% LOWER/EQUAL TRUST IN 21 COUNTRIES 79% 70% 57% 59% 60% 55% 54% 57% 52% 48% 47% 42% 70% 70% 60% 59% 49% 48% 61% 58% 47% 44% 43% 40% 66% 66% 63% 61% 38% 35% 68% 63% 61% 54% 47% 41% 45% 37% 71% 54% 51% 50% 50% 50% 45% 45% 42% 40% 40% 26% 30% 19% N.A. 12 Q [MEDIA IN GENERAL] Below is a list of institutions. For each one, please indicate how much you trust that institution to do what is right using a 9-point scale where one means that you 'do not trust them at all' and nine means that you 'trust them a great deal'. (Top 4 Box, Trust) Informed Publics, 20-country global total.
13 SIGNIFICANT TRUST DECLINE FOR GOVERNMENT; LARGEST TRUST DROPS IN U.S., FRANCE AND HONG KONG TRUST IN GOVERNMENT, 2013 VS = HISTORIC LOW GLOBAL HISTORIC LOW (2009) = 43% HIGHER TRUST IN 9 COUNTRIES LOWER/EQUAL TRUST IN 17 COUNTRIES 88% 81% 82% 73% 76% 75% 48% 44% 17% 65% 62% 63% 60% 56% 57% 53% 53% 49% 47% 48% 45% 47% 45% 44% 43% 43% 40% 42% 32% 33% 34% 29% 27% 23% 19% 20% 18% 60% 58% 54% 51% 63% 53% 49% 50% 45% 41% 35% 37% 30% 32% 28% 32% 24% 19% 21% N.A. 13 Q [GOVERNMENT IN GENERAL] Below is a list of institutions. For each one, please indicate how much you trust that institution to do what is right using a 9-point scale where one means that you 'do not trust them at all' and nine means that you 'trust them a great deal'. (Top 4 Box, Trust) Informed Publics, 20-country global total.
14 HISTORIC GAP BETWEEN BUSINESS AND GOVERNMENT TRUST GLOBAL TRUST IN GOVERNMENT AND BUSINESS SINCE % BUSINESS GOVERNMENT 60% 50% 50% 54% 56% 52% 53% 58% 58% 14 point trust gap between business and government 40% 43% 47% 43% 48% 44% 30% Q [TRACKING] Below is a list of institutions. For each one, please indicate how much you trust that institution to do what is right using a 9-point scale where one means that you 'do not trust them at all' and nine means that you 'trust them a great deal'. (4 Box, Trust) Informed Publics in 20-country global total.

15 TWO Building Trust
16 INDUSTRY SECTOR LEADERSHIP/ CEO TRUST 4 KEY FACTORS SHAPE TRUST IN BUSINESS COUNTRY OF ORIGIN (HEADQUARTERS) ENTERPRISE TYPE 16
17 COMPANIES HEADQUARTERED IN BRIC NATIONS SUFFER A TRUST DEFICIT COMPARED TO WESTERN BASED COMPANIES TRUST IN COMPANIES HEADQUARTERED IN THE FOLLOWING COUNTRIES MOST TRUSTED 80% 79% 79% 78% 75% 74% 71% 68% 67% 0% 55% 54% 53% 42% 38% 36% 35% 34% Germany Sweden Switzerland Canada U.K. Japan The Netherlands U.S. France Italy South Korea Spain Brazil Russia China India Mexico 17 Q26-Q42. [TRACKING] Now we would like to focus on global companies headquartered in specific countries. Please indicate how much you trust global companies headquartered in the following countries to do what is right. Use the same 9-point scale where one means that you do not trust them at all and nine means that you trust them a great deal. (Top 4 Box, Trust) Informed Publics, 27-country global total.
18 SOME SCEPTICISM IN AUSTRALIA AUSTRALIA TRUST IN COMPANIES HEADQUARTERED IN THE FOLLOWING COUNTRIES MOST TRUSTED 82% 81% 79% 79% 74% 74% 68% 62% 61% 50% 46% 42% 29% 26% 25% 22% 20% 18 Q26-Q42. [TRACKING] Now we would like to focus on global companies headquartered in specific countries. Please indicate how much you trust global companies headquartered in the following countries to do what is right. Use the same 9-point scale where one means that you do not trust them at all and nine means that you trust them a great deal. (Top 4 Box, Trust) Informed Publics.
19 HIGH SCORE IN CHINA, BUT, CHINA IS A HIGH TRUST NATION CHINA TRUST IN COMPANIES HEADQUARTERED IN THE FOLLOWING COUNTRIES MOST TRUSTED 91% 90% 89% 88% 88% 87% 84% 84% 82% 78% 78% 76% 76% 69% 66% 65% 52% 19 Q26-Q42. [TRACKING] Now we would like to focus on global companies headquartered in specific countries. Please indicate how much you trust global companies headquartered in the following countries to do what is right. Use the same 9-point scale where one means that you do not trust them at all and nine means that you trust them a great deal. (Top 4 Box, Trust) Informed Publics
20 MIDDLE OF THE ROAD IN SINGAPORE SINGAPORE TRUST IN COMPANIES HEADQUARTERED IN THE FOLLOWING COUNTRIES MOST TRUSTED 87% 86% 84% 84% 84% 80% 79% 77% 76% 72% 61% 57% 48% 42% 39% 37% 36% 20 Q26-Q42. [TRACKING] Now we would like to focus on global companies headquartered in specific countries. Please indicate how much you trust global companies headquartered in the following countries to do what is right. Use the same 9-point scale where one means that you do not trust them at all and nine means that you trust them a great deal. (Top 4 Box, Trust) Informed Publics.
21 HIGH SCORES IN INDONESIA INDONESIA TRUST IN COMPANIES HEADQUARTERED IN THE FOLLOWING COUNTRIES 96% MOST 93% 92% TRUSTED 89% 88% 87% 86% 85% 84% 83% 81% 74% 72% 60% 59% 56% 56% 21 Q26-Q42. [TRACKING] Now we would like to focus on global companies headquartered in specific countries. Please indicate how much you trust global companies headquartered in the following countries to do what is right. Use the same 9-point scale where one means that you do not trust them at all and nine means that you trust them a great deal. (Top 4 Box, Trust) Informed Publics.

22 Being American is not an issue in the majority of your markets. Technology versus Energy provides you with a much wider swing.
23 TECHNOLOGY CONTINUES TO LEAD, BANKS TRAIL TRUST IN INDUSTRIES, 2009 VS VS TECHNOLOGY 76% TECHNOLOGY 79% +3 AUTOMOTIVE 58% AUTOMOTIVE 70% +12 FOOD AND BEVERAGE 56% FOOD AND BEVERAGE 66% +10 CONSUMER PACKAGED GOODS 54% CONSUMER PACKAGED GOODS 65% +11 ENERGY 55% ENERGY 59% +4 PHARMACEUTICALS 53% PHARMACEUTICALS 59% +6 MEDIA 43% MEDIA 51% +8 BANKS 47% BANKS 51% Q [TRACKING] Please indicate how much you trust businesses in each of the following industries to do what is right. Again, please use the same 9-point scale where one means that you do not trust them at all and nine means that you trust them a great deal. (Top 4 Box, Trust) Informed Publics, 20-country global total.
24 THE TOP THREE AND BOTTOM THREE MARKETS FOR TRUST IN FINANCIAL SERVICES, FOOD & BEVERAGE AND ENERGY INDUSTRIES LEVELS OF TRUST IN INDUSTRY TOP THREE & BOTTOM THREE COUNTRIES FINANCIAL SERVICES INDUSTRY FOOD & BEVERAGE INDUSTRY ENERGY INDUSTRY China 76% India 79% India 81% Indonesia 74% Mexico 76% China 78% India 70% UAE 76% UAE 76% Spain 24% Turkey 43% Germany 36% Ireland 23% Russia 43% Sweden 36% Germany 23% Poland 42% U.K. 31% 24 Q [TRACKING] Please indicate how much you trust businesses in each of the following industries to do what is right. Again, please use the same 9-point scale where one means that you do not trust them at all and nine means that you trust them a great deal. (Top 4 Box, Trust) Informed Publics
25 THEY CANT USE IT BUT KNOW THEY LIKE TECH IN AUSTRALIA TRUST IN INDUSTRIES, 2013 VS AUSTRALIA TECHNOLOGY CONSUMER ELECTRONICS MANUFACTURING BREWING AND SPIRITS FOOD AND BEVERAGE ENTERTAINMENT CONSUMER PACKAGED GOODS AUTOMOTIVE CONSUMER HEALTH COMPANIES PHARMACEUTICALS TELECOMMUNICATIONS FINANCIAL SERVICES BANKS ENERGY CHEMICALS MEDIA % 31% 43% 43% 40% 42% 58% 65% 66% 63% 58% 56% 56% 55% 55% TECHNOLOGY CONSUMER ELECTRONICS MANUFACTURING BREWING AND SPIRITS FOOD AND BEVERAGE ENTERTAINMENT CONSUMER PACKAGED GOODS AUTOMOTIVE CONSUMER HEALTH COMPANIES PHARMACEUTICALS TELECOMMUNICATIONS FINANCIAL SERVICES BANKS ENERGY CHEMICALS MEDIA % 75% 72% 71% 71% 70% 67% 63% 62% 58% 54% 53% 53% 49% 42% 2013 vs Q [TRACKING] Please indicate how much you trust businesses in each of the following industries to do what is right. Again, please use the same 9-point scale where one means that you do not trust them at all and nine means that you trust them a great deal. (Top 4 Box, Trust) Informed Publics.
26 CHINA HIGHEST OF ENERGY TRUST IN ANY MARKET TRUST IN INDUSTRIES, 2013 VS CHINA TECHNOLOGY AUTOMOTIVE ENERGY CONSUMER PACKAGED GOODS BANKS TELECOMMUNICATIONS FINANCIAL SERVICES PHARMACEUTICALS CHEMICALS MEDIA BREWING AND SPIRITS CONSUMER HEALTH COMPANIES FOOD AND BEVERAGE ENTERTAINMENT % 88% 85% 84% 82% 80% 79% 78% 75% 78% 76% 73% 69% 71% 73% TECHNOLOGY AUTOMOTIVE ENERGY CONSUMER PACKAGED GOODS BANKS TELECOMMUNICATIONS FINANCIAL SERVICES PHARMACEUTICALS CHEMICALS MEDIA BREWING AND SPIRITS CONSUMER HEALTH COMPANIES FOOD AND BEVERAGE ENTERTAINMENT % 89% 87% 86% 85% 85% 82% 82% 82% 80% 78% 78% 77% 76% 74% 2013 vs Q [TRACKING] Please indicate how much you trust businesses in each of the following industries to do what is right. Again, please use the same 9-point scale where one means that you do not trust them at all and nine means that you trust them a great deal. (Top 4 Box, Trust) Informed Publics, 20-country global total.

27 ENERGY RELATIVELY HIGH SCORES IN SINGAPORE TRUST IN INDUSTRIES, 2013 VS SINGAPORE TECHNOLOGY CONSUMER ELECTRONICS MANUFACTURING FOOD AND BEVERAGE AUTOMOTIVE CONSUMER PACKAGED GOODS CONSUMER HEALTH COMPANIES TELECOMMUNICATIONS ENERGY PHARMACEUTICALS BANKS CHEMICALS BREWING AND SPIRITS FINANCIAL SERVICES ENTERTAINMENT MEDIA % 78% 76% 81% 75% 72% 78% 72% 76% 72% 68% 63% 74% 69% 67% TECHNOLOGY CONSUMER ELECTRONICS MANUFACTURING FOOD AND BEVERAGE AUTOMOTIVE CONSUMER PACKAGED GOODS CONSUMER HEALTH COMPANIES TELECOMMUNICATIONS ENERGY PHARMACEUTICALS BANKS CHEMICALS BREWING AND SPIRITS FINANCIAL SERVICES ENTERTAINMENT MEDIA % 82% 80% 78% 78% 78% 77% 76% 75% 74% 74% 69% 68% 67% 66% 2013 vs Q [TRACKING] Please indicate how much you trust businesses in each of the following industries to do what is right. Again, please use the same 9-point scale where one means that you do not trust them at all and nine means that you trust them a great deal. (Top 4 Box, Trust) Informed Publics.
28 HIGH IN INDONESIA AS WELL TRUST IN INDUSTRIES, 2013 VS INDONESIA TECHNOLOGY AUTOMOTIVE CONSUMER ELECTRONICS MANUFACTURING TELECOMMUNICATIONS BANKS PHARMACEUTICALS FOOD AND BEVERAGE ENERGY CONSUMER PACKAGED GOODS FINANCIAL SERVICES MEDIA ENTERTAINMENT CONSUMER HEALTH COMPANIES CHEMICALS BREWING AND SPIRITS % 94% 93% 92% 89% 90% 87% 84% 84% 80% 84% 81% 78% 76% 71% TECHNOLOGY AUTOMOTIVE CONSUMER ELECTRONICS MANUFACTURING TELECOMMUNICATIONS BANKS PHARMACEUTICALS FOOD AND BEVERAGE ENERGY CONSUMER PACKAGED GOODS FINANCIAL SERVICES MEDIA ENTERTAINMENT CONSUMER HEALTH COMPANIES CHEMICALS BREWING AND SPIRITS % 93% 90% 88% 88% 87% 83% 80% 79% 79% 78% 78% 77% 74% 74% 2013 vs Q [TRACKING] Please indicate how much you trust businesses in each of the following industries to do what is right. Again, please use the same 9-point scale where one means that you do not trust them at all and nine means that you trust them a great deal. (Top 4 Box, Trust) Informed Publics.

29 A deeper dive around Energy as a an example of trust in Asia
30 30
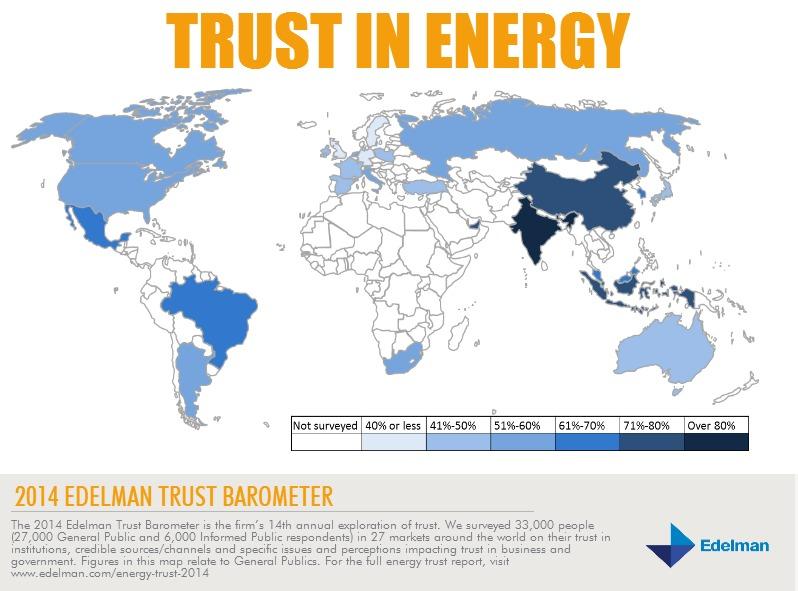
31 REGIONAL VIEW OF TRUST IN ENERGY TRUST IN ENERGY INDUSTRY 27 MARKET OVERVIEW APAC Latin America North America EMEA 81% 78% 76% 74% 71% 69% 69% 68% 67% 62% 56% 56% 55% 55% 54% 54% 53% 52% 50% 48% 48% 47% 44% 41% 41% 36% 36% 31% 31 Q ENERGY Please indicate how much you trust businesses in each of the following industries to do what is right. Again, please use the same 9-point scale where one means that you do not trust them at all and nine means that you trust them a great deal. (Top 4 Box, Trust) General Population in 27 -country global total and across 27 countries

![[TRACKING] When it comes to government regulation of business, do you think that your government regulates business too much, not enough or the right amount?](/docs-images/85/93002748/images/32-4.jpg "(Not Enough, Too much) Informed Publics, 27-country global total. Q263.")
32 THE REGULATORY ENVIRONMENT IS ONLY GOING TO GET TOUGHER FOR ENERGY Not Enough Regulation of Business Not Enough Regulation for Energy 73% 67% 67% 64% 65% 63% 63% 60% 61% 60% 59% 58% 58% 57% 57% 56% 47% 48% 49% 52% 54% 51% 53% 52% 49% 51% 51% 42% 43% 46% 47% 42% 43% 44% 43% 42% 41% 40% 38% 38% 38% 38% 37% 36% 34% 33% 33% 30% 31% 29% 28% 26% 26% 23% 32 Q148. [TRACKING] When it comes to government regulation of business, do you think that your government regulates business too much, not enough or the right amount? (Not Enough, Too much) Informed Publics, 27-country global total. Q263. When it comes to government regulation of the energy industry, do you think that your government regulates it too much, not enough or the right amount? (Not Enough, Too much) Informed Publics, 27-country global total.

33 YOUR TRUST SCORES IS GENERALLY LINKED TO THE DESIRE FOR REGULATION TRUST IN ENERGY VS DESIRE FOR MORE REGULATION OF ENERGY Trust in Energy Not Enough Regulation for Energy 59% 33 Q [TRACKING] Please indicate how much you trust businesses in each of the following industries to do what is right. Again, please use the same 9-point scale where one means that you do not trust them at all and nine means that you trust them a great deal. (Top 4 Box, Trust) Q263. When it comes to government regulation of the energy industry, do you think that your government regulates it too much, not enough or the right amount? (Not Enough, Too much) Informed Publics, 27-country global total.

34 THAT SAID, WITH THE EXCEPTION OF APAC COUNTRIES, POLICYMAKERS ARE NOT TRUSTED TO APPROPRIATELY REGULATE THE ENERGY INDUSTRY PERCENTAGE AGREEING WITH EACH STATEMENT I trust policymakers to develop and implement appropriate regulations on the energy industry 84% 76% 73% 73% 72% 71% 65% 63% 60% 49% 48% 47% 46% 46% 44% 43% 42% 41% 37% 36% 34% 33% 33% 32% 32% 30% 29% 28% 34 Q Please indicate how much you agree or disagree with the following statements? Informed Publics, 27-country global total.

35 AND MOST FEEL GOVERNMENT SHOULD CONSULT MULTIPLE STAKEHOLDERS WHEN DEVELOPING REGULATIONS ENERGY HAS LICENSE TO ENGAGE PERCENTAGE AGREEING WITH EACH STATEMENT When policymakers are developing new regulations on businesses and industries, they should consult with multiple stakeholders (e.g., NGOs, academics, the affected businesses/industries, etc.) before making final decisions 91% 90% 89% 88% 87% 86% 84% 79% 84% 84% 83% 82% 81% 81% 81% 81% 79% 79% 79% 78% 75% 73% 73% 73% 69% 67% 62% 45% 35 Q Please indicate how much you agree or disagree with the following statements? Informed Publics, 27-country global total.


36 THERE IS AN OPPORTUNITY FOR THE ENERGY INDUSTRY TO PLAY A KEY ROLE IN ENERGY POLICY DEBATE PERCENTAGE AGREEING WITH EACH STATEMENT The energy industry should be a more active participant in the broader debate over [COUNTRY] energy policy 74% 89% 89% 88% 88% 86% 85% 85% 84% 80% 79% 79% 78% 74% 69% 68% 68% 68% 68% 68% 65% 65% 65% 64% 62% 60% 58% 56% 36 Q Please indicate how much you agree or disagree with the following statements? Informed Publics, 27-country global total.
37 37

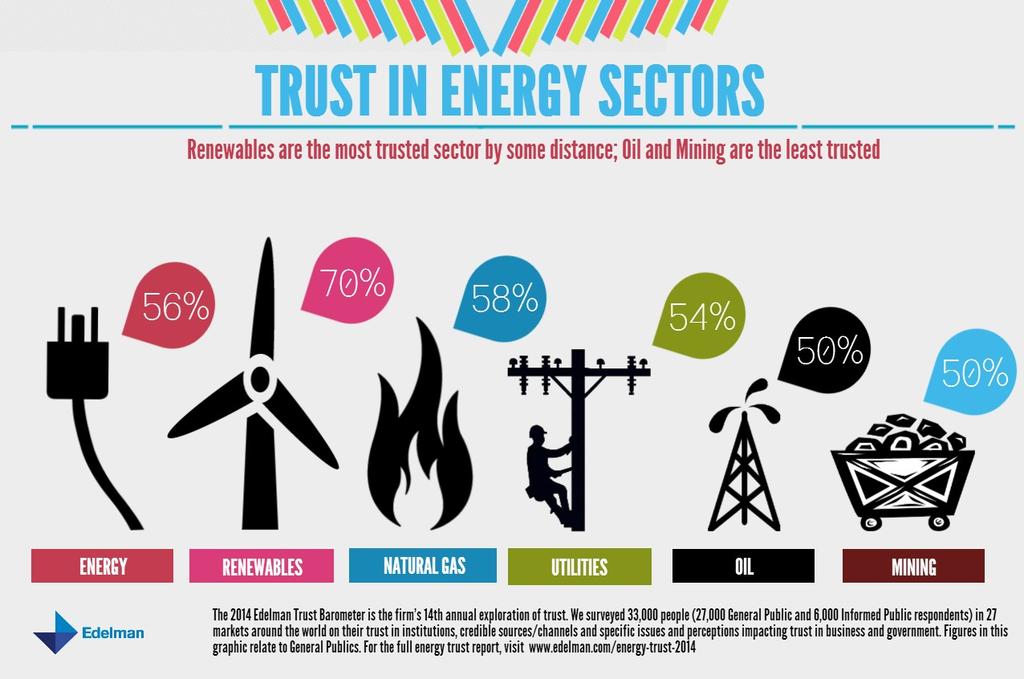
38 UNANIMOUS TRUST IN RENEWABLES TRUST IN ENERGY SECTORS RENEWABLES % 84% 82% 81% 79% 79% 78% 77% 77% 77% 76% 76% 76% 75% 77% 74% 75% 73% 70% 72% 73% 71% 70% 73% 71% 70% 70% 71% 68% 68% 68% 68% 67% 68% 66% 66% 64% 65% 65% 65% 65% 64% 63% 61% 59% 59% 61% 60% 58% 58% 59% 57% 55% 55% 53% NA 38 Q61C-64C. [SPLIT SAMPLE] Now thinking about specific sectors within the energy industry, please indicate how much you trust businesses in each of the following sectors to do what is right. Again, please use the same 9-point scale where one means that you do not trust them at all and nine means that you trust them a great deal. General Population, global total across 25 countries.
39 TRUST IN NATURAL GAS ABOVE 50 PERCENT IN 19 OF 27 MARKETS; GAINS IN A VARIETY OF MARKETS TRUST IN ENERGY SECTORS NATURAL GAS % 82% 80% 81% 80% 71% 73% 74% 72% 72% 70% 70% 70% 69% 70% 67% 65% 66% 65% 65% 58% 58% 58% 58% 60% 57% 57% 56% 55% 53% 53% 54% 53% 52% 51% 51% 50% 50% 49% 48% 45% 45% 45% 46% 45% 47% 43% 43% 43% 43% 42% 40% 40% 37% 37% NA 39 Q61C-64C. [SPLIT SAMPLE] Now thinking about specific sectors within the energy industry, please indicate how much you trust businesses in each of the following sectors to do what is right. Again, please use the same 9-point scale where one means that you do not trust them at all and nine means that you trust them a great deal. General Population, global total across 25 countries.

40 TRUST IN UTILITIES ABOVE 50 PERCENT IN 17 OF 27 MARKETS; CRITICAL LOW POINTS IN SOME TRUST IN ENERGY SECTORS UTILITIES % 78% 77% 75% 74% 74% 73% 74% 72% 71% 68% 69% 70% 68% 69% 69% 64% 59% 58% 58% 57% 53% 54% 53% 53% 54% 54% 54% 51% 50% 51% 51% 51% 51% 47% 45% 45% 40% 38% 39% 39% 39% 40% 40% 40% 38% 38% 36% 35% 36% 37% 36% 35% 18% 26% NA 40 Q61C-64C. [SPLIT SAMPLE] Now thinking about specific sectors within the UTILITIES industry, please indicate how much you trust businesses in each of the following sectors to do what is right. Again, please use the same 9-point scale where one means that you do not trust them at all and nine means that you trust them a great deal. General Population, global total across 25 countries.

![[SPLIT SAMPLE] Now thinking about specific sectors within the energy industry, please indicate how much you trust businesses in each of the following sectors to do what is right.](/docs-images/85/93002748/images/41-4.jpg "Again, please use the same 9-point scale where one means that you do not trust them at all and nine means that you trust them a great deal.")
41 COUNTRIES CLEARLY DIVIDED OVER TRUST IN THE OIL SECTOR; TRUST HIGHEST IN EMERGING AND ASIAN MARKETS TRUST IN ENERGY SECTORS OIL % 81% 77% 77% 73% 74% 75% 72% 72% 68% 69% 68% 69% 67% 66% 66% 62% 59% 49% 50% 53% 52% 52% 52% 49% 47% 46% 43% 42% 41% 40% 41% 39% 39% 39% 37% 38% 37% 35% 35% 36% 36% 33% 33% 33% 33% 30% 30% 30% 30% 30% 29% 30% 28% 29% NA 41 Q61C-64C. [SPLIT SAMPLE] Now thinking about specific sectors within the energy industry, please indicate how much you trust businesses in each of the following sectors to do what is right. Again, please use the same 9-point scale where one means that you do not trust them at all and nine means that you trust them a great deal. General Population, global total across 25 countries.

42 MINING IS MOST TRUSTED IN DEVELOPING NATIONS; CANADA, U.S. LEVELS MIGHT SURPRISE TRUST IN ENERGY SECTORS MINING 70% 68% 67% 66% 66% 65% 50% 63% 60% 59% 57% 54% 54% 50% 46% 45% 45% 45% 44% 44% 44% 42% 38% 36% 33% 32% 32% 29% 42 Q61C-64C. [SPLIT SAMPLE] Now thinking about specific sectors within the MINING industry, please indicate how much you trust businesses in each of the following sectors to do what is right. Again, please use the same 9-point scale where one means that you do not trust them at all and nine means that you trust them a great deal. General Population, global total across 27countries.

43 Trust, Leadership and Engagement
44 THE POWER OF SEARCH LEVELS OF TRUST IN SOURCES OF INFORMATION 65% 65% 54% 47% 45% ONLINE SEARCH ENGINES TRADITIONAL MEDIA HYBRID MEDIA SOCIAL MEDIA OWNED MEDIA FIRST SOURCE TO TURN TO FOR GENERAL BUSINESS INFORMATION FIRST SOURCE TO TURN TO FOR BREAKING NEWS ABOUT BUSINESS SOURCE USED TO CONFIRM/VALIDATE INFORMATION BREAKING NEWS ABOUT BUSINESS 30% 26% 21% 28% 25% 20% 36% 20% 19% Online search Newspapers Television Online search Television Newspapers Online search Television Newspapers Q [TRACKING] When looking for general news and information, how much would you trust each type of source for general news and information? Please use a 9-point scale where one means that you do not trust it at all and nine means that you trust it a great deal. (Top 4 Box, Trust) Informed Publics, 27-country global total Q183. On a typical day, what is the first source that you go to for general information about business? ; Q184. What is the first source you go to for breaking news about business? ; 44 Q185. Which of the following sources do you turn to MOST often to confirm/ validate information on breaking news about business? Informed Publics, 27-country global total
45 TRUST IN MEDIA SOURCES ENERGY INDUSTRY TRUSTERS VS. DISTRUSTERS TRUSTERS IN ENERGY INDUSTRY DISTRUSTERS IN ENERGY INDUSTRY 74% 73% 59% 57% 56% 44% 39% 27% 21% 25% ONLINE SEARCH ENGINES TRADITIONAL MEDIA HYBRID MEDIA OWNED MEDIA SOCIAL MEDIA 45 Q When looking for general news and information, how much would you trust each type of source for general news and information? Please use a 9-point scale where one means that you "do not trust it at all" and nine means that you "trust it a great deal". (Top 4 Box, Trust) General Population in 27-country global total

46 FROM 2009 TO 2014, SIGNIFICANT GAINS FOR REGULAR EMPLOYEES, A PERSON LIKE YOURSELF. CEOS FLAT FROM CREDIBILITY OF SPOKESPEOPLE ACADEMIC OR EXPERT 62% ACADEMIC OR EXPERT 67% 2009 VS TECHNICAL EXPERT* TECHNICAL EXPERT 66% A PERSON LIKE YOURSELF 47% A PERSON LIKE YOURSELF 62% +15 FINANCIAL OR INDUSTRY ANALYST 49% FINANCIAL OR INDUSTRY ANALYST 53% +4 NGO REPRESENTATIVE 41% NGO REPRESENTATIVE 52% +9 REGULAR EMPLOYEE 32% REGULAR EMPLOYEE 52% +20 CEO 31% CEO 43% +12 GOVERNMENT OFFICIAL OR REGULATOR 29% GOVERNMENT OFFICIAL OR REGULATOR 36% +7 * Not tested in Q [TRACKING] Below is a list of people. In general, when forming an opinion of a company, if you heard information about a company from each person, how credible would the information be--extremely credible, very credible, somewhat credible, or not credible at all? (Top 2 Box, Very/Extremely Credible) Informed Publics, 20- country global total.
47 16 KEY ATTRIBUTES TO BUILDING TRUST ENGAGEMENT LISTENS TO CUSTOMER NEEDS AND FEEDBACK TREATS EMPLOYEES WELL PLACES CUSTOMERS AHEAD OF PROFITS Edelman Trust Barometer research reveals 16 specific attributes which build trust. These can be grouped into five performance clusters listed here in rank order of importance. COMMUNICATES FREQUENTLY AND HONESTLY ON THE STATE OF ITS BUSINESS INTEGRITY HAS ETHICAL BUSINESS PRACTICES TAKES RESPONSIBLE ACTIONS TO ADDRESS AN ISSUE OR CRISIS HAS TRANSPARENT AND OPEN BUSINESS PRACTICES PRODUCTS & SERVICES OFFERS HIGH QUALITY PRODUCTS OR SERVICES IS AN INNOVATOR OF NEW PRODUCTS, SERVICES OR IDEAS PURPOSE WORKS TO PROTECT AND IMPROVE THE ENVIRONMENT ADDRESSES SOCIETY S NEEDS IN ITS EVERYDAY BUSINESS CREATES PROGRAMS THAT POSITIVELY IMPACT THE LOCAL COMMUNITY PARTNERS WITH NGOs, GOVERNMENT AND 3RD PARTIES TO ADDRESS SOCIETAL NEEDS OPERATIONS HAS HIGHLY-REGARDED AND WIDELY ADMIRED TOP LEADERSHIP 47 RANKS ON A GLOBAL LIST OF TOP COMPANIES DELIVERS CONSISTENT FINANCIAL RETURNS TO INVESTORS

48 A SINGAPORE ROAD MAP BUSINESS IMPORTANCE VS. BUSINESS PERFORMANCE ON 16 TRUST DRIVERS SINGAPORE Gap ENGAGEMENT INTEGRITY PRODUCTS & SERVICES PURPOSE OPERATIONS LISTENS TO CUSTOMERS HIGH QUALITY PRODUCTS ACTS RESPONSIBLY IN CRISIS IS ETHICAL TRANSPARENT & OPEN CUSTOMERS BEFORE PROFITS TREATS EMPLOYEES WELL COMMUNICATES OFTEN PROTECTS ENVIRONMENT POSITIVELY IMPACTS COMMUNITY ADMIRED TOP LEADERSHIP CONSISTENT FINANCIAL RETURNS ADDRESSES SOCIETY'S NEEDS INNOVATOR TOP GLOBAL COMPANY PARTNERS WITH NGOS IMPORTANCE PERFORMANCE 23% 23% 21% 22% 20% 21% 23% 20% 21% 19% 20% 19% 18% 22% 20% 16% 48% 47% 47% 46% 46% 45% 44% 42% 38% 35% 33% 33% 32% 29% 29% 28% Q80-Q95. [TRACKING] How important is each of the following actions to building your TRUST in a company? Use a nine-point scale where one means that action is not at all important to building your trust and nine means it is extremely important to building your trust in a company. (Top 2 Box, Very/Extremely Important) Informed Publics; Q Please rate businesses in general on how well you think they are performing on each of the following attributes. Use a 9-point scale where one means they are "performing extremely poorly" and nine means they are "performing extremely well". (Top 2 Box, Performing Extremely Well) Informed Publics.

49 IT TAKES A CHORUS TO GET YOUR STORY ACROSS MOST TRUSTED INFLUENCER TO COMMUNICATE EACH TOPIC - INFLUENCER MESSAGE MAPPING COMPANY'S CEO COMPANY'S EMPLOYEE ACTIVIST CONSUMER ACADEMIC MEDIA SPOKESPERSON 50% 21% 30% 15% 12% 37% 32% 31% 21% 21% 17% 32% 27% 25% 13% 31% 26% 24% 23% 19% 36% 34% 30% 27% 25% 23% 22% 21% 16% 14% ENGAGEMENT INTEGRITY PRODUCTS & PURPOSE OPERATIONS SERVICES TOTALS 49 Q (Global Summary). We would now like you to think about different types of information you may read, see or hear about a company. For each topic, please select which person you trust MOST to provide you with credible and honest information about a company. General Publics, 27-country global total.
50 WHAT CEOS SHOULD DO TO BUILD TRUST ACTIONS A CEO CAN TAKE TO BUILD TRUST IN THEMSELVES AND THEIR COMPANY 82% 81% 80% 79% 69% 53% Communicates clearly and transparently Tells the truth, regardless of how complex or unpopular it is Engages with employees regularly to discuss the state of the business Is front and center during challenging times (product recalls, lawsuits, etc.) Is personally involved in supporting local charities and good causes Has an active media presence 50 Q254A-261A. [SPLIT SAMPLE ] Thinking about the following actions a CEO can take, how important is each of the following to building your TRUST in that CEO?; Q254B- 261B. [SPLIT SAMPLE ] Thinking about the following actions a CEO can take, how important is each of the following to building your TRUST in that CEO's company? (Top 4 Box, Total Important) General Publics, 27-country global total.

51 TURNING ATTRIBUTES INTO ACTION: TOP RANKED POSITIVE BEHAVIORS WILL IMPACT ENGAGEMENT CLUSTERS THE LINK BETWEEN THE TOP FIVE POSITIVE EFFECTS ON TRUST AND TRUST CLUSTERS If companies exhibit these positive behaviors... it will have its greatest impact in these clusters ENSURES QUALITY CONTROL IN PRODUCTS 86% ENGAGEMENT PRODUCTS & SERVICES INTEGRITY PROTECTS CUSTOMER DATA 85% ENGAGEMENT PRODUCTS & SERVICES INTEGRITY RESPECTS EMPLOYEE RIGHTS 85% ENGAGEMENT INTEGRITY RESPONSIBLE SUPPLY CHAIN MANAGEMENT 83% ENGAGEMENT INTEGRITY PAYS APPROPRIATE LEVEL OF TAX 80% ENGAGEMENT PURPOSE INTEGRITY 51 Q [SPLIT SAMPLE] How important are each of the following factors to building your TRUST in a company? Use a 9-point scale where one means that action is "not at all important to building your trust" and nine means it is "extremely important to building your trust" in a company. (Top 4 Box, Important in Building Trust) Informed Publics in 27 -country global total.
52 NEGATIVE BEHAVIORS ARE MOST LIKELY TO AFFECT PERCEPTIONS OF HAVING AN ETHICAL BUSINESS PRACTICE THE LINK BETWEEN THE TOP FIVE NEGATIVE EFFECTS ON TRUST AND TRUST ACTIONS If companies exhibit these negative behaviors... it will have its greatest impact in these clusters UNETHICAL BUSINESS PRACTICES 81% ENGAGEMENT INTEGRITY FAILS TO KEEP CUSTOMER INFORMATION SECURE 80% INTEGRITY IRRESPONSIBLE DURING A CRISIS 80% INTEGRITY SUB-STANDARD WORK CONDITIONS 79% ENGAGEMENT INTEGRITY MISREPRESENTS THE COMPANY 79% ENGAGEMENT INTEGRITY 52 Q [SPLIT SAMPLE] Please indicate whether each of the below actions would impact your trust in a company using a 9-point scale, where one means that action has "no impact on your trust in a company" and nine means it "has a significant negative impact on your trust in a company. " You can use any number from one to nine, the higher the number the more that action would have a negative impact on your trust in a company. (Top 4 Box, Negative Impact on Trust) Informed Publics in 27 -country global total.
53 AUSTRALIA IN TRANSITION Emerging opportunities for business and communications New opportunities Exciting changes for communications international perspective, financing partnerships, better understanding of regional trends New industries and new areas to drive debate, policy and be seen Agribusiness world class and growing global need Gas and clean coal access and technology catch up Tourism Education STEM Wealth management international We have: Low sovereign risk Proximity to Asia Assets to develop Australian advantages meets global opportunities where they will intersect is the big question 53
54 COMMUNICATIONS Move from being consumed by channels and execution outputs based to broader business position Regulatory, political and business environment presents opportunities See the company s role now and into the future Play at a different level Follow big trends, observe data and develop commercial feeling PR + communication industry s relevance based on advisory position not just execution. There will always be requirement for communication tools, videos, community engagement. Australia s position presents real opportunity. 54


55 On the cover, from top left: Japanese Prime Minister Shinzo Abe: REUTERS/Toru Hanai; Malala Yousefzai: REUTERS/Darren Staples; Brazilian Oil and Gas Magnate Eike Batista: REUTERS/Fred Prouser; Anti-Government Protests in Turkey: REUTERS/Murad Sezer; Lord Justice Leveson, chair of The Leveson Inquiry: REUTERS/Stefan Wermuth; Hong Kong Protests in Favor of Edward Snowden: REUTERS/Bobby Yip; U.S. Government Shutdown: REUTERS/Mike Theiler
1 Edelman, All rights reserved. EDELMAN TRUST BAROMETER APAC RESULTS
 1 Edelman, 2012. All rights reserved. 2012 EDELMAN TRUST BAROMETER APAC RESULTS 2012 Edelman Trust Barometer Asia Pacific Findings METHODOLOGY OVERVIEW Twelfth annual study GENERAL PUBLIC INFORMED PUBLIC
#EdelTrust AUSTRALIA
 #EdelTrust AUSTRALIA A YEAR OF THE UNPREDICTABLE & UNIMAGINABLE 15 YEARS OF TRUST Business must partner with government to regain trust Trust shifts from authorities to peers Young influencers have more
2016 Edelman Trust Barometer. Canada Report
 2016 Edelman Trust Barometer Canada Report THE STORIES THAT SHAPED 2015 3 4 State of Trust Trust Rising Per cent trust in the four institutions of government, business, media and NGOs, 2015 vs. 2016 2015
2011 Edelman Trust Barometer Findings
 2011 Edelman Trust Barometer Findings Edelman Trust Barometer at a glance Eleventh annual study 5,075 people in 23 countries on five continents Ages 25 to 64 College-educated In top 25% of household income
2018 Edelman Trust Barometer
 2018 Edelman Trust Barometer Global Trust in Technology #TrustBarometer 1 2018 Edelman Trust Barometer Methodology Online Survey in 28 Countries 18 years of data 33,000+ respondents total All fieldwork
2018 Edelman Trust Barometer
 2018 Edelman Trust Barometer State of Trust Among U.S. Hispanics #TrustBarometer 2018 Edelman Trust Barometer Methodology Online Survey in 28 Markets 18 years of data 33,000+ respondents total All fieldwork
2018 Edelman Trust Barometer
 2018 Edelman Trust Barometer Special Report: Trust in Indian Business A Global Perspective #TrustBarometer 2018 Edelman Trust Barometer Methodology Online survey in 28 markets 18 years of data 33,000+
POWER & RESPONSIBILITY. We are Edelman Purpose & Technology
 POWER & RESPONSIBILITY. We are Edelman Purpose & Technology WHAT THE PEOPLE SAID. METHODOLOGY 2018 Edelman Trust Barometer The global state of trust 28 Markets 18 years of data 33,000+ respondents total
2018 Edelman Trust Barometer
 2018 Edelman Trust Barometer Expectations for CEOs #TrustBarometer 1 2018 Edelman Trust Barometer Methodology Online Survey in 28 Markets 18 years of data 33,000+ respondents total All fieldwork was conducted
2018 Edelman Trust Barometer
 2018 Edelman Trust Barometer Australia #TrustBarometer 2018 Edelman Trust Barometer Methodology Online Survey in 28 Countries 18 years of data 33,000+ respondents total All fieldwork was conducted late
2018 Edelman Trust Barometer
 2018 Edelman Trust Barometer Methodology Edelman Trust Barometer 18 years of studying trust Launched annually at the World Economic Forum Annual Meeting in Davos Inaugural Family Business Special Report
2018 Edelman Trust Barometer
 2018 Edelman Trust Barometer Snapshot Australia #TrustBarometer Trust Index A World of Distrust Average trust in institutions, general population, 2017 vs. 2018 Global Trust Index remains at distruster
2016 Edelman Trust Barometer. Global Report
 2016 Edelman Trust Barometer Global Report Methodology General Online 5 years in 25+ markets Ages 18+ 1,150 respondents per country Online Survey in 28 Countries 16 years of data 33,000+ respondents total
#TrustBarometerNZ. Winston Peters and Jacinda Ardern/TPPA protest Stuff Limited
 #TrustBarometerNZ Winston Peters and Jacinda Ardern/TPPA protest Stuff Limited 1 2018 Edelman Trust Barometer Methodology Online Survey in 28 Countries 18 years of data 33,000+ respondents total All fieldwork
2019 EDELMAN TRUST BAROMETER
 2019 EDELMAN TRUST BAROMETER Hong Kong #TrustBarometer 19 TH ANNUAL EDELMAN TRUST BAROMETER Methodology General Online Population 1,150 respondents per market Ages 18+ All slides show general online population
2010 Edelman Trust Barometer January 22, 2010
 2010 Edelman Trust Barometer January 22, 2010 Edelman Trust Barometer at a glance Tenth annual study 4,875 people in 22 countries on five continents Ages 25 to 64 College-educated In top 25% of household
2019 EDELMAN TRUST BAROMETER
 2019 EDELMAN TRUST BAROMETER Global Report #TrustBarometer 19 th ANNUAL EDELMAN TRUST BAROMETER Methodology General Online Population 1,150 respondents per market Ages 18+ All slides show general online
Banking Reform Program. Report on Consumer Study Wave Two
 Banking Reform Program Report on Consumer Study Wave Two Banks success is inextricably tied to the economy. When Australia does well, banks do well. Australia s banks are key to Australia s economic success.
2018 Edelman Trust Barometer
 2018 Edelman Trust Barometer Global Report #TrustBarometer 1 2018 Edelman Trust Barometer Methodology Online Survey in 28 Countries 18 years of data 33,000+ respondents total All fieldwork was conducted
2018 Edelman Trust Barometer
 2018 Edelman Trust Barometer Global Report #TrustBarometer 1 2018 Edelman Trust Barometer General Online Population Informed Public 7 years in 25+ markets 10 years in 20+ markets Ages 18+ Methodology 1,150
2017 Edelman Trust Barometer. Special Report: Institutional Investors New Challenges and Expectations for Public Companies
 2017 Edelman Trust Barometer Special Report: Institutional Investors New Challenges and Expectations for Public Companies 2017 Edelman Trust Barometer Special Report: Institutional Investors Age % Under
Edelman Trust Barometer
 Edelman Trust Barometer Special Report: Institutional Investors U.S. Results #TrustBarometer 1 Institutional Investor Trust Report Methodology Contents N=500 Institutional Investors Online quantitative
CEOs confidence rises for 2014
 News release Date 21 January, 2014 Contact Jonathan Hicks, PwC Tel: 1-441-299-7182/1-441-505-6050 e-mail: jonathan.p.hicks@bm.pwc.com Pages 5 Marina Mello, PwC Tel: 1-441-299-7184/1-441-505-3127 e-mail:
Global Business Barometer April 2008
 Global Business Barometer April 2008 The Global Business Barometer is a quarterly business-confidence index, conducted for The Economist by the Economist Intelligence Unit What are your expectations of
THE NEXT GENERATION OF TRUST. Iñigo Bengoechea, CFA Global Head of Government and Regulator Relations CFA Institute January 2019
 THE NEXT GENERATION OF TRUST Iñigo Bengoechea, CFA Global Head of Government and Regulator Relations CFA Institute January 2019 2 CFA INSTITUTE LEADS THE INVESTMENT PROFESSION GLOBALLY By promoting the
GIPS AND THE ASIAN MARKET. Annie K. Lo, CFA, CIPM, CAIA
 GIPS AND THE ASIAN MARKET Annie K. Lo, CFA, CIPM, CAIA AGENDA Global Market and Ethical Landscape 2015 Global Market Sentiment Survey (GMSS) 2015 Edelman Trust Barometer Restoring Investor Trust Asset
Edelman Trust Barometer Executive Summary
 2012 Edelman Trust Barometer Executive Summary 2012 Trust Barometer: Business Can Earn the License to Lead In 2008-2009, in the wake of a recession that saw large, global companies such as Lehman Brothers
Global Construction 2030 Expo EDIFICA 2017 Santiago Chile. 4-6 October 2017
 Global Construction 2030 Expo EDIFICA 2017 Santiago Chile 4-6 October 2017 Graham Robinson Global Construction Perspectives Global Construction 2030 is the fourth in a series of global studies of the construction
Global Investor Study 2017
 Global Investor Study 2017 Investor behaviour: from priorities to expectations Global Investor Study 2017 1 Contents 3 Overview 11 Millennials paint a conflicted picture 4 The global thirst for more investment
Global Consumer Confidence
 Global Consumer Confidence The Conference Board Global Consumer Confidence Survey is conducted in collaboration with Nielsen 4TH QUARTER 2017 RESULTS CONTENTS Global Highlights Asia-Pacific Africa and
CEOs Less Optimistic about Global Economy for 2015
 Press Release Date 22 January 2014 Contact Vu Thi Thu Nguyet Tel: (04) 3946 2246, Ext. 4690; Mobile: 0947 093 998 E-mail: vu.thi.thu.nguyet@vn.pwc.com Pages 6 CEOs Less Optimistic about Global Economy
New in 2013: Greater emphasis on capital flows Refinements to EBA methodology Individual country assessments
 As in 212: Stock-take: multilaterally consistent assessment of external sector policies of the largest economies Feeds into Article IVs Draws on External Balance Assessment (EBA) methodology/other Identifies
!!!1!!!!!!!!!!!!!!!!!!!!!!!!!!!!! The Association of Real Estate Funds & Property Funds Research
 1 The Association of Real Estate Funds & Property Funds Research Global Real Estate Funds Review H1 216 Contents CONTENTS 2 EXECUTIVE SUMMARY 3 UNLISTED FUND UNIVERSE: OVERVIEW (EX FOF) 6 UNLISTED FUNDS
DFA Global Equity Portfolio (Class F) Quarterly Performance Report Q2 2014
 Quarterly Performance Report Q2 2014") DFA Global Equity Portfolio (Class F) Quarterly Performance Report Q2 2014 This presentation has been prepared by Dimensional Fund Advisors Canada ULC ( DFA Canada ), manager of the Dimensional Funds.
DFA Global Equity Portfolio (Class F) Quarterly Performance Report Q2 2014 This presentation has been prepared by Dimensional Fund Advisors Canada ULC ( DFA Canada ), manager of the Dimensional Funds.
EQUITY REPORTING & WITHHOLDING. Updated May 2016
 EQUITY REPORTING & WITHHOLDING Updated May 2016 When you exercise stock options or have RSUs lapse, there may be tax implications in any country in which you worked for P&G during the period from the
2018 Edelman Trust Baromete. Global Report
 2018 Edelman Trust Baromete Global Report 18 Edelman ust Barometer thodology line Survey in 28 Countries ears of data 00+ respondents total eldwork was conducted between ber 28 and November 20, 2017 untry
DFA Global Equity Portfolio (Class F) Performance Report Q2 2017
 Performance Report Q2 2017") DFA Global Equity Portfolio (Class F) Performance Report Q2 2017 This presentation has been prepared by Dimensional Fund Advisors Canada ULC ( DFA Canada ), manager of the Dimensional Funds. This presentation
DFA Global Equity Portfolio (Class F) Performance Report Q2 2017 This presentation has been prepared by Dimensional Fund Advisors Canada ULC ( DFA Canada ), manager of the Dimensional Funds. This presentation
DFA Global Equity Portfolio (Class F) Performance Report Q3 2018
 Performance Report Q3 2018") DFA Global Equity Portfolio (Class F) Performance Report Q3 2018 This presentation has been prepared by Dimensional Fund Advisors Canada ULC ( DFA Canada ), manager of the Dimensional Funds. This presentation
DFA Global Equity Portfolio (Class F) Performance Report Q3 2018 This presentation has been prepared by Dimensional Fund Advisors Canada ULC ( DFA Canada ), manager of the Dimensional Funds. This presentation
DFA Global Equity Portfolio (Class F) Performance Report Q4 2017
 Performance Report Q4 2017") DFA Global Equity Portfolio (Class F) Performance Report Q4 2017 This presentation has been prepared by Dimensional Fund Advisors Canada ULC ( DFA Canada ), manager of the Dimensional Funds. This presentation
DFA Global Equity Portfolio (Class F) Performance Report Q4 2017 This presentation has been prepared by Dimensional Fund Advisors Canada ULC ( DFA Canada ), manager of the Dimensional Funds. This presentation
Financial wealth of private households worldwide
 Economic Research Financial wealth of private households worldwide Munich, October 217 Recovery in turbulent times Assets and liabilities of private households worldwide in EUR trillion and annualrate
DFA Global Equity Portfolio (Class F) Performance Report Q3 2015
 Performance Report Q3 2015") DFA Global Equity Portfolio (Class F) Performance Report Q3 2015 This presentation has been prepared by Dimensional Fund Advisors Canada ULC ( DFA Canada ), manager of the Dimensional Funds. This presentation
DFA Global Equity Portfolio (Class F) Performance Report Q3 2015 This presentation has been prepared by Dimensional Fund Advisors Canada ULC ( DFA Canada ), manager of the Dimensional Funds. This presentation
How Much Are Advertisers Ready to Pay for Installs? Clickky CPI Index May 16
 How Much Are Advertisers Ready to Pay for Installs? Clickky CPI Index May 16 We are pleased to introduce the Clickky CPI Index, which shows the current state of market demand. We calculated the Index for
Travel Insurance and Assistance in the Asia-Pacific Region
 Travel Insurance and Assistance in the Asia-Pacific Region Report Prospectus October 2013 Web: www.finaccord.com. E-mail: info@finaccord.com 1 Prospectus contents Page What is the research? What methodology
2017 Acumen Edelman Trust Barometer New Zealand Report. Join the conversation #TrustBarometerNZ
 2017 Acumen Edelman Trust Barometer New Zealand Report Join the conversation #TrustBarometerNZ 2017 Edelman Trust Barometer Methodology Online Survey in 28 Countries General Online Population Informed
Second Quarter Trading Update 9 July 2010
 Second Quarter Trading Update 9 July 2010 Michael Page International Second Quarter Trading Update 2010 2 Group gross profit Constant Group gross profit m m Reported exchange 2010 vs 2009 111.5 83.8 +33.1%
A short history of debt
 A short history of debt In the words of the late Charles Kindleberger, debt/financial crises are a hardy perennial we have been here many times before. Over the past decade and a half the ratio of global
Global Investment Trends Survey May A study into global investment trends and saver intentions in 2015
 May 2015 A study into global investment trends and saver intentions in 2015 Global highlights Schroders at a glance Schroders at a glance At Schroders, asset management is our only business and our goals
Emerging Capital Markets AG907
 Emerging Capital Markets AG907 M.Sc. Investment & Finance M.Sc. International Banking & Finance Lecture 2 Corporate Governance in Emerging Capital Markets Ignacio Requejo Glasgow, 2010/2011 Overview of
2017 Global Trends in Investor Relations
 0 2017 Global Trends in Investor Relations Primacy of Geopolitical Risk Geopolitical risk is still the number one concern for companies globally. Concern is increasing regarding the impact of emerging
Frequently Asked Questions Transparency International 2008 Bribe Payers Index
 Frequently Asked Questions Transparency International 1. What is the Transparency International (BPI)? 2. Which countries are included in the 2008 BPI? 3. How is the 2008 BPI calculated? 4. Whose views
Tim Payne Senior Partner, Head of Asia Brunswick Group. Striking Patterns and Trends Impacting Global M&A
 Tim Payne Senior Partner, Head of Asia Brunswick Group Striking Patterns and Trends Impacting Global M&A Financial 1 The convergence of business, society & politics has created a more complex environment
World s Best Investment Bank Awards 2018
 Global Finance will publish its selections for the 19th Annual World s Best Investment Banks in the April 2018 issue. Winners will be honored at an awards ceremony in New York City in March, and all award
The 2019 Chief Digital Officer Study Global Findings
 The 2019 Chief Digital Officer Study Global Findings PwC March 2019 Company demographics 2 CDO growth slowed down: 21% of all companies have a CDO in place Percentage of CDOs 1) 2018 21% 2016 19% 2014
Division on Investment and Enterprise
 Division on Investment and Enterprise Readers are encouraged to use the data in this publication for non-commercial purposes, provided acknowledgement is explicitly given to UNCTAD, together with the reference
FRANKLIN TEMPLETON INVESTMENTS. Franklin Resources, Inc. Bank of America Merrill Lynch Banking and Financial Services Conference November 18, 2010
 Franklin Resources, Inc. Bank of America Merrill Lynch Banking and Financial Services Conference November 18, 2010 Forward-Looking Statements The financial results in this presentation are preliminary.
Global Exhibition Barometer 13 th edition (July 2014)
") Global Exhibition Barometer 13 th edition A UFI report based on the results of a survey conducted in June among UFI*, SISO**, AFIDA*** & EXSA**** Members (*) Global (**) USA (***) Central & South America
Global Exhibition Barometer 13 th edition A UFI report based on the results of a survey conducted in June among UFI*, SISO**, AFIDA*** & EXSA**** Members (*) Global (**) USA (***) Central & South America
F U T U R E O F W O R K
 H E A L T H W E A L T H C A R E E R F U T U R E O F W O R K Milan Taylor Partner, Mercer G E O P O L I T I C A L V O L AT I L I T Y G L O B A L T R E N D N O T J U S T U S What is on our employees minds?
Manpower Employment Outlook Survey Global
 Manpower Employment Outlook Survey Global 3 216 Global Employment Outlook ManpowerGroup interviewed nearly 59, employers across 43 countries and territories to forecast labor market activity in Quarter
UP OR DOWN? 2015 Q3 NIELSEN GLOBAL SURVEY OF CONSUMER CONFIDENCE AND SPENDING INTENTIONS
 UP OR DOWN? 2015 Q3 NIELSEN GLOBAL SURVEY OF CONSUMER CONFIDENCE AND SPENDING INTENTIONS Among the world s largest economies, U.S. consumer confidence jumped 18 index points in the third quarter to a score
This article is on Capital Adequacy Ratio and Basel Accord. It contains concepts like -
 This article is on Capital Adequacy Ratio and Basel Accord It contains concepts like - Capital Adequacy Capital Adequacy Ratio (CAR) Benefits of CAR Basel Accord Origin Basel Accords I, II, III Expected
San Francisco Retiree Health Care Trust Fund Education Materials on Public Equity
 M E K E T A I N V E S T M E N T G R O U P 5796 ARMADA DRIVE SUITE 110 CARLSBAD CA 92008 760 795 3450 fax 760 795 3445 www.meketagroup.com The Global Equity Opportunity Set MSCI All Country World 1 Index
the Flight to Equities Continues
 the Flight to Equities Continues By Gerry Hansell, Jeff Kotzen, Frank Plaschke, Eric Olsen, and Hady Farag This is the first in a series of articles published as part of The Boston Consulting Group s 24
The Rule of Law as a Factor for Competitiveness
 The Rule of Law as a Factor for Competitiveness Lessons from the Global Competitiveness Index 2008-2009 Irene Mia Director, Senior Economist Global Competitiveness Network, World Economic Forum OECD Workshop
UK ECONOMY SITUATION & PROSPECTS
 UK ECONOMY SITUATION & PROSPECTS 26 November 2013 Hermione Gough Counsellor Europe and Global Issues British Embassy Paris UNCLASSIFIED 1 The pace of recovery picked up further in Q3, with UK GDP expanding
Development Updates and Trends : Opportunities and Risks Local Details Operating for a Global Strategy
 Development s and Trends : Opportunities and Risks Local Details Operating for a Global Strategy Claro dg. Cordero, Jr. Head Research, Consulting & Valuation Services 19 October 2012 1 Discussion agenda
First ever quarter with over 200m Gross Profit
 11 July 2018 and H1 2018 Trading Update Steve Ingham Kelvin Stagg Chief Executive Officer Chief Financial Officer First ever quarter with over 200m Gross Profit LSE: PAGE.L Website: http://www.page.com/investors
WORKING DRAFT Last Modified 4/10/2012 3:27:03 PM Central Standard Time Printed. Long-term capitalism. Icare Santiago presentation April 2012
 WORKING DRAFT Last Modified 4/10/2012 3:27:03 PM Central Standard Time Printed Long-term capitalism Icare Santiago presentation April 2012 Five mega-trends reshaping the global economy The great rebalancing
Lecture 13 International Trade: Economics 181 Foreign Direct Investment (FDI) and Multinational Corporations (MNCs)
 and Multinational Corporations (MNCs)") Lecture 13 International Trade: Economics 181 Foreign Direct Investment (FDI) and Multinational Corporations (MNCs) REMEMBER: Midterm NEXT TUESDAY. Office hours next week: Monday, 12 to 2 for Ann Harrison
Lecture 13 International Trade: Economics 181 Foreign Direct Investment (FDI) and Multinational Corporations (MNCs) REMEMBER: Midterm NEXT TUESDAY. Office hours next week: Monday, 12 to 2 for Ann Harrison
Talent in Insurance 2015 The Netherlands in Focus. UK Financial Services Insight
 Talent in Insurance 2015 The Netherlands in Focus UK Financial Services Insight Report contents The Netherlands in Focus Key findings Macroeconomic and industry context Survey findings 2 Key findings 3
Reporting practices for domestic and total debt securities
 Last updated: 27 November 2017 Reporting practices for domestic and total debt securities While the BIS debt securities statistics are in principle harmonised with the recommendations in the Handbook on
The Global Economic Crisis: Asia and the role of China Elliott School of International Affairs, George Washington University March 31, 2009
 The Global Economic Crisis: Asia and the role of China Elliott School of International Affairs, George Washington University March 31, 29 Anoop Singh Asia and Pacific Department IMF 1 Five key questions
H S B C H O L D I N G S P L C HSBC HOLDINGS PLC THE CAPITAL REQUIREMENTS. (Country-by-Country Reporting) REGULATION 2013
 REGULATION 2013") HSBC HOLDINGS PLC THE CAPITAL REQUIREMENTS (Country-by-Country Reporting) REGULATION 2013 31 December 2015 This report has been prepared for HSBC Holdings plc and its subsidiaries (the HSBC Group ) to
HSBC HOLDINGS PLC THE CAPITAL REQUIREMENTS (Country-by-Country Reporting) REGULATION 2013 31 December 2015 This report has been prepared for HSBC Holdings plc and its subsidiaries (the HSBC Group ) to
Balanced Plus Select Portfolio Pn
 Factsheet as at : August 25, 2018 Balanced Plus Select Portfolio Pn Fund objective This portfolio aims to provide long-term capital growth while keeping risk in a target volatility range of 10-12% over
Best Treasury & Cash Management Providers 2017
 Page 1 of 5 In March 2017, Global Finance will publish its selections for the Seventeenth Annual World s Best Treasury & Cash Management Providers. Global Finance will select the best overall global cash
Foreign Direct Investment in the United States 2013 Preliminary Data. Organization for International Investment (OFII)
") Foreign Direct Investment in the United States 2013 Preliminary Data Organization for International Investment (OFII) Key Findings: Foreign Direct Investment in the United States, 2003-2013 1 Foreign direct
Foreign Direct Investment in the United States 2013 Preliminary Data Organization for International Investment (OFII) Key Findings: Foreign Direct Investment in the United States, 2003-2013 1 Foreign direct
All-Country Equity Allocator July 2018
 Leila Heckman, Ph.D. lheckman@dcmadvisors.com 917-386-6261 John Mullin, Ph.D. jmullin@dcmadvisors.com 917-386-6262 Allison Hay ahay@dcmadvisors.com 917-386-6264 All-Country Equity Allocator July 2018 A
Despite global headwinds, U.S. companies see opportunities abroad
 International Business Indicator Despite global headwinds, U.S. companies see opportunities abroad April 2016 65 About the Wells Fargo International Business Indicator The Wells Fargo International Business
Balanced Select Portfolio Pn
 Factsheet as at : September 22, 2018 Balanced Select Portfolio Pn Fund objective This portfolio aims to provide long-term capital growth while keeping risk in a target volatility range of 8-10% over a
Global Investor Survey 2017 Dutch consumers
 Global Investor Survey 2017 Dutch consumers A global study of consumer engagement, investment outcomes and future perceptions November 2017 For Professional investors or advisers only For media only. Schroders
1st Quarter Revenue. April 22, 2010
 1st Quarter Revenue April 22, 2010 Disclaimer This presentation contains forward looking statements. The use of the words "aim(s)," "expect(s)," "feel(s)," "will," "may," "believe(s)," "anticipate(s)"
Executive Summary. The Transatlantic Economy Annual Survey of Jobs, Trade and Investment between the United States and Europe
 The Transatlantic Economy 2011 Annual Survey of Jobs, Trade and Investment between the United States and Europe Daniel S. Hamilton Daniel S. Hamilton and Joseph P. Quinlan and Joseph P. Quinlan Center
2018 Global Survey of Accounting Assumptions. for Defined Benefit Plans. Executive summary
 2018 Global Survey of Accounting Assumptions for Defined Benefit Plans Executive summary Executive summary In broad terms, accounting standards aim to enable employers to approximate the cost of an employee
The i-graduate ICEF Agent Barometer Sarah Mines, Sales Director Canada, ICEF
 The i-graduate ICEF Agent Barometer 2015 Sarah Mines, Sales Director Canada, ICEF The i-graduate ICEF Agent Barometer Online survey developed in partnership by i-graduate & ICEF Established in 2007, the
Charting Brunei s Economy
 Charting Brunei s Economy Designed to help executives catch up with the economy and incorporate macro impacts into company s planning. Annual subscription includes 2 semiannual issues published in June
Prudential supervisors and external auditors. Marc Pickeur, CBFA Brussels, 27 October
 Prudential supervisors and external auditors Marc Pickeur, CBFA Brussels, 27 October 2010 1 Disclaimer The views expressed by the speaker are entirely his own, and are not to be taken to represent those
All-Country Equity Allocator February 2018
 Leila Heckman, Ph.D. lheckman@dcmadvisors.com 917-386-6261 John Mullin, Ph.D. jmullin@dcmadvisors.com 917-386-6262 Charles Waters cwaters@dcmadvisors.com 917-386-6264 All-Country Equity Allocator February
1.1. STOXX TOTAL MARKET INDICES
 STOXX INDEX LIST A-Z 1. TOTAL MARKET INDICES 1/14 1.1. STOXX TOTAL MARKET INDICES Regional indices STOXX BRIC TMI STOXX Developed and Emerging Markets TMI STOXX Developed Markets TMI STOXX Emerging Markets
ManpowerGroup Employment Outlook Survey Global
 ManpowerGroup Employment Outlook Survey Global 1 19 ManpowerGroup interviewed over 6, employers across 44 countries and territories to forecast labor market activity* in January-March 19. All participants
Exchange Traded Funds (ETFs): The New Packaged Product of Choice
: The New Packaged Product of Choice") Financial Institutions Profiles Series Exchange Traded Funds (ETFs): The New Packaged Product of Choice (Table of Contents) April 20, 2017 TABLE OF CONTENTS Evolution of the Exchange Traded Funds (ETFs)
Financial Institutions Profiles Series Exchange Traded Funds (ETFs): The New Packaged Product of Choice (Table of Contents) April 20, 2017 TABLE OF CONTENTS Evolution of the Exchange Traded Funds (ETFs)
The Evolving Trust Landscape: What It Means for Business and Stakeholder Relationships
 The Evolving Trust Landscape: What It Means for Business and Stakeholder Relationships Insights from the 2008 Edelman Trust Barometer Mark Shadle April 24, 2008 2008 Trust Barometer 1 Trust Matters We
Investment Newsletter
 INVESTMENT NEWSLETTER September 2016 Investment Newsletter September 2016 CLIENT INVESTMENT UPDATE NEWSLETTER Relative Price and Expected Stock Returns in International Markets A recent paper by O Reilly
Dow Jones Sustainability Indexes (DJSI) Annual Review 2005
 Annual Review 2005") Dow Jones Sustainability Indexes (DJSI) Annual Review 2005 Zurich, Switzerland 7 September 2005 A cooperation of Dow Jones Indexes, STOXX Ltd. and SAM Group 1 Content I. Key Facts II. III. IV. Research
Dow Jones Sustainability Indexes (DJSI) Annual Review 2005 Zurich, Switzerland 7 September 2005 A cooperation of Dow Jones Indexes, STOXX Ltd. and SAM Group 1 Content I. Key Facts II. III. IV. Research
International Debt Collection: the 2018 edition of collection complexity
 Economic Insight International Debt Collection: the 2018 edition of collection complexity February 1, 2018 Authors: Maxime Lemerle +33 1 84 11 54 01 maxime.lemerle@eulerhermes.com Executive Summary The
Edelman Trust Barometer
 Edelman Trust Barometer Special Report: Institutional Investors 2018 Results #TrustBarometer Institutional Investor Trust Report Methodology Contents N= 500 Institutional Investors Online quantitative
Foreign Direct Investment in the United States. Organization for International Investment
 Foreign Direct Investment in the United States Organization for International Investment March 16, 2011 FOREIGN DIRECT INVESTMENT IN THE UNITED STATES Key Findings Foreign Direct Investment in the United
1.1. STOXX TOTAL MARKET INDICES
 1. BROAD TOTAL MARKET INDICES/BENCHMARK INDICES, EQUAL WEIGHT INDICES 1/15 1.1. STOXX TOTAL MARKET INDICES Regional indices STOXX BRIC TMI STOXX Developed and Emerging Markets TMI STOXX Developed Markets
Index. tax evasion ethics in tax system change in Bureaucracy 3-11 Canada
 Ability to pay principle 58 Administrative burden 51-79, 73-90, 430 Albania 112 Alternative Minimum Tax (AMT) 75 Anti-capitalistic mentality 318 Appeals in Armenia 317 Argentina 281-308 Armenia 113, 309-358
Deutsche Global Infrastructure Fund (TOLLX)
") Global Infrastructure Fund (TOLLX) A step beyond MLPs Important risk information Any fund that concentrates in a particular segment of the market will generally be more volatile than a fund that invests
Global Infrastructure Fund (TOLLX) A step beyond MLPs Important risk information Any fund that concentrates in a particular segment of the market will generally be more volatile than a fund that invests
Quarterly Investment Update First Quarter 2017
 Quarterly Investment Update First Quarter 2017 Market Update: A Quarter in Review March 31, 2017 CANADIAN STOCKS INTERNATIONAL STOCKS Large Cap Small Cap Growth Value Large Cap Small Cap Growth Value Emerging