CONTENTS. Acerinox Group in Figures Letter from the Chairman Letter from the Chief Executive Officer... 8
|
|
|
- Clyde Townsend
- 6 years ago
- Views:
Transcription

1 REPORT 2013
2 REPORT 2013

3

4 CONTENTS Acerinox Group in Figures... 4 Letter from the Chairman... 6 Letter from the Chief Executive Officer... 8 Directors Report of Acerinox Acerinox 1. A Spanish Multinational with Factories on four Continents Commercial Network Human Resources Board of Directors of Acerinox, S.A Annual Corporate Governance Report. Risk Management Results 1. Production of Acerinox Sales Economic Report Shareholder Returns Stock Market Information World Markets 1. Worldwide Production of Stainless Steel Raw Materials Markets Excellence Plan / Investments / R+D+i 1. Excellence Plan Investments R+D+i Important Recent Events since the Closing of the Financial Year Sustainability Report Consolidated Annual Accounts Individual Corporations of the Acerinox Group
5 Acerinox Group in Figures Melting shop production Net sales 2,021 2,189 2,225 Thousand Mt 4,672 4,555 3,966 Million euros E.B.I.T.D.A. E.B.I.T. 341 Million euros % over sales 192 Million euros % over sales 7.3% % % 5.8% % 2.2% Result before taxes 133 Million euros Result after taxes and minorities 74 Million euros Earning per share Net cash flow Investments 221 Million euros 209 Million euros
6 R.O.E. 7.0 R.O.C.E. 3.9 % % Book value per share december, 31st Euros Share value Official close of the business year Euros Return to shareholders Dividend + Issue premium Euros / Share Net financial debt 887 Million euros Net financial debt / Ebitda No. of times 2.32 Net financial debt / equity %

7 Letter from the Chairman Dear shareholders, This year it is again an honour to have the opportunity to address you as Chairman of ACERINOX, to analyse the progress of the Company during the year The year 2013 has had two very different halves, the first one in which we witnessed the toughest market conditions during the economic downturn, and the second half which saw the turning point to begin the long-awaited process of economic recovery. World stainless steel production and consumption has increased by 7.8% and maintains its excellent cumulative annual growth rate of around 6% over the last sixty years. However, this growth has taken place in China which now accounts for 50% of world production. Our company has also increased its production despite continuing its strict policies on inventory and working capital control. Within this general setting, Acerinox has continued to develop its fundamental objective of improving competitiveness in industrial plants and in distribution. We aim to reach new levels of competitiveness adapted to the levels of activity and standards that the markets demand in the current situation. This is articulated through our Excellence Plans which are obtaining very satisfactory results, reaching 68% of the targets in the first year of implementation of the third edition of the Plan. We have also continued to strengthen our balance sheet. During 2013 our financial management has remained highly consistent, paying particular attention to the credit lines, working capital and net debt reduction. The annual result, which has returned to positive, is 22 million euros, and despite the complexity of the markets this allows us to be optimistic about the coming financial years. We have continued to develop our Strategic Plan according to its planned stages and schedule. Essentially, this plan seeks to strengthen our presence in Asia with the establishment of an integral stainless steel manufacturing plant in Malaysia, Bahru Stainless, and the establishment of commercial offices in countries in the area where we were not yet present. 6
8 From the institutional point of view, I would like to highlight that again this year the Board of Directors will propose maintaining our shareholder remuneration policy, with the choice between payment in cash or shares, through the use of a flexible dividend or scrip dividend as we did last year and was so well received. Finally, I would like to thank all the staff of our organization for their continuing hard work and dedication to our project and to our shareholders for their daily support and confidence which helps us make Acerinox a competitive company and a safe and profitable investment. D. Rafael Naranjo Olmedo Chairman 7

9 Letter from the Chief Executive Officer Dear shareholders, For another year, I have the honour of addressing you to account for the results of Acerinox in a difficult year, one which began with rock-bottom prices and a lack of confidence in the markets that was reflected in the price of nickel, a fundamental raw material in the manufacture of stainless steel, which continued its fall for the third straight year, devaluing our stocks, pushing prices down and putting a drag on our commercial activity. This situation has been repeating itself ever since 2008 when the economy reversed course, putting an end to a long period of bonanza. Since then, we have considered all these years to be tough ones, with the hopes of someday returning to the good old days; but we must stop and think about how many years have to go by before a temporary situation becomes a permanent one, and when exactly what we consider to be tough, when repeated so often, becomes the norm. In such a scenario, it is a pleasure for me to announce that Acerinox has once again yielded positive results, having obtained a profit after tax and minority interest of 22 million euros and it has done so in one of the worst years of this crisis. In these last six years, thanks to the support you, our shareholders, have lent us, we have had the opportunity to place our business model under review and adapt it to a changing market in which flexibility and competitiveness will play fundamental roles. In the 2013 financial year, we have hit a turning point that marks the commencement of a new era. We are convinced that the economic recovery process has already begun in Europe, and even Spain, and that in 2014 we will join the other regions which have already rebooted their economies. The process will not be an easy one, nor will it be swift, but at Acerinox we are optimistically seeing a new cycle, one where standards will be high, the search for excellence will be constant, and sustainability will be the undeniable mark of quality. We began 2013 with no changes in sight; in the same conditions as the second half of 2012 and, if we remember correctly, with a loss of 58 million euros. In the first quarter of 2013, normal stock replenishment was off the table, as market fears would not permit it, and nor did the price of nickel encourage speculative purchases. In such circumstances, our efforts to raise prices were fruitless, and so throughout the first half of the year we were forced to keep them at their lowest level of the last few years. All the first-half data that were coming in, both from our factories production and our financial results, were situated below the same period in Although steel production had only dropped by 0.9% in the January- June period, the net results of 16.1 million euros were 59.9% lower than those from the first half of 2012, while the EBITDA was 28.2% lower at119.1 million euros, although it was 3.8 times that from the second half of
10 I can assure you that these results, by no means brilliant, were achieved thanks to the enormous effort of the entire Acerinox team, who have been completely dedicated to applying our Plan of Excellence and all our costcutting programmes. With the economic recovery not quite having reached Europe, the apparent consumption of stainless steel dropping by 2.4% compared to the first half of 2012, a degree of uncertainty regarding the future consolidation of the European stainless steel industry, and Acerinox results that had not quite turned the corner, it was not surprising the markets would lose interest in our stock, to the point of forcing us to abandon the IBEX-35, which finally did occur in December. On this point, I am utterly convinced that we are capable of getting people excited again about our business and returning to the Spanish index. Since September, with stainless steel inventories very low and stabilised throughout the world, the price of nickel also finally stabilised after three years of steady decline, and the first positive news regarding European consumption being reported, little by little we began to improve our production and financial figures, which has allowed us to end the year better than Indeed, in September we began hearing positive news regarding stainless steel consumption and, with the initial data available, we estimate that in the year as a whole, it may have grown about 1.7%, thanks to Northern Europe countries, but also with a very noteworthy contribution from southern tier countries. It seems that we have at last touched bottom, as is evidenced by 2.7% growth in Spain and 1.9% in Italy. The principle motor behind this swing would be the capital goods sector in the export of heavy equipment, but also in the investment intended for the exportation of products which are made with this equipment. The US market had good performance, growing nearly 4% thanks to consumer goods, particularly the motor and household appliance industries, but also due to something we are sorely missing in Europe: energy investments, which even allowed for slight price increases in the third quarter. Asia continued being the region with the largest growth rates. Although we still lack definitive data, we estimate that consumer growth there will be situated around 14%, and its production will hover around 50% of world production. I have mentioned that flexibility was going to be fundamental, and thanks to this flexibility, we managed to cut back on our activities during the summer months in order to adapt more quickly to the posterior change in trend and have a better fourth quarter than expected. In the year as a whole, our steel production reached 2,225,018 tonnes, 1.6% higher than Hot-rolled steel totalled 1,941,063 tonnes, 1.4% higher, while cold-rolled totalled 1,499,429 tonnes, surpassing that of 2012 by 5.7%. Our revenue for the financial year was billion euros, 13% less than 2012, despite sales of physical units only dropping by 1.4%. This is explained by the continued decline in nickel prices and the low base prices we had to endure throughout the year. 9
11 Letter from the Chief Executive Officer Our net EBITDA, 228 million euros, is 15% higher than that of 2012, while the income after tax and minority interest was 22 million euros, versus the 18.3 million loss in 2012, after having made end-of-year inventory adjustments to adjust our stock to the net realisable value to the amount of 11 million euros. The working capital management and the stock reduction carried out in the second half of the year allowed us to end the year with 529 million euros of net debt and a debt/ebitda ratio of 2.3, fully satisfying the condition stipulated by our financing. During the financial year we invested 126 million euros, 47% in the new plant we are building in Malaysia, Bahru Stainless. It is also worth mentioning that 31.3% of investment went to Acerinox Europe, mainly to the plant in Campo de Gibraltar, where we have made investments of 261 million euros since 2008 to provide it with the latest technological equipment and situate it at the forefront of the world steel industry. Very few companies have placed so much faith in Spanish industry in this period of crisis, particularly in Andalusia. And the reaction could not have been better, as it has responded magnificently to all the improvement plans by increasing its competitiveness despite rising energy costs and social contributions. In 2013, important maintenance work and new equipment installations were carried out in the steelworks and hot-roller lines, completely overhauling the electronic control system of skin-pass line number 1, which started operations in 1973, and renovating the CS-2 cross-cut line by giving it faster cutting speeds and a new sheet metal stacking system to improve productivity. All this work was carried out with great precision and all the new equipment is presently operating. We are staying on the investment schedule that we set up in the Strategic Plan, fundamentally centred on the construction of Bahru Stainless The Phase I equipment is currently in operation, while the Phase II machinery is in the process of being put into service and satisfactorily adjusted, proving the quality of its design and the accurate selection of its suppliers. In 2013, our production here grew by 63% and two-thirds of our sales were intended for export, mainly to countries which constitute the ASEAN zone, of which Malaysia is a member. According to plan, once Bahru Stainless is fully operational, we will shift our focus to the progress made by the equipment we have already installed, developing the market and training our personnel, all while we study the engineering of future phases. To do this, our investment needs will be reduced in 2014 to about 70 million euros, which on the other hand, will allow us to better our cash reserves. We also aim to remain loyal to our shareholder return policy. Given the good response we had in 2013, at the General Shareholders Meeting to be held in June 2014, we propose to repeat the scrip dividend or dividend option formula. In 2013 we reached a turning point which has given way to a new cycle and we must look towards the future without becoming too euphoric, which will only generate a sense of distrust. The economic recovery has begun, but it will still be a slow process. But we do have objective reasons to be optimistic. First of all, we have a great product. Stainless steel is an extraordinary material whose worldwide production has continued to grow at an annual rhythm of nearly 6%, it has even been surpassed in 2013 reaching 7.8%. But if during the last few years this growth has been steady thanks to the growth of the so-called emerging countries, especially China, in 2014 we hope there will be a shift to a model of more homogeneous growth in all regions of the world. The United States is growing, as well as Japan and even Europe. The upswing in more developed 10
12 economies will bring growth to stainless steel consumption that, while being moderate in terms of percentages, will be highly significant as to absolute volume and help strike a greater balance between offer and demand. According to estimates by the European steel association EUROFER, 3% growth of apparent steel consumption in Europe is expected in 2014, not only highlighted by capital goods and the motor and household appliance industries, but also the positive development of all other sectors, even construction. This means that we can affirm that the worst has passed. The second reason to believe in the future is the gradual reduction in the overcapacity that affects our industry. And this is refers to China, in particular. In the last decade we have seen how new stainless steel factories have popped up China, a country who had never had a traditional steel industry, spurred on by favourable conditions and protectionist measures that the Asian giant has promoted after declaring stainless steel, among other materials, a strategic product in the country s economic growth. In little over a decade, China has gone from representing 3.7% of the world s production of stainless steel in 2001 to producing nearly 50% of it in This tsunami ended up causing a world glut, altering traditional trade currents. From being a net importer of 2 million tonnes in 2001, it has become a net exporter of 1.8 million in What is more, it has also drawn a large number of our traditional customers to China, who now prefer to manufacture or buy there what was once made in Europe. We estimate that 1.3 million tonnes of stainless steel, or in other words, 30% of the European market, reached Europe s shores in 2012 in the form of manufactured goods, when in 2001 this figure was only 300,000 tonnes. Logically, this phenomenon has had a serious impact on the industry and complaints have been repeatedly voiced in the last few years. But the situation cannot last forever. The Chinese government itself has manifested on a number of occasions that the current growth of China, with an economic model based on exportation, is not sustainable and there is a need to shift towards a model based on internal consumption and the manufacture of goods with higher added value. The Central Bank of China has also shown concern regarding the large number of doubtful debts that Chinese financial entities have amassed with private companies, recommending investments be halted in sectors showing signs of overcapacity, specifically citing the case of the steel industry. These circumstances seem to be starting to take effect in our industry. Although there has been news reports on new Chinese factories being started up, these are ones which had been announced a few years prior, whereas few announcements have been made regarding new projects. Given that the maturity period on investments in our industry is approximately three years in duration, within this time frame we expect offer to gradually approach demand. On the other hand, the process of the consolidation of the European industry continues moving forward, and Outokumpu is complying with its restructuring plan. Unfortunately, the DG of Competition from the European Commission prevented the initial plan from going forth, forcing the Finnish company to give up the Italian factory of Terni, which finally came to pass with the company selling it back to its previous owner, the German company ThyssenKrupp. Although this decision displeased the markets, it is not a bad alternative, given that the muchneeded reduction of capacities is truly occurring and all the uncertainty has indeed come to an end. Thirdly, I would like to reflect on the prime material which most affects our business: nickel. Coinciding with the economic crisis and the period of greatest excess capacity in our industry, a new form of nickel appeared 11
13 Letter from the Chief Executive Officer in China, the so-called nickel pig iron. Technically, this is a low-grade ferronickel obtained from ore found in Indonesia and the Philippines which actually has rather low nickel content but a high content of iron. This mineral has been processed on a large-scale in China, who placed export restrictions on it, providing a competitive advantage to manufacturers in the country. This situation may change after the prohibition imposed by the Indonesian government to export ore, which came into effect in January 2014 in an aim to promote investment within the country. The result is that this raw material is now being manufactured in Indonesia; there are new projects under way and Acerinox has already begun to use it, being the first manufacturer from the West to incorporate the material into processes. In any case, once the Chinese monopoly has been broken, nickel pig iron is set to become a form of supplying ferronickel that will be available to any market, which may or may not be advantageous, depending on the moment or technique of choice; nevertheless, the same opportunities will be enjoyed by all manufacturers. The fourth factor that we consider to be positive for Acerinox is the interest being shown by European governments and the European Union in industry in general, and the steel industry in particular, as a strategic activity for development, employment, and the goal of having 20% of the gross national product come from industrial sources. Last year we enthusiastically collaborated with the Steel Action Plan work group, founded in Brussels by Vice-Commissioner Tajani, and this seed has germinated into other groups, such as the Friends of Industry Club, constituted of the Ministers of Industry from several European countries, and more recently the Spanish Plan of Action for the Steel Industry, presided by minister José Manuel Soria, in which we are actively participating. Industry is absolutely essential to Europe and Spain, yet for years it has languished in oblivion. We have the hope that this new, favourable sentiment towards industry, and the steel industry in particular, brings us more competitive energy costs, simplifies the European, national and regional regulatory system, reduces the impact of environmental costs in which only we Europeans seem to incur, and defends our interests in world trade by eliminating barriers, overseeing the compliance of accords and imposing the principle of reciprocity in international relations. We will respond by bringing all our competitiveness, providing quality jobs, promoting R+D+i investment and contributing towards the overall balance of payments; in short, generating wealth. Lastly, I would like to highlight the most important cause for our optimism and confidence in the future of Acerinox: its people. I can assure you that over the last few years a great deal of effort has been put into improving our Group s competitiveness, combating inflation and rising energy costs, and overcoming the reduced utilisation of our production capacity; and in spite of all these and other adverse factors, we have managed to reach a new threshold of profitability. But we have also created the right mechanisms and the business culture to make these achievements sustainable. The Plan of Excellence in one of them. In the third edition of this biannual plan, with only one year under way, 68% of the objectives have already been attained. But we must not forget there are many other plans. We have saved 20 million euros in personnel costs. Without sacrificing effectiveness we have implemented new models for maintenance and managing auxiliary services that have brought in 12 million euros, while modifications have been made to processes, supply chains, steel compositions and in many other areas, thanks to the effort, commitment, technical training and experience of our staff. We have invested over 12 million euros in innovation during 2013, although what is most important is that innovation is an ongoing activity that forms part of the way we do business. 12

14 If in the difficult circumstances of 2013, we managed to obtain positive results, we can affirm that Acerinox today is more competitive than ever, and in an improved economy and more business activity, we will really be able to show off our true potential. I wish to thank our shareholders, customers and suppliers for the loyalty and confidence in our business you have shown year after year, support that has made us leaders in the world steel industry, one of the most international companies in Spain, and one of the country s industrial manufacturers that has worked hardest towards its good name and its image. Thanks to all our employees and the management team for the enormous effort of this past year and thanks for the commitment you have shown, which makes me so proud to be a part of Acerinox. D. Bernardo Velázquez Herreros Chief Executive Officer 13
15

16 1 Directors Report of Acerinox

, the first to surpass the million ton mark in 2001 and one of the most")
17 Acerinox 1 A Spanish Multinational with Factories on four Continents Acerinox is one of the world s most competitive companies in stainless steel manufacturing. From its very foundation, the company has developed thanks to an ongoing programme of investment which has led the development of its own technological innovations which, in certain cases, have meant technological breakthroughs in stainless steel technology. In production capacity, Acerinox is one of the world s top manufacturers, manufacturing 3.5 million tons of steel. It has three steelworks with integrated production processes for flat steel products: its Campo de Gibraltar plant (Spain, 1970), the first to surpass the million ton mark in 2001 and one of the most profitable in Europe; North American Stainless, NAS (Kentucky, the United States, 1990), the largest and most efficient plant in the United States, a nationwide leader and probably the most competitive in the world; and Columbus Stainless (Middelburg, South Africa), which joined the Group in 2002, is the only steelworks in Africa and located in one of the world s richest regions in terms of raw materials. Campo de Gibraltar (Spain). Kentucky (USA). 16

, NAS (Kentucky, the United States), and Inoxfil (Igualada, Spain) can boast of being at the forefront internationally.")
18 Middelburg (South Africa). Acerinox is building a new fully integrated plant in Johor Bahru (Malaysia). Currently, the Bahru Stainless steelworks has started up its first two phases, producing cold-rolled steel. In its final phase, it will have the capacity for 1 million tons of steel products. Johor Bahru (Malaysia). In long products, our plants in Roldan (Ponferrada, Spain), NAS (Kentucky, the United States), and Inoxfil (Igualada, Spain) can boast of being at the forefront internationally. Acerinox also has subsidiaries in 36 countries on 5 continents and sells its products in 84 countries. The company is one of Spain s most international businesses due to the location of its assets, the nationality of its employees and the percentage of its sales, 92% of which were made overseas, with the United States being the country which most contributed to company revenue. Acerinox S.A. is a corporation whose securities are admitted to trading in the Madrid and Barcelona Stock Exchanges. The share capital on 31 December, 2013 rose to 64,286, euros, comprised of 257,146,177 shares with a nominal value of 0.25 euros each. 17
19 Acerinox 2 Commercial Network In 2013, the strategic development plan for the Asian commercial network continued with deployment by opening offices in Bangkok (Thailand), Manila (the Philippines) and Taipei (Taiwan), and soon to be joined by Seoul (Korea). In addition, an office in Dubai (the United Emirates) has also recently opened. Service Centers Warehouses Offices Commercial Agents Factories 18
20 On 31 December, the group s commercial network was composed of 19 service centres, 28 warehouses and 23 sales offices, not to mention the countless sales agents in various countries which do not have a permanent office. In terms of sales figures, the Group s largest market in 2013 was the United States, followed by Spain, South Africa and Germany. 19

21 Acerinox 3 Human Resources At the end of 2013, the Group s staff consisted of 6,983 people. The absolute number of workers was slightly lower in respect to the year before, fundamentally due to adjustments made by certain European commercial subsidiaries in order to adapt to the new realities of the market. 54.5% of the Group s employees perform their jobs outside Spain. By continent, Europe still has the highest percentage of the Group s employees with 49.7%, followed by Africa (22.9%), America (20.3%) and Asia/ Pacific (6.5%) Acerinox, S.A Acerinox Europa 2,334 2,413 NAS 1,381 1,374 Columbus 1,601 1,592 Bahru Stainless Roldan and Inoxfil Spanish Trading Companies Overseas Trading Companies Total 6,983 7,252 1st Polishing line coil at the factory in Johor Bahru (Malaysia). 20

22 Finished BA coil. 21
23 Acerinox 4 Board of Directors of Acerinox, S.A The General Shareholder Meeting held on 5 June, 2013, on the motion of the Board of Directors and following a report from the Appointments and Remunerations Committee, agreed to re-elect the following Board Members for a period of four years, as established in the corporate statutes: - Mr. Diego Prado Pérez-Seoane, as Stakeholding Director representing Feynman Capital, S.L. (Omega Group). - Mr. Ryo Hattori, as Stakeholding Director representing Nisshin Steel Co. Ltd. On the motion of the Appointments and Remunerations Committee, at its meeting on 30 October, 2013, the Board of Directors agreed to the appointment by co-option of Mrs. Rosa María García García, current president of Siemens Spain, as Independent Director in replacement of Mrs. Belén Romana García. This appointment shall be submitted for approval at the next General Shareholder Meeting. On 31 December, 2013, the composition of the Board of Directors and its Delegate Committees was the following: Board of Directors of Acerinox, S.A. Chairman: Mr. RAFAEL NARANJO OLMEDO Managing Director: Mr. BERNARDO VELÁZQUEZ HERREROS Members of the Board: Mr. PEDRO BALLESTEROS QUINTANA Mr. CLEMENTE CEBRIÁN ARA Mr. MANUEL CONTHE GUTIÉRREZ Mr. ÓSCAR FANJUL MARTÍN Mrs. ROSA MARÍA GARCÍA GARCÍA Mr. JOSÉ RAMÓN GUEREDIAGA MENDIOLA Mr. RYO HATTORI Mr. LUIS LOBÓN GAYOSO Mr. SANTOS MARTÍNEZ-CONDE GUTIÉRREZ-BARQUÍN Mr. BRAULIO MEDEL CÁMARA Mr. YUKIO NARIYOSHI Mr. DIEGO PRADO PÉREZ-SEOANE Mr. MVULENI GEOFFREY QHENA Secretary of the Board: Mr. ÁLVARO MUÑOZ LÓPEZ 22
 Mr.")
24 Executive Committee Mr. RAFAEL NARANJO OLMEDO (Chairman) Mr. JOSÉ RAMÓN GUEREDIAGA MENDIOLA Mr. LUIS LOBÓN GAYOSO Mr. BERNARDO VELÁZQUEZ HERREROS Secretary: Mr. ÁLVARO MUÑOZ LÓPEZ Mr. ÓSCAR FANJUL MARTÍN Mr. RYO HATTORI Mr. SANTOS MARTÍNEZ-CONDE GUTIÉRREZ-BARQUÍN Appointment and Remuneration Committee Mr. MANUEL CONTHE GUTIÉRREZ (Chairman) Mr. SANTOS MARTÍNEZ-CONDE GUTIÉRREZ-BARQUÍN Secretary: Mr. ÁLVARO MUÑOZ LÓPEZ Mr. ÓSCAR FANJUL MARTÍN Mr. BRAULIO MEDEL CÁMARA Audit Committee: Mr. JOSÉ RAMÓN GUEREDIAGA MENDIOLA (Chairman) Mr. PEDRO BALLESTEROS QUINTANA Mr. CLEMENTE CEBRIÁN ARA Mr. RYO HATTORI Mr. DIEGO PRADO PÉREZ-SEOANE Secretary: Mr. ÁLVARO MUÑOZ LÓPEZ Visit by the Board of Directors to the Campo de Gibraltar factory. 23

25 Acerinox 5 Annual Corporate Governance Report. Risk Management The Acerinox Annual Corporate Governance Report corresponding to the 2013 financial year forms part of the Management Report, and when the annual accounts have been published, it will be available for consultation on the web page of the Spanish Securities and Investment Board and the Acerinox web page. The Annual Corporate Governance Report includes the description of its risk management and control systems as well as the risk control system related to its financial data release process or SCIIF. Heat recovery system for combined cycle controls in stainless steel. 24

26 Melting shop, Campo de Gibraltar factory. 25

27 Results 1 Production of Acerinox The Group s production in 2013 was slightly higher than that of 2012, and is the highest since With respect to the previous year, melting production increased by 1.6%, hot rolling by 1.4% and cold rolling by 5.7%. Due to the low inventories of finished products at the end of 2012 in all markets, the first quarter of 2013 was the highest production of the year, closely followed by the second quarter. Melting production in the third quarter was affected by the planned maintenance outages and installation of new equipment at the Campo de Gibraltar factory. (Thousand Mt) Year 2013 Year Q 2 Q 3 Q 4 Q Accumulated Jan-Dec Melting shop , ,189.1 Hot rolling shop , ,914.9 Cold rolling shop , ,418.1 Long product (Hot rolling) By factories, Acerinox Europa output in 2013 improved compared to 2012, by 1.5% in melting, 1.8% in hot rolling and 2.6% in cold rolling. NAS production improved by 3.7%, 2.9% and 4.7% in each shop. In the case of Columbus, although the outputs of the melt shop (-2.4%) and hot rolling (-1.8%) were lower than those of 2012, cold rolling production improved by 7.1% due to the increase in deliveries to South America and the Middle East. It is also important to highlight the evolution of the production at Bahru Stainless which increased by 63% over Hot rolling. 26

28 Plates. 27
29 Results 2 Sales In 2013, the Consolidated Group invoiced 3,966 million euros, a 12.9% decrease in respect to Although the sales volume was similar to that of the previous year, the continuation of low base prices and the sustained drop in alloy surcharges as a consequence of the decline in nickel prices, resulted in a fall of the Group s revenue. GEOGRAPHICAL DISTRIBUTION OF ACERINOX GROUP NET SALES OCEANIA 0.4% YEAR 2013 EUROPE 36.9% AFRICA 5.6% ASIA 8.2% AMERICAS 48.9% Bahru Stainless is the only company in the Group with positive comparative net sales figures in respect to In 2013, the net sales figures at this company rose by 40%. Sale prices tended to drop in all markets, with average reductions of 12.6% in the United States, 8.4% in Europe and 7.8% in Asia. EVOLUTION OF ACERINOX GROUP NET SALES Million euros 5,000 4,500 4,000 3,500 3,966 Consolidated Group NAS 3,000 Trading Companies (*)Acerinox, S.A. figures until From year 2011 refers to Acerinox Europa 2,500 2,000 1,500 1, ,836 1,167 1, Acerinox Europa (*) Columbus Bahru Roldán e Inoxfil 28
30 3 Economic Report The Consolidated Group achieved positive results in 2013 despite experiencing one of the most complicated years in the history of stainless steel. The EBITDA, 228 million euros, was 15.5% higher than that of year 2012, while net sales was reduced by 13% due to weak pricing. It is important to highlight the reduction in staff and operating expenses for an amount of 43 million euros, as a result of the Excellence Plan and savings and improvement plans carried out. The result includes the adjustment of inventories to their net realizable value for an amount of 11 million euros, as a result of price weakness in the last part of the year and the beginning of EVOLUTION OF THE CONSOLIDATED GROUP EBITDA Million euros (% over sales) % 7.3% % % % 2013 The operating result (EBIT) amounted to 88 million euros, 84.9% higher than the year 2012 and the profit after taxes and minorities was 22 million euros (which significantly improves on the 18 million loss of the prior year). RESULT AFTER TAXES AND MINORITIES Million euros
31 Results Presented below are the most important figures of 2013 compared to 2012: Thousand euros Variation Net sales 3,966,278 4,554, % EBITDA 228, , % EBIT 88,284 47, % Result before taxes and minorities 33,180-18, Depreciation 134, , % Gross cash flow 168, , % Result after taxes and minorities 22,068-18, Net cash flow 157, , % Million euros ASSETS Variation Non current assets 2, , % Current assets 1, , % Inventories % Debtors % - Trade debtors % - Other debtors % Cash and other current assets % Total assets 3, , % Liabilities Variation Equity 1, , % Non current liabilities , % Interest bearing loans and borrowings % Other non current liabilities % Current liabilities 1, , % Interest bearing loans and borrowings % Trade creditors % Other current liabilities % Total equity and liabilities 3, , % 30
32 The strategy of working capital management which Acerinox has been executing in the last few years is oriented in three directions: to reduce as much as possible inventories of material in process and finished goods, to extend the period of payment to suppliers and to factor accounts receivable. WORKING CAPITAL Million Euros Inventories Debtors Creditors Working Capital Finance charges decreased by 17.1% as a result of debt reduction. Evolution in the net financial debt Million Euros 1,200 1,075 1,084 1, At December 31st, 2013 Acerinox had 1,804 million euros of credit lines in force, of which 36% were available. In April of 2013, a syndicated facility for factoring without recourse was signed for an amount of 370 million euros and a tenor of 18 months. Banesto Bank served as structuring agent for the operation, whose participating entities were: Santander Factoring and Confirming, Banco Español de Crédito, Banca March, Caixabank, Banco Popular Español, Bankinter, Banco de Sabadell, and Banque Marocaine du Commerce Exterieur International. All covenants included in financing agreements and related to the ratios of the Group were met by a significant margin. The ratio of net financial debt/ EBITDA was 2.3 times at December 31st, and net debt/ equity was 34.1%. The total cash flow generated was 97.2 million euros after making payments for investments in fixed assets for an amount of 161 million euros. 31
33 Results Working capital Millions of euros Jan-Dec 2013 Jan-Dec 2012 Result before taxes Adjustments for: Depreciation and amortisation Changes in provisions and impairments Other adjustments in the result Changes in working capital Changes in operating working capital Inventories Trade debtors Trade creditors Others Other cash-flow from operating activities Income tax Financial expenses NET CASH-FLOW FROM OPERATING ACTIVITIES Payments for investments on fixed assets (*) Others NET CASH-FLOW FROM INVESTING ACTIVITIES NET CASH-FLOW GENERATED Acquisition of treasury shares Dividends payed to shareholders and minorities Changes in net debt Changes in bank debt Conversion differences Attributable to minority interests Others NET CASH-FLOW FROM FINANCING ACTIVITIES NET INCREASE/(DECREASE) IN CASH AND CASH EQUIVALENTS Opening cash and cash equivalents Effect of the exchange rate fluctuations on cash held CLOSING CASH AND CASH EQUIVALENTS (*) Payments effectively made on investments during the period, regardless of when these were entered in the fixed asset investment portfolio. 32

34 4 Shareholder Returns The General Shareholders Meeting was held on 5 June, 2013, and it approved the payment of a flexible dividend up to a maximum amount of 112,187, euros, equivalent to 0.45 euros per share, or the same amount, adding together the dividend and share premium, that has been perceived by Acerinox shareholders since This flexible dividend replaced for the year 2013 the three dividend payments plus share premium that were made in previous years, and was carried out according to the following schedule: 5 June, 2013, when it was approved by the General Shareholders Meeting. The days between the 6th and 12th June, 2013 were the reference dates to determine the average exchange of the shares at closing, with this pre-cot being established at euros per share. The result of this change determined the next two parameters, according to the agreement approved in the General Meeting: The number of free allotment rights needed to receive a share was established at eighteen (18). The price perceived by corporate shareholders at the start of the operation who wanted to sell their shares to Acerinox was set at per share. The free allotment rights were negotiated on the Continuous Market in the Madrid and Barcelona Stock Exchanges from 18th June to 2nd July, Those who were shareholders at the start of the operation (11:59 on 17 June, 2013) had a period between 18th and 26th June, 2013 to report the sale of their rights to the corporation at the exchange price of euros per share. On 5 July, 2013, soliciting shareholders perceived an amount of euros for the sale of each of their free allotment rights. On 17 July, 2013, the 7,841,631 new shares from the capital gain of the flexible dividend approved at the General Meeting of 5 July, 2013 were admitted to official trading on the Continuous Market in the Madrid and Barcelona Stock Exchanges. Annual Shareholders Meeting, 5 June,

35 Results The return obtained by shareholders who had sold their rights to the Corporation meant an annual profitability of 4.7% in respect to the closing exchange for Acerinox shares in Shareholders who opted to subscribe to new shares with their free allotment rights obtained a 26.7% revaluation, considering the closing exchange on the first day these shares were admitted to trading on the Continuous Market and the last exchange of Annual shareholder returns Euros/Share Issue premium Dividend (*) (*) Scrip dividend Corrugated stainless steel on the I-80 dual-carriageway (New Jersey). 34
36 5 Stock Market Information 2013 was a good year for European stock exchanges, largely benefiting from signs of recovery in the Euro Zone. The Spanish index was the second best of all European markets behind only the German DAX, ending the year near its record high, climbing by 25%. The French CAC 40 (+18%), the Italian MIB (+17%), and the British FTSE (+14%) were some of the other outstanding indexes in Europe. The American Dow Jones gained by 26,5%, also near record highs, while the Tokyo Stock Exchange rose by 57%, the best performance in 40 years. The IBEX-35 returned to positive numbers after three consecutive years in decline. In 2013, the main Spanish index rose 21%, after having regressed by 32% since the year Market evolution of the IBEX-35 Daily percentage data 10% 0% -10% -20% -30% -40% -50% -60% J F M A M J Jl A S O N D J F M A M J Jl A S O N D J F M A M J Jl A S O N D J F M A M J Jl A S O N D The Spanish market was one of the hardest hit by the crisis, but the return of optimism in regards to Spain s economic recovery has spurred the return of foreign investment. As can be seen from the following graph, Acerinox stock behaved quite similarly to that of the IBEX-35 until the month of December. Market Evolution of Acerinox, S.A. and the IBEX-35 Daily percentage data, year % 15% 5% -5% -15% +21.4% +10.8% -25% Jan Feb Mar Apr May Jun Jul Aug Sep Oct Nov Dec Ibex 35 Acerinox 35

37 Results Acerinox, after dropping to its lowest price in June (6.9 euros), rebounded by 43% to 9.9 euros at closing on 6 November. In the month of December, the IBEX Technical Advisory Committee, decided to exclude Acerinox shares from the IBEX-35 on basis of liquidity, which had occurred in 1991 for the same reasons. Acerinox stock was adversely affected in 2013 by circumstances surrounding the European steel industry, hampered by the delay in the economic recovery, problems of overcapacity, and drawn-out conclusion of the Outokumpu restructurization. All this created a period of treading water in the industry, which logically had repercussions on the trading volume, which resulting in sending Acerinox to the 36th position on the Spanish Continuous Market in terms of trading volume. In 2013, Acerinox shares were traded for the 255 days the Continuous Market was open for business. The total number of shares traded rose to 274,487,570, equivalent to 106.7% of the shares comprised by the share capital, with an average daily average daily trading of 1,076,421 shares. The highest trading price was registered on 7 November with an exchange of euros per share, while the lowest price was on 24 June with an exchange of 6.87 euros per share, with the average exchange price for the year being 8.41 euros. Palm oil tanks made of stainless steel. 36
38 In respect to the trading volume, it reached a total of 2,309 billion euros for the entire year of 2013, with a daily average of 9.05 million euros. CONTRACTS OF SHARES AND CASH 500 4, , ,700 No shares (millon) 200 1,800 Cash (millon ) On 31 December 2013, the market capitalisation of Acerinox reached 2,378 million euros. Market Capitalisation of Acerinox, S.A. Millions of euros 7,000 6,000 5,000 4,000 3,000 2,000 2,378 1, Share Capital On 17 July, 2013, 7,841,631 new shares of Acerinox, S.A. were admitted to official trading on the Madrid and Barcelona Stock Exchanges as a result of the increase of paid-in capital approved at the General Shareholders Meeting of 5 July, 2013 to set up the scrip dividend. The attendance of shareholders and representatives at the General Shareholders Meeting of 5 July, 2013 held in Madrid represented 72% of the share capital. 37


39 World Markets 1 Worldwide Production of Stainless Steel The worldwide production of stainless steel rebounded in 2013, reaching 38.1 million tonnes, a figure 7.8% higher than 2012 production levels, improving the annual growth rate. WORLD PRODUCTION OF STAINLESS STEEL Source: VALE INCO e ISSF Thousand Mt. 38,000 36,000 34,000 32,000 30,000 28,000 26,000 24,000 22,000 20,000 18,000 16,000 14,000 12,000 10,000 8,000 6,000 4,000 2, World production of Stainless Steel: 38.1 million Mt Compound annual growth rate : +5.9% (Thousand Mt) 1 st Quarter 2 nd Quarter 3 rd Quarter 4 th Quarter total Year ,922 9,017 8,582 8,843 35,364 Year ,594 9,394 9,482 9,660 38,130 An analysis by geographic markets, however, provides us with four completely different scenarios: Europe/ Africa continued decreasing production (-3.2%), due to the situation in Europe and increased imports, while, America increased production (+3.4%), reflecting the health of its economy and domestic consumption. Asia, not counting China, had stable production (0.3%) while China s production rose (16%). This country now produces 49% of the stainless steel worldwide, when in 2001 this figure represented only 3.7% 38
40 After two years of uncertainty, the merger of Outokumpu and Inoxum was resolved with the announcement on 30 November by Outokumpu that it would return the Italian steelworks AST to ThyssenKrupp due to its inability to find a buyer with a reasonable price so as to meet European Commission requirements. Although to a lesser degree than China, India also increased its production to 2.4 million tonnes, 5.4% higher than On the other hand, both South Korea (-1.1%) and Taiwan (-5.4%) showed declines, while Japan (-0.5%) generally maintained its production levels from the previous year. (Thousand Mt) Variation Europe/Africa 8,188 7, % America 2,368 2, % Asia without China 8,721 8, % China 16,087 18, % Total 35,364 38, % The evolution of worldwide production, analysed by region, shows Asia manufacturing more than 72% of today s stainless steel worldwide. EVOLUTION OF THE STAINLESS STEEL WORLD PRODUCTION (Million Mt.) YEAR 2009 YEAR 2010 YEAR 2011 YEAR 2012 YEAR % % % % 38.1 Europe and Africa Asia America Source: International Stainless Steel Forum (ISSF) 39

41 World Markets 2 Raw Materials In 2013 the prices of the main raw materials necessary for the production of stainless steel had a general downward trend, falling in some cases to values which had not been seen since the onset of the financial crisis. The trend common to all these materials was that their highest prices came in the first few months of the year, while their lowest hit bottom in early summer and finally stabilising towards year s end. Raw materials depot at the Campo de Gibraltar factory. Nickel From early on in the year, all metal commodities saw their prices drop. Once again, nickel was the metal having the worst performance, falling by 19.8%. By comparison, copper dropped by 8.5%, aluminium by 15.7% and zinc by 0.1%. Nickel has been dropping in price for the last three years. In 2013 it reached its highest value of the year of 18,633 USD/MT as early as 4 February. After that, it started its downward trend, reaching on 9 July its annual low of 13,203 USD/MT, the lowest level since May By year s end, its price had stabilised to levels around 14,000 USD/MT, ending the year at 13,985 USD/MT. 40
42 Official raw material prices in the LME (2013) 2,250 20,500 9,000 2,250 2,000 18,000 8,000 2,000 1,750 15,500 7,000 1,750 1,500 13,000 Jan Feb Mar Apr May Jun Jul Aug Sep Oct Nov Dec 6,000 1,500 Daily trading data (USD/MT) Nickel Copper Aluminium Zinc Official price of nickel in the LME (2012 and 2013) Average trading price / three months (USD/MT) 25,000 20,000 15,000 10,000 J F M A M J Jl A S O N D J F M A M J Jl A S O N D The production of pig iron nickel in China considerably increased in 2013, to nearly 450,000 tonnes. This has consolidated China s position as the world s leading nickel producer. Nevertheless, it seems that there are gradually fewer advantages of using pig iron nickel: persistently low nickel prices, the natural tendency of the price of pig iron nickel to be pegged to that of the LME, and of no less importance, the decision of Indonesia to prohibit the exportation of nickel ore may have nullified one of the main advantages enjoyed by Chinese manufacturers. Ferrochrome The price of ferrochrome began the year with a 2.3% rise, reaching cents on the dollar per US pound (US / lb) in the first quarter. Buoyed by increased demand and new cutbacks to production in South Africa in the first half of the year, the price rose again by 12.9% situating at 127 US /lb in the second quarter. In the third, caused by the continued dip in demand, increased production in South Africa and the commissioning of new capacities, the price once again fell to US /lb, which maintained steady for the rest of the year. 41
43 World Markets For the second consecutive year, China held its ranking as the world s leading producer of ferrochrome, unseating South Africa. Paradoxically, electricity buy-back programmes in South Africa have caused a decline in the production of ferrochrome in the country and increased exportations of chromium ore to China, at the expense of local industry. Quarterly price of ferrochrome US /Lb Q/12 2Q/12 3Q/12 4Q/12 1Q/13 2Q/13 3Q/13 4Q/13 Source: Metal Bulletin The second half of the year featured price decreases: by 7.4% in the third quarter to 125 US /lb and 12% in the fourth quarter, ending the year at 110 US /lb, the lowest price since Molybdenum The price of molybdenum reached its annual high of dollars per pound (USD/lb) on 4 January. Afterwards, due to the continued decline in demand and the expectations of new production plants starting up operations, the price maintained its downward trend, reaching its low point on 23 July at USD/lb, its lowest price since May The reactivation of consumption in China in October, and subsequently the European and American markets, helped boost prices, which ended the year at 9.70 USD/lb. Price of molybdenum (US$ / Lb.) Source: Metals Week 8 JAN FEB MAR APR MAY JUN JUL AUG SEP OCT NOV DEC JAN FEB MAR APR MAY JUN JUL AUG SEP OCT NOV DEC In 2013 China also secured its position as the leading producer of molybdenum in the world with a production quota estimated at 36%, ahead of the United States, the second leading producer. 42

44 3 Markets 2013 saw very different market behaviours occurring from region to region. Europe seemed to reach a turning point and began a slight increase, China continued being a motor of growth, and in the United States, this was the year that confirmed its return to growth. Angles. Europe Europe went from the recession of 2012 and the first half of 2013 to slight improvement by the second half of the year, and although it was not enough to result in the growth of the GNP, perhaps it is a trend that will be confirmed in The rate of consumption of stainless steel in Europe was parallel to that of the economy: the first quarter having slightly less than the same period in the previous year, with a certain recovery by the second. Slightly positive figures for consumption were clearly being reported by the third quarter and the year ended 1.7% up from The rise was particularly noted in the consumption of hot-rolled steel, due to a greater investment in equipment. On the other hand, still no recovery has been shown in cold-rolled products, denoting stubbornly low household consumption. 43
45 World Markets According to our estimates, the country having shown the strongest recovery is Portugal, where the apparent consumption of stainless steel grew by 19.2% after several years of sharp reductions, followed by Poland, with 13.2%, continuing to exhibit sustained growth. Also growing were the Scandinavian countries, with 7.2%, the United Kingdom with 2.3%, Italy 1.8%, and Spain 2.7%. Prices of stainless steel plate 2.0mm AISI 304 cold-rolled /Mt GERMAN MARKET 3,500 3,000 2,500 2,000 1,500 Alloy Surcharge 1, Base Price Source: Metal Bulletin The United States The GDP of the United States grew by 1.6% and the country ended the year with unemployment rates below 7%, despite some uncertainty regarding its debt ceiling, fiscal and economic policies, and monetary easement plans. The apparent consumption of stainless steel flat products in the United States grew by 4%, the fourth consecutive year of positive growth, demonstrating strong internal consumption, the robustness of the American economy, and the efficiency of its energy and re-industrialisation policies. Our prices in the American market were below the levels reached in Europe for practically the entire year. After increases were made in August and October, the levels drew even and increased to the point where they surpassed the European figures. Prices of stainless steel plate 2.0mm AISI 304 cold-rolled USD/Mt, North American market 5,000 4,500 4,000 3,500 3,000 2,500 2,000 1,500 1, Alloy Surcharge Base Price 44
46 South Africa The apparent consumption of stainless steel flat products dropped in South Africa in 2013 by 9% to 158,700 tonnes, reflecting a weak domestic market and the delays curtailing the start up and operation of large-scale investment projects. Nor did the country s labour unrest over the past year help, or the high price of electricity, which hurt basic local industries. Asia Apparent consumption in China demonstrated large increases (13.4%) with up to 14.6 million tonnes, according to the China Special Steel Enterprise Association. In ASEAN countries, apparent consumption continued to grow steadily, 43% since 2008, the year Bahru Stainless was founded, which maintains its forecasts for steady growth in the years to come. Indeed, the ASEAN zone continues being one of the areas that welcome industries relocating from the Western Hemisphere. With an approximate population of more than 600 million inhabitants, who in many cases are still joining the consumer society, and sustained growth rates which are often higher than 5%, the area has unparalleled potential for the penetration of stainless steel in the world today. The infrastructure programmes for the area s many governments make it plain to see there will be a large demand for stainless steel for years to come, particularly true of a local climate which favours the use of stainless steel over common steel. Prices of stainless steel plate 2.0mm AISI 304 cold-rolled USD/Mt, final price, alloy surcharge included 4,000 3,500 3,000 GERMANY 2,500 USA ASIA 2,000 1,500 Source: Metal Bulletin 1,
47 Excellence Plan / Investments / R+D+i 1 Excellence Plan The Excellence Plan III ( ) was begun, like the other two editions, as the result of intense and indepth internal benchmarking programmes. This third plan delves into areas included in the previous editions and adds some new sections, totalling 16 sections divided into four groups: Excellence in operations. Excellence in managing working capital. Excellence in the supply chain. Commercial Excellence. It must be pointed out that all companies in the Group have been very implicated in the process of defining and developing the Plan. Attaining 100% of the set objectives will mean recurrent annual savings of an additional 60 million euros starting in In its first year, 68% of its objectives were attained, which were equivalent to recurrent annual savings of 41 million euros. It is worth noting the rising progression in all sections throughout the year, which rose from 40% compliance in the first quarter to 95% by the fourth. Results from the Plan of Excellence III by quarter 100% 80% 60% 40% 20% 0% 1º Quarter 2º Quarter 3º Quarter 4º Quarter Quarter Accumulated 46

48 2 Investments In Acerinox made investments totalling 126 million euros. 47% correspond to the construction and expansion of the Johor Bahru factory. fundamentally in Phase II. The breakdown of investments per company is the following: Million Euros Acerinox, S.A Acerinox Europa NAS Columbus Bahru Stainless Roldan and Inoxfil Spanish Trading Companies Overseas Trading Companies Total It is also worth mentioning the investments made by Acerinox Europe, mostly in their Campo de Gibraltar factory, with a total of 39.6 million euros fundamentally destined to the renovation of the steelworks and the hot-rolled assembly line, which has heightened the efficiency of the most state-of-the-art factory in the Group. Stainless steel in regasification plants. 47

49 Excellence Plan / Investments / R+D+i Stainless steel in a San Sebastian underground station. 48
50 3 R + D + i One of the keys to Acerinox s success has always been and will continue to be the importance it places on research, development and innovation. Some of the advances it has achieved in these areas have ended up becoming industry standards in stainless steel production. This effort has not waned in times of economic crisis, as on the contrary, it is one of the key drivers the Group uses to ensure it stays competitive. The percentage dedicated to research, innovation and development maintains steadfast, with a tendency to rise. In 2013, 12.3 million euros were destined to this area, with the innovation department gradually becoming the one of the three taking on greater importance. There were 42 innovation projects undertaken in 2013 and 7 research projects in the Campo de Gibraltar factory alone, with a similar number of projects undertaken in both NAS (23) and Columbus (10). The Group s main factories have institutional ties with the universities and poly-technical schools in their local areas, which means there is a reciprocal flow of research, development and interaction work between them. Standing out for their importance are the 2013 Quality and Innovation Awards, most of which were taken on for subsequent study and development by the corresponding departments. The award for quality, safety and the environment went beyond expectation in both quantity - 25 projects in all - and also for their quality, preparation and study. Our personnel once again demonstrated their degree of involvement and commitment to the objectives of the company. The president of the selection board, the director of the Poly-Technical School of Algeciras, and the rest of the members awarded first prize in the category of Quality in Progress to Antonio Chacón Moreno for the project Viability Study for the Reduction of Energy and Gas Consumption in AOD Processes. Second prize was awarded to the Scratch Remover project presented by Rafael Vázquez Fernández. Having several factories with similar characteristics allows developments and improvements to be shared with extraordinary quickness. The improvements attained quickly become Group standards and their implementation by the other production units becomes obligatory, which is why the previously mentioned Excellence Plan, now in their 3rd edition, are such exceptionally important tools. They become the most effect catalysts in incorporating and spreading these technological innovations to the rest of the factories. The Group s mid-term plans foresee an increase in the number of innovation projects to bring it closer to 100 plans per year and 20 for R+D projects, with the corresponding increase to their budget allotment. 49
51 Important Recent Events since the Closing of the Financial Year 1.- The European Commission authorisation of the acquisition of the Terni (Italy) factory by ThyssenKrupp. One of the most unsettling factors within the European Market was the merger of Outokumpu and Inoxum, a ThyssenKrupp subsidiary. The operation, structured as an absorption of the latter by the former, immediately came into conflict with the determinations of the European Commission, which then forced the sale of the Acciai Speciali Terni factory in Italy and set a deadline for the operation. The inability to find a buyer within the initial period first led to the extension of the deadline and finally the repurchase of this and other assets by ThyssenKrupp. The result provides better stability within the European market and ends this period of uncertainty which had put a halt to the process of consolidating European manufacturers. 2.- Steel Action Plan. In January 2014, Spanish authorities created a Working Group on the future of the steel industry in Spain, presided by the Minister of Industry, José Manuel Soria. This initiative is based of the Tajani Plan and which must project its impact in the area of Spain. Three work groups have been planned to examine energy, the environment and market access, respectively. At the end of 2012, European Commission Vice-President Antonio Tajani unveiled an ambitious project intended to relaunch the European steel industry. The Plan, finally approved in 2013, committed European authorities to find a new competitiveness framework for the industry. Measures from environmental proposals to the analysis of commerce treaties would be successively implemented over the next few years with the monitoring of interested parties. 3.- New scenario for nickel pig iron In January 2014, the prohibition by the Indonesian government of the export of a series of minerals, among them nickel, went into effect. This mineral was being exported to China, which processed it for its use in stainless steel manufacturing within its own territory. The need to process this mineral in Indonesia means that the nickel yielded will be made available to international markets. The near-exclusive access to cheaper nickel was one of the advantages Chinese manufacturers enjoyed, but now all world producers can access the metal under equal conditions. 50

52 Bright Annealing Line. 51

53

54 2 Sustainability Report
55 Sustainability Report 1 Introduction Until recently, industry was not a priority activity for European leaders, who preferred an economy in which wealth could be obtained easily, effortlessly and with little investment. After the onset of the crisis, leaders realized that the big countries are big largely because of their ability to accumulate effort, investment, ingenuity and patience in long-term industrial projects and by making attractive the activity of transforming raw materials into something useful and tangible. So, after many tribulations, European leaders have realized that industry is necessary : it generates wealth, creates quality jobs, if subjected to strict but reasonable requirements it allows good preservation of the environment and, unlike other sectors, it is not at the origin of economic cataclysms. Rather, it confers great stability to national economies, as it is a sector that creates and distributes wealth to the extent that it creates value, and is not outside it. That is why at the end of 2012, the European Commission decided to promote European industry and set an ambitious goal: that by 2020, 20 per cent of European GDP would come from the industrial sector. Given their willingness to play with numbers, it might have been better to propose 30 percent in 2030, but this will come if the benefits of the secondary sector are rediscovered. Europe can boast having been a pioneer in the control of emissions and discharges and the imposition of recycling, it has been the part of the world where a legislative conglomerate has been implemented most quickly and relentlessly that has reduced the environmental impact of industry activity to minimum levels, with the last possible reproach that could be made to industry disappearing. This exemplary regulatory framework has reduced industry s environmental footprint to levels incomparably lower than those of twenty years ago. Today s Europeans can not only boast of high levels of freedom and a model welfare state, but also a better preserved environment than other civilized regions, and without a doubt, better than that which we enjoyed in our youth. This achievement, which should set a trend and should act a guidelines for other societies, may, nevertheless, be a useless and dangerous effort if we forget that caring for the earth is everybody s responsibility, a global problem, and discharges spread throughout the atmosphere, rivers and seas. There would be little point in emitting less gases in the tiny European territory if we are complacent with those who have not been able - or have not wanted - to limit their emissions. Moreover, the different yardstick has only served to further reduce industrial production in Europe (with low emission levels) and increase it in the new industrial giants (with far higher levels), resulting in increased pollution of our planet. If we stick to the productions of stainless steel -which is our world- and compare the situation between 2001 and 2014, we can see how in 2001, 11 million tons per year were produced in the EU and the USA and just 8 million in the rest of the world. Today, 10 million tons are produced in the EU and the USA and...27 million tonnes in the rest. This situation has been aggravated by the fact that much of this production especially in Asia is transported to the EU and the USA, and so on top of the emissions generated by production another 25% must be added on, caused by transport before what is produced is consumed. 54

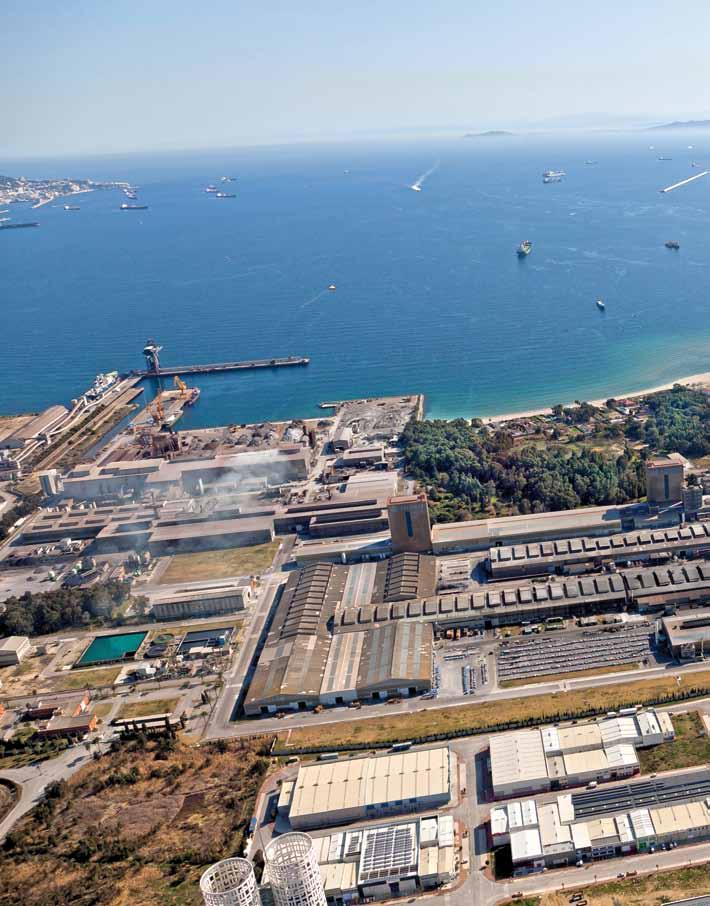
56 European and American producers have dramatically reduced their emissions during the period. But globally speaking while this effort has not been futile -which is serious in itself- but rather it has generated a vicious circle that feeds the industry of some countries precisely because they are able to emit more greenhouse gases, precisely because they can spoil aquifers and precisely because they can abuse the workforce. The balance for the European economy is quite disheartening, since its efforts to reduce emissions have actually increased globally and have managed to boost the importation of two highly damaging products within the Community: CO2 and unemployment. It is therefore important that the Community authorities have begun to understand not only that industry is good but also that achieving climate goals takes place through their extension to other areas of the planet, rather than by toughening the requirements within the European Union. That they have begun to realize that not only maintaining employment levels, but also the sacrosanct environmental objectives obtained work towards protecting those who help in their attainment, and not vice versa. The authorities of this continent seem, as mentioned, to begin to realize that the serious imbalances in the rules threaten to generate an industry - and a world - that is far less sustainable than that which they long for. The two towers of the BA stand out over Palmones beach (Campo de Gibraltar Factory. Spain). 55
57 Sustainability Report What will be the approach of the European Union as of now is difficult to predict, but it is significant that the Commission is considering not going further in reducing the allocation of emissions as of 2020, nor reducing the current emissions thresholds until the economic and scientific feasibility of further reductions has been proved. The desire to re-industrialize Europe may become a reality and that is very good. European industry is hugely competitive when it is not penalized by decisions that damage it and when it is free from artificial limitations and disadvantages. When it can play by the same rules as the other competitors it has always been the most competitive, the most creative and the one that has contributed to the welfare of the countries in which it is established. Today, consuming European-made products made i is more sustainable. Hopefully the European authorities will now know how to focus on environmentally sensitizing other powers with the same success with which they have succeeded in making European industry an essentially clean activity so that, together, we can make this a more sustainable world and Europe a region capable of maintaining its development standards. If this can be achieved, if Europe does not take its demands beyond what is technically or economically possible and if it begins to consider the emissions of non-european producers to certain effects - and it seems this will be the case - we can say that 2013 has been the turning point in the evolution of the European steel industry. Probably of all the quality European industry. Meanwhile, in Acerinox we have done our homework properly and progressively reduced discharges and the emissions of greenhouse gases to such low levels that we are already ahead of the established schedule. So much so that despite corrections made by the European authorities and despite the new measurement criteria, today we have a sufficient number of allowances so as to comfortably address the period In the following pages we will explain how the companies of the Acerinox group have striven to achieve their objectives in an environmentally friendly way and under conditions that ensure the sustainability of their practices even outside of Europe, because we do not conceive of manufacturing differently depending on the country and our conception of the environment does not vary from region to region. We will also explain how we have contributed to the economic and social development of the countries in which we are established, what it means for us to be global, and how we understand plurality. We will also explain how we try to reduce -and indeed succeed in reducing- occupational accidents and many other things that have allowed us to be, today, the most international manufacturer of stainless steel and one of the most efficient manufacturers in the world without losing our identity and our way of doing things and without having had to sacrifice or postpone our environmental and social achievements, productivity, or the interests of our shareholders and employees and those associated with us. 56

58 2 Corporate Governance 2.1. THE GENERAL MEETING Held on 5 June, 2013 the General Meeting once again approved the corporate management and a capital increase charged to reserves through the issuance of ordinary shares for free allocation to shareholders. Following this, the Board of Directors agreed to carry out the capital increase which was implemented through a flexible dividend also called a choice or scrip dividend, leaving the dividend at euros per share. Of all shareholders, 43% decided to take remuneration in cash and 57% to receive shares. The articles of association require ownership of at least 1,000 shares to be able to attend the meeting, but they do not set any limitation on the number of votes to be cast by any shareholder, and so the number of votes to be cast is equal to the shares held. Given that the company had no treasury shares at the time of the Meeting, the number of possible votes was equal to the number of outstanding shares, i.e. 249,304,546 shares. After the capital increase of 7,841,631 new shares as a result of the flexible dividend, the number of votes stood at 257,146,177 shares. The General Meeting was attended by 71.88% in 2013, an improvement on the percentage for 2012: 70.14%. The items on the agenda were approved by majorities ranging from 87.99% to 99.89% of the capital present at the General Meeting. Stainless steel wire used in vineyards. 57

59 Sustainability Report 2.2 MAIN GOVERNING BODIES: THE BOARD OF DIRECTORS AND OTHER EXECUTIVE BODIES 2.2.a Board of Directors The Board of Directors is the body responsible for managing, administering and representing the Company, without prejudice to the powers conferred upon the General Shareholders Meeting. The Board has three delegated committees: the Executive Committee, the Appointments and Remunerations Committee and the Audit Committee. The Board of Directors has 15 members, which is the maximum allowed by the articles of association. The Secretary does not have Director status, although there is no prohibition to the contrary. Its composition responds to the traditional principles of diversity and balance. The company has reduced the number of executive members to one specifically the Chief Executive Officer and has five independent members, although one of them, the Chairman, was once an executive of the company and is now retired. The rest are proprietary and independent members and their number and groupings are proportionate to the various reference shareholders. All Board members have extensive professional experience in the corporate and business world, and in many cases a wealth of academic experience as well. Several of them belong to the elite organs of the Spanish Administration. In 2010, the company, following the best practices of Good Governance, decided to separate the charges of Chairman of the Board and the General Meeting, on the one hand, from the responsibilities of the Chief Executive Officer, the organization s top executive, on the other. Under Spanish law, the remunerations paid to the directors and the remuneration policy were the subject of a consultative vote a vote that was successful, with endorsement of the remuneration policy by 88.84% of the share capital with voting rights that attended the General Meeting. Continuing this policy of transparency, the remunerations for attendance to the Board of Directors and its delegate committees in 2013 were 1,346, See Annual Corporate Governance Report. Acerinox Board of Directors, at a Board Meeting in

60 With regard to the changes made to the body during 2013, it should be noted that the General Shareholders Meeting held on 5 June, 2013, agreed, on the motion of the Board of Directors and following a report from the Appointments and Remunerations Committee, to re-elect the following Board Members for a period of four years, as established in the corporate articles of incorporation: Mr Diego Prado Perez-Seoane, as Proprietary Director representing Feynman Capital, S.L. and Mr Ryo Hattori, as Proprietary Director representing Nisshin Steel Co. Ltd. The Board of Directors at its meeting of 30 October, 2013, on the motion of the Appointments and Remunerations Committee, agreed to appoint by co-option Mrs Rosa María García García, holder of a degree in Mathematics, current Chairwoman of Siemens Spain and Member of the Board of Bolsas y Mercados Españoles - Spanish Stock Exchanges and Markets, as an independent Director in place of Mrs Belén Romana García, who informed the Board of Directors of her resignation due to her inability to continue providing her services as member of the board of ACERINOX following her appointment as chairwoman of SAREB. In total, the Board of Directors held seven meetings in b The Executive Committee This body, called upon to ensure the monitoring and management of business, held a total of five meetings in The Chairman and the Secretary to the Board of Directors act as chairman and secretary of the executive committee, respectively. Stainless steel railings beside the sea. 59
61 Sustainability Report 2.2.c The Audit Commission or Audit Committee Again, this was the most active body in 2013 as regards the number of meetings held, coming to a total of nine, which has allowed it to develop its envisaged work plan devoting itself to its core competencies, which are: - Reporting the annual, bi-annual and quarterly accounts to be sent to the regulatory authorities. - Supervising the internal audit services, the effectiveness of the Company s internal control systems and the risk management systems. - Supervising the process of drawing up and presenting the regulated financial information. - Proposing to the Board of Directors, for submission to the General Shareholders Meeting, the appointment of the account auditors. The Audit Committee is chaired by an independent Director, and the secretary of the Board of Directors acts as secretary. 2.2.d The Appointments and Remunerations Committee It held five meetings during It continues with its proposal of previous years of proposing to the Board of Directors, submitting to the consideration of the General Meeting to keep in place, without updating, the remunerations of the Board Members. It was also involved in setting the remunerations of the senior management. It also proposed to the Board of Directors the re-election of the Members of the Board Mr Diego Prado Perez-Seoane and Mr Ryo Hattori and the appointment as Member of the Board of Mrs Rosa María García García. The Appointments and Remunerations Committee is chaired by an independent Director and the secretary of the Board of Directors acts as secretary. 2.2.e Other executive bodies Acerinox s Management and Strategy Committee is comprised of four people: the CEO, the Managing Director, the Financial Director, the Commercial Director and the General Secretary. The remunerations of these persons are determined by the Appointments and Remunerations Committee. The amount received during the year 2013 by this group, not including the CEO, was 1,523 thousand euros. 2.3 THE RULES GOVERNING THE GROUP The main rules governing ACERINOX, S.A. and its group of companies are: - Articles of association. - Regulations of the Board of Directors. - Regulations of the bodies delegated by the Board of Directors. - Operating guidelines for the Senior Management Committee. - Operating guidelines for the Internal Audit Service. - Code of Conduct and Good Practices and related rules. - Other lower regulations whose compliance is compulsory. The articles of association and other internal rules are available at 60

62 2.4 OUR SHAREHOLDERS One of the most remarkable characteristics of Acerinox S.A. is the permanence and continuity of its reference shareholders. This loyalty can be traced back, in some cases, to the foundation of the company 40 years ago. Significant Shareholdings in the Share Capital of ACERINOX Alba Participaciones 23.50% 24.24% Nisshin Steel Holdings Co. Ltd % 15.30% Feynman Capital / Morinvest Sicav 10.99% 11.59% Casa Grande de Cartagena, S.L. 3.00% 5.00% Industrial Development Corporation (I.D.C.) 3.00% 3.10% 2.5 OTHER RELEVANT FACTS The company communicated a total of 27 relevant facts in 2013 to the regulatory authorities (CNMV) on the following dates: 05 February, 28 February (four), 23 April (three), 29 April, 7 May, 10 May, 05 June (five), 13 June, 3 July, 17 July, 23 July (two), 16 September (two), 31 October, 05 November and 23 December. Melting shop. 61

63 Sustainability Report 3 Human Rights Since 2010, Acerinox, S.A. and its group of companies have implemented a common Code of Conduct. You can download the contents of this code from Acerinox, S.A. has the responsibility to ensure that human rights are respected both in the workplace and in its broader sphere of influence. Acerinox has a direct influence on society and strives to fulfil not just current legislation in the countries in which it operates, but to require higher standards insofar as possible. 3.1 United Nations Global Compact Recently, the Chief Executive Officer of Acerinox SA informed the United Nations Secretary General, Mr Ban Ki Moon, of the company s adherence to the United Nations Global Compact, as a way to externalize and formalize the commitments of the company in this field at the highest level. Since its adhesion Acerinox has completed the required United Nations Progress Report in the corresponding section of the Sustainability Report, which is referred to in the Global Reporting Initiative (GRI). The Progress Report is an annual report through which Acerinox informs its stakeholders as to the actions taken in implementing the 10 Principles of the Global Compact. This adherence not only involves admitting the existence of universal and basic principles previously stated in our Code of Good Practice, but also publicly committing to a vigilant and demanding attitude to uphold and protect them. Hot rolling control room. 62

64 City bus chassis manufactured in stainless steel. Respecting human rights also means requiring other companies that form part of the supply chain, beyond direct business, to fulfil them. In particular, Acerinox will strive to eradicate any possibility that our suppliers and the companies that the Acerinox group may hire in the remotest parts of the world might use forced labour or fail to respect the minimum working age. It also means ensuring that all who are related either actively or passively with the companies of the Acerinox group uphold employment standards that are compliant with the International Labour Organization. 3.2 Prevention of harassment in the workplace Our code of conduct contains essential statements to prohibit and prevent harassment of any kind in the work environment. As prohibition is more effective if accompanied by measures, a reporting system is implemented in the group s companies. As well as reporting, the employee has the possibility to request the adoption of precautionary measures. These measures are implemented automatically while the investigation takes place and although no decision has been made. The measures to prevent and suppress harassment have been incorporated into collective agreements by reference to the Code of Conduct. 63

65 Sustainability Report 3.3 Universality of the protection of human rights The globalization strategy and the maintenance of investments in five continents has meant the universalization of these good practices. Acerinox s commitment to Human Rights is not limited to the Code of Conduct or to adherence to the Global Compact. On the contrary, the group s companies take care that our conduct and zeal in such important matters is shared and benefit the companies associated with us and their employees. More than 3,000 people from different companies outside the group relate daily with Acerinox: they are our subcontractors and those who work for them. At Acerinox, we try to make sure that the standards we want for ourselves also benefit others. Universality means that our general conditions require our service providers to observe best work practices with their respective staff, particularly if the services are to be rendered on the premises of the companies of the group. In this case, no standard besides ours is acceptable, and our subcontractors must be committed to respect and share it. Since 2010, the group has made efforts to improve the average business quality of our contractors, promoting safety, and improving these companies conditions of employment and recruitment. The result is that those who have not been capable of adopting our standards have had to transfer their activity and in particular their staff- to other companies with better conditions. Universality also means that the group s companies cannot be supplied with goods or sell products to companies with a dubious Human Rights policy. We therefore demand that these companies prove they have codes of conduct or ethical codes similar to ours or comparable with European standards. Our general terms of contract prevent and our contractors must accept- payments being made for services if the contractor owes amounts in salaries or contributions to compulsory social security schemes. 64

66 4 Prevention of Corruption and Ethical and Transparent Behaviour An effective, firmly established Rule of Law is the greatest source of a country s wealth. Respect for the Law and certainty that the acts of the public authorities adapt to it, stability of legal rules and the certainty that corrupt officials will be prosecuted, form the bases for economic welfare and progress, freedom and the creation of wealth. The commercial companies quoted have been pioneers in the adoption of measures to ensure their ethical operation. Without this certainty it would be impossible to attract capital and investment, and the adequate funding of their activities or access to credit could not be guaranteed. The transparency and reliability with which these organizations operate and the proliferation of a variety of rules -internal or imposed by lawmakers that guarantee them - are a reference worldwide. The leading companies - and Acerinox is one such company- are proud to go even beyond the requirements of national legislation and as such, along with rules derived from compliance with legislation, they impose compulsory internal rules on themselves in order to become increasingly transparent, more reliable, and ethically better. Acerinox has thus adopted procedures to ensure that its actions adapt to the different legal systems and to the, at many times higher, internal performance standards. The possibility of dishonest practices occurring or being harboured in the company s groups is remote: Perfectly designed internal procedures prevent any unusual or unexplained decisions. An anomalous situation will immediately trigger internal control systems and repair and correction procedures. Flat bars. 65

67 Sustainability Report Receipts and payments must necessarily be carried out through renowned credit institutions and always in countries that do not qualify and cannot be qualified as tax havens. Acerinox rules also require the complete identification of payers and collectors, as well as full traceability of operations. Acerinox does not pursue or participate in business directly dependent on the decisions of public authorities and neither does it depend on aid, subsidies, or the relevant participation of any state or public body in its capital, and so its independence cannot be limited by economic reasons or influences of political power in its decision making processes. The Internal Code of Conduct prevents workers and managers of the group from influencing political and administrative decisions in any way other than by invoking the relevant applicable legal regulation or the general economic interests of the country in which its companies are established. Employees and managers cannot receive preferential treatment, benefits, gifts or excessive benefits from persons or entities with whom Acerinox and its companies maintain or are going to maintain a business relationship, or offer such to them. Neither may they practise a second activity without prior authorization or permission from the competent bodies. If, despite all controls and measures, some reprehensible act were to committed which escape surveillance, an institutionalized reporting channel will allow the group s governing bodies to hear of the illicit act and take appropriate action. It is the right - and duty -of all Acerinox employees and managers- to make any irregularity they may be aware of or hear of known to the bodies having the power and ability to curb and sanction them. Slabs oxy-cutting at the end of continuous casting. 66

68 5 Absence of Tax and Customs Privileges Acerinox firmly believes in the benefits of a fair taxation system, applicable to all of operators in the same market, and it also believes that freedom, equal opportunity and fair play are a sure source of the creation of wealth and its proper distribution. This is why the companies of the Acerinox group are not located in territories qualified as tax havens unless they are also centres of consumption of stainless steel. If an activity is carried out with any of these territories, it is limited exclusively to the buying and selling of goods, and such territory would never be used to carry out credit or financial activities of the group or its companies and neither would it be used to keep funds, own or manage shares, or any other similar activity. These commitments have been formally undertaken with the tax authority by signing a formal agreement with the Spanish Ministry of Finance within the Large Businesses Forum. The companies of the Group pay the taxes and social contributions applicable to them under the tax law applicable to the territory in which they reside. Higher or worse taxation does not determine our business decisions and the group does not use any artificial or unnecessarily complex corporate structure for purposes that do not have an industrial or commercial purpose, beyond reasonable economy of choice. If any tax or customs advantages are enjoyed, they should be stipulated in a general tax rule to which all citizens or operators may gain access under identical circumstances and could not, therefore, be considered privileges. Vessel unloading scrap at our Acerinox Europa factory port. 67

69 Sustainability Report 6 Acerinox s Contributions to General Welfare Throughout 2013, the companies of the Group have contributed to families, municipalities, states, systems of social prevention, shareholders and other companies, with the following quantities, in addition to activities of a charitable nature that have been carried out. - It has paid out 268 million euros in salaries that have been received by our employees and their families. - It has paid out 63 million euros in contributions to various social security schemes, health care and pension schemes for the benefit of our employees and their families. - It has paid out 110,573,000 euros in dividends to our shareholders through a scrip or flexible dividend system that allowed them to choose the most convenient means of remuneration for them. - It has paid out 70 million euros in direct taxes to the various public authorities. The sum total of this makes for a total of 512 million euros. This year s contribution has been 6 million euros more than in This amount and its multiplier effect on the economy is the greatest added value that the Acerinox group companies return to society. Access to the Bilbao underground (Spain). 68

70 7 Environment, Recycling and Climate Change 7.1 Introduction Acerinox is committed to the compatibility of the environment and industrial activity. Therefore, it devotes significant financial and organizational resources to achieve a continuous reduction in environmental impacts. This environmental policy is promoted within the Company through its participation in various projects, in which efforts and improvements made regarding of environmental matters are evaluated on a yearly basis. The ZET Zero Emissions Target policy, assumes that all units should reduce their emissions continuously. There are no pre-established targets: there must be a reduction. The same applies to recycling. Every year must exceed that achieved the previous year. Scrap at the Acerinox Europa factory port. 69
71 Sustainability Report 7.2 GRI, CDP, LCI, SGA and KYEXEL The various projects in which the group has participated during 2013 include the following: - Global Reporting Initiative (GRI) Since 2011, the Company s annual Reports have been drawn up following the G3 Guideline for the drafting of sustainability reports, Global Reporting Initiative (GRI). As every year, in 2013 the documentation was submitted to the GRI audit bodies with Acerinox being awarded the best possible classification of application level A. Obtaining the highest qualification has been a challenge for Acerinox, demonstrating the Company s commitment and transparency by sharing the results of its environmental, social and economic performance with each of our stakeholders. - Carbon Disclosure Project (CDP) Acerinox has been participating in the CDP report since The reports generated by the CDP are considered the most reliable and accurate by the international community of experts and analysts. In this report the risks, opportunities and measures related to climate change and companies emissions are evaluated. - Life Cycle Inventory (LCI) LCI is a global method of assessment promoted by EUROFER, in which Acerinox participates. The method assesses the environmental implication of the entire life-cycle of stainless steel or any other material, from the manufacturing process to the end of its useful life. It also evaluates the amount of recycled materials used in production and the possibility of recovering and reinserting back into the manufacturing process.stainless steel components from already-used items. - Environmental Management System (EMS) The EMS in Acerinox Europa is established as the work tool that provides an overview of the organization within the surrounding environment, and allows for obtaining of improvements both for the Company and the environment. Each year, the ISO based EMS coordinates environmental management programmes that focus on actions that have led to investments improving energy efficiency. Examples of actions carried out in 2013 are the investments and improvements made to the Argon Oxygen Decarburization Converter (AOD) of the Campo de Gibraltar Steelworks Factory, the Electric Furnace or the installation of a new refrigerated vault of Electric Furnace 3 in the same Factory, which makes better use of the energy consumed. The installation of the new body and the individual control of the nozzles in the AOD has led to a CO2 reduction of 309 mt. Furthermore, the installation of the new refrigerated vault of Electric Furnace 3 has meant a better use of energy consumed, achieving a reduction in CO 2. In Spain, Acerinox collaborates with UNESID (Unión Nacional de Empresas Siderúrgicas - National Union of Iron and Steel Companies), preparing the inventory of CO 2 emissions for the Spanish Ministry of the Environment and developing the Law on Environmental Responsibility - MIRAT Project. It also collaborates with the World Steel Association, which monitors compliance with environmental regulations, encouraging best practices and developing new technologies to reduce emissions at source. This association has granted Acerinox an award in recognition of actions taken in the fight against climate change. In May, the ISSF (International Stainless Steel Forum) awarded Acerinox the prize for Sustainability for works performed in the recycling of steel slag, generating easy-to-use briquettes. In addition to providing large-scale environmental and energy efficiency, the system allows for the reusing of metal waste with substantial cost savings and reduced storage space. 70

72 - Kentucky Excellence in Environmental Leadership (KY EXCEL) Once again, North American Stainless (NAS), the group s North American factory, was awarded the KY EXCEL certificate, obtaining the highest level of the programme. KY EXCEL strictly evaluates companies environmental involvement, requiring strict observance of environmental standards for a minimum period of 3 years. In addition, obtaining the certificate requires demontration of continued improvements in the environment through specific plans or projects. This meant performing and developing a plan that has had countless sub-projects whose common denominator has been the implementation of investments to improve the factory s environmental performance. Moving coils inside the factory. 71
73 Sustainability Report 7.3 Actions, expenses and investments in Acerinox Europa, NAS, Columbus and Bahru - Environmental expenses and investments In 2013, environment-related expenses at the Acerinox Europa factory totalled 15,388,643 euros. In terms of environmental investments, this year they reached 3,475,548 euros, representing an increase of more than 1.5 million euros over The following are noteworthy among the most important investments: - The installation of a new refrigerated vault in Electric Furnace 3. - New body, cooling and individualized control of the Steelworks AOD-1 nozzles. - Improvements to Steelworks flue gas scrubbers. - Adaptation of acid storage and recovery plant. - Improvements to reduce water consumption. - Replacing hot rolling engines with far higher energy efficiency. These environmental costs and investments show the interest Acerinox has in improving environmental indexes and the environmental performance of the process. To achieve this, we use, among others the already mentioned EMS system, which has a Planning-Implementation-Monitoring-Performance -type model of environmental performance evaluation, which continuously diagnoses the activity of the organization through different indexes. This evaluation is based on the ISO standard on Environmental Performance Evaluation. In NAS environmental investments during the year amounted to more than USD 1,511,534. The following are among the major improvements : - Dust handling system in EAF2. - Enclosing the Tundish to improve the capture of steel dust. - MS piping to improve water reuse. During this year in NAS, total spending on environmental purposes reached USD 72,170,201. Investment has primarily been made in the recovery of scrap and metals, water treatment, the collection and disposal of refuse and waste, and recycling programmes. Meanwhile, in Columbus, in 2013 the South African factory has worked to replace the lining of one of the waste storage dams to prevent the risk of leakage. It is expected that in the first half of 2014 this improved storage can be made use of, obtaining greater control and safety in its treatment. In addition, this year ISO 14001, ISO 9001 and ISO/IEC certifications have been obtained. Finally, in Bahru Stainless, during 2013 the following environmental investments, amounting to an additional USD 3,167,040 were made: - Construction of a centralized waste management warehouse. - Installation and commissioning of the oil and water separator for degreasing the annealing and pickling lines system. - Installation and commissioning of the permanent oil separator in the ZM1 rolling mill. - Control process of the acid neutralization plant and acid regeneration plant. - Energy saving programme. - Neolite recovery plant. - Sediment and erosion control. Furthermore, Bahru has recently obtained ISO certification. 72

74 7.4 Water Water is an important resource in Acerinox s activity, and its consumption varies widely in different plants due to differences in ambient temperature and its logical effect on evaporation and cooling needs. The water used is subjected to various treatments that, in addition o recovering its quality for reuse, enables recovery of the substances used in processes. Oily water is also treated for reuse in the oil recovery plants, obtaining oil-free water, which is then sent to the Neutralization Plants (the oil is removed by authorized agents). Moreover, Acerinox Europa has an underwater outlet that enables performing the water return process several miles out to sea, preventing dysfunctions due to differences in bay temperature and salinity. Below is an outline of the evolution of specific water consumption in recent years ACERINOX EUROPA Specific Water Consumption /MT m Water treatment ponds beside the Acerinox Europa offices. 73
75 Sustainability Report At NAS water is collected from rivers and reservoirs and is treated for later use. The water is obtained mainly from the Ohio River that flows beside to the factory. Average river water intake in 2013 was 3.32 million cubic metres, carried out by a diffuse system, thereby reducing any potential environmental impact. To ensure water quality, NAS monitors emissions into the river in real time. Moreover, as every year, the Company sponsors the Ohio River clean-up, compensating workers who participate in it. NAS Specific Water Consumption 8.00 m 3 /MT In Columbus the scarcity of water in the area forces optimizing capture of the rainwater, which is abundant thanks to the tropical climate. The low rainfall in the area forced the creation of large reservoirs in order not to squander the torrential water during the wettest season. During the last year in Columbus, water consumption has decreased compared to COLUMBUS Specific Water Consumption m 3 /MT

76 Finally, in Bahru, water is taken from a nearby artificial reservoir that is mainly fed by rainwater. Specific water consumption is high due to the high temperatures throughout the year in Johor. Rainwater is collected and stored in the artificial reservoir with a dual purpose: firstly, to save costs, and secondly, to prevent soil erosion BAHRU STAINLESS Specific Water Consumption m 3 /MT Stainless steel railing. 75
77 Sustainability Report 7.5 Air In order to control and minimize emissions into the atmosphere, the company continuously monitors the factories main emission points in conjunction with the Competent Authority. Moreover, there is an inverse relationship between the atmospheric emissions of steelworks fumes and metal recovery from steel plant waste. Hence, the Steelworks facilities incorporate particle filters that enable for collection and recovery of metallic materials. This represents an environmental and economic advantage, as we are able to recover valuable metal materials which are then reused in the Melting shop. In recent years numerous investments have been made aimed at reducing emissions of greenhouse gases, in particular CO 2, such as the installation of natural gas regenerative burners, and improvements to hot rolling furnaces and heat recovery boilers. This effort and dedication has allowed Acerinox to become one of the most efficient companies in reducing emissions; this can be seen in the data of the ISSF (International Stainless Steel Forum), with Acerinox s direct emission intensity (mt CO 2 /mt steel) being 20% less than the average value for the world s stainless steel manufacturers. It should be pointed out that despite the adoption of new criteria for calculating emissions, and despite the reallocations made by the authorities, it is expected that Acerinox Europa could well maintain its production levels until beyond 2020 without having to purchase new market allowances. The European industry is a world leader in reducing emissions, and Acerinox, thanks to the choice made at the time to use electric arc furnaces, is particularly well positioned for a future in which authorized emissions are expected to be further reduced, especially in the period of 2020/30. Acerinox has voluntarily participated in exercises like the above-mentioned Carbon Disclosure Program Investor 2013 (CDP) or the Climate Action programme of the Worldsteel organization, recording a progressive and substantial reduction in CO 2 emissions in recent years. Lastly, Acerinox collaborates with UNESID (Unión Nacional de Empresas Siderúrgicas) in this regard, preparing the inventory of CO 2 emissions for the Spanish Ministry of the Environment and developing the Law on Environmental responsibility via the MIRAT Project. MT CO 2 / MT Steel ACERINOX EUROPA Specific Emissions Acerinox voluntarily calculates and verifies direct and indirect emissions, the latter as a result of the consumption of electricity and of the supply chain. Acerinox s emissions are verified by the relevant certified authority according to ISO :
78 In Columbus CO 2 emissions are calculated using the ISSF method, and this year they have fallen in comparison to last year, and are far below the limit imposed by local law. Nevertheless, they are higher than in other factories of the group as regards specific emissions, which can be attributable to the low activity of this plant since the beginning of the crisis. MT CO 2 / MT Steel COLUMBUS Specific Emissions Absolute emissions of CO 2 in NAS have slightly increased during 2013, due to higher production, since the ratio of tonnes of CO 2 to tonnes of steel has decreased considerably compared to last year. Precisely for the same reason, work continues to reduce the emission of slag dust by passing it through a scrubber system and subsequently putting it to beneficial uses. It should be pointed out that although the USA is not -as is known- a signatory country to the Kyoto protocols, the technology available in the group allows the factory to offer almost identical specific consumptions to those of our European plant. MT CO 2 / MT Steel NAS Specific Emissions In Bahru emissions of CO 2 are based solely on the consumption of natural gas in the cold rolling stage. In 2013 they were expected to increase minimally due to increased production, as has indeed occurred. MT CO 2 / MT Steel BAHRU STAINLESS Specific Emissions Note: No data are available before 2012 because production began in that year
79 Sustainability Report 7.6 Waste Stainless steel is one of the most sustainable products in the market, and one whose life cycle contributes most to the environment. Stainless steel is made from recycled material, and in the final stage of its service life it is again recycled to produce new steel. Acerinox developed its Foundry technology so that in the manufacture of steel it uses a very high percentage of recycled material, greater than 60%, well above the global average percentage for stainless steel producers according to data by the most prestigious international organizations such as the International Stainless Steel Forum (ISSF). There is a double environmental benefit: the consumption of natural resources is reduced because on the one hand this recycled material replaces the consumption of other raw materials, and on the other, the emission of new pollutants into the environment that would have occurred in the manufacturing process is avoided. During 2013 we have maintained our efforts to recover metal traces in waste, both in slag and steel flue dust. The volume recycled was 34 metric tonnes in the first case and 4.3 in the second. Some additional activity has allowed the total volume of waste metals recovered to be brought to 55 mt, one less than in the previous year. However, Acerinox s main recycling activity does not consist of post-manufacturing activities, but to some extent to prior or simultaneous activities. Indeed, our plants main raw material is scrap and the group, via this activity, has recycled more than 2 million tonnes of industrial waste, recovering it and turning it into a newly -eternally- recyclable product. Also during this year we have continued with use of the factory-generated scale in the form of scale briquettes as an auxiliary material in the steel obtaining process, and we have begun a new briquetting project for the use of flue dust. Acerinox has been awarded the ISSF organization award for the study Manufacture of scale briquettes and their subsequent reuse as a raw material in which our criteria of innovation and positive environmental impact are reflected. ACERINOX EUROPA Recycled Waste ' MT Waste x3 Mt Recycled Waste 78

80 7.7 Natural habitats The Campo de Gibraltar factory has borders with a protected area called the Natural Park of the Palmones River Marshes and with the Palmones Beach. Because of this, Acerinox monitors the water and air in real time with automatic measuring systems that are continuously connected to the competent authority s measurement and control systems, thus contributing to their successful preservation and providing wealth to an area without damaging its ecosystem, demonstrating the compatibility of our activity with the environment. Acerinox Europa participates in local environmental initiatives through its membership in the Environment and Sustainability Council of Los Barrios Town Council and the Environmental Committee of the Association of Large Industries of Campo de Gibraltar (AGI), steering actions with the interested parties It also continues to work on the Palmones beach clean-up. In Columbus this year the traditional ceremony of replanting trees in the area was held. As usual, members of the board of directors also participated in these ceremonies. In Bahru Stainless Malaysian environmental legislation is very strict. Once again this year, fulfilling the national landscaping policy, Bahru has invested in the environment through the landscaping plan to replant unoccupied surrounding areas. This replanting project, which is divided into 2 phases, exceeds the minimum required to maintain 10% of green spaces in the area. Through this replanting project, soil erosion has been mitigated to minimum levels. NAS in addition to contributing, as every year, to preservation of the neighbouring land, which constitutes protected areas for birds of prey and some mammals, has devoted much time and effort to maintaining the Ohio River. The company also promoted a campaign for electronic recycling which has resulted in 15.3 tonnes recycled, a figure we aim to beat in the coming years. View over the Port of Algeciras from one of the BA towers. 79

81 Sustainability Report 8 Industrial Health and Safety Health and Safety in Acerinox Europa Acerinox Europa has always been strongly committed to all its employees and to the employees of its subcontractors. In order to provide them with a safe and healthy work environment. Although the manufacturing activity carried out in the Campo de Gibraltar plant is not without risks, the indexes that reflect or measure the levels of efficiency in these matters have steadily improved in recent years, reaching trend-setting values. In recent years much effort has been made in prevention tasks and in controlling and monitoring thanks to the different types of internal and external audits, which are performed permanently. Safety and Environment Awards In 2012, the Board of Directors created the Safety and Environment awards to the tune of 10,000. In 2013 the winning project was the Taller de chapas workshop. New Packaging system. Improved Safety and Production. Its author was: Luis Marcos Sánchez Peña. Black coil packaged for export. 80
82 Health and Safety in NAS The importance of the Good Practice programmes adopted by NAS in recent years has enabled them to achieve levels of performance in these areas that serve as a benchmark for the sector, industry in general and the other units of the Acerinox Group in particular. Its continued policy of Zero Accidents has allowed it to achieve the Recordable Accident Incident Rate which measures the number of accidents per hour worked in accordance with the OSHA Form 300 standard of an average value over the last 2 years of 3.27, despite attaining far higher levels of production and activity than in previous years. Health and Safety in Columbus Columbus s Health and Safety Programme is based on OSHAS standards and on our own Health Management System as well as the regulations of the Occupational Health and Safety Act. The ultimate goal is to strive for zero injuries and illnesses to all employees and contractors. In June 2012, Columbus Stainless again achieved ISO re-certification. This means that for the next 3 years we must make an effort to comply with all the requirements of this strict safety and environmental management standard. Preventive measures for our employees Each employee attends General Safety, Health and Environment courses every two years, and specific safety and health courses each year. Risk assessments are conducted to identify hazards and risks and to take corrective/preventive measures in the workplace to eliminate or reduce the risks. Employees are trained in safe operating procedures and to comply with all health protocols in their tasks. Each employee attends a monthly Health, Safety and Environment meeting. Personal protective equipment is issued free to employees. Employees are trained in the use and limitations of personal protective equipment. Employees have the right to refuse a task if the situation is not safe or may affect their health. Safety, Health and Environment inspections and controls are conducted by the risk management team. Incident and Accident Investigations. Preventive measures for subcontracted employees All contractors attend General and specific plant courses on Health, Safety and Environmental each year. Health, Safety and Environment agreements are signed between Columbus Stainless and contractors. Contractors performing construction work in Columbus Stainless have to provide a protocol for Health and Safety. The protocol must be approved by Columbus Stainless prior to the commencement of work. Periodic inspections are conducted on contractors to ensure compliance with the Health and Safety protocol and the use of protective equipment. 81
83 Sustainability Report Health and Safety in Bahru Stainless The health and safety committee at Bahru Stainless, which consists of 9 members of staff and 22 employees, has implemented the following two programmes during 2013: -Permit To Work System.(PTW) Programme designed to identify the presence of risks and hazards in the workplace before the start of daily tasks, and to review the controls that mitigate those risks. PTW also undertakes to ensure clean-up of the workplace and surrounding area and equipment maintenance. -Fire Fighting / Emergency Preparedness. Programme devised to mitigate or reduce the impact caused by fires and chemical hazards during an emergency. The employees selected have been equipped with the necessary means to fight fires and have been trained in the safe handling of chemical products. Their training was conducted in collaboration with the BOMBA (Malaysian Fire and Rescue Department). Currently at Bahru Stainless more than 12.5% of all employees are trained as first-aiders to ensure immediate and effective first aid intervention in all situations that require first aid treatment, for immediate implementation. Accidents according to OSHA Form 300 Statistical data 30.0 ACCIDENTS (Recordable Accident Incident Rate) ACERINOX Europa NAS COLUMBUS AVERAGE ACX/NAS/CLB The graph shows the evolution of accidents (Fig. 1), shows the overall index according to OSHA Form 300. The continued Health and Safety policy adopted by all relevant units of the Acerinox Group has consolidated indexes in these areas that are among the best in its sector. Being result of the plans and policies implemented dealing with continuous improvement in all units in recent years. 82

84 9 R & D & i Electric arc with lower emissions. 9.1 A product with extraordinary properties Every year we say that stainless steel is a special material. We cannot stop saying this because every year, when writing these lines, we have found new applications and new advantages. In these years, in which new materials with amazing properties and surprising textures have burst onto the scene, we continue to be surprised by the virtues of stainless steel which become more apparent with each new material that is marketed. Indeed, if these new materials offer amazing properties, most often they do so at very high costs, requiring a very laborious application, sometimes problematic to obtain and with practically zero recyclability - or alternative use. 83
85 Sustainability Report This is why mankind has depended on metals for several thousand years and are not expected to stop doing so, especially when we are still a long way from exhausting all of their possibilities. The uses of stainless steel are far superior today -in number and quality- than those of several decades ago, and a better understanding of its qualities and the discovery of new applications or preparations leads us to believe that we are a long way, a very long way, from imagining just how far its scope of application might take us. Today, together with its undeniable mechanical properties, its undoubtable beauty and its resistance to corrosion, stainless steel has found two very powerful vectors of development. One is symbolizing like little else the ideal of sustainability and recyclability that our planet requires of a material; the other is having been associated with uses that go hand in hand with an increased quality of life and development. Stainless steel is, therefore, the state-of-the-art material for decoration, designer kitchens, clean energy, biotechnology, the pharmaceutical industry, cutting-edge healthcare, the production of quality wine, oils and food and so many other things that make our lives better and more pleasant. 9.2 Research, Development and Innovation The commitment to Total Quality and Business Excellence are the bases of our Company philosophy. Acerinox is aware that research, development and technological innovation are essential to operate successfully in the current market environment, which is open, globalized and highly competitive. We have chosen to adapt to the current scenarios and adopt the strategy of knowledge. Acerinox thus increasingly assumes that its future profitability depends on its investments in research, development and innovation. Successful innovations open up the possibility for producing new, higher quality goods and products using less resources. Innovation is one of the main factors of the competitiveness of enterprises and hence Acerinox promotes it as part of its strategy. In 2013, Acerinox made investments in this field totalling 12.3 million euros. Since opening the first factory, the infrastructure that supports R&D&i in Acerinox has expanded with the incorporation of qualified personnel and state-of-the-art technological equipment, which has led to participation in national and international research projects and agreements with other Companies, Technology Centres and Universities. During 2013 minimum training hours were increased twofold. Most of this increase was precisely dedicated to courses on quality and the detection of defects. The courses have been taught -largely- by retired or close to retirement employees, as they have accumulated the most experience and know-how. Moreover, Acerinox Europa has signed agreements this year with the Universities of Cádiz (the Acerinox Chair) Seville and Málaga, and in other countries with the University of Pretoria and the Louisville School of Engineering (USA), encouraging students to stay and follow their post-graduate studies at our facilities, offering them training aimed at their integration into the working world with important support tasks in pure research and applied research. 84
. Flexible production by multisensor process control of pickling lines (FLEXPROMUS). RFCS Programme (European). Steel Sheet Surfaces with Enhanced Tactile Feel (STEELTAC).")
86 The most important Research and Development projects beyond company level in which Acerinox has participated in this year are: Structural applications of ferritic stainless steels (SAFSS). RFCS Programme (European). Flexible production by multisensor process control of pickling lines (FLEXPROMUS). RFCS Programme (European). Steel Sheet Surfaces with Enhanced Tactile Feel (STEELTAC). RFCS Programme (European). Integrated research on sustainable islands (IISIS). INNPRONTA Programme (National). STEEL TAILOR TUBES (STT). RFCS Programme (European). Innovative and competitive solutions using SS and adhesive bonding in Biogas production (BIOGASS). RFCS Programme (European). Laser based continuous monitoring and resolution of steel grades in sequence casting machines (LACOMORE). RFCS Programme (European). R&D laboratory in Columbus. 85

87 Sustainability Report Acerinox Europa participated in projects for the Sustainable Energy Development of Andalusia, run by the Andalusian Energy Agency. The companies of the group carry out other internal innovation projects to improve their competitiveness. The following are the most important projects we have worked on this year. Approval of materials for specific new applications. Manufacture of new ferritic steels for structural uses. Design of improvements in the bright annealing furnace atmosphere to optimize surface finish. Design and manufacture of duplex stainless steels. Optimization of the adjustment and casting process of austenitic stainless steels to improve cleaning and drawability. Urban furniture. 86

88 Moreover, specifically in Columbus in 2013, support has been given to local research institutions such as the Industrial Metals and Minerals Research Institute (IMMRI) and the universities of Pretoria and Cape Town, promoting the following projects: - Evolution of the microstructure and crystallographic texture of the high and low grades of carbon in ferritic stainless steel. - Behaviour and transformation of duplex stainless steel during hot work. - Identification and study of the micro texture in the stabilized niobium of ferritic steels. And lastly, following up on our proposal last year to encourage and stimulate workers to generate ideas and knowledge and involve them in solving problems and improving the production process, increasing the competitiveness of the Company. The Second Edition of the Quality in progress and Safety and environment awards was convened. The number of projects submitted has by far surpassed that of 2012 with a total of 28. The employees with prizewinning proposals were: - Antonio Chacón Moreno for his Study on the feasibility of reducing energy and gas consumption and in AOD processes. - Rafael Vázquez Fernández with the scratch remover. - Luis Marcos Sánchez Peña with the Taller de chapas workshop. New Packaging system. Improved Safety and Production. Cold rolled coils. 87
89 Sustainability Report 10 Social Action The companies of the group strive each year to make effective use of their human, technical and financial resources in order to help disadvantaged groups and contribute to socialdevelopment. In Acerinox we believe that the way to create value beyond the product is for community involvement to be an integral part of corporate strategy, and in line with the vision, mission and values of the Company. Therefore, in the following paragraphs we are proud to highlight some investments in additional benefits to wages, taxes, contributions to various social security systems andpayment to our shareholders. Integration of staff with disabilities Once again, at Acerinox Europa a considerable effort is made to provide the greatest number of jobs possible for handicapped people, studying their limitations and adapting the workplace to their needs. In the Campo de Gibraltar factory, 105 people with reduced mobility and health authority recognized disabilities provide their services, 36 of whom have a permanent disability. This figure is well above the minimum standards imposed by Spanish regulations in this regard. Aid in Campo de Gibraltar Acerinox collaborated with José María Aguirre Study Grants for the Academic Year to carry out Official University studies. Also in 2013 a Social Commission was set up to collect donations both from employees and the Company (the amount collected monthly by the solidarity of the workers is matched by the Company). The amounts collected were allocated to various projects chosen by the staff: - To the Parish Cáritas of San Isidro Labrador, Los Barrios, whose aim is to help the needy of the town, attending to 255 families by providing them with food and vouchers for electricity, water and gas bills. - To Cáritas of La Línea de La Concepción s Café-Calor Programme, which offers people in need food and drink, plus advice for social reintegration. - To the Nuevo Hogar Betania Residence for the Homeless in La Linea de la Concepción, an association that works directly with people who are socially disadvantaged, marginalized and homeless, providing shelter and soup kitchen services. - To the No child without a toy project run by the Algeciras local Cáritas organizations and the Asociación Benéfica Reyes Magos 98 association. Health and volunteering in NAS Once again this year, NAS has been the largest contributor to the Carrolton High Schools project and other educational institutions, developing a programme that introduces students to various careers, specifically in engineering. Furthermore, it has helped to improve the physiotherapy unit of the Carroll County Memorial Hospital, through the acquisition of new equipment and modern machines, thus collaborating with the society by providing patients with better quality health services. Finally, following tradition, in NAS employees voluntary work in the local area (civil protection, fire service) has continued. For all of the above, NAS won the Impact of Trade in the Community award in recognition of its efforts in improving the quality of life of the community of Carrolton County. 88
 programme to improve the economic and social situation of disadvantaged groups.")
90 Integration of disadvantaged groups in Columbus During 2013, Columbus has enhanced compliance with the requirements of South African law and in particular those of the Broad Based Black Economic Empowerment (BBBEE) programme to improve the economic and social situation of disadvantaged groups. Columbus has implemented the plans of the BBBEE to overcome inequalities, with the intention of making further progress in It has also actively supported the Craft workers Development Programmes, in particular by helping over 200 within the region of Mpumalanga. Moreover, Columbus has dedicated time and effort to improving the conditions of schooling for children from poor communities by investing in the building of classrooms and science labs as well as in the development of a local Mathematics and Science project which provides additional teaching to secondary school students. Once again this year, Columbus has been particularly active in the fight against HIV by funding prevention clinics, free tests, informational seminars and the distribution of free condoms. These measures, included in a comprehensive United Nations programme, have contributed to lowering the incidence of this disease among factory staff to many percentage points under the regional average, and therefore Columbus will increase the resources earmarked for this fight in future years. Stainless steel tram. 89

91

92 3 Consolidated Annual Accounts
93 acerinox, s.a. and Subsidiaries Annual Accounts of the Consolidated Group 31 December 2013 (Free translation from the original in Spanish. In the event of discrepancy, the Spanish-language version prevails.)

94
95 Consolidated Annual Accounts 1. CONSOLIDATED BALANCE SHEETS (Free translation from the original in Spanish. In the event of discrepancy. the Spanish-language version prevails.) (In thousands of Euros at 31 December 2013 and 2012) ASSETS Note Non-current assets Goodwill 7 69,124 69,124 Other intangible assets 7 6,644 6,965 Property. plant and equipment 8 1,892,810 2,019,609 Available-for-sale financial assets 9 9,149 7,455 Deferred tax assets , ,880 Other non-current financial assets 4,091 2,137 TOTAL NON-CURRENT ASSETS 2,200,066 2,308,170 Current assets Inventories , ,483 Trade and other receivables 9 413, ,540 Other current financial assets 9 12,162 16,607 Current tax assets 17 5,615 8,163 Cash and cash equivalents , ,671 TOTAL CURRENT ASSETS 1,790,904 1,907,464 TOTAL ASSETS 3,990,970 4,215,634 Notes 1 to 20 form an integral part of the consolidated annual accounts. 94
96 (In thousands of Euros at 31 December 2013 and 2012) EQUITY AND LIABILITIES Note Equity Subscribed capital 12 64,287 62,326 Share premium 12 81,403 81,403 Reserves 12 1,477,870 1,535,877 Profit/loss for the year 12 22,068-21,781 Translation differences ,583-89,337 EQUITY ATTRIBUTABLE TO SHAREHOLDERS OF THE PARENT 1,437,045 1,568,488 Non-controlling interests , ,525 TOTAL EQUITY 1,553,225 1,713,013 Non-current liabilities Deferred income 13 4,834 5,908 Loans and borrowings 9 750, ,400 Non-current provisions 14 13,580 13,616 Deferred tax liabilities , ,545 Other non-current financial liabilities 9 21,313 37,648 TOTAL NON-CURRENT LIABILITIES 990,609 1,178,117 Current liabilities Loans and borrowings 9 408, ,807 Trade and other payables 9 979,570 1,005,756 Current tax liabilities 17 14,340 12,282 Other current financial liabilities 9 44,955 37,659 TOTAL CURRENT LIABILITIES 1,447,136 1,324,504 TOTAL EQUITY AND LIABILITIES 3,990,970 4,215,634 Notes 1 to 20 form an integral part of the consolidated annual accounts. 95
97 Consolidated Annual Accounts 2. CONSOLIDATED INCOME STATEMENTS (Free translation from the original in Spanish. In the event of discrepancy. the Spanish-language version prevails.) (In thousands of Euros) Note Revenues 15 3,966,278 4,554,688 Other operating income 15 12,723 11,607 Self-constructed non-current assets 15 39,404 23,297 Changes in inventories of finished goods and work in progress -54, ,346 Supplies -2,828,147-3,253,743 Personnel expenses , ,792 Amortisation and depreciation , ,976 Other operating expenses , ,996 RESULTS FROM OPERATING ACTIVITIES 88,284 47,739 Finance income 16 9,509 4,140 Finance costs 16-65,664-68,860 Exchange gains 16 1,043 33,483 Remeasurement of financial instruments to fair value ,197 Share in profit/loss for the year of equity-accounted investees -64 Impairment of financial instruments 9-4,932 PROFIT/LOSS FROM ORDINARY ACTIVITIES 33,180-23,691 Income tax 17-21,748-11,726 Other taxes 17-1, PROFIT/LOSS FOR THE YEAR 9,585-35,576 Attributable to: NON-CONTROLLING INTERESTS -12,483-13,795 NET PROFIT/LOSS ATTRIBUTABLE TO THE GROUP 22,068-21,781 Basic earnings/loss per share (in Euros) Diluted earnings/loss per share (in Euros) Figures for 2012 have been restated as indicated in note 2,1. Notes 1 to 20 form an integral part of the consolidated annual accounts. 96
98 3. CONSOLIDATED STATEMENTS OF COMPREHENSIVE INCOME (Free translation from the original in Spanish. In the event of discrepancy. the Spanish-language version prevails.) (In thousands of Euros) Note A) PROFIT/LOSS FOR THE YEAR INCOME AND EXPENSE RECOGNISED DIRECTLY IN EQUITY I. Measurement of financial instruments 1. Available-for-sale financial assets ,695-4, Other income/expenses II. Cash flow hedges ,605-38,534 III. Translation differences ,899-36,583 IV. Actuarial gains and losses and other adjustments V. Tax effect 1,930 13,081 B) TOTAL INCOME AND EXPENSE RECOGNISED DIRECTLY IN EQUITY -137,103-66,968 AMOUNTS TRANSFERRED TO THE INCOME STATEMENT I. Measurement of assets and liabilities 1. Measurement of financial instruments , Other income/expenses II. Cash flow hedges ,677 23,626 III. Translation differences IV. Actuarial gains and losses and other adjustments V. Tax effect -6,668-8,021 C) TOTAL AMOUNTS TRANSFERRED TO THE INCOME STATEMENT 15,009 20,537 TOTAL COMPREHENSIVE INCOME -112,509-82,007 a) Attributable to the Parent -84,164-66,332 b) Attributable to non-controlling interests -28,345-15,675 Figures for 2012 have been restated as indicated in note 2,1. Notes 1 to 20 form an integral part of the consolidated annual accounts. 97
99 Consolidated Annual Accounts 4. CONSOLIDATED STATEMENTS OF CHANGES IN EQUITY (Free translation from the original in Spanish. In the event of discrepancy. the Spanish-language version prevails.) (In thousands of Euros) Equity attributable to shareholders of the Parent Subscribed capital Share premium Retained earnings (including profit/loss for the year) Property. plant and equipment revaluation reserves Cash flow hedge reserves Availablefor-sale asset fair value reserve Actuarial valuation reserves Translation differences Interim dividend Own shares TOTAL Noncontrolling interests TOTAL EQUITY Notes Equity at 31/12/ , ,334 1,648,033 5,242-12,896-7,861-55,256-24,930 1,720, ,200 1,881,192 Loss for ,329-18,329-13,795-32,124 Restatement of loss for 2012 due to change in accounting policies 2.1-3,452-3,452-3,452 Restated loss for ,781-21,781-13,795-35,576 Measurement of available-forsale assets (net of tax) Cash flow hedges (net of tax) ,470-10, ,848 Translation differences ,081-34,081-2,502-36,583 Income and expense recognised in equity , , ,551-1,880-46,431 Total comprehensive income , , , ,332-15,675-82,007 Distribution of dividends ,256 49,860-37,396-37, interim dividend ,930-24,930-24,930 Distribution of share premium ,931-24,931-24,931 Transactions with shareholders 0-24,931-87, , , ,257 Other movements 1,085 1,085 1,085 Equity at 31/12/ ,326 81,403 1,540,081 5,242-23,366-7,861-89, ,568, ,525 1,713,013 Profit for ,068 22,068-12,483 9,585 Measurement of available-forsale assets (net of tax) ,186 1,186 1,186 Cash flow hedges (net of tax) ,430 11, ,094 Actuarial valuation of employee benefit commitments Translation differences , ,246-16, ,899 Income and expense recognised in equity ,430 1, , ,232-15, ,094 Total comprehensive income , ,430 1, , ,164-28, ,509 Capital increase ,961-2, Distribution of dividends ,831-46,831-46,831 Transactions with shareholders 1, , , ,898 Acquisition of own shares Disposal of own shares Other movements Equity at 31/12/ ,287 81,403 1,512,909 5,242-11,936-6, , ,437, ,180 1,553,225 Notes 1 to 20 form an integral part of the consolidated annual accounts. 98
100 5. CONSOLIDATED STATEMENTS OF CASH FLOWS (Free translation from the original in Spanish. In the event of discrepancy. the Spanish-language version prevails.) (In thousands of Euros) CASH FLOWS FROM OPERATING ACTIVITIES Profit/loss before income tax 33,180-23,691 Adjustments for: Amortisation and depreciation 134, ,976 Impairment -2,576 2,162 Change in provisions 4,317 2,038 Grants recognised in the income statement -2,977-2,098 Gains on disposal of fixed assets Change in fair value of financial instruments 12,260 6,790 Finance income -7,258-4,140 Finance costs 75,621 68,860 Share of profit/loss of associates 0 64 Other income and expenses -28,336 1,777 Changes in working capital: Increase/decrease in trade and other receivables -42,763 79,022 Increase/decrease in inventories 84, ,330 Increase/decrease in trade and other payables 107, ,776 Other cash flows from operating activities Interest paid -61,141-65,946 Interest received 7,144 3,771 Income tax paid -54,716-41,369 NET CASH FROM OPERATING ACTIVITIES 259, ,459 CASH FLOWS FROM INVESTING ACTIVITIES Acquisition of property. plant and equipment -163, ,504 Acquisition of intangible assets Acquisition of other financial assets Proceeds from sale of property. plant and equipment 3,066 2,020 Proceeds from sale of intangible assets 0 12 Proceeds from sale of other financial assets Dividends received Other amounts received/paid for investments NET CASH USED IN INVESTING ACTIVITIES -162, ,712 CASH FLOWS FROM FINANCING ACTIVITIES Issue of own equity instruments -67 Acquisition of own shares -78 Disposal of own shares ,546 Repayment of interest-bearing liabilities 365, ,132 Dividends paid -347,314-87,256 Distribution of share premium -46,831-24,931 Contribution from non-controlling shareholders NET CASH FROM/USED IN FINANCING ACTIVITIES -28,263 5,227 NET INCREASE IN CASH AND CASH EQUIVALENTS 68, ,974 Cash and cash equivalents at beginning of year 582, ,631 Effect of exchange rate fluctuations -21,967-1,934 CASH AND CASH EQUIVALENTS AT YEAR END 629, ,671 Notes 1 to 20 form an integral part of the consolidated annual accounts. 99
101 Consolidated Annual Accounts CONTENTS NOTES TO THE CONSOLIDATED ANNUAL ACCOUNTS NOTE DESCRIPTION PAGE NOTE 1 NOTE 2 NOTE 3 NOTE 4 NOTE 5 NOTE 6 NOTE 7 NOTE 8 NOTE 9 NOTE 10 NOTE 11 NOTE 12 NOTE 13 NOTE 14 NOTE 15 NOTE 16 NOTE 17 NOTE 18 NOTE 19 NOTE 20 GENERAL INFORMATION ACCOUNTING POLICIES FINANCIAL RISK MANAGEMENT ACCOUNTING ESTIMATES AND JUDGEMENTS SCOPE OF CONSOLIDATION SEGMENT REPORTING INTANGIBLE ASSETS PROPERTY. PLANT AND EQUIPMENT FINANCIAL INSTRUMENTS INVENTORIES CASH AND CASH EQUIVALENTS EQUITY DEFERRED INCOME PROVISIONS AND CONTINGENCIES INCOME AND EXPENSES NET FINANCE COST TAXATION RELATED PARTY BALANCES AND TRANSACTIONS AUDIT FEES EVENTS AFTER THE REPORTING PERIOD
102 6 NOTES TO THE CONSOLIDATED ANNUAL ACCOUNTS (Free translation from the original in Spanish. In the event of discrepancy. the Spanish-language version prevails.) NOTE 1 GENERAL INFORMATION Parent: Acerinox. S.A. (hereinafter the Company). Incorporation: Acerinox. S.A. was incorporated with limited liability under Spanish law on 30 September Registered offices: Calle Santiago de Compostela Madrid. Spain. Statutory and principal activity: the Company s statutory activity. as described in its articles of association. is the manufacture and sale of stainless steel products and other similar or derivative products. either directly or indirectly through shareholdings in companies with the same or similar statutory activities. Its principal activity is that of a holding company. as parent of the Acerinox Group. The Company also renders legal. accounting and advisory services to all the Group companies and carries out financing activities within the Group. The Group s principal activity. conducted through its subsidiaries. is the manufacture. transformation and marketing of stainless steel products. The Acerinox Group has six stainless steel factories: two manufacturing flat products in Spain and South Africa; one producing flat and long steel in the United States; a further two making long steel products in Spain; and another in Malaysia for flat products. where the first cold rolling activity is now operative and the second entered service in 2013 and now is in testing phase. The Group also has a network of sales subsidiaries in Spain and abroad that sell all its products as their main activity. Financial year: the financial year of Acerinox. S.A. and all the Group companies is the twelve-month period from 1 January to 31 December. Annual accounts: these consolidated annual accounts were authorised for issue by the board of directors of Acerinox. S.A. on 26 February NOTE 2 ACCOUNTING POLICIES 2.1 Statement of compliance The consolidated annual accounts of the Group have been prepared in accordance with International Financial Reporting Standards (IFRS) and interpretations (IFRIC) as adopted by the European Union (hereinafter IFRS-EU) and other applicable provisions in the financial reporting framework. With the exception of the new standards and amendments adopted by the European Union (listed below and of mandatory application as of 1 January 2013 but with no significant impact on the Group) and the change in accounting criteria mentioned below and explained further in note the annual accounts for 2013 have been prepared using the same accounting principles as in 2012 (IFRS-EU). For comparison purposes. the Group has restated its 2012 financial statements. recognising the impairment of its investment in Nisshin Steel. as evidenced by a drop in this company s share price. in the income statement. In 2012 this impairment was not recognised in profit and loss but rather in reserves. as it was considered at the time that the share price had been greatly affected by stock market upheaval following the merger between Nisshin Steel. Co. Ltd. and Nippon Metal Industry and was not. therefore. representative of the expected future cash flows. Nevertheless. considering recent recommendations from the ESMA and the Spanish Securities Market Commission (CNMV). the Group has adjusted its accounting policy for recognising and calculating the impairment of available-for-sale assets and restated the 2012 financial statements. as a result of which the post-tax loss recognised in the consolidated income statement for that year has been increased by Euros 3.5 million. This restatement has had no impact on comprehensive income. 101
103 Consolidated Annual Accounts Among the standards taking effect from 1 January the following have the most relevant impact: IFRS 13 Fair Value Measurement: this standard defines fair value. sets out in a single IFRS a framework for measuring fair value and requires disclosures about fair value measurements. While IFRS 13 does not require any additional fair value measurements to those already in place. it does clarify how to apply an entity s own credit risk to these measurements. The Group has applied this standard in Although the impact has not been significant. it has led to a decrease in the fair value of derivatives as. disclosed in note Amendments to IAS 1 in Presentation of Items of Other Comprehensive Income: items that will never be reclassified to the income statement must now be presented separately in the statement of comprehensive income. As all items in the Group s statement of comprehensive income could be reclassified to the income statement. this standard has no impact on the Group and the structure of this statement has not been changed. Amendments to IAS 19 Employee Benefits: effective for annual periods beginning on or after 1 January The measurement criteria for defined benefit liabilities and the components of actuarial calculations have changed. The Group has taken these changes into account and the impact. although not significant. has led to an increase in equity due to changes in actuarial value amounting to Euros 525 thousand. which has been recognised in the consolidated statement of recognised income and expense. The disclosures required by this standard are provided in note The following are standards or interpretations already adopted by the European Union. which will be obligatory in the coming years. together with their expected impact for the Group: IFRS 10 Consolidated Financial Statements. Effective for annual periods beginning on or after 1 January The objective of this IFRS is to establish principles for the presentation and preparation of consolidated financial statements when an entity controls one or more other entities. It introduces a new model for assessing whether control exists. This IFRS supersedes IAS 27. IFRS 11 Joint Arrangements. Effective for annual periods beginning on or after 1 January The objective of this IFRS is to establish principles for financial reporting by entities that have an interest in arrangements that are controlled jointly. The proportionate consolidation option has been eliminated and definitions are provided for the terms joint arrangement and joint venture. IFRS 12 Disclosure of Interests in Other Entities. Effective for annual periods beginning on or after 1 January The objective of this IFRS is to establish principles for the presentation and preparation of consolidated financial statements when an entity controls one or more other entities. requiring additional disclosures in consolidated financial statements. Effective for annual periods beginning on or after 1 January IAS 32 (revised) Financial Instruments: Presentation. Effective for annual periods beginning on or after 1 January The revised standard clarifies requirements for offsetting financial assets and financial liabilities (pending adoption by the European Union). IFRS 9 Financial Instruments: pending to be adopted by the EU. Categories of financial instruments are reduced to two at amortised cost and at fair value. This standard also stipulates that debt instruments may only be classified as at amortised cost when they are payments of principal and interest (characteristics of loans). so all other debt should be recognised at fair value. The Group will need to adapt the classification of its financial instruments as a result. Changes in the value of available-for-sale financial assets are to be recognised as changes in equity and do not have to be taken to the income statement. even in the event of impairment. The standard also proposes significant changes in terms of aligning hedge accounting and risk management. defining a target-based approach and eliminating inconsistencies and shortfalls in the existing model. Some aspects of the measurement of equity instruments have also been modified. These amendments are not expected to have a relevant impact on the Group s annual accounts. although they will probably entail more in-depth disclosures. The Group has not opted for the early adoption of any disclosure requirements or accounting policies. 2.2 Basis of presentation of the consolidated annual accounts The accompanying consolidated annual accounts have been prepared by the directors of the Parent to present fairly the Group s consolidated equity and consolidated financial position at 31 December 2013 and as well as the consolidated results of its operations and changes in consolidated equity and consolidated cash flows for the years then ended. The consolidated annual accounts are presented in Euros rounded off to the nearest thousand. They are prepared on the historical cost basis. except for derivative financial instruments and available-for-sale financial assets. which have been measured at fair value. 102
104 The preparation of the consolidated annual accounts in conformity with IFRS-EU requires the Parent s management to make judgements. estimates and assumptions that affect the application of accounting policies and. therefore. the amounts reported in the consolidated balance sheet and the consolidated income statement. These estimates are based on past experience and other factors considered appropriate. The Group may amend these estimates in light of subsequent events or changes in circumstances. The aspects that involve a greater degree of judgement in the application of IFRS-EU or for which the estimates made are significant for the preparation of the consolidated annual accounts are detailed in note 4. Qualitative and quantitative details of the risks assumed by the Group which could have an effect on future years are provided in note 3. The accompanying consolidated annual accounts have been prepared on the basis of the individual accounting records of the Company and the subsidiaries forming the Acerinox Group. The consolidated annual accounts include certain adjustments and reclassifications made to bring the accounting and presentation policies used by different Group companies into line with those of the Company. The consolidated annual accounts for 2012 were approved by the shareholders at their annual general meeting held on 5 June The Group s consolidated annual accounts for 2013 are currently pending approval by the shareholders. The directors of the Company consider that these consolidated annual accounts will be approved with no changes by the shareholders at their annual general meeting. 2.3 Going concern assumption and accruals basis The consolidated annual accounts have been prepared on a going concern basis. Income and expenses are recognised on an accruals basis. irrespective of collections and payments. 2.4 Consolidation principles a) Subsidiaries Subsidiaries are entities over which the Group has the ability to control financial and operating policies. This is generally where the Group holds more than 50% of the voting rights. The financial statements of subsidiaries are included in the consolidated annual accounts from the date on which control commences to the date on which control ceases. The Group has considered potential voting rights in assessing its level of control over Group companies. The Acerinox Group s consolidated subsidiaries at 31 December 2013 and 2012 are listed in note 5. b) Non-controlling interests Non-controlling interests are disclosed in consolidated equity separately from equity attributable to shareholders of the Parent. Non-controlling interests shares in consolidated profit or loss for the year and in consolidated total comprehensive income for the year are disclosed separately in the consolidated income statement and the consolidated statement of comprehensive income. Non-controlling interests in subsidiaries acquired after 1 January 2004 are recognised at the acquisition date at the proportional part of the fair value of the identifiable net assets. Non-controlling interests in subsidiaries acquired prior to the transition date were recognised at the proportional part of the equity of the subsidiaries at the date of first consolidation. Profit and loss and each component of other comprehensive income are allocated to equity attributable to equity holders of the Parent and to non-controlling interests in proportion to their investment. even if this results in a balance receivable from non-controlling interests. Agreements entered into between the Group and non-controlling interests are recognised as a separate transaction. c) Business combinations As permitted by IFRS 1 First-time Adoption of International Financial Reporting Standards. the Group has recognised only business combinations that occurred on or after 1 January the date of transition to IFRS-EU. using the acquisition method. Entities acquired prior to that date were recognised in accordance with the generally accepted accounting principles (GAAP) prevailing at that time. taking into account the necessary corrections and adjustments at the transition date. The Group has applied IFRS 3 Business Combinations. revised in to transactions carried out as of 1 January The Group applies the acquisition method for business combinations. No business combinations took place in 2013 or
105 Consolidated Annual Accounts d) Associates Associates are entities over which the Group has significant influence in financial and operating decisions. but not control or joint control. This is generally where the Group holds between 20% and 50% of voting rights. The financial statements of associates are included in the consolidated annual accounts using the equity method. The Group s share of the profit or loss of an associate from the date of acquisition is recognised with a credit or debit to share in profit/loss for the year of equity-accounted investees in the consolidated income statement. The accounting policies of associates have been harmonised in terms of timing and measurement. applying the policies described in section a). Investments in associates are initially recognised at cost of acquisition. including any cost directly attributable to the acquisition and any consideration receivable or payable contingent on future events or on compliance with certain conditions. The excess of the cost of the investment over the Group s share of the fair values of the identifiable net assets is recognised as goodwill. which is included in the carrying amount of the investment. Any shortfall. once the cost of the investment and the identification and measurement of the associate s net assets have been evaluated. is recognised as income when determining the investor s share of the profit or loss of the associate for the year in which it was acquired. The Group s share of the profit or loss of an associate from the date of acquisition is recognised as an increase or decrease in the value of the investments. with a credit or debit to share of the profit or loss for the year of equity-accounted associates in the consolidated income statement (consolidated statement of comprehensive income). The distribution of dividends is recognised as a decrease in the value of the investment. Losses of an associate attributable to the Group are limited to the extent of its net investment. except where the Group has legal or constructive obligations or when payments have been made on behalf of the associate. e) Balances and transactions eliminated on consolidation Balances and transactions between Group companies and the resulting unrealised gains or losses with third parties are eliminated on consolidation. Unrealised gains and losses with third parties that arise on transactions with associates are eliminated to the extent of the Group s interest in the entity. 2.5 Translation differences i) Functional and presentation currency The annual accounts of each Group company are expressed in the currency of the underlying economic environment in which the entity operates (functional currency). The figures disclosed in the consolidated annual accounts are expressed in thousands of Euros. the Parent s functional and presentation currency. ii) Foreign currency transactions. balances and cash flows Transactions in foreign currencies are translated using the foreign exchange rate prevailing at the date of the transaction. Monetary assets and liabilities denominated in foreign currencies at the reporting date are translated at the closing exchange rate prevailing at that date. Any exchange differences that may arise from translation are recognised in profit or loss. Non-monetary assets and liabilities denominated in foreign currencies and recorded at historical cost are translated to the functional currency using the exchange rate prevailing at the date of the transaction. Non-monetary assets and liabilities denominated in foreign currencies that are measured at fair value are translated to the functional currency using the exchange rate prevailing at the date on which fair value was determined. In the consolidated statement of cash flows. cash flows from foreign currency transactions have been translated into Euros at the exchange rates prevailing at the dates the cash flows occur. Exchange gains and losses arising on the settlement of foreign currency transactions and the translation into functional currency of monetary assets and liabilities denominated in foreign currencies are recognised in profit or loss. 104
106 Exchange gains or losses on monetary financial assets or financial liabilities denominated in foreign currencies are also recognised in profit or loss. Exchange gains and losses on non-monetary items measured at fair value are recorded as a part of the gain or loss on the fair value of the item. iii) Translation of foreign operations The Group has applied the exemption permitted by IFRS 1 First-time Adoption of International Financial Reporting Standards relating to cumulative translation differences. Consequently. translation differences recognised in the consolidated annual accounts generated prior to 1 January 2004 are recognised in retained earnings. As permitted by IFRS 1. the Group did not apply IAS 21 The Effects of Changes in Foreign Exchange Rates retrospectively to goodwill arising on business combinations that occurred before the date of transition to IFRS. Consequently. goodwill is considered as an asset of the acquirer not the acquiree. and is therefore not subject to variations due to exchange rate fluctuations affecting the acquiree. Since that date. the financial statements of Group companies that are stated in a currency other than the presentation currency have been translated to Euros as follows: assets and liabilities. including goodwill and net asset adjustments derived from the acquisition of the foreign operations. are translated at the closing rate prevailing at the reporting date; income and expenses are translated at the average exchange rate for the period; and translation differences are recognised separately in equity under translation differences. For presentation of the consolidated statement of cash flows. cash flows of foreign subsidiaries. including comparative balances. are translated into Euros applying the exchange rates prevailing at the transaction date. No Group companies operate in hyperinflationary economies. 2.6 Intangible assets a) Goodwill Business combinations are accounted for by applying the acquisition method. Goodwill generated on acquisitions of controlling interests subsequent to the transition date (1 January 2004) accounted for using this method represents the positive difference between the cost of acquisition and the Group s share of fair value of the identifiable net assets of the acquired subsidiaries (assets. liabilities and contingent liabilities). Goodwill generated on the acquisition of associates is included under investments in associates. As permitted by IFRS 1. goodwill on acquisitions completed prior to this date is recognised at historical cost. less amortisation accumulated following the generally accepted accounting principles prevailing in Spain at the acquisition date. As this amount was neither an intangible asset recognised under local principles but not permitted under IFRS-EU. nor a contingent liability. none of the adjustments stipulated in IFRS 1 were required. and it was considered as the deemed cost of goodwill at the transition date. After initial recognition. goodwill is measured at cost less any accumulated impairment losses. Goodwill is not amortised but is tested annually for impairment (or more frequently where there are indications of possible impairment) in accordance with IAS 36 (see note 2.8). Goodwill is allocated to cash-generating units for the purposes of impairment testing. Negative goodwill arising on an acquisition of a business combination is recognised directly in the consolidated income statement. after reassessing the measurement of the assets. liabilities and contingent liabilities of the acquiree. as established in the standard. Internally generated goodwill is not recognised as an asset. b) Internally generated intangible assets Expenditure on research activities undertaken with the prospect of gaining new scientific or technical knowledge is expensed in the consolidated income statement when incurred. When research findings are applied to produce new products or to substantially improve existing products and processes. the associated development costs are capitalised if the product or process is technically and commercially feasible. the Group has sufficient resources to complete development and sufficient future cash flows are expected to be generated to recover the costs. with a credit to self-constructed non-current assets in the consolidated income statement. The expenditure capitalised includes the cost of materials. direct labour and directly attributable overheads. 105
107 Consolidated Annual Accounts Expenditure on activities for which the costs attributable to the research phase are not clearly distinguishable from costs associated with the development stage of intangible assets is recognised in the consolidated income statement. Capitalised development costs are not amortised while the project is underway. Upon successful completion of the project. amortisation begins on a systematic basis over the estimated useful life. In the event of changes in the circumstances that led to the capitalisation of the project expenditure. the unamortised balance is expensed in the year the changes arise. c) Computer software Computer software licences are capitalised at the cost of acquiring the licence and preparing the specific program for use. Computer software maintenance or development costs are charged as expenses when incurred. Costs that are directly associated with the production of identifiable and unique computer software packages by the Group are recognised as intangible assets provided that they are likely to generate economic benefits that exceed the associated costs for more than one year. Capitalised expenses comprise direct labour costs and directly attributable overheads. d) Emission allowances CO2 emission allowances are recognised as intangible assets and measured at cost of acquisition. Allowances acquired free of charge under the National Allocation Plan pursuant to Law 1/2007 of 9 March 2007 are initially measured at fair market value. which is generally the market price of the allowances on receipt. At the same time. a grant is recognised for the same amount under deferred income. Emission allowances are not amortised. but rather are expensed when used. Valuation adjustments are made as appropriate to reflect any reduction in market value at the end of each year provided that the carrying amount is not considered to be recoverable through the generation of sufficient future income to cover all of the costs incurred or they are expected to be realised through the cancellation of the provision for greenhouse gas emissions described below. Provisions are released when the factors leading to the valuation adjustment have ceased to exist. A provision for liabilities and charges is recognised for expenses related to the emission of greenhouse gases. This provision is maintained until the company is required to settle the liability by surrendering the corresponding emission allowances. These expenses are accrued as greenhouse gases are emitted. When an expense is recognised for allowances acquired free of charge. the corresponding deferred income is taken to operating income. Detailed information on emission allowances received and consumed in 2013 and 2012 is included in note 7 Intangible assets. e) Amortisation Intangible assets with finite useful lives are amortised by allocating the depreciable amount of an asset on a systematic basis over its useful life. Intangible assets are amortised from the date they become available for use. Goodwill and development expenditure on work in progress are tested annually for impairment. Estimated useful lives are as follows: Industrial property: 5 years Computer software: 2-5 years The Group does not have any intangible assets with indefinite useful lives. Residual values. amortisation methods and useful lives are reviewed. and adjusted if appropriate. at each reporting date. Changes to initially established criteria are accounted for as a change in accounting estimates. 106
108 2.7 Property. plant and equipment a) Owned assets Property. plant and equipment are recognised at cost or deemed cost. less accumulated depreciation and any accumulated impairment losses. The deemed cost of property. plant and equipment at the transition date included the cost of purchase and revaluations carried out under local accounting principles applied prior to 1 January Historical cost includes all expenses directly attributable to the acquisition of the items. At 1 January 2004 the Group applied the exemption permitted by IFRS 1 First-time Adoption of International Financial Reporting Standards relating to fair value or revaluation as deemed cost. The cost of self-constructed assets is determined using the same principles as for an acquired asset. while also considering the criteria applicable to production costs of inventories. The production cost is capitalised by allocating the costs attributable to the asset to self-constructed noncurrent assets in the consolidated income statement. Borrowing costs directly linked to financing the construction of property. plant and equipmen are capitalised as part of the cost until the asset enters service. The Group also capitalises certain borrowing costs incurred on loans that are not directly used to finance the investments. applying a capitalisation rate to amounts disbursed to finance the asset based on the weighted average of the borrowing costs incurred on loans other than those specifically used to finance the asset in question. The amount of borrowing costs capitalised never exceeds the amount of borrowing costs incurred during the period. The cost of property. plant and equipment includes major repair costs. which are capitalised and depreciated over the estimated period remaining until the following major repair. These costs also include exchange gains or losses on effective cash flow hedges of acquisitions of property. plant and equipment in foreign currency. Subsequent to initial recognition of the asset. improvement costs are only capitalised if they are likely to generate future economic benefits and can be measured reliably. Costs of day-to-day servicing are recognised in profit and loss as incurred. Spare parts are carried as inventory unless the Group expects to use them over more than one period. in which case they qualify as property. plant and equipment and are depreciated over their useful life. The carrying amount of a spare part is written off when it is used to replace a damaged part. b) Investment property Investment property comprises Group-owned buildings held to earn rentals or for capital appreciation but not occupied by the Group. Investment property is initially recognised at cost. including transaction costs. Subsequently the Group applies the same criteria as for property. plant and equipment. As investment property represents only a minor proportion of the Group s assets. it is included within property. plant and equipment. Details are. however. provided in the notes. Lease income is recognised using the criteria described in note 2.17 b). c) Depreciation Property. plant and equipment are depreciated by allocating the depreciable amount of the asset on a systematic basis over its useful life. The depreciable amount is the cost or deemed cost of an asset. less its residual value. Each part of an item of property. plant and equipment with a cost that is significant in relation to the total cost of the item is depreciated separately. Residual values. depreciation methods and useful lives are reviewed. and adjusted if appropriate. at each reporting date. Changes to initially established criteria are accounted for as a change in accounting estimates. Land is not depreciated. Property. plant and equipment are depreciated over the following estimated useful lives: Buildings: years Technical installations and machinery: 3-30 Other property. plant and equipment: 2-10 years 107
109 Consolidated Annual Accounts 2.8 Impairment of non-financial assets The carrying amounts of the Group s non-financial assets. other than inventories and deferred tax assets. are reviewed at each reporting date to determine whether there are any indications of impairment. If any such indication exists. the Group estimates the recoverable amount of the asset. The recoverable amount of goodwill. which is not amortised. and of intangible assets not yet available for use is estimated at each reporting date. Impairment losses are recognised whenever the carrying amount of the asset. or its corresponding cash-generating unit. exceeds its recoverable amount. Impairment losses are expensed in the income statement. The recoverable amount of the assets is the higher of their fair value less costs to sell and their value in use. Value in use is the present value of estimated cash flows. applying a discount rate that reflects the current market valuation of the time value of money and the specific risks of the asset in question. For assets that do not generate cash inflows themselves. the recoverable amount is determined for the cash-generating unit to which the asset belongs. considered as the smallest identifiable group of assets that generates cash inflows that are largely independent of the cash inflows from other assets or groups of assets. Details of the variables and assumptions used by the Group to calculate value in use and identify cash-generating units are provided in notes 7.2 and 8.1. Except in the case of goodwill. impairment losses recognised in prior years are reversed through the income statement provided that there has been a change in the estimates used to determine the asset s recoverable amount since the last impairment loss was recognised. However. the new carrying amount cannot exceed the carrying amount (net of amortisation or depreciation) that the asset would have had if no impairment loss had been recorded. 2.9 Financial instruments Classification The Group classifies financial instruments into different categories based on the nature of the instruments and its intentions on initial recognition Financial assets Acquisitions and disposals of investments are accounted for at the date on which the Group undertakes to purchase or sell the asset. Investments are derecognised when the contractual rights to the cash flows from the investment expire or have been transferred and the Group has transferred substantially all the risks and rewards of ownership. On derecognition of a financial asset in its entirety. the difference between the carrying amount and the sum of the consideration received. net of transaction costs. The fair value of listed securities is determined by reference to the share price. The fair value of financial assets that are not quoted in official markets is calculated by reference to discounted future cash flows. The measurement criteria applied to the financial assets held by the Group in 2013 and 2012 are detailed below. a) Financial assets at fair value through profit or loss Derivative financial instruments. except those that are designated as hedges and qualify for recognition as such. are included in this category. The derivative financial instruments included in this category are classified as current assets and measured at fair value. Transaction costs directly attributable to the acquisition are recognised as an expense. Changes in fair value are recorded under remeasurement of financial instruments to fair value in the income statement. 108
110 b) Loans and receivables Loans and receivables include non-derivative financial assets with fixed or determinable payments that are not quoted in an active market. They are only classified as non-current when they are not due to mature within 12 months of the reporting date. These investments are initially recognised at the fair value of the consideration given. including transaction costs directly attributable to the purchase. and subsequently measured at amortised cost using the effective interest method. Discounted notes and factored trade receivables are recognised until maturity under both trade receivables and current borrowings. unless the risks and rewards associated with these assets have been substantially transferred. in which case they are derecognised. The Group makes the necessary valuation adjustments where there is evidence that a receivable is impaired. The amount of the impairment loss is calculated as the difference between the carrying amount and the present value of the estimated future cash flows. discounted at the effective interest rate determined on initial recognition. These losses are recognised as an expense in the consolidated income statement and reversed when their causes are eliminated. The amount reversed is recognised as income. c) Available-for-sale financial assets The Group classifies in this category non-derivative financial instruments that are designated as available for sale or which do not qualify for recognition in the previous categories. They are initially recognised at fair value plus transaction costs directly attributable to the purchase. After initial recognition financial assets classified in this category are measured at fair value and any gain or loss is accounted for in the consolidated statement of comprehensive income. Equity investments included in this category whose market value cannot be reliably defined are measured at acquisition cost. as permitted by IFRS-EU. When available-for-sale financial assets are sold. the cumulative gains or losses from changes in fair value recognised in the consolidated statement of comprehensive income are transferred to the consolidated income statement. When a decline in the fair value of an available-for-sale financial asset has been recognised in comprehensive income and there is objective evidence that the asset is impaired. the cumulative loss is reclassified from equity to the income statement. This amount is calculated as the difference between the acquisition cost and the current fair value. less any previously recognised impairment. Any impairment losses recognised in the income statement in relation to these assets are reversed against equity rather than through profit and loss. Any increase in the fair value subsequent to this impairment is recognised as a valuation adjustment in the consolidated statement of comprehensive income. At the end of each reporting period the Group assesses whether there is objective evidence of impairment. Objective evidence of impairment exists when there is a significant or prolonged decline in the listed price of an investment below its cost. To determine whether this is the case. the Group examines the historical listed prices of its securities and how long they have been trading below cost. In view of recent recommendations from the ESMA and CNMV. the Group has adjusted its policy for recognising impairment of available-for-sale financial assets. It has defined the criteria that constitute objective evidence of impairment. considering that the impairment of listed securities will be calculated on the sole basis of the share price. even when this is not considered representative of how the fair value has evolved or the expected impact on the Group s future cash flows Financial liabilities For measurement purposes. financial liabilities are classified into the following categories: a) Debts and payables The financial liabilities classified in this category. which includes trade and other payables. are initially recognised at cost. which is the same as their fair value. less any transaction costs incurred. These liabilities are subsequently measured at amortised cost using the effective interest method. Any difference between the amount received (net of transaction costs) and the amortised cost is recognised in profit or loss. The Group has contracted reverse factoring facilities with various financial institutions to manage payments to suppliers. Trade payables settled under the management of financial institutions are recognised under trade and other payables until they are settled or repaid or have expired. When debt is refinanced. the Group assesses whether the changes made in the new agreement are sufficiently important to recognise the effects as if it were a cancellation and. simultaneously. a new loan. 109
111 Consolidated Annual Accounts b) Financial liabilities at fair value through profit or loss This category includes the Group s derivative financial instruments. except for financial guarantee contracts or designated hedging instruments. These are recognised at fair value. Changes in fair value are recognised in profit or loss Transfers between categories of financial instruments The Group reclassifies non-derivative financial assets to other categories when they are not held for the purpose of sale or repurchase in the near term. Financial assets that meet the definition of loans and receivables are reclassified if they are not designated to this category on initial recognition. provided that the Group has the intention and ability to hold the assets in the near term or until maturity. On reclassification. financial assets are recognised at fair value. which is their prospective new cost or amortised cost Hedge accounting Derivative financial instruments are initially recognised at cost of acquisition. which coincides with their fair value. They are subsequently recognised at fair value. Derivative financial instruments that do not qualify for hedge accounting are classified and measured as financial assets and financial liabilities at fair value through profit or loss. Where derivatives qualify for recognition as cash flow hedges. they are treated as such and the recognition of any resultant gain or loss depends on the nature of the hedged item. The effective part of the gain or loss on the financial instrument is initially recognised in the consolidated statement of comprehensive income and later transferred to the income statement in the year or years in which the hedged transaction affects profit or loss. The Group only undertakes cash flow hedges. At the inception of the hedge the Group formally designates and documents the hedging relationships and the objective and strategy for undertaking the hedges. Hedge accounting is only applicable when the hedge is expected to be highly effective at the inception of the hedge and in subsequent years in achieving offsetting changes in cash flows attributable to the hedged risk. throughout the period for which the hedge was designated (prospective analysis) and the actual effectiveness. which can be reliably measured. is within a range of 80%-125% (retrospective analysis). The Group prospectively discontinues the accounting of fair value hedges when the hedging instrument expires or is sold or the hedge no longer meets the criteria for hedge accounting. In these cases. the cumulative gain or loss on the hedging instrument that has been recognised in equity is recorded in profit or loss Inventories Inventories are initially measured at cost of acquisition or production. Valuation allowances are made and recognised as an expense in the income statement when the cost of acquisition or production of inventories exceeds the net realisable value. Any write-downs that reduce inventories to their net realisable value are reversed. up to the cost of the inventories. if the circumstances that gave rise to the write-downs cease to exist. Cost (of acquisition or production) is determined as follows: Raw materials and other supplies are measured using the weighted average cost formula. Finished goods and work in progress are measured at the weighted average cost of raw and other materials consumed. incorporating applicable direct and indirect labour costs and general manufacturing costs based on the higher of normal operating capacity or actual production. The cost of underutilisation of operating capacity is not included in the value of finished goods and work in progress. The Group uses the same cost model for all inventories of the same nature and with a similar use. 110
112 For finished goods and work in progress. net realisable value is the estimated selling price in the ordinary course of business. less estimated costs of completion and any applicable variable costs to sell. Raw materials and other supplies are not written down below cost if the finished goods in which they will be incorporated are expected to be sold at or above cost of production Cash and cash equivalents Cash and cash equivalents include cash balances. demand deposits with banks and other short-term. highly liquid investments that are readily convertible to known amounts of cash and which are subject to an insignificant risk of changes in value. The Group classifies interest paid and received as cash flows from operating activities. while dividends received are considered cash flows from investing activities and dividends paid are classified as cash flows from financing activities Deferred income Deferred income includes government grants. Government grants are recognised in the balance sheet at the original amount awarded when there is reasonable assurance that they will be received and that the Group will comply with the conditions attached. The only grants received by the Group relate to acquisitions of property. plant and equipment and intangible assets. These are included under non-current liabilities and taken to the income statement on a straight-line basis over the expected lives of the assets for which the grants were received. except for those relating to CO2 emission allowances. which are taken to income in line with the recognition of the corresponding greenhouse gas emission expense Employee benefits Certain Group companies have assumed the following long-term commitments with their employees: a) Defined contribution plans A defined contribution plan is a pension plan under which the Group pays fixed contributions into a separate entity. and will have no legal or constructive obligation to pay further contributions if the fund does not hold sufficient assets to pay all employee benefits relating to employee service in the current and prior periods. Certain Group companies pay contributions to pension and life insurance plans on a mandatory. contractual or voluntary basis. The Group has no further payment obligations once these contributions have been paid. The contributions are recognised as an employee benefit expense when they are accrued. Prepaid contributions are recognised as an asset to the extent that a cash refund or a reduction in future payments is available. Provisions are not made for defined contribution plans as they do not generate future obligations for the Group. b) Defined benefit plans A defined benefit plan is a commitment entered into by a company with its employees to remunerate services rendered. These benefits have been established based on local legislation in certain countries. contracts signed to that effect. or as included in collective bargaining agreements prevailing in certain Group companies. Accrued commitments are calculated as the present value of the accumulated benefits accrued by personnel until the reporting date. using actuarial assumptions. Calculations are made by independent experts. Group companies record the corresponding provisions to cover these commitments. Existing obligations may be classified as: Pension plans: certain Group companies have commitments with some employees reaching retirement age. Early retirement benefits: certain Group companies have undertaken to pay benefits to employees who opt to take early retirement. Supplements: these plans are obligations agreed with certain Group employees to supplement their remuneration on retirement. Other post-employment commitments: certain Group companies provide healthcare benefits to their retired employees. Entitlement to these benefits is usually conditional on the employee remaining in service up to retirement age and the completion of a minimum service period. The expected costs of these benefits are accrued over the period of employment using an accounting methodology similar to that for defined benefit pension plans. 111
113 Consolidated Annual Accounts The Group complies with obligations regarding the externalisation of these commitments in countries where this is applicable. Defined benefit liabilities recognised in the consolidated statement of financial position reflect the present value of defined benefit obligations at the reporting date. minus the fair value at that date of plan assets. The Group recognises changes in the actuarial value of obligations in comprehensive income. An independent expert calculates the actuarial value of commitments using the Projected Unit Credit method. When plan assets include insurance policies that exactly match the amount and timing of some or all of the benefits payable under the plan. the fair value of the insurance policies is considered equal to the present value of the related obligations. c) Share-based payments The Group does not have any share-based payment plans Provisions The Group recognises provisions when: (i) It has a present obligation (legal or constructive) as a result of past events; (ii) It is more likely than not that an outflow of resources will be required to settle the obligation; and (iii) A reliable estimate can be made of the amount of the obligation. The amount recognised as a provision is the best estimate of the expenditure required to settle the present obligation at the end of the reporting period. taking into account all risks and uncertainties surrounding the amount to be recognised as a provision and. where the time value of money is material. the financial effect of discounting provided that the expenditure to be made each period can be reliably estimated Classification of assets and liabilities as current and non-current The Group classifies assets and liabilities in the consolidated balance sheet as current and non-current. Current assets and liabilities are those that the Group expects to settle. realise. sell or consume in its normal operating cycle. those that are held primarily for the purpose of trading. those that it expects to realise or settle within twelve months after the reporting date or those that are cash or cash equivalents Income taxes The income tax expense for the year comprises both current and deferred tax. Current tax is the estimated tax payable on the consolidated taxable income or tax loss for the year using tax rates enacted at the reporting date and any adjustment to tax payable in respect of previous years. Deferred tax is calculated using the balance sheet method. based on temporary differences that arise between the tax base of assets and liabilities and their carrying amounts in the consolidated annual accounts. Deferred tax is measured using the tax rates (and laws) enacted or substantively enacted at the reporting date that are expected to apply to the period when the asset is realised or the liability settled. The effect on deferred taxes of a change in the tax rate is recognised in the income statement. except to the extent that it relates to items previously charged or credited to the consolidated statement of comprehensive income. Deferred tax liabilities are always recognised. Deferred tax assets in respect of temporary differences are recognised only to the extent that it is probable that future taxable income will be available against which the asset can be utilised. 112
114 Deferred tax assets are reduced when it is no longer considered probable that sufficient future taxable income will be generated or there are no deferred tax liabilities against which the assets can be offset. Reductions are reversed if there is renewed expectation that sufficient taxable income will be available against which the derecognised balance can be utilised. The Group only offsets deferred tax assets and liabilities if it has a legally enforceable right to do so. the assets and liabilities correspond to the same taxation authority and it plans to realise current tax assets or settle current tax liabilities on a net basis. Deferred tax assets and liabilities are recognised in the consolidated balance sheet under non-current assets or liabilities. irrespective of the expected date of recovery or settlement. Certain companies in the consolidated Group have reserves that could be subject to taxation if they were distributed. These consolidated financial statements reflect the tax effect that would arise in the event that these reserves were distributed in the foreseeable future. The Parent has filed consolidated tax returns since As agreed by the shareholders at an annual general meeting held on 28 May Acerinox. S.A. and the Spanish-domiciled subsidiaries form part of a consolidated tax group on an indefinite basis. with the exception of Metalinox Bilbao. S.A. and Inoxidables de Euskadi. S.A.. which file individual tax returns. At 31 December 2013 and 2012 the consolidated tax group comprises Acerinox. S.A.. Acerinox Europa. S.A.U. Roldán. S.A.. Inoxfil. S.A.. Inoxcenter. S.L. and Inoxcenter Canarias. S.A.U Income a) Sales of goods and rendering of services Revenue from the sale of goods is recognised in the income statement when all the significant risks and rewards of ownership have been transferred to the buyer. No revenue is recognised if there are significant uncertainties regarding the recovery of the consideration due. associated costs or the possible return of goods. Revenue is recognised net of taxes. rebates and discounts that the Group considers probable at the date the revenue is recognised. and after the elimination of intra-group sales. b) Income from lease agreements Lease income from investment property is recognised in the income statement on a straight-line basis over the term of the lease. c) Income from dividends Dividend income is recognised when the Group s right to receive it is established Environmental issues The Group takes measures to prevent. reduce or repair the damage caused to the environment by its activities. Expenses derived from environmental activities are recognised as other operating expenses in the period in which they are incurred. Nonetheless. the Group recognises environmental provisions. where applicable. by applying the general criteria described in note Property. plant and equipment acquired by the Group for long-term use to minimise the environmental impact of its activity and protect and improve the environment. including the reduction and elimination of future pollution from the Group s activities. are recognised as assets applying the measurement. presentation and disclosure criteria described in note
115 Consolidated Annual Accounts NOTE 3 FINANCIAL RISK MANAGEMENT The Group s activities are exposed to various financial risks: market risk (currency risk. interest rate risk and price risk). credit risk. and liquidity risk. The Group aims to minimise the potential adverse effect on its profits through the use of derivative financial instruments. where appropriate to the risks. and insurance. Note includes a detailed analysis of the Group s derivatives at year end. The Group does not acquire financial instruments for speculative purposes. 3.1 Market risk Market risk arises from variations in market prices due to exchange rate or interest rate fluctuations or changes in the price of raw and other materials. which can affect a company s results and equity as well as the values of its assets and liabilities Currency risk The Group operates internationally and is therefore exposed to foreign currency risk. especially with regard to the US Dollar. Currency risk arises from commercial transactions. financing and investment operations. and from translation of financial statements in functional currencies other than the Group s presentation currency. In order to control currency risk associated with commercial transactions. Group entities use forward currency sale or purchase contracts negotiated with the Group s Treasury Department in accordance with policies approved by management. The Group uses derivatives such as cross-currency swaps to control currency risk in financing operations. Not all of the exchange rate insurance contracts entered into by the Group qualify for cash flow hedge accounting as established in note Those contracts that do not comply with these criteria have been accounted for as financial instruments at fair value through profit or loss. The fair value of forward exchange contracts is their market price at the reporting date. which is the present value of the difference between the insured price and the forward price for each contract. The Group hedges most of its financial and commercial transactions in currencies other than the functional currency of each country. At the beginning of each month and subject to fortnightly review. each company considers its loans in non-local currency. trade receivables and supplier balances in foreign currency. the sales and purchases in foreign currency forecast for the period and exchange rate insurance coverage. The Group may take commercial and finance transactions as a whole into account when evaluating its total exposure for the purpose of hedging transactions in foreign currency. Note includes details of the financial instruments arranged by the Group to hedge this type of risk at 31 December 2013 and Finally. the Group is exposed to currency risk as a result of the translation to Euros of the individual financial statements of companies whose functional currency differs from the Group s presentation currency. particularly the US Dollar and the South African Rand. In 2013 the Group company Bahru Stainless adopted the US Dollar as its functional currency because. as a result of completing the first stage of its investments. this company began to invoice a much larger volume of materials in US Dollars. Bahru s exports are expected to exceed local sales significantly. so this is the currency in which most commercial transactions have been denominated and settled. Purchases of raw materials for the manufacturing process are also made in US Dollars. The Group s exposure to the Malaysian Ringgit has been greatly reduced as a result of this change in functional currency. The sensitivity to changes in the value of these currencies against the Euro. with other variables remaining constant. is as follows: (In thousands of Euros) Profit and loss Equity 10% appreciation 10% depreciation 10% appreciation 10% depreciation 31 December 2013 USD 9,486-7, , ,174 ZAR -1,499 1,227 22,430-18, December 2012 USD 11,356-9, ,115-90,093 ZAR -2,040 1,669 30,967-25,336 MYR -3,744 3,063 47,106-38,
116 3.1.2 Interest rate risk The Group s financing comes from various countries and in different currencies (mainly the Euro and the South African Rand). with a range of maturity dates and mostly referenced to variable interest rates. The Group s financial liabilities and financial assets are exposed to fluctuations in interest rates. To manage this risk interest rate. curves are analysed regularly and derivatives are used. These derivatives take the form of interest rate swaps and qualify for recognition as cash flow hedging instruments. The fair value of interest rate swaps is the estimated amount that the Group would receive or pay to terminate the swap at the reporting date. taking into account interest rates at that date and the credit risk associated with the swap counterparties. The Group has therefore hedged the interest rate risk on the majority of its non-current loans in recent years. Note includes details of the financial instruments arranged by the Group to hedge this type of risk at 31 December 2013 and Risk premiums and credit spreads have increased since 2009 as a result of the international financial crisis and money market turbulence. The Group has minimised exposure to this risk by ensuring that its non-current borrowings exceed its current borrowings. On respect to the Group sensitivity to interest rates. had interest rates been 100 basis points higher. with all other variables remaining constant. the Group s consolidated profit after tax would have been Euros 2.55 million lower due to a higher finance cost on variable-rate debt (in the loss would have been increased by Euros 2.86 million). The effect on the Group s equity of higher interest rates across the entire curve would have been a net increase of Euros million (Euros million in 2012). as the ensuing increases in the values of its interest rate hedging derivatives held at the reporting date would more than compensate for the higher borrowing costs Price risk The Group is exposed to three types of price fluctuation risk: 1. Risk due to changes in the listed price of securities held in listed companies The risk of price fluctuations in listed securities relates to the shares held by the Group in Nisshin Steel. which is traded on the Tokyo Stock Exchange. The Group has not hedged this risk with derivative financial instruments. Note provides details of the impact of the fluctuations in listed securities during the year. 2. Risk due to regional crises Acerinox s global presence. with factories in four geographical regions and commercial activities on five continents. reduces its exposure to any specific area. 3. Risk of changes in prices of raw materials The stainless steel market is characterised by healthy demand. which has grown at an annual rate of approximately 6% for over 50 years. Exceptionally. the market shrank by 11.8% in because of the worldwide economic recession. but recovered with growth of 26.4% in The aforementioned annual growth rate is therefore expected to prevail in the medium term. The stainless steel market grew by 6.8% in 2013 (5.4% in 2012). Stainless steel is required for all industrial applications and used in all sectors. which guarantees that this growth will be sustained in the coming years. With end consumption stable. the fact that this market is largely controlled by independent wholesalers leads to volatility in apparent consumption (in line with fluctuations in the price of nickel on the London Metal Exchange). To counter the risk derived from the fact that independent wholesalers. which follow an inventory stockpiling/realisation policy. control the majority of the market. the Acerinox Group has developed a sales network that enables it to supply end customers on a continuous basis. by means of warehouses and service centres through which the Group s production is channelled. This policy has enabled the Group to achieve a significant market share among end customers and. therefore. stabilise sales and reduce this risk. The recent investments made in the Pinto (Madrid) service centre and the newly opened sales branches in Russia. Thailand. the Philippines. Taiwan. Indonesia and Vietnam are examples of this strategy. Maintaining sufficient inventory levels in warehouses entails the risk that these inventories might be recognised above their market price. The Group alleviates this risk by maintaining strict control over inventory levels. At the end of the level of inventories was close to the level targeted by the Group. 115
117 Consolidated Annual Accounts To counter the risk posed by the volatility of raw materials. 90% of Group sales (i.e. all sales made in Europe. America and South Africa) are naturally hedged by applying an alloy surcharge. which allows the Group to pass on any nickel price fluctuations occurring on the London Metal Exchange during production of the order. as well as Euro/US Dollar exchange rate fluctuations. to customers. With this hedge. a fluctuation of 10% in the price of nickel on the London Metal Exchange would alter the Group s gross margin on sales by less than 1%. The valuation of raw materials. work in progress and finished goods at average cost helps to reduce the volatility of costs and. consequently. to decrease the impact of nickel price fluctuations on margins. The Group s policy of taking firm orders naturally hedges the costs of raw materials. as all accepted orders have a known risk. The Group has also made considerable efforts to reduce its production cycle to two weeks. Keeping strict control over inventories and adapting production to market circumstances helps to alleviate the risk of raw material price fluctuations. However. fluctuations in the price of nickel on the London Metal Exchange drive apparent consumption. as wholesalers expectations of this price determine whether they choose to realise or stockpile inventories. The main risk continues to be the volatility of apparent consumption which. as an external factor. is beyond the Group s control. Efficient management of the solutions described for the other risks makes it possible to reduce exposure to this risk as far as possible. 3.2 Credit risk Credit risk is defined as the possible loss that could be incurred through failure of a customer or debtor to meet contractual obligations. The Group s exposure to credit risk is determined by the individual characteristics of each customer and. where applicable. by the risk corresponding to the country where the customer operates. Due to the diversity of its customers and the countries in which it operates. credit risk is not concentrated in any individual customer. sector or geographical region. The Group hedges its commercial and political risks either through credit insurance companies. or through letters of credit and bank guarantees extended by banks of recognised solvency located in countries with low financial risk. Credit insurance covers between 85% and 90% of declared commercial risks. depending on the country in which the customer is located and the insurance company. and 90% of political risks. The Group s main credit insurer has an A3 credit rating from Standard & Poor s and an A excellent rating from A.M. Best. In 2013 payouts of Euros 5,825 thousand have been collected under the credit insurance policy (Euros 2,868 thousand in 2012). A risk committee is responsible for monitoring the Group s credit risk policy. Where required. the committee also performs an individual analysis of customers credit worthiness. establishing credit limits and payment terms. New customers are analysed with the insurance company before they are offered the Group s general payment terms. Payment in cash is required from customers who do not meet the necessary credit conditions. The Group has long-standing commercial relationships with many of its customers. In the event of any delays in payment. the Group monitors future deliveries and payment terms closely. reviews credit limits and improves existing measures as appropriate. Where permitted under local legislation in the country in which the customer operates. retention of title clauses are used to secure recovery of goods in the event of default on payment. On occasion the Group also uses other financial instruments to reduce credit risk. such as factoring operations. The Group derecognises factored assets when the risks and rewards of these assets have been substantially transferred. The Group makes valuation adjustments to trade receivables where necessary to mitigate the risk of bad debts or provide for past-due balances. or when circumstances indicate that collection is doubtful. Details of movement in impairment of trade receivables are provided in note At 31 December consolidated trade receivables amount to Euros 376,618 thousand (Euros 386,259 thousand in 2012). Revenues for 2013 total Euros 3,966,278 thousand (Euros 4,554,688 thousand in 2012). Credit risk insurance has been contracted for 49% of consolidated net sales. (48% in 2012). Cash conditions exist for 3% (4% in 2012). Confirmed letters of credit are used to hedge credit risk in 3% of consolidated net sales (3% in 2012). 40% of consolidated net sales (40% in 2012) are domestic sales by North American Stainless Inc. with a collection period of under 30 days. 116
118 The ageing analysis of past-due receivables is as follows: (In thousands of Euros) Less than 30 days 52,008 46, days 6,371 12, days 3,417 3,962 Over 90 days 14,915 16,744 TOTAL 76,711 79,290 The Group has made provisions for Euros 10,219 thousand (Euros 7,650 thousand in 2012). Most of the Group s past-due receivables are insured and generally reflect customary delays in trading activity. Over 87% of the above past-due debt has been collected at the date of authorising the consolidated annual accounts for issue (76% in 2012). In view of the default rates in all sectors. we consider that the above figures are highly satisfactory and vindicate the Group s credit risk policy. Impairment of the unhedged portion of financial assets considered to be uncollectible has been determined individually. Details of these amounts are provided in note 9. Any advances to suppliers of property. plant and equipment or intangible assets are hedged through bank guarantees issued by the supplier and confirmed by banks of recognised solvency. 3.3 Liquidity risk In an economic climate as complex as today s. with liquidity scarce and increasingly expensive. the Group ensures its solvency and flexibility through long-term loans and financing facilities for amounts exceeding the quantities required at any time. The Group s cash is centrally managed to optimise resources. The Group s net debt is primarily concentrated within the Parent (more than 85% of total borrowings at year end). Based on its cash flow estimates and considering its investment plans. the Group has sufficient funding to meet its commitments. and maintains sufficient balances available for drawdown from credit facilities to cover liquidity risk. In 2013 and 2012 no payment defaults occurred on the principal of loans or loan interest on the Group s financing. At year end the Group has been granted current and non-current financing totalling Euros 1,804 million and facilities for factoring without recourse for Euros 480 million. Euros 1,159 million has been drawn at 31 December In the Group had current and non-current financing facilities of Euros 2,070 million and facilities for factoring without recourse of Euros 475 million. Total drawdowns amounted to Euros 1,164 million. At 31 December 2013 cash and cash equivalents amount to Euros 630 million (Euros 583 million in 2012). The high levels of bank borrowings to guarantee mid-term liquidity along with the ongoing effort to reduce working capital continues to provoke high levels of cash in the Group. The cash balances are available and there is no restriction on their use. Cash deposits are always short-term never exceeding three months and with banks of recognised solvency. In April Acerinox Europa. S.A.U. and several trading subsidiaries of Acerinox. S.A. entered into a Euros 370 million agreement with a syndicate of banks for the factoring of invoices to end customers in several European countries. The syndicate is led by Banesto and the other participants are Banco Español de Crédito S.A.. Santander de Factoring y Confirming S.A. E.F.C.. Banca March S.A.. Caixabank S.A.. Popular de Factoring S.A. E.F.C.. Bankinter S.A.. Banco Sabadell S.A. and Banco Marocaine Du Commerce Exterieur Internacional S.A. 117
119 Consolidated Annual Accounts On 11 January Acerinox. S.A. and North American Stainless entered into a US Dollars 482 million syndicated loan agreement aimed at reducing the Group s exposure to European banks. lowering its average borrowing costs and extending the terms to maturity of its debt. The lead lending banks are BB&T Capital Markets. JP Morgan Chase Bank. Wells Fargo Bank and Fifth Third Bank. whilst the ten participating US banks are BB&T. JP Morgan Chase Bank. Wells Fargo Bank. Fifth Third Bank. Regions Bank. US Bank National Association. BMO Harris Bank. The Huntington National Bank. PNC Bank National Association and The Bank of Kentucky. An analysis of the Group s payment obligations at the 2013 close is as follows: (In thousands of Euros) Amount at 31/12/2013 Future cash flow maturities Less than 6 months 6 to 12 months 1 to 2 years 2 to 5 years More than 5 years Non-current payables 750, ,965-8,408-8, , ,265-13,680 Current payables 408, , , ,733 Suppliers and other payables 960, , ,889 FINANCIAL DERIVATIVES Hedged using interest rate swaps -39,947-40,947-8,082-7,248-11,033-14, Export exchange rate insurance 3, , ,247 Import exchange rate insurance 18, , ,821 TOTAL 2,101,642-1,454, , , , ,909-13,620 Payables to Public Entities are not included in suppliers and other payables. Future cash flow maturities include the loan principal plus interest based on contractual interest rates at year end. This caption does not include approved investments not capitalised under property. plant and equipment under construction at the reporting date. 3.4 Capital management The aims of the capital management policy are: to safeguard the Company s capacity for sustained growth to provide appropriate returns to shareholders to maintain an optimum capital structure The Company manages its capital structure and makes adjustments based on changes in economic circumstances. To maintain and adjust its capital structure. it can adopt different policies relating to the payment of dividends. the reimbursement of the share premium. share buybacks. self-financing of investments. non-current borrowings. etc. Capital structure is controlled using different ratios. such as the net financial debt/ebitda ratio. understood to be the period necessary for the resources generated by the Company to cover the level of debt; or the gearing ratio. i.e. the relationship between net financial debt and equity of the Company. 118
120 Net financial debt is taken to be the sum of current and non-current loans and borrowings. less cash and cash equivalents. EBITDA reflects operating profit or loss before amortisation. depreciation and changes in trade provisions. Net financial debt is 2.3 times EBITDA. 21% down on the 2012 ratio (2.9x) and far below the limit of 3.5 stipulated in the covenants linked to the majority of the Group s borrowings. The Group s gearing ratio is 34.1%. similar to the ten-year low of 33.9% recorded in Despite the ongoing economic crisis and its effects on the global iron and steel sector. the volume of investments is in line with the Group s strategic plan. The Group did not base its strategic plan on opportunistic criteria. but rather on industrial rationale and long-term efficiency. meaning that. its financial position permitting. the Group can keep to this plan even when the economic climate is unfavourable. The total remuneration offered to shareholders was Euros 0.45 in 2013 (as in 2012). Nevertheless. at the ordinary annual general meeting held on 5 June the shareholders approved a scrip dividend also known as a flexible dividend in which Acerinox shareholders were able to choose between cash or new shares. Through this decision the Company abided by its traditional policy of maintaining shareholder remuneration. On 17 July 2013, 7,841,631 new Acerinox shares. created as a result of shareholders representing 56% of the Company s share capital opting to receive their dividend in the form of shares. began trading. As a result. Acerinox. S.A. s share capital now amounts to Euros 64,286, represented by 257,146,177 shares. Major efforts made by the Acerinox Group to reduce working capital financing requirements have led to a reduction in net financial debt. which. at Euros million. is 9% down on the prior year (Euros million) and at a low for the last eleven years. The Acerinox Group is not subject to strict capital management criteria. Considering its financial stability. it can adopt the most appropriate solution at any given moment to enable optimum management. 3.5 Insurance As the Group s three integrated flat product production plants and three long product production plants are located in different regions. an accident would not affect more than one-third of total production. This guarantees the continuity of the business. while adequate co-ordination between the remaining factories reduces the consequences of material damage to any of the facilities. Sufficient coverage has been contracted for the Group s factories through material damage and loss-of-profit insurance policies. which account for over 32.70% of the Acerinox Group s insurance expenditure. Assets under construction are covered by both the insurance policies taken out by the respective suppliers and a global building and assembly policy. The Group also has a captive reinsurance company based in Luxembourg. Inox Re. which manages these risks by assuming a part as selfinsurance and accessing the reinsurance market directly. The Group has also arranged general liability. environmental. credit. transport. and group life and accident insurance policies to reduce its exposure to these different risks. 119
121 Consolidated Annual Accounts NOTE 4 ACCOUNTING ESTIMATES AND JUDGEMENTS Accounting estimates and judgements are assessed constantly and based on past experience and other factors. including expectations of future events that are considered reasonable. The Group makes estimates and judgements related to future events. The resulting accounting estimates could differ from actual results. The main estimates are as follows: a) Impairment of goodwill and other non-financial assets The Group tests goodwill. property. plant and equipment and other intangible assets annually for impairment. in accordance with the accounting policy described in note 2.8. For goodwill and property. plant and equipment. recoverable amounts of cash-generating units have been determined based on calculations of value in use. These calculations are made using reasonable assumptions based on past returns and future production and market development expectations. Notes 7.2 and 8.1 include details of the analyses conducted by the Group in 2013 and b) Useful lives of plant and equipment Group management determines the estimated useful lives and corresponding depreciation charges for its plant and equipment based on expert valuations. These could alter significantly as a result of technical innovations. variations in plant activity levels. etc. Management regularly reviews the depreciation charge and adjusts it when estimated useful lives are different from those previously applied. fully depreciating or derecognising technically obsolete or non-strategic assets which have been abandoned or sold. c) Fair value of derivatives or other financial instruments The fair value of financial instruments that are not traded in active markets is determined by using valuation techniques mainly based on market conditions existing at each reporting date. and provided that financial information is available to carry out this valuation. Note contains additional information on the classification of financial instruments using a fair value hierarchy as established in IFRS 7. d) Provisions As mentioned in note provisions recognised in the consolidated balance sheet reflect the best estimate at the reporting date of the amount expected to be required to settle a liability. provided that the materialisation of this outflow of resources is considered probable. Changes in foreseen circumstances could cause these estimates to vary and would be reviewed if necessary. Although these estimates and judgements are based on the best available information. future events may require changes to these estimates in subsequent years. Any change in accounting estimates would be recognised prospectively in the corresponding consolidated income statement. in accordance with IAS 8. e) Net realisable value As mentioned in note the Group estimates the net realisable value of its inventories to recognise any impairment required. Expected selling prices of inventories less costs to sell are considered when calculating net realisable value. f) Recoverability of available tax loss carryforwards and deductions The Group regularly evaluates its available tax credits through five-year projections of profit and loss approved by management. to conclude as to whether they will be recoverable in the future. Details of the basis on which the Group assesses the recoverability of tax credits are provided in note17.2. The judgements and accounting estimates used by the Group in 2013 and 2012 are the same as in prior years. 120
122 NOTE 5 SCOPE OF CONSOLIDATION 5.1 Subsidiaries and associates At 31 December in addition to Acerinox. S.A.. the Acerinox consolidated group includes 40 fully consolidated subsidiaries and one equity-accounted associate. In 2012 the Group included 40 fully consolidated subsidiaries and one equity-accounted associate. Investments in subsidiaries and associates in 2013 are as follows: FULLY CONSOLIDATED COMPANIES COUNTRY INTEREST 2013 COST (in % thousands of OWNERSHIP Euros) COMPANY HOLDING INVESTMENT AUDITORS ACERINOX (SCHWEIZ) A.G. Mellingen. Switzerland % ACERINOX S.A KPMG ACERINOX ARGENTINA S.A. Buenos Aires. Argentina % ACERINOX S.A 13 10% INOXIDABLES EUSKADI. S.A. Chinen. Morbelli y asociados ACERINOX AUSTRALASIA PTY. LTD. Sydney. Australia % ACERINOX S.A KPMG ACERINOX BENELUX S.A. - N.V. Brussels. Belgium % ACERINOX S.A KPMG ACERINOX BRASIL. LTDA Sao Paulo. Brazil % ACERINOX S.A ACERINOX COLOMBIA S.A.S Bogota. Colombia % ACERINOX S.A ACERINOX DEUTSCHLAND GMBH Langenfeld. Germany 45, % ACERINOX S.A KPMG ACERINOX EUROPA. S.A.U Madrid. Spain 341, % ACERINOX S.A KPMG ACERINOX FRANCE S.A.S Paris. France 18, % ACERINOX S.A % INOXIDABLES EUSKADI KPMG ACERINOX INDIA PTE LTD Mumbai. India % ACERINOX S.A Mehta Chokshi & Shah ACERINOX ITALIA S.R.L. Milan. Italy 99, % ACERINOX S.A KPMG ACERINOX MALAYSIA SDN. BHD Johor. Malaysia 4, % ACERINOX S.C. MALAYSIA SDN. BHD KPMG ACERINOX MIDDLE EAST DMCC Dubai. United Arab Emirates % ACERINOX S.A ACERINOX METAL SANAYII VE TICARET L.S. Gumussuyu/Beyoglu. Turkey % ACERINOX S.A % INOXIDABLES EUSKADI ACERINOX NORWAY A.S Oslo. Norway % ACERINOX S.A KPMG ACERINOX PACIFIC LTD. Wanchai. Hong Kong 10, % ACERINOX S.A KPMG CORPORACIÓN ACERINOX PERU S.A.C Lima. Peru % ACERINOX S.A ACERINOX POLSKA. SP Z.O.O ACERINOX RUSSIA LLC Warsaw. Poland Saint Petersburg. Russia 25, % ACERINOX S.A % INOXIDABLES EUSKADI % ACERINOX S.A % ACERINOX SCANDINAVIA AB ACERINOX SCANDINAVIA AB Malmo. Sweden 31, % ACERINOX S.A KPMG ACERINOX S.C. MALAYSIA SDN. BHD Johor. Malaysia 37, % ACERINOX S.A KPMG ACERINOX SHANGAI CO.. LTD. Shanghai. China 6, % ACERINOX S.A KPMG Shanghai Shenzhou Dalong ACERINOX SOUTH EAST ASIA PTE.LTD. Singapore. Singapore % ACERINOX S.A KPMG ACERINOX U.K. LTD. Birmingham. United Kingdom 28, % ACERINOX S.A KPMG ACEROL LTDA. Maia. Portugal 13, % ACERINOX S.A KPMG BAHRU STAINLESS. SDN. BHD Johor. Malaysia 171,769 67% ACERINOX S.A KPMG COLUMBUS STAINLESS (PTY) LTD. Middelburg. South Africa 279,615 76% ACERINOX S.A KPMG D.A. ACERINOX CHILE. S.A. Santiago de Chile. Chile 7, % ACERINOX S.A KPMG INOX RE. S.A. Luxembourg 1, % ACERINOX S.A KPMG INOXCENTER CANARIAS. S.A. Telde (Gran Canaria). Spain % INOXCENTER KPMG INOXCENTER. S.L. Barcelona. Spain 8, % ACERINOX S.A KPMG INOXFIL S.A. Igualada (Barcelona). Spain 6, % ROLDAN S.A KPMG INOXIDABLES DE EUSKADI S.A. Vitoria. Spain 2, % ACERINOX EUROPA. S.A.U KPMG 121
123 Consolidated Annual Accounts FULLY CONSOLIDATED COMPANIES COUNTRY INTEREST 2013 COST (in % thousands of OWNERSHIP Euros) COMPANY HOLDING INVESTMENT AUDITORS INOXPLATE. LTDA. Maia. Portugal 14, % ACEROL PORTUGAL KPMG METALINOX BILBAO. S.A. Galdácano (Vizcaya). Spain 2, % ACERINOX S.A KPMG NORTH AMERICAN STAINLESS INC. Kentucky. U.S.A. 545, % ACERINOX S.A KPMG NORTH AMERICAN STAINLESS CANADA. INC NORTH AMERICAN STAINLESS MEXICO S.A. DE C.V. NORTH AMERICAN STAINLESS FINANCIAL INVESTMENTS LTD. Canada 28, % Apodaca (N.L.). Mexico 18, % NORTH AMERICAN STAINLESS INC. NORTH AMERICAN STAINLESS INC. KPMG KPMG Kentucky. U.S.A % ACERINOX S.A KPMG ROLDAN S.A. Ponferrada. Spain 17, % ACERINOX S.A KPMG 2013 ASSOCIATES COUNTRY COST (in thousands of Euros) INTEREST % OWNERSHIP COMPANY HOLDING INVESTMENT BETINOKS PASLANMAZ ÇELIK A.S. Turkey % ACERINOX. S.A. The activities of the Group companies are as follows: Acerinox. S.A.: the holding company of the Acerinox Group since the 2011 spin-off of its industrial and commercial lines of business. The Company also renders legal. accounting and advisory services to all the Group companies and carries out financing activities within the Group. Acerinox Europa. S.A.U.: manufacture and marketing of flat stainless steel products. North American Stainless. Inc.: manufacture and sale of flat and long stainless steel products. Columbus Stainless (PTY). Ltd.: manufacture and sale of flat stainless steel products. Bahru Stainless. Sdn. Bhd: manufacture and sale of flat stainless steel products. Roldán. S.A.: manufacture and sale of long stainless steel products. Inoxfil. S.A.: manufacture and sale of stainless steel wire. Inox Re. S.A.: captive reinsurance company. North American Stainless Financial Investment. Inc.: rendering of foreign trade advisory services. Remaining companies: sale of stainless steel products. 122
124 Investments in subsidiaries and associates in 2012 are as follows: FULLY CONSOLIDATED COMPANIES COUNTRY INTEREST 2012 COST (in % thousands of OWNERSHIP Euros) COMPANY HOLDING INVESTMENT AUDITORS ACERINOX (SCHWEIZ) A.G. Mellingen, Switzerland % ACERINOX, S.A. KPMG ACERINOX ARGENTINA, S.A. Buenos Aires, Argentina % ACERINOX, S.A. 10% INOXIDABLES EUSKADI, S.A. Chinen, Morbelli y Asociados ACERINOX AUSTRALASIA PTY. LTD. Sydney, Australia % ACERINOX S.A KPMG ACERINOX BENELUX S.A. - N.V. Brussels, Belgium % ACERINOX S.A KPMG ACERINOX DO BRASIL, LTDA Sao Paulo, Brazil % ACERINOX S.A ACERINOX COLOMBIA S.A.S Bogotá D.C. - Colombia % ACERINOX S.A ACERINOX DEUTSCHLAND GMBH Langenfeld, Germany 45, % ACERINOX S.A KPMG ACERINOX EUROPA, S.A.U Madrid, Spain 341, % ACERINOX S.A KPMG ACERINOX FRANCE S.A.S Paris, France 18, % ACERINOX S.A % INOXIDABLES EUSKADI KPMG ACERINOX INDIA PTE LTD Mumbai, India % ACERINOX S.A Mehta Chokshi & Shah ACERINOX ITALIA S.R.L. Milan, Italy 99, % ACERINOX S.A KPMG ACERINOX MALAYSIA SDN. BHD Johor, Malaysia 4, % ACERINOX S.A KPMG ACERINOX METAL SANAYII VE TICARET L.S. Gumussuyu/Beyoglu, Turkey % ACERINOX S.A % INOXIDABLES EUSKADI ACERINOX NORWAY A.S Oslo, Norway % ACERINOX S.A KPMG ACERINOX PACIFIC LTD. Wanchai, Hong Kong 10, % ACERINOX S.A KPMG CORPORACIÓN ACERINOX PERU S.A.C Lima, Peru % ACERINOX S.A ACERINOX POLSKA, SP Z.O.O ACERINOX RUSSIA LLC Warsaw, Poland Saint Petersburg, Russia 25, % ACERINOX S.A % INOXIDABLES EUSKADI % ACERINOX S.A % ACERINOX SCANDINAVIA AB ACERINOX SCANDINAVIA AB Malmo, Sweden 31, % ACERINOX S.A KPMG ACERINOX S.C. MALAYSIA SDN. BHD Johor, Malaysia % ACERINOX S.A KPMG ACERINOX SHANGAI CO., LTD. Shanghai, China 6, % ACERINOX S.A KPMG Shanghai Shenzhou Dalong ACERINOX SOUTH EAST ASIA PTE.LTD. Singapore, Singapore % ACERINOX S.A KPMG ACERINOX U.K, LTD. Birmingham, United Kingdom 28, % ACERINOX S.A KPMG ACEROL LTDA. Maia, Portugal 13, % ACERINOX S.A KPMG BAHRU STAINLESS, SDN. BHD Johor, Malaysia 171,769 67% ACERINOX S.A KPMG COLUMBUS STAINLESS (PTY) LTD. Middelburg, South Africa 279,615 76% ACERINOX S.A KPMG D.A. ACERINOX CHILE, S.A. Santiago de Chile, Chile 7, % ACERINOX S.A KPMG INOX RE, S.A. Luxembourg 1, % ACERINOX S.A KPMG INOXCENTER CANARIAS, S.A.U. Telde (Gran Canaria), Spain % INOXCENTER KPMG INOXCENTER, S.L. Barcelona, Spain 8, % ACERINOX S.A KPMG INOXFIL S.A. Igualada (Barcelona), Spain 6, % ROLDAN S.A KPMG INOXIDABLES DE EUSKADI S.A. Vitoria, Spain 2, % ACERINOX EUROPA, S.A.U INOXPLATE, LTDA. Maia, Portugal 14, % ACEROL PORTUGAL KPMG METALINOX BILBAO, S.A. Galdácano (Vizcaya), Spain 2, % ACERINOX S.A KPMG NEWTECINVEST AG Zug - Suiza 4, % ACERINOX S.A KPMG NORTH AMERICAN STAINLESS INC. Kentucky, U.S.A. 545, % ACERINOX S.A KPMG NORTH AMERICAN STAINLESS CANADA, INC NORTH AMERICAN STAINLESS MEXICO S.A. DE C.V. NORTH AMERICAN STAINLESS FINANCIAL INVESTMENTS LTD. Canada 28, % Apodaca (N.L.), Mexico 18, % NORTH AMERICAN STAINLESS INC. NORTH AMERICAN STAINLESS INC. KPMG KPMG KPMG Kentucky, U.S.A % ACERINOX S.A KPMG ROLDAN S.A. Ponferrada, Spain 17, % ACERINOX S.A KPMG 123
125 Consolidated Annual Accounts 2012 ASSOCIATES COUNTRY COST (in thousands of Euros) INTEREST % OWNERSHIP COMPANY HOLDING INVESTMENT BETINOKS PASLANMAZ ÇELIK A.S. Turkey % ACERINOX S.A 5.2 Changes in the consolidated Group Changes in the consolidated Group during 2013 are as follows: Acerinox Middle East DMCC On 27 October 2013 the Group incorporated a new trading company in the United Arab Emirates. This company s statutory activity is the marketing of stainless steel products manufactured by any of the Group s factories in the Middle East. Acerinox, S.A. owns 100% of its share capital, represented by 50 shares of UAE Dirhams 50,000 par value each. Paid-in capital totals UAE Dirhams 50 thousand (Euros 10 thousand). Acerinox Malaysia, Sdn. Bhd. The board of directors of Acerinox, S.A. agreed to restructure the Group s commercial network in South-East Asia by integrating its Malaysiabased sales branches (Acerinox S.C. Malaysia and Acerinox Malaysia Sdn. Bhd.). Accordingly, Acerinox, S.A. sold its ownership interest in Acerinox Malaysia, Sdn. to Acerinox S.C. Malaysia Bhd. for the carrying amount of the investment, and injected capital into the resulting company through a share capital increase for the Malaysian Ringgit equivalent of Euros 37 million. On 9 April 2013, Acerinox S.C. Malaysia assumed the assets and liabilities of Acerinox Malaysia Sdn. Bhd. This restructuring has had no impact on the Group s consolidated financial statements since it is an internal restructuring of Group companies. Newtecinvest, A.G. Acerinox, S.A. s solely owned Swiss subsidiary, Newtecinvest, A.G., was dissolved in September Acerinox, S.A. s interest in this company amounted to Euros 4,455 thousand and Newtecinvest s capital and reserves totalled Euros 8,981 thousand at 31 December The Group has recorded a gain of Euros 2.3 million on the repatriation of this company s capital and reserves. Changes in the consolidated group during 2012 were as follows: Corporación Acerinox Perú, S.A.C. Acerinox, S.A. incorporated its Peruvian subsidiary (Corporación Acerinox Perú, S.A.C) by converting its former branch in Peru into a company. This company s statutory activity is the marketing of stainless steel products manufactured by any of the Group s six factories. Its share capital is represented by 120,001 shares of PEN 1 par value each. Acerinox Russia, L.L.C. On 27 December 2012 a new Group company was incorporated in Russia. Acerinox, S.A. holds a 95% interest in this company, while the remaining 5% is held by Acerinox Scandinavia, A.B., also an Acerinox Group company. Share capital amounted to RUB 4,170 thousand. This company s statutory activity is the marketing of stainless steel products manufactured by any of the Group s six factories. 5.3 Capital increases In 2013 the Group company Acerinox S.C. Malaysia s share capital was increased by Malaysian Ringgit 146 million (equivalent to Euros 37 million). Acerinox, S.A. owns 100% of this company s share capital, which has been increased by 146 million shares of Ringgit 1 par value each, bringing the total number of shares to 156 million. The purpose of this increase was to capitalise the company following its recent acquisition of the Group company Acerinox Malasia, Sdn. Bhd. No share capital reductions were carried out in any Group companies. No share capital increases or reductions were carried out in any Group companies in Acerinox, S.A. extended a five-year participating loan to the Group company Inoxcenter, S.L. Pursuant to article 20 of Royal Decree-Law 7/1996 of 7 June 1996, this loan is considered as equity for the purposes of a share capital reduction and for liquidation of companies provided for under commercial law. The loan is to be repaid in full upon maturity. However, the borrower has the option of making full or partial early repayment at any time during the term of the loan. Each early repayment will increase equity by the same amount. 124
126 NOTE 6 SEGMENT REPORTING The Group is organised internally by operating segments, as described below, which are its strategic business units. The strategic business units have different products and services and are managed separately. Group management reviews internal reports for each unit at least monthly. The operating segments presented by the Group, associated with the types of products it sells, are as follows: Flat stainless steel products: slabs, flats, coils, plates, sheets, circles and flat bars. Long stainless steel products: bars, angles, wires and wire rod. Other: other stainless steel products not included in the previous segments. The unallocated segment reflects the activities of the holding company and activities that cannot be allocated to specific operating segments. Segment results, assets and liabilities include all items directly or indirectly attributable to a segment. No significant assets are shared between segments and, considering the importance of flat stainless steel products, any assets that could be attributed to both segments are assigned to the flat segment. Inter-segment sales prices are established in accordance with market commercial terms and conditions governing non-related third parties. A segment s performance is measured by its net pre-tax profit. The Group considers this information to be the most relevant in evaluating a segment against other comparable segments in the sector. 125
127 Consolidated Annual Accounts 6.1 Operating segments Segment results for the year ended 31 December 2013 are as follows: (In thousands of Euros) 2013 Flat product Long product Other Unallocated Adjustments Total Income statement Revenue 3,598, ,625 9,759 5, ,415 4,018,405 Inter-segment sales -161,017-11, ,415 0 Total revenue 3,437, ,227 9,759 5, ,018,405 Gross operating profit 185,213 50, , ,265 Amortisation and depreciation -119,981-14, ,981 Impairment losses Finance income 3, , ,509 Finance costs -27, ,369-38, ,664 Exchange gains/losses , ,051 Impairment of financial instruments Profit/loss before income tax 39,927 35,750 1,974-44, ,180 Income tax -24,621-12, , ,595 Consolidated profit/loss for the year 15,306 23,435 1,386-30, ,585 Attributable to: Non-controlling interests -12, ,483 Net profit/loss attributable to the Group 27,704 23,456 1,450-30, ,068 Balance sheet Segment assets 3,214, ,797 14, , ,990,970 Equity-accounted investees Unallocated assets Total consolidated assets 3,214, ,797 14, , ,990,970 Segment liabilities 1,299,859 50,705 16,907 1,070,274 2,437,745 Unallocated liabilities 0 Total consolidated liabilities (excluding equity) 1,299,859 50,705 16,907 1,070, ,437,745 Property, plant and equipment 1,739, ,036 5,347 11, ,892,810 Investments in property, plant and equipment and intangible assets 121,605 3, ,
128 2012 figures are as follows: (In thousands of Euros) 2012 Flat product Long product Other Unallocated Adjustments Total Income statement Revenue 4,131, ,561 13,387 6, ,111 4,589,592 Inter-segment sales -196,878-18, ,111 0 Total revenue 3,934, ,328 13,387 6, ,589,592 Gross operating profit 160,020 44, , ,714 Amortisation and depreciation -132,965-14, ,976 Impairment losses Share in profit/loss for the year of equity-accounted investees Finance income 2, , ,141 Finance costs -45, ,141-23, ,860 Exchange gains/losses -1, ,714 Impairment of financial instruments , ,932 Profit/loss before income tax -17,945 29,554 1,908-37, ,691 Income tax -14,101-9, , ,885 Consolidated profit/loss for the year -32,046 19,709 1,350-24, ,576 Attributable to: Non-controlling interests 13, ,795 Net profit/loss attributable to the Group -18,444 19,723 1,529-24, ,781 Balance sheet Segment assets 3,554, ,065 21, , ,215,592 Equity-accounted investees Unallocated assets Total consolidated assets 3,554, ,065 21, , ,215,634 Segment liabilities 1,339,221 40,070 20,869 1,102, ,502,620 Unallocated liabilities Total consolidated liabilities (excluding equity) 1,339,221 40,070 20,869 1,102, ,502,620 Property, plant and equipment 1,850, , , ,019,609 Investments in property, plant and equipment and intangible assets 197,273 11, ,147 There are no significant balances that have not been reflected in cash flows other than amortisation and depreciation. 127
129 Consolidated Annual Accounts 6.2 Geographical segments The flat and long stainless steel product segments are managed at worldwide level. Revenue from geographical segments is presented on the basis of customer location. Segment assets are determined by geographical location. Data relating to geographical segments in 2013 is presented below: (In thousands of Euros) 2013 Spain Rest of Europe Americas Africa Asia Other Total Revenue by destination of goods 344,368 1,119,416 1,941, , ,196 15,213 3,966,278 Segment assets by origin 1,114, ,020 1,386, , , ,990,970 Property, plant and equipment at origin 291,384 82, , , , ,892,810 Investments in property, plant and equipment and intangible assets at origin 42, ,541 15,951 59, , figures are as follows: (In thousands of Euros) 2012 Spain Rest of Europe Americas Africa Asia Other Total Revenue by destination of goods 366,193 1,328,533 2,229, , ,590 20,413 4,554,688 Segment assets by origin 994, ,483 1,515, , , ,215,634 Property, plant and equipment at origin 286,507 89, , , , ,019,609 Investments in property, plant and equipment and intangible assets at origin 42, ,622 7, , ,148 The Group sells its products in several countries spanning five continents. The following countries accounted for more than 5% of total consolidated sales in 2013 or 2012: the United States, 41.12% (40.75% in 2012); Spain, 8.33% (8.04% in 2012); Germany, 7.37% (6.99% in 2012); and South Africa, 5.61% (6.34% in 2012). No single transaction with an external customer exceeds 10% of the Group s consolidated revenues for 2013 or
130 NOTE 7 INTANGIBLE ASSETS Details of the main intangible assets and movement therein are shown below: (In thousands of Euros) COST Emission allowances Industrial property Computer software and other SUBTOTAL Goodwill Balance at 31 December ,546 24,312 22,679 55,537 69,124 Acquisitions 1, ,118 Transfers Disposals -2, ,624 Translation differences Balance at 31 December ,908 24,312 22,609 54,829 69,124 Acquisitions 1, ,308 Transfers Disposals -1, ,886 Translation differences Balance at 31 December ,680 24,312 23,195 55,187 69,124 ACCUMULATED AMORTISATION AND IMPAIRMENT LOSSES Emission allowances Industrial property Computer software and other SUBTOTAL Goodwill Balance at 31 December ,257 24,275 20,800 48,332 0 Charge Reversal of impairment losses Disposals Translation differences Balance at 31 December ,561 24,308 20,995 47,864 0 Charge Impairment Transfers Disposals Translation differences Balance at 31 December ,835 24,310 21,397 48,542 0 CARRYING AMOUNT Emission allowances Industrial property Computer software and other SUBTOTAL Goodwill Cost at 31 December ,546 24,312 22,679 55,537 69,124 Accumulated amortisation and impairment losses -3,257-24,275-20,800-48,332 Carrying amount at 31 December , ,879 7,205 69,124 Cost at 31 December ,908 24,312 22,609 54,829 69,124 Accumulated amortisation and impairment losses -2,561-24,308-20,995-47,864 Carrying amount at 31 December , ,614 6,965 69,124 Cost at 31 December ,680 24,312 23,195 55,187 69,124 Accumulated amortisation and impairment losses -2,835-24,310-21,397-48,542 Carrying amount at 31 December , ,798 6,645 69,124 Amortisation for the year is shown under amortisation and depreciation in the income statement. Research and development cost directly recognised as expenses for the year and taken to the income statement amount to Euros 953 thousand (Euros 1,609 thousand in 2012). At 31 December 2013 the Group has entered into contracts to acquire intangible assets for Euros 6 thousand (Euros 32 thousand at 31 December 2012). 129
131 Consolidated Annual Accounts 7.1 Emission allowances On 15 November 2013 the Spanish Cabinet approved Acerinox Europa, S.A.U. s definitive allocation of free-of-charge greenhouse gas emission allowances for the period, 1,867,754 allowances in total, which are distributed by year as follows: , , , , , , , ,687 In 2013, C02 emissions were made requiring 198,874 allowances, which will be surrendered in 2014 (167,936 in 2012, surrendered in 2013). Therefore, as in 2012, it has not been necessary to acquire more allowances on the market. The Group has not sold its surplus allowances. Present conditions pose no significant risk of a shortfall in emission allowances for the period. Movement in emission allowances in 2013 and 2012 is as follows: Number of allowances Value (in thousands of Euros) Balance at 31/12/11 603,294 8,546 Allocation for the year 278,698 1,742 Disposals -167,502-2,380 Balance at 31/12/12 714,490 7,908 Allocation for the year 248,936 1,637 Disposals -167,936-1,865 Balance at 31/12/13 795,490 7,680 Disposals for the year are allowances surrendered for CO2 emissions in the prior year. This information has been audited and approved by an independent expert. At 31 December 2013 the emission allowances held have a fair value of Euros 4,846 thousand (Euros 5,347 thousand at 31 December 2012). In 2013 the Group has recognised impairment of Euros 274 thousand, reflecting the difference between the cost and the listed price of allowances not used at the reporting date. As explained in the corresponding accounting policy, this has no impact on the income statement. This impairment loss has been recognised in the income statement under other operating expenses. In 2012 the Group recognised income of Euros 696 thousand as a result of reversing impairment losses. The expense for the year in respect of CO2 emissions totals Euros 1,859 thousand in 2013 (Euros 1,875 thousand in 2012) and is included under other operating expenses. This is the value of the allowances surrendered in the year, equivalent to the market value of these allowances when allocated. The Group does not hold any futures contracts for the acquisition of emission allowances. No significant contingency exists in respect of fines over emissions. 7.2 Goodwill impairment testing At 31 December 2013, goodwill totals Euros 69 million and mainly relates to the acquisition of a controlling interest in Columbus Stainless, Ltd. in This goodwill has been allocated to the Columbus cash-generating unit (CGU), which manufactures and sells flat products only. The recoverable amount of a CGU is determined based on its value in use. These calculations are based on cash flow projections from the financial budgets approved by management over a period of five years. Cash flows beyond this five-year period are extrapolated using the estimated growth rates indicated below. The growth rate does not exceed the average long-term growth rate for the business in which the CGU operates. Forecast volumes of sales and production are based on the current capacities of existing machinery and equipment. Management determined budgeted gross margins based on past experience and forecast market performance. The weighted average growth rates are consistent with the forecasts included in industry reports. The discount rates used are pre-tax values and reflect specific risks related to the relevant segments. 130
132 Nevertheless, with economic cycles increasingly difficult to anticipate, particularly in the stainless steel markets, where visibility has diminished significantly over recent years, the projections for each year have reflected these circumstances, as well as management s best estimates. Key assumptions such as exchange rates and raw material prices are, therefore, extrapolated using highly conservative criteria, referring to the most recent market values at all times. The unfavourable circumstances and global economic crisis have led to delays in estimated recovery periods, which have been taken into account. Nevertheless, the Company is confident in the recovery of flows to perpetuity, mainly in terms of its use of production capacity and margins, while still applying prudent criteria to the growth rate (g): estimated growth rates for the country and industry have been used, even though average growth over recent years has been much greater (around 5.9%, as is mentioned further on). The key assumptions used to calculate value in use are as follows: Budgeted EBIT margin (*) 4.5% 4.2% Weighted average growth rate (**) 2.5% 2.5% Discount rate applied (***) 10.9% 10.5% (*) EBIT margin, considered equivalent to operating profit/loss (as a percentage of revenue) (**) Used to extrapolate cash flows beyond the budgeted period (***) Pre-tax discount rate applied The rise in interest rates on South African sovereign debt (ten-year swap on the South African Rand) is noteworthy in terms of calculating the discount rate applied (WACC or weighted average cost of capital). The rate used in 2013 was 7.1%, up on the 6.4% used in When calculating the terminal value, repayments are considered equal to investments and the change in working capital is calculated as the value of the last projected year, 2018, which is understood to be consistent in the long term, increased by the growth rate (g). The growth rate (g) remains constant at 2.5%. In 2013 the global stainless steel market continued to consolidate the historical market growth rate of 5.9% ( period). Nevertheless, in 2013 the South African market was 9% down on the record figure recorded in 2012 (+8.2%). This performance meant that the local manufacturer, Columbus Stainless Ltd, saw its turnover on this market reduced by 11.5% (+4.8% in 2012). In 2013 Columbus Stainless billed the Group s new Malaysian operation, Bahru Stainless, for close to 70,000 tonnes of black coil. Bahru Stainless will continue to receive materials in the years to come, as it develops and starts up new production lines. At the 2013 reporting date, two production stages (of four projected in total) have started operating in the Malaysian factory, with theoretical installed capacity of 400,000 tonnes. The Company s budgets reflect a gradual increase in sales to Bahru as the Malaysian factory achieves higher utilisation of its present installed production capacity. Other relevant key assumptions are the Euro-Rand exchange rate (14.566) and the price of raw materials (USD 15,000/MT). Both are extrapolated using highly conservative criteria, at all times referring to the most recent market values at the time of analysis. The impairment test performed at 31 December 2013 reveals that the recoverable amount of goodwill exceeds its carrying amount by Euros 158 million. The discount rate (WACC), the growth rate (g) and the budgeted EBIT margin are considered key assumptions in the impairment test. Following a sensitivity analysis entailing different scenarios, impairment of the recoverable amount would only occur by increasing the discount rate (WACC) by over 35% while simultaneously bringing the growth rate (g) down to zero. The EBIT margin would have to fall 35% to 2.9%, with the other two assumptions remaining constant, for impairment to occur. 131
133 Consolidated Annual Accounts NOTE 8 PROPERTY, PLANT AND EQUIPMENT Details of property, plant and equipment and movement in 2013 and 2012 are shown in the following table: (In thousands of Euros) COST Land and buildings Property, plant Technical Other property, and equipment installations plant and under and machinery equipment construction TOTAL Balance at 31 December ,203 2,890, , ,478 4,021,399 Additions 4,829 15,062 7, , ,030 Transfers 2,554 23,740 7,800-28,027 6,067 Disposals -1,549-7,370-10, ,868 Translation differences -3,595-50, ,905-50,019 Balance at 31 December ,442 2,871, , ,802 4,164,609 Additions 1,102 38,259 6,835 77, ,964 Transfers 12,466 48,546-7,205-54, Disposals -2,556-22,052-8, ,485 Translation differences -20, ,679-3,570-17, ,655 Balance at 31 December ,119 2,781, , ,918 4,058,659 ACCUMULATED DEPRECIATION AND IMPAIRMENT LOSSES Land and buildings Property, plant Technical Other property, and equipment installations plant and under and machinery equipment construction TOTAL Balance at 31 December ,672 1,704,229 86, ,035,679 Charge 14, ,864 7, ,291 Transfers Disposals ,967-3, ,821 Translation differences -1,751-24, ,149 Balance at 31 December ,475 1,797,223 90, ,145,000 Charge 14, ,688 7, ,153 Transfers 899-1, Disposals ,747-5, ,867 Translation differences -5,299-78,398-2, ,070 Balance at 31 December ,310 1,809,255 90, ,165,849 CARRYING AMOUNT Land and buildings Property, plant Technical Other property, and equipment installations plant and under and machinery equipment construction TOTAL Cost at 31 December ,203 2,890, , ,478 4,021,399 Accumulated depreciation and impairment losses -244,672-1,704,229-86, ,035,679 Carrying amount at 31 December ,531 1,186,582 39, ,478 1,985,720 Cost at 31 December ,442 2,871, , ,802 4,164,609 Accumulated depreciation and impairment losses -257,475-1,797,223-90, ,145,000 Carrying amount at 31 December ,967 1,074,329 39, ,802 2,019,609 Cost at 31 December ,119 2,781, , ,918 4,058,659 Accumulated depreciation and impairment losses -266,310-1,809,255-90, ,165,849 Carrying amount at 31 December , ,371 26, ,918 1,892,810 Depreciation for the year is shown under amortisation and depreciation in the income statement. 132
134 Property, plant and equipment under construction Details of the investments classified under this heading are as follows: (In thousands of Euros) Buildings 42, ,066 Technical installations and machinery 455, ,304 Other property, plant and equipment Advances 31 2,768 TOTAL 498, ,802 Of the total, Euros 494 million are assets under construction relating to the investment in the Malaysia plant (Euros 452 million in 2012). Assets located outside Spain Details of assets located outside Spain are as follows: (In thousands of Euros) Cost Accumulated depreciation Cost Accumulated depreciation Land and buildings 401, , , ,225 Technical installations and machinery 1,693, ,674 1,819, ,377 Other property, plant and equipment 38,372-32,876 50,395-33,388 Property, plant and equipment under construction 498, ,725 0 TOTAL 2,632,351-1,030,928 2,753,090-1,019,990 Changes in accounting estimates Estimated useful lives remained unchanged in 2013 and Guarantees At 31 December 2013 the Group company Columbus Stainless has pledged assets of Euros 27,276 thousand to secure loans and borrowings (Euros 35,560 thousand in 2012). Commitments At 31 December 2013 the Group has entered into contracts to purchase new equipment and facilities amounting to Euros 72,228 thousand (Euros 72,228 thousand at 31 December 2012), of which Euros 67,326 thousand are for investments in the new Malaysian plant. Capitalised borrowing costs Borrowing costs of Euros 9,569 thousand have been capitalised in 2013 (Euros 7,622 thousand in 2012). The capitalisation rate in 2013 was 3.89% (4.66% in 2012). Asset disposals A loss of Euros 514 thousand on the sale of property, plant and equipment or removal of assets from service has been recorded under other operating expenses in the 2013 income statement (Euros 545 thousand in 2012). The gain on the sale of property, plant and equipment or the removal of assets from service totals Euros 872 thousand and is recognised under other operating income in the 2013 income statement (Euros 712 thousand in 2012). 133
135 Consolidated Annual Accounts Environment Property, plant and equipment held to minimise the environmental impact of the Group s activities and to protect and improve the environment at 31 December 2013 and 2012 are as follows: (In thousands of Euros) Nature and use Gross value Accumulated depreciation Gross value Accumulated depreciation Water treatment 62,097-32,828 64,108-31,081 Acid neutralisation 24,817-15,143 25,614-14,556 Gas emission treatment 52,026-39,261 51,049-38,756 Automatic additions systems 7,568-4,841 7,736-4,683 Other items 138,053-83, ,692-68,807 Total 284, , , ,883 In 2013 and 2012 the Group received no grants for investment in infrastructure aimed at protecting the environment. The Group incurred environment-related ordinary expenses of Euros 92,491 thousand in 2013 (Euros 96,912 thousand in 2012), of which Euros 15,389 thousand relate to Acerinox Europa, S.A.U. (Euros 16,856 thousand in 2012) and Euros 53,032 thousand to North American Stainless, Inc. At 31 December 2013 and 2012 no significant contingencies exist relating to the protection and improvement of the environment and, accordingly, no provision has been made in this respect. Property, plant and equipment not used in ordinary activities The Group has no items of property, plant and equipment that are idle or not used in operating activities. Other information At 31 December 2013 and 2012 there are no litigation cases, seizures or similar measures that may affect items of property, plant or equipment. The Group companies have taken out insurance policies to cover the risk of damage to their property, plant and equipment. The coverage of these policies is considered sufficient. Investment property Acerinox, S.A. has leased certain floors of one of its buildings to third parties, thereby obtaining income of Euros 152 thousand (Euros 277 thousand in 2012). The associated operating expenses, including maintenance and repairs, amount to Euros 50 thousand (Euros 149 thousand in 2012). At the 2013 reporting date, an industrial bay in Pinto (Madrid) belonging to Acerinox Europa, S.A.U., which is earmarked for either lease or sale, has been reclassified to this category. The reclassified carrying amount totals Euros 378 thousand. No rental income has been generated on this property this year. At 31 December 2013 this investment property has a market value of Euros 8,140 thousand (Euros 4,140 thousand in 2012) and a carrying amount of Euros 5,944 thousand (Euros 3,163 thousand in 2012). The lease contract signed between Acerinox, S.A. and the lessee includes a yearly increase in line with the CPI and expires on 31 December
136 8.1 Impairment As established in IAS 36, and as mentioned in the accounting policies for the Acerinox Group s consolidated annual accounts (note 2.8), the value of an asset is impaired when its carrying amount exceeds its recoverable amount. The Group has assessed whether there is any indication that its assets may be impaired at the reporting date. The companies that have reported losses show indications of impairment, so the Group has estimated the recoverable amount of these assets. Property, plant and equipment and intangible assets represent 49% of the Group s assets. A breakdown of these figures by company shows that 93% of the Group s assets (both property, plant and equipment and intangibles) are located in the factories, with the remaining 7% held by its 36 other trading subsidiaries. SUBSIDIARIES % of property, plant and equipment ACERINOX EUROPA, S.A.U % ROLDAN, S.A. 1.57% INOXFIL, S.A. 0.26% NORTH AMERICAN STAINLESS INC % COLUMBUS STAINLESS PTY Ltd 12.67% BAHRU STAINLESS 28.73% Rest of subsidiaries 6.92% TOTAL % The majority of assets do not generate cash inflows independently, as the whole production process needs to be completed. Impairment has therefore not been estimated on an individual basis, but by allocating the assets to cash-generating units (IAS 36 paragraphs 22 and 66). In the case of plants, the smallest cash-generating units that can be considered encompass each plant as a whole. The recoverable amount of the items has been determined based on their value in use. Value in use was determined based on the estimated future cash flows the entity expects to obtain from the asset and the discount rate, understood to be the weighted average cost of capital (WACC). The following points were taken into consideration when calculating the discount rate: 1. The financing structure or gearing is not company-specific, but based on market participant assumptions. 2. The cost of debt is obtained using the applicable market risk-free rate plus a spread of 2%. 3. The risk-free rate is that applied to ten-year bonds. 4. The risk premium has been estimated at 5%. Future cash flows were estimated considering: a) Reasonable assumptions and management s best estimate of the economic conditions that will exist over the remaining useful life of the asset, based on information available at the analysis date. b) Five-year projections that reflect the adverse financial and macroeconomic circumstances and those of the stainless steel market itself, adapted to the operating environment of each CGU analysed. The different parameters used (expected growth, use of installed production capacity, prices, working capital items, etc.) are therefore projected considering historical figures, particular the last year closed, as well as targets set by management. With economic cycles increasingly difficult to anticipate, particularly in the stainless steel markets, where visibility has diminished significantly over recent years, the projections for each year have reflected these circumstances, as well as management s best estimates. Key assumptions such as exchange rates and raw material prices are, therefore, extrapolated using highly conservative criteria, referring to the most recent market values at all times. The unfavourable circumstances and global economic crisis have led to delays in estimated recovery periods, which have been taken into account. Nevertheless, the Company is confident in the recovery of flows to perpetuity, mainly in terms of its use of production capacity and margins, while still applying prudent criteria to the growth rate (g): estimated growth rates for the country and industry have been used, even though average growth over recent years has been much higher (around 5.9%, as is mentioned in the next section). c) Projections for years subsequent to the projected period are estimated by extrapolating previous projections using a growth rate between 1.8% and 2% (2.5% in the case of Columbus Stainless; see note 7.2). The historical growth rate for the global stainless steel market is 5.9% ( period). No impairment has been recognised on property, plant and equipment during the year, as the enterprise value, calculated applying the discounted free cash flow method, exceeds the carrying amount of the Group s operating assets. 135
137 Consolidated Annual Accounts NOTE 9 FINANCIAL INSTRUMENTS 9.1 General considerations A financial instrument is a contract that gives rise to a financial asset in one company and, simultaneously, a financial liability or an equity instrument in another company. The Group recognises a financial instrument in its balance sheet when it becomes party to the contract or legal transaction. 9.2 Categories of financial assets and financial liabilities At year end the Group s financial assets are as shown below: (In thousands of Euros) Classes Non-current financial instruments Current financial instruments Equity instruments Debt securities Loans, derivatives and other Equity instruments Debt securities Loans, derivatives and other Categories Loans and receivables 4,053 2, , ,525 Held-to-maturity investments Available-for-sale assets - At fair value 9,136 7,441 - At cost Assets at fair value through profit or loss - Held for trading 1,907 5,619 - Other Hedging derivatives TOTAL 9,149 7, ,091 2, , ,147 At year end the Group s financial liabilities are as shown below: (In thousands of Euros) Categories Classes Non-current financial instruments Loans and borrowings Bonds and other marketable securities Payables, derivatives and other Loans and borrowings Current financial instruments Bonds and other marketable securities Payables, derivatives and other Debts and payables 750, ,400 2,260 2, , , ,570 1,005,756 Liabilities at fair value through profit or loss - Held for trading 23,989 24,955 - Other Hedging derivatives 19,053 35,355 20,966 12,704 TOTAL 750, , ,313 37, , , ,024,525 1,043,
138 9.2.1 Determination of fair value Financial instruments measured at fair value are classified based on valuation inputs into the following levels: LEVEL 1: quoted prices in active markets LEVEL 2: observable market variables other than quoted prices LEVEL 3: variables not observable in the market Details at 31 December 2013 and 2012 are as follows: (In thousands of Euros) LEVEL 1 LEVEL 2 LEVEL 3 LEVEL 1 LEVEL 2 LEVEL 3 Available-for-sale financial assets 9,136 7,441 Financial derivatives (assets) 2,250 5,622 TOTAL 9,136 2, ,441 5,622 0 LEVEL 1 LEVEL 2 LEVEL 3 LEVEL 1 LEVEL 2 LEVEL 3 Financial derivatives (liabilities) 64,008 73,014 TOTAL 0 64, ,014 0 In the case of Level 2 financial instruments, the Group uses generally accepted valuation techniques that take into account spot and future exchange rates at the valuation date, forward interest rates, interest rate spreads and credit risk of both the Group and its counterparty, i.e. the financial institution with which it operates Trade and other receivables Details at 31 December are as follows: (In thousands of Euros) Trade receivables 376, ,259 Personnel Public entities 26,791 30,988 Other receivables 11,231 10,057 Prepayments 8,992 9,006 Impairment of bad debts -10,219-7,650 TOTAL 413, ,540 Impairment of bad debts corresponds entirely to trade receivables. Movements in this account are as follows: (In thousands of Euros) Initial balance 7,650 6,898 Charge 5,203 1,936 Application -1, Reversal -1, Translation differences Balance at 31 December 10,219 7,650 Impairment losses due to bad debts have been included under other operating expenses in the income statement. No interest was accrued on impaired financial assets in 2013 or No allowances have been made for bad debts with related parties in 2013 or Certain Group companies factored receivables without recourse through financial institutions during the year ended 31 December These receivables amounted to Euros 209,964 thousand (Euros 363,602 thousand in 2012) and represented 90% of total factored invoices. These amounts have been derecognised as they meet the conditions specified in IAS 39 regarding the transfer of risks and rewards. 137
139 Consolidated Annual Accounts Trade and other payables Details at 31 December 2013 and 2012 are as follows: (In thousands of Euros) Suppliers and trade payables 902, ,522 Personnel 21,168 14,005 Suppliers of fixed assets 17,461 82,763 Tax and Social Security 18,681 21,484 Other payables 9,826 14,857 Current provisions 10,055 10,125 TOTAL 979,570 1,005,756 In compliance with the disclosure requirements of the Spanish Accounting and Auditing Institute (ICAC) resolution of 29 December 2010, details of the Spanish Group companies payments to domestic suppliers, and of balances payable to these suppliers that exceed the maximum legal payment term, are as follows: (In thousands of Euros) Payments made and outstanding at 31/12/13 Payments made and outstanding at 31/12/12 Within maximum legal period (60 days) 220,704 44,67% 414,933 58,70% Other 273,338 55,33% 291,899 41,30% TOTAL PAYMENTS FOR THE YEAR 494, ,00% 706, ,00% Weighted average late payment days Late payments exceeding the maximum legal period at the reporting date 23,649 67, Loans and borrowings Details at 31 December 2013 and 2012 are as follows: (In thousands of Euros) Non-current Current Bank loans 750, , , ,807 Total debt 750, , , ,807 Details of the maturity of outstanding debt at 31 December 2013 are as follows: (In thousands of Euros) and subsequent years TOTAL Loans and borrowings 408, , , ,684 32,552 1,158,927 Total debt 408, , , ,684 32,552 1,158, figures are as follows: (In thousands of Euros) and subsequent years TOTAL Loans and borrowings 268, , , , ,775 1,164,207 Total debt 268, , , , ,775 1,164,
140 Bank debt by currency is as follows: (In thousands of Euros) Non-current loans Current loans EUR 466, , , ,079 USD 284, ,306 79,980 70,276 ZAR 14,919 57,477 34,069 GBP MYR 5,755 TOTAL 750, , , ,807 Details of bank debt by interest rate are as follows: (In thousands of Euros) Non-current loans Current loans Fixed 9, ,717 90,259 34,280 Variable 741, , , ,527 TOTAL 750, , , ,807 Borrowings at fixed interest rates reflect only loans originally arranged at fixed rates with credit institutions, and do not include borrowings for which interest rates have been fixed by contracting derivatives. As the majority of bank debt was extended at variable interest rates, its fair value is the same as its amortised cost. Nevertheless, the fair value of fixed-rate loans and borrowings is Euros 99,628 thousand at 31 December The fair value of these borrowings at 31 December 2012 was Euros 133,257 thousand. Variable interest rates on loans are reviewed at least once a year. At year end the Group s Euro-denominated borrowings, Euros 731 million in total, have an average cost, before hedging, of 2.68%, while the average pre-hedging cost of borrowings in US Dollars, amounting to US Dollars 505 million, is 1.87%. In 2012, the Group s Euro-denominated borrowings, Euros 684 million in total, bore an average cost of 2.42%, while the average cost of borrowings in US Dollars, amounting to US Dollars 554 million, was 1.89% and Rand-denominated loans, South African Rands 548 million in total, had an average cost of 8.41%. The Group has arranged interest rate swaps whereby it can exchange the variable interest rates on its borrowings for fixed interest rates, as described in note At 31 December 2013 accrued interest of Euros 4.1 million is payable (Euros 3.8 million in 2012). Borrowing costs calculated using the effective interest rate on loans at amortised cost amount to Euros 2,080 thousand (Euros 2,036 thousand in 2012). At 31 December 2013 the Group has credit facilities with financial institutions with a maximum available limit of Euros 1,804 million, of which Euros 1,159 million has been drawn down. In 2012 the maximum available limit was Euros 2,070 million, of which Euros 1,164 million had been drawn down. Certain Group companies have arranged reverse factoring facilities with financial institutions to manage payments to suppliers. Trade payables settled under the management of financial institutions are recognised under trade and other payables until they are settled or repaid or have expired. In 2013 the Acerinox Group entered into eleven new loan agreements with seven financial institutions (Banco Popular, Bankia, Bankinter, La Caixa, Kutxabank, Banco de Brasil and Banco Cooperativo) for a total of Euros 175 million. The Group has hedged the interest rates for four of these eleven new loans through interest rate swaps for a total amount of Euros 84 million. 139
141 Consolidated Annual Accounts In April 2013, Acerinox Europa, S.A.U. and several trading subsidiaries of Acerinox, S.A. entered into a Euros 370 million agreement with a syndicate of banks for the factoring of invoices to end customers in several European countries. The syndicate is led by Banesto and the other participants are Banco Español de Crédito S.A., Santander de Factoring y Confirming S.A. E.F.C., Banca March S.A., Caixabank S.A., Popular de Factoring S.A. E.F.C., Bankinter S.A., Banco Sabadell S.A. and Banco Marocaine Du Commerce Exterieur Internacional S.A. The following loans were obtained in 2012: - In December 2012 Acerinox S.A. entered into a one-year Euros 14 million loan agreement with Banco do Brazil. - In September 2012 Acerinox S.A. took out a Euros million loan with Deutsche Bank AG, Tokyo Branch and JBIC (Japan Bank for International Cooperation). This loan agreement specifies repayment in ten equal half-yearly instalments, with the final instalment due in July In June 2012 Acerinox S.A. reached an agreement with Banca March S.A. to extend the term of a Euros 30 million loan granted in December The new due date for this loan is June 2015, when repayment in full will be required. - In April 2012 Acerinox S.A. reached an agreement with Banesto to extend the term of a Euros 45 million loan granted in The new due date for this loan is March 2014 and the outstanding balance is repayable in full at that date. - In March 2012 Acerinox S.A. extended the term of a Euros 30 million loan arranged with Banco Santander, S.A. in May The original due date for this loan was May 2012 and the two entities reached an agreement to extend the term until May The loan is repayable in full at the due date. - In February 2012 Acerinox S.A. reached an agreement with Banco Sabadell to extend the term of a Euros 50 million loan granted in November The new due date for this loan is February 2015 and the outstanding balance is repayable in full at that date. - In January 2012 Acerinox S.A. entered into a contract with Caixabank S.A. for a Euros 20 million loan falling due in January This loan is repayable in full at the due date. - In January 2012, Acerinox, S.A. and North American Stainless signed a USD 482 million syndicated financing agreement with a group of ten US banks: BB&T, JP Morgan Chase Bank, Wells Fargo Bank, Fifth Third Bank, Regions Bank, US Bank National Association, BMO Harris Bank, The Huntington National Bank, PNC Bank National Association and The Bank of Kentucky. USD million of this financing was in the form of a loan extended to Acerinox S.A. This loan falls due on 17 February 2017 and is repayable in quarterly instalments. The remaining USD 482 million was received in the form of working capital financing facilities for North American Stainless, Inc. The guarantor of the loan extended to Acerinox, S.A. is North American Stainless, as the co-borrower. As the debt refinancing processes have not resulted in significant changes, the Group has not recognised the effects of the new agreement as if it were a cancellation and, simultaneously, a new loan. Non-current borrowings subject to covenants At the 2013 reporting date several loans are subject to covenants. These loans include the syndicated loan signed in the United States in 2012, the loans taken out in 2007 and 2008 from the ICO (Spain s Official Credit Institute) in both Euros and US Dollars, as well as borrowings covered by export credit agencies, namely those taken out with Banco Santander/OEKB, and Deutsche Bank/JBIC (Japan Bank for International Cooperation). The most significant covenants established in loan agreements relate to the net financial debt/ebitda ratio, the EBITDA/finance cost ratio and the net debt/capital and reserves ratio. Acerinox, S.A. is the borrower in all of the loans mentioned in the previous paragraph. At the reporting date the Group is in compliance with all of these covenants. At the 2013 reporting date Columbus holds two loans with the IFC (International Finance Corporation, from the World Bank Group) and with Standard Bank, both of which are subject to covenants linked to the ratio of current assets to current liabilities. Columbus is in breach of these covenants at the 2013 reporting date, but has classified the amounts outstanding on these loans as current. The amounts outstanding on these loans at year end totalled South African Rands 91.6 million and South African Rands 75 million, with final maturity in July 2014 in both cases. This breach of covenants is therefore irrelevant and will have no consequences in
142 9.2.5 Available-for-sale financial assets This category includes the investment held by Acerinox in the Japanese company Nisshin Steel Holding Co. Limited., which is listed on the Tokyo Stock Exchange with a share value of JPY 1,259 at 31 December 2013 (JPY 807 at the 2012 close). Acerinox holds 1,052,600 shares in this company, representing a percentage ownership of 0.96% (0.96% in 2012). As Nisshin Steel holds a 15.65% interest in Acerinox, this is a strategic investment that Acerinox has no intention of selling. Nisshin Steel not only holds a significant interest in the Company but is also Acerinox s partner in the new Malaysian venture Bahru Stainless, the Group s fourth flat stainless steel factory. The Japanese company Nisshin Steel Holding, Co. Limited was formed on 26 September 2012 when Nisshin Steel Co. Limited merged with Nippon Metal Industry. In this merger, one share in the new company was received for every ten shares held in Nisshin Steel Co. Limited. Acerinox has not purchased or sold any shares in Nisshin Steel Co. or Nisshin Steel Holding Co. Limited in In 2013 the Group recognised the Euros 1,695 thousand gain in the fair value of assets classified in this category in reserves. As explained in note 2.1, for comparison purposes, the loss of Euros 4,932 thousand generated as a result of changes in fair value in 2012 has been recognised in the income statement in these annual accounts Derivative financial instruments The Group classifies derivative financial instruments that do not qualify for hedge accounting as financial instruments at fair value through profit or loss. Those that qualify as hedging instruments are classified as hedging derivatives and are recognised applying the measurement criteria defined in note As detailed in note 3 in relation to market risk, in its activities the Group is essentially exposed to three types of risk: currency risk, interest rate risk and risk of changes in prices of raw materials. The Group uses derivative financial instruments to hedge its exposure to certain risks. Derivative financial instruments classified by category are as follows: (In thousands of Euros) Assets Liabilities Assets Liabilities Hedging derivatives , ,059 Derivatives at fair value through profit or loss 1,907 23,989 5,619 24,955 TOTAL 2,289 64,008 5,622 73,014 A breakdown of the Group s financial derivatives at 31 December 2013 and 2012 by type of hedged risk is as follows: (In thousands of Euros) Assets Liabilities Assets Liabilities Exchange rate insurance 2,231 24,003 5,622 25,001 Interest rate swaps 58 11,382 19,963 Cross-currency swaps 28,623 28,050 TOTAL 2,289 64,008 5,622 73,
143 Consolidated Annual Accounts Currency risk The Group operates in a large number of countries and bills customers in several currencies, and therefore uses financial instruments to hedge cash flow risks related to the settlement of balances in foreign currencies. The contracted operations mainly comprise forward sales and purchases in foreign currencies. Derivatives of this nature do not always qualify for consideration as effective cash flow hedging instruments in accordance with IAS 39. At 31 December 2013 the effect of measuring these derivatives at market value totals Euros 8 thousand and has been recognised under remeasurement of financial instruments to fair value in the income statement (Euros 35,197 thousand in 2012). At 31 December 2013 all exchange rate insurance contracts cover mainly receivables (assets) and payables (liabilities) and include both trade and financing transactions between Group companies. At 31 December 2013 the Group has exchange rate insurance cover of Euros -21,772 thousand (Euros -19,379 thousand in 2012), of which Euros 2,231 thousand is recognised under assets and Euros 24,003 thousand under liabilities. Only Euros 309 thousand of this amount qualifies for recognition as hedging instruments. In 2013, equity was reduced by Euros 128 thousand to reflect changes in the fair value of this insurance (reduced by Euros 133 thousand in 2012). All of the Group s forward currency purchase and sale contracts have a term of less than one year. At 31 December 2013 the Group has used currency transaction agreements for currency sales of Euros 205 million and currency purchases of Euros 545 million (sales of Euros 485 million and purchases of Euros 953 million at 31 December 2012). Details of these contracts by currency are as follows: (In thousands of Euros) Assets Liabilities Assets Liabilities USD 153, , ,132 1,168,460 EUR 23,601 41,787 11,611 42,051 GBP 28,734 10,066 SEK 60, ,904 PLZ 18,244 61,936 AUD 8,888 8,817 CHF NZD MYR 98,356 JPY 15,000 The reduction in derivatives in US Dollars is mainly due to Bahru s change of functional currency, as well as the arrangementof exchange rate insurance for financing transactions for net financial asset and liability positions in the same currency. The financial effect of discounting is equivalent to the difference between the carrying amount of the financial liability and the amount the entity would be contractually obliged to pay to discharge the liability on maturity. The Group has contracted derivatives to hedge exposures to currency and interest rate risks affecting some of its loans in currencies other than the functional currency. These instruments are described in the next note. 142
144 Interest rate risk At 31 December 2013 the Group has arranged the following interest rate swaps and cross-currency swaps, for those cases in which the loan currency differs from the company s functional currency for the majority of its current and non-current loans and borrowings: Notional value arranged Outstanding amount Maturity Variable to fixed rate EUR 35 million EUR 35 million 2014 Variable to fixed rate ZAR 300 million ZAR 75 million 2014 Variable to fixed rate EUR 50 million EUR 50 million 2015 Variable to fixed rate EUR 15 million EUR 15 million 2015 Variable to fixed rate EUR 30 million EUR 30 million 2015 Variable to fixed rate EUR 30 million EUR 30 million 2016 Variable to fixed rate EUR 15 million EUR 15 million 2016 Variable to fixed rate EUR 10 million EUR 10 million 2016 USD variable to EUR fixed rate USD million USD million 2017 Variable to fixed rate EUR 400 million EUR 224 million 2017 USD variable to USD fixed rate USD 63 million USD million 2017 USD variable to EUR fixed rate USD 160 million USD million 2018 Variable to fixed rate EUR million EUR million 2020 With effect from 1 January 2013, Bahru Stainless Sdn Bhd changed its functional currency from the Malaysian Ringgit, which it had used until that date, to the US Dollar (USD). As a result of this change in functional currency, on 2 January 2013 the Group cancelled the cross-currency swap that Bahru Stainless had taken out to hedge the currency and interest rate risk arising from the USD 63 million loan granted to Bahru Stainless Sdn Bhd by the Bank of Tokyo Labuan in The cost of cancelling this cross-currency swap was Malaysian Ringgit 13,7 million. Bahru Stainless then arranged a hedge fixing the interest rate on this USD-denominated loan at 2.03%, including the applicable credit spread. Moreover, in 2013, Acerinox, S.A. hedged the interest rates on certain bilateral bank loans with a nominal amount of Euros 70 million. The average interest rate applicable to USD-denominated loans for which an interest rate hedge has been arranged is 3.03%. The average rate for Euro-denominated loans with an associated interest rate hedge is 3.53%. The credit spread has been included in both cases. Details at 31 December 2012 were as follows: Notional value arranged Outstanding amount Maturity USD variable to EUR fixed rate USD million USD 347 million 2017 Variable to fixed rate EUR 10 million EUR 10 million 2013 Variable to fixed rate EUR 30 million EUR 30 million 2015 Variable to fixed rate EUR 35 million EUR 35 million 2014 Variable to fixed rate EUR 20 million EUR 20 million 2013 Variable to fixed rate EUR 50 million EUR 50 million 2015 Variable to fixed rate EUR 20 million EUR 20 million 2013 Variable to fixed rate ZAR 300 million ZAR 300 million 2014 Variable to fixed rate EUR million EUR million 2020 Variable to fixed rate EUR 400 million EUR 288 million 2017 USD variable to EUR fixed rate USD 160 million USD million 2018 USD variable to MYR fixed rate USD 63 million USD 63 million 2017 In terms of amount, the most significant of these hedges is the cross-currency swap arranged in January 2012 for USD million to hedge the syndicated loan extended to Acerinox S.A. Through this transaction the benchmark rate plus the initial spread for this loan was exchanged for a fixed rate of 2.56% in Euros. In 2012, Acerinox S.A. extended the term of two bilateral loans denominated in Euros and simultaneously renegotiated the interest rate hedge for these loans. The terms of these loans, for Euros 50 million and Euros 30 million, were extended with Banco Sabadell and Banca March, respectively. Both loans now fall due in
145 Consolidated Annual Accounts In 2012 the average interest rate applicable to USD-denominated loans for which an interest rate hedge had been arranged was 2.80%. The average rate for Euro-denominated loans with an associated interest rate hedge was 3.77%. The credit spread has been included in both cases. The fair values of both interest rate swaps and cross-currency swaps are based on the reporting-date market values of equivalent derivative instruments and total Euros -39,947 thousand (Euros -48,013 thousand at 31 December 2012). These amounts are recognised as follows: Current Non-current Current Non-current Other financial assets Other financial liabilities 20,952 19,053 12,658 35,355 TOTAL 20,972 19,091 12,658 35,355 At 31 December 2013 and 2012 the derivatives contracted qualify as cash flow hedges and therefore the unrealised loss of Euros 5,605 thousand on their measurement at fair value has been recorded in the consolidated statement of comprehensive income (loss of Euros 38,535 thousand in 2012). In 2013 an amount of Euros 21,804 thousand was transferred from the consolidated statement of comprehensive income to profit and loss for the year (Euros 23,759 thousand in 2012). The Group has documented the effectiveness of the derivatives contracted for the purpose of applying hedge accounting, as detailed in note Hedging transactions have been contracted for periods and amounts equivalent to the cash flows deriving from the associated loans. As a result of adapting its measurement method for interest rate hedges to the new IFRS 13, the Acerinox Group now considers both the credit risk of the financial institutions with which it operates and that of its own counterparty. These changes to the measurement of these derivatives have generated a gain of Euros 688 thousand. For this measurement, the Group used credit risk curves of the financial institutions with which the hedges have been arranged, while prudently using the credit risk curves of a sector company with a more favourable credit risk than its own Other information At 31 December 2013 and 2012: No financial assets have been pledged to secure liabilities or contingent liabilities No guarantees have been received for financial or non-financial assets. See also details of guarantees in note
146 NOTE 10 INVENTORIES Details at 31 December are as follows: (In thousands of Euros) Raw materials and other supplies 188, ,828 Work in progress 156, ,809 Finished goods 371, ,500 By-products, waste and recoverable materials 11,585 15,782 Advances TOTAL 729, ,483 The cost of goods sold is Euros 3,675 million in 2013 (Euros 4,282 million in 2012). In 2013 the Group wrote inventories down to net realisable value where this was lower than cost, with a total adjustment of Euros 11,294 thousand. The adjustment for 2012 amounted to Euros 16,973 thousand. At 31 December 2013 and 2012 no inventories have been pledged as collateral to guarantee repayment of debts or commitments undertaken with third parties. Commitments At 31 December 2013 the consolidated Group has commitments to purchase raw materials for Euros 116,225 thousand (Euros 126,807 thousand in 2012). Although no firm sales commitments exist at the reporting date, there are formal orders for which the Group does not foresee any circumstances that could prevent delivery by the agreed deadlines. The Group does not have any inventories with a cycle exceeding one year and therefore no borrowing costs have been capitalised. The Group companies have taken out insurance policies to cover the risk of damage to their inventories. The coverage of these policies is considered sufficient. NOTE 11 CASH AND CASH EQUIVALENTS Details at 31 December are as follows: (In thousands of Euros) Cash in hand and at banks 368, ,991 Current bank deposits 261, ,680 TOTAL 629, ,671 The effective interest rate on short-term bank deposits is 0.31% for the US Dollar, 2.60% for the Malaysian Ringgit, 4.95% for the South African Rand and 1.90% for the Euro (0.45% for the US Dollar, 2.45% for the Malaysian Ringgit, 4.95% for the South African Rand and 3.65% for the Euro in 2012). At the reporting date 97% of all deposits have been made by the Parent. In % of the total deposits were placed by Acerinox, S.A. and 58% by North American Stainless. Deposits are generally placed for between 45 days and one week with banks of recognised solvency. In 2012 the Group companies generally invested their cash surpluses in deposits with an average term of days. All cash and cash equivalents are held in current accounts or current deposits. There are no unavailable cash balances at year end. 145
147 Consolidated Annual Accounts NOTE 12 EQUITY 12.1 Subscribed capital and share premium Movement of issued and outstanding shares in 2013 and 2012 is as follows: (In thousands of Euros) Number of shares (thousand) Ordinary shares (thousand) Own shares (thousand) Share capital (thousands of Euros) Share premium (thousands of Euros) At 1 January , , , ,334 Distribution of share premium -24,931 At 31 December , , ,326 81,403 Capital increase 7,842 7,842 1,961 Acquisition of own shares -74 Disposal of own shares 74 At 31 December , , ,287 81,403 At the Annual General Meeting held on 5 June 2013, the shareholders agreed to increase share capital with a charge to reserves by issuing ordinary shares to be allocated to the shareholders free of charge. Following this meeting, the board of directors agreed to implement the share capital increase by means of a flexible dividend, known as a scrip dividend. Under the agreements reached by the shareholders and the board of directors, those parties who were shareholders of Acerinox at 23:59 hours on 17 June 2013 were to be allocated one right for each share held in the share capital increase. The rights were traded on the stock exchange from 18 June to 2 July 2013 and entitled the shareholders to choose between the following options: Sell the rights to the Company for Euros per right between 18 June and 26 June inclusive. Sell the rights on the stock exchange at the market price. Subscribe shares in Acerinox on the basis of one (1) new share for every eighteen (18) rights allocated to them on 17 June On 26 June 2013 the definitive amount of the dividend payable and the details of the share capital increase were established, as follows: 108,155,168 rights were sold to Acerinox for Euros per right, with the Company therefore paying out Euros 46,831, to its shareholders on 5 July ,841,631 new shares were issued in the share capital increase. These shares were admitted to trading on 17 July The share capital increase, through the issue of 7,841,631 new shares derived from the scrip dividend, was registered on 11 July. These new shares were admitted to trading on 17 July. On 5 July 2013 Acerinox, S.A. paid out Euros 46,831, to those shareholders who sold their rights to the Company. The Parent s share capital solely comprises ordinary shares. All these shares have the same rights and there are no statutory restrictions on their transferability. At 31 December 2013 share capital is represented by 257,146,177 ordinary shares (249,304,546 in 2012) with a par value of Euros 0.25 each, subscribed and fully paid. All the shares are listed on the Madrid and Barcelona stock exchanges. At 31 December 2013 and 2012 the only holders of 10% or more of the share capital of Acerinox, S.A. are Alba Participaciones, S.A. (23.50% in 2013 and 24.24% in 2012), Feynman Capital S.L./Morinvest, SICAV S.A. (Omega) (10.99% in 2013 and 11.59% in 2012) and Nisshin Steel Holding, Co. Ltd. (15.65% in 2013 and 15.30% in 2012). In 2013 there has been no distribution of the share premium. On 7 June 2012 the shareholders at the annual general meeting approved the reimbursement of capital contributions to Company shareholders with a charge of Euros 0.10 per share to the share premium, for a total amount of Euros 24,930 thousand. The share premium is subject to the same restrictions and may be used for the same purpose as the voluntary reserves of the Parent, including conversion into share capital. 146
148 12.2 Reserves a) Retained earnings Retained earnings include consolidated profit or loss for the year, reserves in fully consolidated companies and equity-accounted investees, as well as Parent reserves other than those mentioned below. Details of reserves by company are included in note There are no restrictions on the transfer of funds by any Group company in the form of dividends, except for the non-distributable reserves required by applicable legislation. At 31 December 2013 Euros 20,207 thousand of the Group s reserves and retained earnings are subject to restrictions (Euros 21,865 thousand at 31 December 2012). The legal reserve, which is included under retained earnings in the statement of changes in equity, has been appropriated in compliance with article 274 of the Spanish Companies Act, which requires that companies transfer 10% of profits for the year to a legal reserve until this reserve reaches an amount equal to 20% of share capital. At 31 December 2013 the Company has appropriated Euros 12,465 thousand, an amount equivalent to 19.39% of its share capital, to this reserve (Euros 12,465 thousand and 20% of share capital in 2012). The legal reserve is not distributable to shareholders and if it is used to offset losses, in the event that no other reserves are available, the reserve must be replenished with future profits. b) Property, plant and equipment revaluation reserve As permitted by Royal Decree-Law 7/1996 of 7 June 1996, containing urgent tax measures and initiatives aimed at boosting and deregulating the economy, the Company revalued its property, plant and equipment. The amount of the reserve reflects the revaluation gains, net of tax at 3%. The deadline for tax inspection was three years from 31 December Consequently, as no inspection took place, this balance can be used to offset losses or increase the Company s share capital. Once ten years had elapsed, Euros 16,592 thousand of the balance of this reserve was released to freely distributable reserves, representing the depreciated or transferred revaluation gains or revalued assets disposed of or otherwise derecognised. The balance of this account will only be distributable, either directly or indirectly, to the extent that gains have been realised. Article 9 of Law 16/2012 of 27 December 2012, enacting various tax measures aimed at consolidating public finances and boosting economic activity, provided the option for income tax payers to revalue their balance sheet items. The Group chose not to avail of this revaluation. c) Hedging reserve The hedging reserve includes cumulative net changes in the fair value of cash flow hedging instruments associated with highly probable future transactions. d) Adjustment of available-for-sale assets to fair value The Company has classified certain financial instruments as available for sale. In accordance with the applicable measurement criteria, any changes in the fair value of these instruments are recognised directly in the consolidated statement of comprehensive income until the financial asset is impaired or derecognised. Note includes a detailed description of instruments classified as available for sale and their value. 147
149 Consolidated Annual Accounts 12.3 Translation differences Details of movement in this account are included in the consolidated statement of changes in equity. Details of cumulative translation differences by company at the 2013 and 2012 reporting dates are as follows: (In thousands of Euros at 31 December 2013 and 2012) GROUP COMPANIES ACERINOX (SCHWEIZ) A.G. 1,002 1,064 ACERINOX ARGENTINA, S.A. -2,795-1,805 ACERINOX AUSTRALASIA PTY.LTD ACERINOX DO BRASIL, LTDA ACERINOX COLOMBIA S.A.S ACERINOX INDIA PTE LTD ACERINOX MALAYSIA SDN. BHD 1, ACERINOX METAL SANAYII VE TICARET L.S ACERINOX NORWAY A.S ACERINOX PACIFIC LTD. -2,240-2,570 ACERINOX POLSKA,SP Z.O.O ACERINOX RUSSIA LLC ACERINOX SCANDINAVIA AB -1, ACERINOX SOUTH EAST ASIA PTE.LTD ACERINOX SHANGAI CO., LTD. 1,629 1,772 ACERINOX U.K., LTD. -4,915-4,423 BAHRU STAINLESS, SDN. BHD 13,619 19,121 COLUMBUS STAINLESS INC. -128,500-84,162 CORPORACIÓN ACERINOX PERU S.A.C D.A. ACERINOX CHILE S.A ,012 NORTH AMERICAN STAINLESS CANADA, INC -2, NORTH AMERICAN STAINLESS MEXICO S.A. DE C.V NORTH AMERICAN STAINLESS FINANCIAL INVESTMENTS, LTD 1 1 NEWTECINVEST AG 0 2,227 NORTH AMERICAN STAINLESS INC. -80,640-20,430 ACERINOX S.C. MALAYSIA SDN. BHD. -2, SUBTOTAL -208,534-89,288 ASSOCIATES BETINOKS PASLANMAZ ÇELIK A.S SUBTOTAL TOTAL -208,583-89,
150 12.4 Details of reserves, profit/loss and non-controlling interests Details at 31 December 2013 and 2012 are as follows: (In thousands of Euros) ACERINOX (SCHWEIZ) A.G. 2, , ACERINOX ARGENTINA, S.A. 4, , ACERINOX AUSTRALASIA PTY. LTD ACERINOX BENELUX S.A. - N.V ACERINOX DO BRASIL, LTDA ACERINOX COLOMBIA S.A.S ACERINOX DEUTSCHLAND GMBH -21,632 1,360-22, ACERINOX EUROPA S.A.U -66,290-26,615-30,354-35,935 ACERINOX FRANCE S.A.S. -11,665 1,177-11, ACERINOX ITALIA S.R.L. -14, , ACERINOX INDIA PTE LTD ACERINOX MALAYSIA SDN. BHN -17, ,046-11,809 ACERINOX S.C. MALAYSIA SDN. BHD -17,538-1,632-11,572-5,966 ACERINOX METAL SANAYII VE TICARET L.S ACERINOX NORWAY A.S ACERINOX PACIFIC LTD. -15, , ACERINOX POLSKA, SP Z.O.O , ACERINOX RUSSIA LLC ACERINOX SCANDINAVIA AB -5,672 1,436-3,290-2,383 ACERINOX SHANGAI CO., LTD , ACERINOX SOUTH EAST ASIA PTE.LTD ACERINOX U.K., LTD ,092 ACEROL LTDA. -3, , Reserves Profit/loss Noncontrolling interests Reserves Profit/loss ACERINOX, S.A 711,022-17, ,018-21,770 Noncontrolling interests BAHRU STAINLESS, BDN. BHD -22,835-16,532 71,927-8,889-15,811 81,828 COLUMBUS STAINLESS (PTY) LTD. 68,753-13,826 43,740 88,068-18,945 62,094 CORPORACIÓN ACERINOX PERU S.A.C D.A. ACERINOX CHILE S.A. -1,930-1,309-1, INOX RE, S.A. 20,032 3,031 16,814 3,218 INOXCENTER CANARIAS S.A.U. 2, , INOXCENTER S.A. -21,197-2, ,409-6, INOXFIL S.A. 1,765-1, , INOXIDABLES DE EUSKADI S.A INOXPLATE, LTDA METALINOX BILBAO S.A. 17, , NORTH AMERICAN STAINLESS CANADA, INC 4,313 2,019 2,076 2,241 NORTH AMERICAN STAINLESS MEXICO S.A. DE C.V NORTH AMERICAN STAINLESS FINANCIAL INVESTMENTS LTD. -9,029 9, NEWTECINVEST AG 0 0 2, NORTH AMERICAN STAINLESS INC. 836,590 90, , ,911 ROLDAN S.A. 36,411-9, ,695-6, SUBTOTAL 1,478,134 22, ,180 1,536,077-21, ,525 ASSOCIATES BETINOKS PASLANMAZ ÇELIK A.S SUBTOTAL TOTAL 1,477,870 22, ,180 1,535,877-21, ,
151 Consolidated Annual Accounts 12.5 Distribution of profit/application of loss At the board meeting held on 18 December 2013, the directors resolved to postpone any decisions regarding distribution of profit until the annual general meeting of shareholders. At the board meeting held on 18 December 2012, directors resolved not to distribute an interim dividend for the year, in light of estimated losses for 2012, and to postpone any decisions regarding shareholder remuneration until the annual general meeting scheduled for 5 June. At their general meeting held on 5 June 2013, the shareholders agreed that the Parent s losses for 2012 were to be carried forward as prior years losses Earnings per share Basic earnings per share are calculated by dividing profit for the year attributable to equity holders of the Parent by the weighted average number of ordinary shares outstanding during the year, excluding own shares purchased and held by the Group. (In thousands of Euros) Profit/loss attributable to the Group 22,068-21,781 Weighted average number of ordinary shares outstanding 252,913, ,304,546 Earnings/loss per share (in Euros) 0,09-0,09 The weighted average number of shares has been calculated considering the shares outstanding both prior and subsequent to the capital increase and the number of days for which they had been outstanding. The Group has not issued any financial instruments that give access to capital or convertible debt and therefore diluted earnings per share are the same as basic earnings per share. NOTE 13 DEFERRED INCOME Movement in non-refundable government grants, which include emission allowances received free of charge (see note 2.6.d) and other capital grants, is as follows: (In thousands of Euros) Balance at 1 January 5,908 5,490 Grants awarded 2,294 3,075 Transfer to the income statement -3,368-2,659 Translation differences 0 2 Balance at 31 December 4,834 5,908 Deferred income primarily reflects grants received by Acerinox Europe for its research and development activities, and the balancing entry for emission allowances allocated free of charge under the National Allocation Plan and not been consumed during the year (see note 7). The Group considers that it has met or will meet all the conditions for receipt of these grants in the period stipulated and therefore no significant contingencies exist in connection with the grants obtained. 150
152 NOTE 14 PROVISIONS AND CONTINGENCIES Details of non-current provisions included in the balance sheets for 2013 and 2012 are as follows: (In thousands of Euros) Employee benefits 9,844 10,200 Other provisions 3,736 3,416 TOTAL 13,580 13, Employee benefits Defined contribution plans In accordance with legislation in force in their countries of operation, certain Group companies make contributions to pension plans managed by external institutions. An expense of Euros 7,010 thousand has been recognised for the year under personnel expenses in respect of such plans (Euros 8,569 thousand in 2012) Defined benefit plans Details of provisions for employee benefits by type of commitment are as follows: (In thousands of Euros) Pension plans 1,669 1,339 Early retirement benefits Supplements Post-employment benefits 7,184 7,739 TOTAL 9,844 10,200 Post-employment obligations reflect post-retirement medical care plans provided by certain Group companies to specified plan members. This liability has been measured by an independent actuary using the following assumptions: discount rate of 8.8%, medical inflation of 6.9%. The opening balance for the period reconciles with the closing balance as follows: (In thousands of Euros) Balance at 31 December ,736 Contributions paid -198 Service cost recognised in the income statement 179 Interest cost 530 Actuarial loss recognised in comprehensive income 737 Translation differences -1,803 Balance at 31 December ,
153 Consolidated Annual Accounts 14.2 Other provisions Movement in 2013 is as follows: (In thousands of Euros) Lawsuits CO2 Other provisions Total At 31 December ,177 1, ,416 Charge to provision 170 1, ,415 Application Reversal -1,865-1,865 At 31 December ,347 1, ,736 CO2 These are provisions for CO2 emissions during the year for which the emission allowances have not yet been surrendered (see note 7.1). Applications for the year are mainly due to the derecognition of emission allowances for 2013 totalling Euros 1,865 thousand (Euros 2,380 thousand in 2012) (see note 7.1). Lawsuits This provision reflects additional income tax due from the Group subsidiary Acerinox Italia, S.r.l. for 2004 as a result of an inspection. Although this tax assessment was dismissed by the first court of appeal, for the moment the Company has decided not to reverse the provision until the ensuing lawsuits have been concluded. The Italian taxation authorities have appealed the dismissal of this assessment and the company has submitted its objections. The corrections required by this tax assessment include adjustments to the transfer prices applied in transactions between Acerinox Italy and the Spanish Group company Roldán, S.A., which in July 2011 applied to Spain s Directorate-General for Taxation (part of the Ministry of Economy and Finance) for the elimination of double taxation in connection with the adjustment of profits of associated enterprises, pursuant to Convention 90/436/EEC of 23 July Other provisions In 2013 other provisions reflect Inoxcenter, S.L. s estimate of the probable obligations arising from the workforce restructuring plan implemented that year pursuant to Royal Decree-Law 5/ Guarantees provided At 31 December 2013 the Group has provided guarantees to third parties, mainly government bodies, totalling Euros 17 million (Euros 17 million in 2012). Group management does not expect any significant liabilities to arise from these guarantees. 152
154 NOTE 15 INCOME AND EXPENSES 15.1 Income and revenue Details of income and revenue in 2013 and 2012 are as follows: (In thousands of Euros) Sale of goods 3,962,938 4,549,304 Rendering of services 3,340 5,384 Self-constructed assets 39,404 23,297 Operating lease income Gains on disposal of fixed assets Reversal of impairment of intangible assets Income from grants and subsidies 1, Income from emission allowances 2,133 1,895 Other income 8,110 7,021 TOTAL 4,018,405 4,589, Personnel expenses Details of personnel expenses in 2013 and 2012 are as follows: (In thousands of Euros) Salaries and wages 267, ,891 Social Security 63,145 50,991 Contributions to employee benefit plans 7,010 8,569 Termination benefits 4,617 6,123 Change in the provision for employee benefits 1, Other personnel expenses 8,195 21,349 TOTAL 352, ,792 The average headcount in 2013 and 2012, distributed by category, is as follows: University graduates Administrative staff 1,126 1,204 Manual workers 5,145 5,287 TOTAL 7,145 7,288 At 31 December a breakdown of personnel by gender and category, including directors, is as follows: Board members Male Female 1 1 Senior management personnel Male 4 5 Female 0 0 University graduates Male Female Administrative staff Male Female Manual workers Male 4,952 5,129 Female TOTAL 6,997 7,266 At 31 December 2013 the number of employees in Spain with a disability of at least 33% is 59 (56 male and 3 female) (66 in 2012; 65 male and one female). All the Spanish companies meet the 2% quota established in the Spanish Law on the Social Integration of People with Disabilities (LISMI) 153
155 Consolidated Annual Accounts 15.3 Other operating expenses Details are as follows: (In thousands of Euros) Rentals 9,220 10,125 Trading costs 145, ,621 Utilities 190, ,067 Maintenance 52,345 68,903 External services 69,917 28,430 Insurance 14,783 16,326 Other operating expenses 63,429 93,232 Taxes other than income tax 14,890 16,599 Losses on sale of property, plant and equipment and intangible assets Impairment of intangible assets 274 Other expenses TOTAL 560, ,996 Other operating expenses include Euros 3,076 thousand in bank fees and securities depository fees (Euros 2,957 thousand in 2012). NOTE 16 NET FINANCE COST Details of the net finance cost are as follows: (In thousands of Euros) Interest and other finance income 7,257 3,980 Income from dividends Gain on disposal of investments in consolidated companies 2,251 0 Gain on remeasurement of financial instruments to fair value (exchange rate insurance) 5,323 3,170 Exchange gains 1,043 33,483 TOTAL FINANCE INCOME 15,875 40,793 Interest expense and other finance costs -65,664-68,860 Loss on remeasurement of financial instruments to fair value (exchange rate insurance) -5,315-38,367 TOTAL FINANCE COSTS -70, ,227 NET FINANCE COST -55,104-66,
156 NOTE 17 TAXATION At 31 December 2013 and 2012 the consolidated tax group in Spain comprises Acerinox, S.A., Acerinox Europa, S.A.U, Roldán, S.A., Inoxfil, S.A., Inoxcenter, S.L. and Inoxcenter Canarias, S.A.U Income tax expense Details of the tax expense are as follows: (In thousands of Euros) Current tax 57,580 55,705 Deferred tax -35,832-43,979 Total income tax 21,748 11,726 In 2013 the Parent received dividends from some of its foreign subsidiaries amounting to Euros 11.5 million. Under the corresponding double taxation conventions, some of these dividends were subject to withholdings at source amounting to Euros 872 thousand, which have been recognised under other taxes in the income statement. This account also reflects other withholdings on interest paid to Group companies, as well as taxes paid overseas in relation to activities conducted by Acerinox, S.A. and Acerinox Europa, S.A.U. s permanent foreign operations. A reconciliation of the income tax expense recognised in the income statement and taxable income is presented below: (In thousands of Euros) Net profit/loss for the year 22,068-21,781 Non-controlling interests -12,483-13,795 Income tax 21,748 11,726 Other taxes 1, Profit/loss before income tax 33,180-23,691 Income tax at the local tax rate 30.00% 9, % -7,108 Effects on tax payable: Effect of tax rates of foreign operations 6,049 10,395 Non-deductible expenses 2,707 3,780 Tax incentives not recognised in the income statement -2, Non-taxable income -1,895-4,975 Prior year adjustments Adjustment of tax rates, deferred taxes -4 1,374 Unrecognised tax credits 4,995 6,995 Other 3,114 3,059 Total income tax 21,748 11,726 The tax rate resulting from the Group s consolidated income statement for 2013 has been gretar than 50%, compared due to the combined effect of a higher contribution made to Group profits by the US company North American Stainless, which is taxed at a rate of 35%, and losses in certain companies whose tax credits have not been capitalised. The tax rates applicable to certain Group companies have been amended also in 2013 and in 2012 pursuant to local legislation: Canada: the tax rate was reduced from 26.5% in 2011 to 25% from 2013 onwards. UK: the income tax rate was reduced from 26% in 2012 to 24% for 2013 and thereafter. Sweden: the income tax rate was reduced from 26.3% in 2012 to 22% for 2013 and thereafter. Norway: As of 2014, the tax rate in Norway has been reduced from 28% to 27%. The Group adjusted its deferred tax assets and liabilities to the new tax rates, taking the difference to the income statement for that year. 155
157 Consolidated Annual Accounts 17.2 Deferred tax Movement in deferred tax assets and liabilities is as follows: (In thousands of Euros) Deferred tax assets Deferred tax liabilities Deferred tax assets Deferred tax liabilities Balance at 1 January 202, , , ,529 Expense/income for the period 17,877-17,955 37,384-5,114 Taxes recognised directly in equity -4, ,540 0 Exchange rate fluctuations , ,857 Transfers 2,966 2,967-6,026-6,026 Other changes Balance at 31 December 218, , , ,545 The origin of deferred tax assets and liabilities is as follows: (In thousands of Euros) Assets Liabilities Net Goodwill 2,819 2,819-11,446-11,245-8,627-8,426 Property, plant and equipment 1,712 1, , , , ,631 Financial assets -1,078-26,312-30,576-27,390-30,576 Inventories Other assets Provisions 3,512 7,255-10,863-9,716-7,351-2,461 Employee benefit plans 8,332 4, ,423 4,759 Financial liabilities 5,348 9, ,346 9,277 Other liabilities Non-deductible finance costs 27,198 12,986 27,198 12,986 Other tax deductions 36,841 34,837 36,841 34,837 Unused tax losses 226, , , ,828 Deferred tax assets/liabilities 311, , , ,738 18,022-22,665 Offsetting of deferred tax assets and liabilities -93, ,193 93, ,193 Deferred tax assets/liabilities 218, , , ,545 18,022-22,665 Deferred tax liabilities from property, plant and equipment are mainly due to the different tax and accounting depreciation criteria permitted by legislation in force in certain countries. These liabilities essentially relate to North American Stainless and Columbus Stainless. A number of changes were made to Spanish legislation in 2012 and 2013, affecting income tax and the recognition and application of deferred tax assets and liabilities. Among the measures introduced, the following affect the consolidated tax Group: Otherwise tax-deductible amortisation/depreciation is capped at 70% for 2013 and Any undeducted amortisation/depreciation will be deductible on a straight-line basis over a ten-year period or over the useful life of the asset from 2015 onwards. Article 12.3 of the Revised Spanish Corporate Income Tax Law, on the impairment of interests in Group companies, has been repealed. Under a transitional regime introduced in the same amendment, if the impaired equity is recovered or dividends are distributed, the impairment recognised in previous years must be reversed. 156
158 Impairment losses on receivables or other assets as a result of possible debtor insolvency, as well as allowances or contributions to employee benefit systems that have given rise to deferred tax assets, must now be included in taxable income. The inclusion of these amounts is capped at the amount of positive taxable income before both their inclusion and the offsetting of tax loss carryforwards. Any amounts not included in one tax period must be included in the next tax periods, up to the same limit. If a company s tax due is of an insufficient amount for it to apply available R&D tax credits, it can cash in on these credits by applying a 20% discount for credits generated from 1 January 2013 onwards, capped at Euros 1 million for technological innovation activities and Euros 3 million for all R&D&I credits as a whole. The first year that this option can be availed of in the income tax return is 2014, and there are certain conditions that must be met. Royal Decree 12/2012 of 30 March 2012 introduced several changes to income tax applicable from 2012 onwards. The measures adopted included a cap on the deductibility of finance costs. This Royal Decree stipulated that net finance costs in excess of 30% of operating profit for the year would not be deductible, with a minimum limit of Euros 1 million. Undeducted net finance costs are available for deduction in the tax periods ending in the 18 immediately subsequent years. The Group therefore recognised a deferred tax asset of Euros 12,164 thousand in this respect in 2013 (Euros 12,986 thousand in 2012). This Royal Decree also reduced the limit on deductions that could be applied during a particular year and extended their offset period, as well as increasing the offset period for tax loss carryforwards from 15 to 18 years. Moreover, certain temporary modifications introduced in RD 12/2012 and RD 20/2012 have been extended to cover 2014 and These include capping the deductibility of goodwill at 1% of the goodwill amount, extending the limit of R&D tax credits and restricting the offsetting of tax loss carryforwards (to 25% of taxable income declared in the case of the consolidated Group). The Group was not affected by this last limitation in 2013 as the taxable base of the consolidated tax group for the year was negative, i.e. a tax loss. Certain temporary changes to the calculation of instalment payments brought in by RD 20/2012 such as the minimum payment of 12% of accounting profit and the inclusion in taxable income of 25% of all dividend and interest income that entitles the recipient to the exemption set forth in article 21 of the Income Tax Law have also been extended to 2014 and Legislation was also passed in the provincial tax regimes of Alava, Vizcaya, Gipuzkoa or Navarra this year, with income tax among the areas affected. The measures include the introduction of a 15-year limit on the offsetting of tax loss carryforwards, measures aimed at improving the capitalisation of companies, the restriction of the deductibility of certain expenses and the review and elimination of certain deductions of little effect as incentives. Amendments were also introduced in 2012 in other countries in relation to deductibility of tax losses: In Italy losses may only be offset against a maximum of 60% of taxable income generated during the year, while the period over which prior years tax losses may be offset, previously capped at five years, is now indefinite. In France the offset period for prior years tax losses was reduced from three years to one year, while the amount that may be offset against future taxable income was limited to Euros 1 million plus 60% of the remaining unused taxable income. At 31 December 2013 and 2012, the Group has tax credits available as follows: (In thousands of Euros) Availability limit to 5 years 2,179 2,543 6 to 10 years 3, to 15 years 104, , to 20 years 36,935 36,512 No prescription date 78,762 93,549 TOTAL 226, ,828 The Group also has tax credits in respect of loss carryforwards of Euros 22,314 thosand (Euros 13,308 thousand in 2012), which, following prudent criteria, have not been capitalised. The Group prepares projections of profit and loss on an individual basis for all companies with available tax credits to determine whether the credits will be recoverable within the timeframe specified under the applicable legislation, and never in a period exceeding that specified in the budget. The Group also assesses the existence of deferred tax assets against which tax losses may be offset in the future. Based on these criteria, the directors consider that all capitalised tax credits are likely to be recovered through future taxable income, in a reasonable period not exceeding that permitted by the corresponding local authorities in each country. 157
159 Consolidated Annual Accounts The Group is currently preparing documentation to support its eligibility for certain tax benefits offered by the Malaysian government in relation to investments in assets for the construction of the Bahru Stainless plant. These tax benefits would enable the company to reduce its taxable income once it starts generating a profit on its activities Current tax At 31 December 2013 the Group has a current tax asset of Euros 5,615 thousand (Euros 8,163 thousand in 2012) and a current tax liability of Euros 14,340 thousand (Euros 12,282 thousand in 2012). Various changes to legislation have been introduced in Spain, affecting the calculation of tax instalments. The Group has considered all these changes for tax consolidation purposes. However, as the Group has a tax loss, there is no impact on payments on account for the current year Tax inspections and years open to inspection In accordance with current legislation, taxes cannot be considered definitive until they have been inspected and agreed by the taxation authorities or until the inspection period has elapsed. At 31 December 2013 Acerinox, S.A. and the companies in the consolidated tax group have open to inspection by the taxation authorities all the main applicable taxes since The other Group companies have open to inspection all taxes for the years stipulated by their respective local legislation. The directors of the Company and subsidiaries do not expect that any significant additional liabilities would arise in the event of an inspection. The situation with regard to tax inspections underway or for which appeals are open at the end of 2013 is as follows: Italy In 2011 the subsidiary Acerinox Italia S.r.l. underwent an inspection of taxes for 2007, 2008 and On completion of this inspection the inspectors issued their report, on the basis of which it looked likely that the taxation authorities would impose an adjustment in relation to transfer prices applied in transactions between Acerinox Italy and the Group s manufacturing companies. On 27 December 2012 the company received the assessment notice for 2007, indicating transfer pricing adjustments for its sales and purchases with the Group s factories. As a result of this assessment notice Acerinox Italy was required to pay Euros 8.4 million, plus interest of Euros 1.3 million. No penalties were imposed. The company challenged this 2007 assessment in an appeal filed before the provincial tax commission of Milan on 23 May 2013, in which it was also requested that a stay be placed on the tax debt until completion of the proceedings. On 9 December 2013 the Group applied to the Spanish and Italian authorities for the elimination of double taxation pursuant to Convention 90/436/EEC of 23 July As most of these transactions are with companies resident in Spain (Acerinox S.A. and Roldán, S.A.), any adjustment relating to transfer prices is protected by Convention 90/436/EEC on the elimination of double taxation in connection with the adjustment of profits of associated enterprises. This Convention guarantees the elimination of double taxation due to transfer pricing adjustments within the European Union. Following negotiations between the Spanish and Italian taxation authorities, or an arbitrator s ruling if necessary, this initial adjustment, or whichever adjustment is agreed, will therefore be neutralised by a counter-adjustment in the other member state. Although the financial effect of the time that elapses until completion of the proceedings is not specifically covered by the Convention, when the Spanish authorities record an adjustment in favour of the taxpayer, this includes accrued interest, or else another method is used to ensure that the financial effect does not entail a charge for the taxpayer. The assessment for 2008 was received on 13 December 2013, indicating transfer pricing adjustments for this company s sales and purchases with the Group s factories. The amount payable in Italy as a result of this assessment is Euros 7.3 million plus Euros 1.2 million in late payment interest. The Company will present its objections by the established deadline, following the same procedures carried out in relation to the 2007 assessment. The assessment notice for 2009 has not yet been received. The deadline for issuing assessments in Italy is the expiry date of the prescription period, i.e. five years after the end of the tax period. The deadline for receiving the assessment for 2009 would therefore be the end of In view of the assessments already received, the 2009 assessment is expected to give rise to tax payable in Italy of Euros 839 thousand. 158
160 The company considers it highly unlikely that the final amount of the obligation will be that shown in the assessments and it is difficult to calculate the definitive amount as the inspectors have failed to take into account numerous arguments based on both OECD transfer pricing regulations and Italian (and Spanish) law, such as: The comparability analyses presented by the company, demonstrating that the prices applied by Acerinox to independent third parties are in line with those applied to the Italian subsidiary, have not even been considered by the Italian taxation authorities. No analysis or consideration whatsoever has been made of the economic market and industry conditions, which, based on the aforementioned regulations, are legitimate justification for the companies having returned a loss. The years of reference used for comparison in the analyses performed are clearly periods in which the economic cycle was noticeably different from the one under analysis, leading to an obvious distortion of results. There are other minor considerations indicative of serious flaws in the businesses used for comparison. It is an internationally recognised basic principle that transfer pricing is not an exact science and it is necessary to weigh up the circumstances of each individual case. Even so, this analysis does not give a single value, but rather a range of values, all of which can be considered arm s length prices. The company can also instigate several procedures to reduce/eliminate these adjustments: Deal with the taxation authorities Court appeal in Italy Court settlement Mutual agreement procedure application for elimination of double taxation related to the adjustment of profits between associated enterprises under Convention 90/436/EEC of 23 July Furthermore, as explained in note 14.2 under the section on lawsuits, transfer pricing adjustments handed down in assessments regarding prior years have been overturned by the Italian court of first appeal. The company therefore expects the same criteria and arguments that led the courts to find in its favour in those cases to be applicable to the assessments for 2007 and For all of the above reasons, and based on the information available to date, although this company could be required to adjust certain amounts by the Italian taxation authorities, it considers that it would be difficult to determine the amounts of these adjustments. At the reporting date and the date of presentation of these annual accounts, the adjustments derived from the inspection in Italy are therefore considered a contingent liability. Germany Inspections of taxes for 2007, 2008, 2009 and 2010 initiated in 2011 at the Group subsidiary Acerinox Deutschland, GmbH have been completed. The final assessment notices concluding these inspections have not, however, been received. On 19 November 2013 the preliminary inspection report was received, indicating possible transfer pricing adjustments for sales and purchases between the subsidiary and the Group s factories. The report does not impose any penalties. The company presented its objections by the established deadline. The German authorities may take these objections into account in the preparation of the definitive assessment. As is the case with Italy, as most of these transactions are with the companies resident in Spain, any adjustment relating to transfer prices is protected by Convention 90/436/EEC on the elimination of double taxation in connection with the adjustment of profits of associated enterprises. This Convention guarantees the elimination of double taxation due to transfer pricing adjustments within the European Union. Following negotiations between the Spanish and German taxation authorities, or an arbitrator s ruling if necessary, this initial adjustment, or whichever adjustment is agreed, will therefore be neutralised by a counter-adjustment in the other member state. Malaysia During 2013 the Group company Acerinox Malasia Sdn, Bhd. has undergone an inspection of the period. Although this inspection has not yet been completed, no significant adjustment is expected. The company is entitled to a special ten-year exemption granted by the Malaysian authorities, so any adjustment relating to income tax would not give result in payments to the taxation authorities. Spain The import duties and VAT paid by the Group company Inoxidables de Euskadi in 2011 were inspected this year. This inspection was concluded on 27 June 2013, when the company signed in acceptance of the final assessment, which did not contain any adjustments. 159
161 Consolidated Annual Accounts On 13 February 2012 the Group received notification from the taxation authorities of the commencement of an inspection of import duties, import VAT and anti-dumping duties for 2009, 2010 and 2011 in Acerinox, S.A. and Acerinox Europa, S.A.U. On 31 May 2012 the Group contested the tax assessments issued on completion of the inspection. These assessments only imposed adjustments for certain cases relating to anti-dumping. The company submitted its objections for these cases to the taxation authorities, which were partly upheld. The final amount to be settled was Euros 775 thousand for anti-dumping and import duties, plus Euros 109 thousand in late payment interest, and Euros 649 thousand for VAT. The amount relating to VAT was paid, whereas a guarantee was deposited for the amount corresponding to anti-dumping and import duties. The assessments consider that no offence has been committed and, accordingly, no tax penalties have been imposed. Appeals for judicial review have been filed in relation to the settlement agreements and the objections for these cases have been submitted. The company expects the objections submitted to be upheld, either by the judicial review chamber or in subsequent hearings. Portugal In 2011 a tax inspection of 2008 and 2009 also took place in the Group company Acerol Ltda. in Portugal. This inspection gave rise to a transfer pricing adjustment for sale and purchase transactions between Acerol, Ltda and the Group s plants, primarily Acerinox, S.A. and Roldán, S.A. The adjustment to taxable income amounted to Euros 10 million. However, as the subsidiary had tax losses of Euros 6.7 million pending offset, the amount paid totalled Euros 708 thousand, including interest of Euros 32 thousand. These assessments considered that no offence had been committed and, accordingly, no tax penalties were imposed. As most of these transactions were with the companies resident in Spain (Acerinox S.A. and Roldán, S.A.), the adjustment relating to transfer prices is protected by Convention 90/436/EEC of 23 July On 31 July 2012 an application was submitted to the Directorate-General for Taxation through the European Arbitration Convention, requesting the elimination of double taxation arising from the tax assessments issued in Portugal. The Spanish authorities have already notified the Portuguese authorities and are awaiting their reply. The period for negotiations between the two authorities is two years, i.e. until 31 July 2014, whereupon, if no agreement has been reached, an arbitration committee may be appointed whose remit is to determine how to eliminate the double taxation. France In 2012 inspections of taxes for 2009 and 2010 were carried out at the Group subsidiary Acerinox France, S.A.S. No significant adjustments were required as a result of these inspections. NOTE 18 RELATED PARTY BALANCES AND TRANSACTIONS 18.1 Identity of related parties The consolidated financial statements include transactions with the following related parties: Equity-accounted associates; Key management personnel of the Group and members of the boards of directors of Group companies; Significant shareholders of the Parent. Transactions between the Company and its subsidiaries, which are related parties, are carried out in the ordinary course of the Company s business and have been eliminated on consolidation. Therefore, they are not disclosed in this note Related party balances and transactions All transactions between related parties are carried out at arm s length, and are listed below. a) Associates No transactions were carried out with associates in 2013 or b) Directors and key management personnel Remuneration received by the members of senior management who do not hold positions on the board of directors of Acerinox, S.A. amounts to Euros 1,523 thousand. Euros 1,076 thousand of this amount reflect salaries, Euros 94 thousand are allowances and Euros 353 thousand are other remuneration. In 2012, the five senior management personnel received Euros 2,281 thousand, of which Euros 1,322 thousand reflected salaries, Euros 112 thousand were allowances and Euros 847 thousand were other forms of remuneration. 160
162 In 2013 members of the board of directors of Acerinox, S.A., including those that hold key management positions and sit on the boards of other Group companies, received Euros 1,950 thousand in fixed remuneration for attending board meetings and fixed and variable salaries (the latter based on profit from the prior year), of which Euros 1,330 thousand reflect salaries and fixed board member remuneration, Euros 404 thousand are allowances and Euros 216 thousand are other remuneration. In 2012, the remuneration received totalled Euros 2,169 thousand, of which Euros 1,356 thousand reflected salaries and fixed remuneration, Euros 384 thousand were allowances and Euros 429 thousand were other forms of remuneration. Commitments with all senior management, totalling Euros 1,266 thousand in 2013, have been accounted for correctly and are adequately covered through insurance contracts (Euros 1,357 thousand in 2012). No commitments have been contracted with directors representing shareholders or independent directors of Acerinox, S.A. At 31 December 2013 no advances or loans have been extended to the members of the board of directors or senior management and the Company has no balances receivable from or payable to these executives. Details of investments held by the directors of the Parent or their related parties in companies with identical, similar or complementary statutory activities to that of the Parent, as well as positions held and functions and activities performed in these companies, are as follows: Director Company Position and duties Bernardo Velázquez Herreros Acerinox Europa S.A.U. Chairman Bernardo Velázquez Herreros Bahru Stainless Sdn. Bhd. Chairman Bernardo Velázquez Herreros Inoxcenter. S.L. Chairman Yukio Nariyoshi Nisshin Steel Holding Co.. Ltd. Board member and vice-chairman The other directors and its related parties have declared that during the year ended 31 December 2013 they did not hold any interests or positions or performed any duties, either on their own behalf or on behalf of third parties, in companies with statutory activities that are identical, similar or complementary to that of Acerinox, S.A. and subsidiaries. All transactions carried out between members of the board of directors and the Company or Group companies in 2013 were ordinary transactions under market conditions. c) Significant shareholders The Group has entered into the following financing transactions with Banca March, part of the March Group (shareholder of Corporación Financiera Alba), all under market conditions: Credit facilities up to a limit of Euros 2 million, of which Euros 0.06 million have been drawn down. Guarantees up to a limit of Euros 0.06 million, of which Euros 0.06 million have been drawn down. Reverse factoring facilities for Euros 16 million, of which Euros million have been drawn down. Non-current loan of Euros 30 million, fully drawn down. Factoring facilities for Euros 79 million, of which Euros million have been drawn down. In 2012 the Group contracted the following financing transactions with Banca March, all of which were under market conditions: Credit facilities up to a limit of Euros 16 million, from which no drawdowns had been made at 31 December Guarantees up to a limit of Euros 0.39 million, of which Euros 0.39 million had been drawn down. Factoring of receivables for Euros 2 million, with no drawdowns at 31 December Reverse factoring facilities for Euros 3 million, of which Euros 2.69 million had been drawn down. Non-current loan of Euros 30 million, fully drawn down. Details of the Group s transactions with Banca March in 2013 and 2012 are as follows: (In thousands of Euros) Interest cost 2,123 1,654 Fee and commission expenses TOTAL 2,256 1,
163 Consolidated Annual Accounts Regarding terms and conditions of the detailed loans and financial transactions all are done at arm s length. Insurance premiums and other transactions totalling Euros 10,755 thousand (Euros 12,841 thousand in 2012) have been brokered through March J.L.T. Correduría de Seguros (a March Group company). At 31 December 2013, Metal One no longer holds an interest in Acerinox, S.A., and is therefore not a related party this year, so transactions with this company are not included below. The Acerinox Group has carried out the following trade transactions with its shareholder Nisshin and other Group companies (transactions with Metal One are included in 2012 figures): (In thousands of Euros) Purchases of goods 8,487 Sales of goods 14,242 Services rendered 285 1,809 Trade receivables from these entities amounted to Euros 2,852 thousand at 31 December Trade balances payable to these companies totalled Euros 2,218 thousand. Acerinox, S.A. has received dividends from Nisshin Steel Holding, Co., Ltd. amounting to Euros 40 thousand (Euros 158 thousand in 2012). Threre are no situations of conflicts of interest between the directors and the Company during the period. NOTE 19 AUDIT FEES Details of fees and expenses accrued by KPMG International (principal auditor) and associate firms for services provided to the consolidated companies are as follows: (In thousands of Euros) 2013 KPMG Auditores. S.L. KPMG Europe. LLP KPMG International TOTAL Audit services Tax advisory services Other services TOTAL , KPMG Auditores. S.L. KPMG Europe. LLP KPMG International TOTAL Audit services Tax advisory services Other services TOTAL ,259 The amounts detailed in the above table include the total fees for services rendered in 2013 and 2012, irrespective of the date of invoice. Other audit firms invoiced the Group fees and expenses for audit services amounting to Euros 81 thousand in 2013 (Euros 103 thousand for audit services in 2012). 162
164 NOTE 20 EVENTS AFTER THE REPORTING PERIOD The European Commission authorisation of the acquisition of the Terni (Italy) factory by ThyssenKrupp. One of the most unsettling factors within the European Market was the merger of Outokumpu and Inoxum, a ThyssenKrupp subsidiary. The operation, structured as an absorption of the latter by the former, immediately came into conflict with the determinations of the European Commission, which then forced the sale of the Acciai Speciali Terni factory in Italy and set a deadline for the operation. The inability to find a buyer within the initial period first led to the extension of the deadline and finally the repurchase of this and other assets by ThyssenKrupp. The result provides better stability within the European market and ends this period of uncertainty which had put a halt to the process of consolidating European manufacturers. Steel Action Plan. In January 2014, Spanish authorities created a Working Group on the future of the steel industry in Spain, presided by the Minister of Industry, José Manuel Soria. This initiative is based of the Tajani Plan and which must project its impact in the area of Spain. Three work groups have been planned to examine energy, the environment and market access, respectively. At the end of 2012, European Commission Vice-President Antonio Tajani unveiled an ambitious project intended to relaunch the European steel industry. The Plan, finally approved in 2013, committed European authorities to find a new competitiveness framework for the industry. Measures from environmental proposals to the analysis of commerce treaties would be successively implemented over the next few years with the monitoring of interested parties. The Indonesian government has prohibited the export of a series of minerals, among them nickel. This mineral was being exported to China, which processed it for its use in stainless steel manufacturing within its own territory. The need to process this mineral in Indonesia means that the nickel yielded will be made available to international markets. The near-exclusive access to cheaper nickel was one of the advantages Chinese manufacturers enjoyed, but now all world producers can access the metal under equal conditions. 163

165

166 4 Directors Report of Acerinox
167 Individual Corporations of the Acerinox Group 1 Acerinox Acerinox S.A. is the group s parent company and the holding company of shares in its various subsidiaries. The company s shares are admitted to trade in the Madrid and Barcelona stock markets, as explained in the Management Report section. The share capital on 31 December, 2013 rose to 64,286, euros, comprised of 257,146,177 shares with a nominal value of 0.25 euros each. Acerinox S.A. directs and coordinates the group s activities worldwide, establishing what strategies to follow, and channelling and performing management activities in the acquisition of raw materials and credits for the entire group and its companies. The most significant figures of Acerinox, S.A. are given in following: (Million euros) Variation Net turnover % Result before taxes % Depreciation % Result afrter taxes % Net cash flow % The earnings of Acerinox, S.A. are the result of the receipt of dividends, when so established, and the provision of corporate services and the centralisation of financing in favour of the Group s various companies. Million euros ASSETS Variation Non current assets 1, , % Current assets % Inventories % Debtors % - Trade debtors % - Other debtors % Cash and other current assets % Total assets 2, , % Liabilities Variation Equity % Non current liabilities % Interest bearing loans and borrowings % Other non current liabilities % Current liabilities 1, % Interest bearing loans and borrowings % Trade creditors % Other current liabilities % Total equity and liabilities 2, , % Its assets fundamentally consist of shares in the other companies of the Group, financed by equity totalling 815 million euros and a debt of 994 million euros. 166

168 Acerinox S.A. office. Shareholder returns The General Shareholders Meeting was held on 5 June, 2013, and it approved the payment of a flexible dividend up to a maximum amount of 112,187, euros, equivalent to 0.45 euros per share, or the same amount, adding together the dividend and share premium, that has been perceived by Acerinox shareholders since This flexible dividend replaced for the year 2013 the three dividend payments plus share premium that were made in previous years, and was carried out according to the following schedule: 5 June, 2013, when it was approved by the General Shareholders Meeting. The days between the 6th and 12th June, 2013 were the reference dates to determine the average exchange of the shares at closing, with this pre-cot being established at euros per share. The result of this change determined the next two parameters, according to the agreement approved in the General Meeting: The number of free allotment rights needed to receive a share was established at eighteen (18). The price perceived by corporate shareholders at the start of the operation who wanted to sell their shares to Acerinox was set at per share. The free allotment rights were negotiated on the Continuous Market in the Madrid and Barcelona Stock Exchanges from 18th June to 2nd July, Those who were shareholders at the start of the operation (11:59 on 17 June, 2013) had a period between 18th and 26th June, 2013 to report the sale of their rights to the corporation at the exchange price of euros per share. On 5 July, 2013, soliciting shareholders perceived an amount of euros for the sale of each of their free allotment rights. 167

169 Individual Corporations of the Acerinox Group On 17 July, 2013, the 7,841,631 new shares from the capital gain of the flexible dividend approved at the General Meeting of 5 July, 2013 were admitted to official trading on the Continuous Market in the Madrid and Barcelona Stock Exchanges. The return obtained by shareholders who had sold their rights to the Corporation meant an annual profitability of 4.7% in respect to the closing exchange for Acerinox shares in Shareholders who opted to subscribe to new shares with their free allotment rights obtained a 26.7% revaluation, considering the closing exchange on the first day these shares were admitted to trading on the Continuous Market and the last exchange of Annual shareholder returns Euros / share Issue premium Dividend (*) (*) Scrip dividend Presentation of the 2013 results. 168

170 2 Acerinox Europa Campo de Gibraltar factory. Since 2008, an intense investment programme has been carried out to outfit the factory with the last technological advances. The cumulative investment over these six years has totalled 262 million euros. Thanks to these investments, quality, performance and allocation levels have notably improved in respect to 2012, reaching historic highs. The ongoing Health and Safety Policy adopted by Acerinox Europa has led to the number of incidents per hour worked to drop by 28% in the period of In the same period, absence due to illness or accident decreased by 17.5%. Investment in prevention during 2013 rose to 1,138,541 euros. Environmentally-related investments in 2013 totalled 3,322,040 euros and were particularly focussed on the treatment of acids and fumes and the reduction of water consumption. In 2013, environmentally-related expenses at the Campo de Gibraltar plant totalled 15,388,643 euros. The award for quality, safety and the environment went beyond expectation in both quantity - 25 projects in all - and also for their quality, preparation and study. Our personnel once again demonstrated their degree of involvement and commitment to the objectives of the company. The president of the selection board, the 169

171 Individual Corporations of the Acerinox Group director of the Poly-Technical School of Algeciras, and the rest of the members awarded first prize in the category of Quality in Progress to Antonio Chacón Moreno for the project Viability Study for the Reduction of Energy and Gas Consumption in AOD Processes. Second prize was awarded to the Scratch Remover project presented by Rafael Vázquez Fernández. In the category of Safety and the Environment, the award went to the project Sheet Metal Workshop, New Packing System. Safety and Production Improvements by Luis Marcón Sánchez-Peña. In the Environmental area, Acerinox Europa improved its rating in the Carbon Disclosure Project and renewed its classification in Global Reporting Initiative (GRI). It also took part in the Life Cycle Inventory project advocated by Eurofer and has led the effective implementation of the Environmental Management System (EMS). In 2013, Acerinox Europe started an ambitious new training plan based on upon two fundamental pillars: The first, as the great well of experience and knowledge of stainless steel manufacturing can be found amongst our long-time workers and managers and all their years of dedication, this training is to be imparted by this personnel, in some cases those who have retired. The second is that all this knowledge and experience cannot be lost and must be extended to the rest of the organisation. It is well worth mentioning the monitoring, work and effort dedicated in the Plan of Excellence III, in which 98% compliance of the objectives were attained. 170


172 Visit to the Acerinox Europa factory by the President of the Junta de Andalucía, Mrs Susana Díaz Pacheco, 30 March,

173 Individual Corporations of the Acerinox Group 3 North American Stainless For another year, the Ghent (Kentucky) factory has proven to be the most competitive, productive and profitable plant in the Group and quite possibly the world. Its monthly production levels remained on par with its record highs, and often surpassed them. The consistency and rebound of the American economy, particularly in the industrial sector, has encouraged the development of the plant. In 2013 the staff of NAS underwent no appreciable changes, holding steady at 1,381 people. The accident rate was the lowest in the Group, situated at 0.36% (lost injury time), a result of the excellent job done by the Health and Safety Department. NAS concluded 23 new R + D + i projects, fundamentally in innovation and cumulatively amounting to 2.5 million euros, and continues with its investment plan, which in 2013 focussed on AOD equipment and thickness gauges on the finishing line. The company continues to take part in environmental initiatives to safeguard the waters of the Ohio River and local conservation projects for local wildlife. In 2013, the governor of Kentucky, Steve Beshear paid a visit to the Group s headquarters in Madrid, offering institutional support and thanking Acerinox for its contribution to American industry. Visit by the Governor of Kentucky to the offices of Acerinox S.A. in Madrid. 172

174 4 Columbus Stainless Columbus suffered, like the rest of the Group, from the harsh conditions of the international market. The South African market, the third most important for the Group, was stalled due to the slowing of construction plans in public works and the decline in exports of the local motor industry, as well as that of the manufacture of containers. Low prices in Europe and Asia impeded real sales growth in these areas. This was why efforts were doubled to increase sales in other markets, such as Latin America and the Middle East. The country s internal situation caused certain additional difficulties, as gas and electricity cost rose above inflation rates. In terms of Human Resources, Columbus continued making strides in the Black Empowerment policies stipulated by the South African government. This has meant continuing efforts in favour of local communities and paying close attention to promote the acquisition of goods and services from companies who enjoy good ratings in this aspect. Similarly, training and professional development continued to be promoted among qualified black workers. In 2013, Columbus was the main supplier of raw materials to the new plant the Group has been developing in Malaysia, and the technical assistance provided by the company s team to this new plant has been and continues to be essential. Advances in health and safety were quite satisfactory, with accident rates at 0.73% (lost injury time), 38 fewer than Factory in Middelburg. 173

175 Individual Corporations of the Acerinox Group 5 Bahru Stainless In 2013, the company finalized the implementation of its Phase I equipment and began adjustments to the Phase II equipment. The main Phase II equipment being tested includes a Zm-2 rolling mill, capable of processing thicknesses of up to 0.2mm, as well as a cold annealing and pickling line designed to work with thinner, higher value added thicknesses. In 2013 the plant gradually raised its production, in accordance with the forecast learning curve. Production thus jumped 63%, prioritizing sales within the ASEAN zone. This rise in production allowed for the increased utilisation of the Group s capacity, thanks to supply of hotrolled reels from other plants. The equipment start-up process was aided by technical assistance from the rest of the Group, who sent in technicians from areas such as Europe, Japan, the USA and South Africa. On 31 December, a total of 385 people worked at Bahru Stainless, including 12 who had been sent from the Group s other plants. At the end of the year, the first collective agreement was signed with the company s workers, which was characterized by following similar guidelines to those the Group uses in other countries, essentially Spain, where wages are decoupled from the Consumer Price Index and eventual wage increases are tied to quality and production results. The duration of the accord was set for three years. ZM-No

176 First AP-No. 2 coil. Offices. 175

177 Individual Corporations of the Acerinox Group 6 Roldan and Inoxfil Roldan The Ponferrada (Spain) plant demonstrated excellent sales capacity in guaranteeing its presence in large-scale infrastructure projects. The high point undoubtedly was to secure the contract to supply Duplex stainless steel bars for the construction of a bridge uniting Hong Kong and Macao to the amount of 15 million dollars. The project has more of a symbolic value than an economic one, as the country receiving the goods is currently the largest producer of stainless steel in the world. The staff of Roldan consists of 422 people, 27 of whom are semi-retired. In 2013, Roldan s R + D + i Department took part in 6 new projects and destined nearly half a million euros to this purpose. Inoxfil The wire drawing plant at Igualada (Spain) maintained its market share in Europe in a rather tough environment - thanks the quality of its equipment and superb know-how of its staff. It likewise strengthened its sales network by taking on specialists in wire sales from several of the Group s commercial companies. On 31 December, the Inoxfil staff consisted of 112 people. Corrugated bar. 176

178 7 Commercial Companies The commercial companies continued with their process of restructuring based on contracting certain common services and implementing various improvements to their supply chains. Spanish Commercial Companies The cumulative sales of the Spanish commercial companies was 3% higher than that of 2012, in a market that seems on the point of bouncing back, with 2.7% apparent consumer growth. Throughout the year, adjustments were made to the staffs of the leading commercial companies in Spain, sensibly reducing operating costs to adapt them to the new realities of the Spanish market. Overseas Commercial Companies The consolidated sales of the rest of the Group s commercial companies was 26% lower than the year before, fundamentally due to the sharp jump in direct sales from the Group s factories. The Group continued with its strategy to start new companies in Asia by opening up of sales offices in Bangkok (Thailand), Manila (the Philippines) and Taipei (Taiwan). At the time this report was written, procedures were being completed to open up an office in Seoul (South Korea). Along with these companies, there also is a new sales office in Dubai (UAE). Acerinox service centre in Poland. 177
BUSINESS YEAR 2009 RESULTS
 BUSINESS YEAR 2009 RESULTS Madrid, 26 February 2010 WORLD PRODUCTION OF STAINLESS STEEL Thousand Mt. 30,000 28,000 26,000 24,000 22,000 20,000 18,000 16,000 14,000 12,000 10,000 8,000 6,000 4,000 2,000
GENERAL SHAREHOLDERS MEETING ACERINOX Business Year 2012
 GENERAL SHAREHOLDERS MEETING ACERINOX Business Year 2012 Madrid, June 5th 2013 ACERINOX EUROPA FACTORY NORTH AMERICAN STAINLESS FACTORY COLUMBUS STAINLESS FACTORY BAHRU STAINLESS FACTORY ROLDAN FACTORY
Acerinox Results as of 30 September 2014 Results as of 30 September 2014
 Results as of 30 September 2014 Page 0 / 9 Results as of 30 September 2014 In the first nine months of the year, Acerinox has achieved a profit after taxes and minorities of 133.8 million euros Improvement
Index. ACERINOX in numbers Letter from the Chairman Letter from the Chief Executive Officer Directors Report...
 ANNUAL REPORT2016 REPORT 2016 2 Index ACERINOX in numbers... 4 Letter from the Chairman... 6 Letter from the Chief Executive Officer... 10 Directors Report...16 1. Our business...18 1.1 Production Companies...20
Results on 31 March, 2018
 Results on 31 March, 2018 Free translation from the original in Spanish. In the event of discrepancy, the Spanish-language version prevails Page 0 / 13 DISCLAIMER This document has been drawn up in good
Contents. Acerinox Group in Figures Letter from the Chairman Letter from the Chief Executive Officer... 8
 REPORT 2012 REPORT 2012 Contents Acerinox Group in Figures... 4 Letter from the Chairman... 6 Letter from the Chief Executive Officer... 8 1. Directors Report of Acerinox... 15 1. World Production...
Summary. The ACERINOX Group in figures 6. Letter from the Chairman 8
 ANNUAL REPORT 2005 2 Summary 3 The ACERINOX Group in figures 6 Letter from the Chairman 8 1. Directors Report of the Consolidated Group 13 1. Productions 14 2. Raw Materials 16 3. Markets 20 4. Sales 24
NBIM Quarterly Performance Report Second quarter 2007
 NBIM Quarterly Performance Report Second quarter 2007 Government Pension Fund Global Norges Bank s foreign exchange reserves Investment portfolio Buffer portfolio Government Petroleum Insurance Fund Norges
High-quality aluminium coils of AMAG Austria Metall AG
 High-quality aluminium coils of AMAG Austria Metall AG Financial Report 1 st half year of 2015 2 AMAG Financial Report Key figures for the AMAG Group Key figures for the Group in EUR million Q2/2015 Q2/2014
Third-quarter earnings burdened by raw material-related losses. Group adjusted EBITDA at EUR 56 million
 1 (23) Contents Highlights in the third quarter of 2017... 2 Highlights during the first nine months of 2017... 2 Business and financial outlook for the fourth quarter of 2017... 3 CEO Roeland Baan...
Oct-Dec st Preliminary GDP Estimate
 Japan's Economy 15 February 2016 (No. of pages: 5) Japanese report: 15 Feb 2016 Oct-Dec 2015 1 st Preliminary GDP Estimate GDP experiences negative growth for first time in two quarters hinting at risk
Nickel Market Outlook
 22/9/215 Nickel Market Outlook Stuart Harshaw This presentation may include statements that present Vale's expectations about future events or results. All statements, when based upon expectations about
CECIMO Statistical Toolbox
 European Association of the Machine Tool Industries where manufacturing begins Inside this edition... 0 Executive Summary 1 Machine Tool Orders 1.1 Orders per Country 1.2 Peter Meier s Forecast CECIMO
Improved Macroeconomic Conditions Boost Consumer Sentiment to Its Highest Level in 3½-Year
 ECONOMIC REPORT Business & Consumer Confidence 17 April 2018 Improved Macroeconomic Conditions Boost Consumer Sentiment to Its Highest Level in 3½-Year MIER s CSI rebounded to 3.5-year high. Underpin by
This is the Global Economic, Scrap Metal, Commodities and Recycling Report, by BENLEE Roll off Trailers and Open Top Scrap Haulers, October 15, 2018.
 This is the Global Economic, Scrap Metal, Commodities and Recycling Report, by BENLEE Roll off Trailers and Open Top Scrap Haulers, October 15, 2018. Last week commodity prices and economic reports were
The Asian Face of the Global Recession
 The Asian Face of the Global Recession C.P. Chandrasekhar & Jayati Ghosh Delegates to the World Economic Forum at Davos this year came despondent and left in despair. Both the discussions and the new evidence
MR. VICTORIANO MUÑOZ CAVA
 SPEECH OF MR. VICTORIANO MUÑOZ CAVA CHAIRMAN AND CHIEF EXECUTIVE OFFICER GENERAL SHAREHOLDERS MEETING Madrid, 14th June 27 Dear shareholders: I am pleased to inform you about the economic results of year
Nickel Stocks. Introduction
 INSG Insight INSG SECRETARIAT BRIEFING PAPER March 21 No.9 Nickel Stocks Introduction This report, the ninth in the series of INSG Insight briefing reports, provides members with information on nickel
Monthly Economic Report
 Monthly Economic Report April 19, 2018 Copyright Mizuho Research Institute Ltd. All Rights Reserved. 1. The Japanese Economy: the business conditions DI deteriorated; FY2018 fixed investment plans were
PRESENTATION OF THE RESULTS
 PRESENTATION OF THE RESULTS 1 st half of 2014 D Jesús Esmorís TUBACEX CEO The results for the first half of 2014 that TUBACEX presents herein, maintain the upward trend that has been observed since last
Annual Accounts February 1, 2007 Juha Rantanen, CEO.
 Annual Accounts 2006 February 1, 2007 Juha Rantanen, CEO www.outokumpu.com Highlights in 2006 Market development Improvement actions update and strategic direction Annual Accounts 2006 Outlook 2 February
Electrocomponents 2017 half-year financial results. 18 November 2016
 Electrocomponents 2017 half-year financial results 18 November 2016 Agenda Overview of results Lindsley Ruth Financial results and performance update David Egan Performance Improvement Plan Lindsley Ruth
Bi-Monthly Stainless Steel Briefing
 Bi-Monthly Stainless Steel Briefing Summary of Main Industry Events Issue 27, December 2011 Contents Stainless Steel at a Glance PMI (Economic Indicator) Chinese Exports European Industry News Relevant
4 Year FTSE 4 Monthly Income Plan October 2015 THE SHARES
 4 Year FTSE 4 Monthly Income Plan October 2015 THE SHARES This information is for financial advisers only and should not be presented to, or relied upon by, private investors. Introduction Our new 4 Year
Commodities Observing the fundamentals Written by: Dwayne Dippenaar, Research Analyst at Laurium Capital
 FUNDS ON FRIDAY b y G l a c i e r R e s e a r c h 24 J u n e 2 0 1 6 V o l u m e 8 6 7 Commodities Observing the fundamentals Written by: Dwayne Dippenaar, Research Analyst at Laurium Capital The South
MEETING OF SHAREHOLDERS SCOTIABANK TRINIDAD AND TOBAGO LIMITED CROWNE PLAZA JANUARY
 ADDRESS DELIVERED BY ROB PITFIELD, CHAIRMAN THE 36 th ANNUAL MEETING OF SHAREHOLDERS SCOTIABANK TRINIDAD AND TOBAGO LIMITED CROWNE PLAZA JANUARY 26 th 2006 It s a pleasure to be here today to celebrate
1 World Economy. Value of Finnish Forest Industry Exports Fell by Almost a Quarter in 2009
 1 World Economy The recovery in the world economy that began during 2009 has started to slow since spring 2010 as stocks are replenished and government stimulus packages are gradually brought to an end.
All the BRICs dampening world trade in 2015
 Aug Weekly Economic Briefing Emerging Markets All the BRICs dampening world trade in World trade in has been hit by an unexpectedly sharp drag from the very largest emerging economies. The weakness in
3. The international debt securities market
 Jeffery D Amato +41 61 280 8434 jeffery.amato@bis.org 3. The international debt securities market The fourth quarter completed a banner year for international debt securities. Issuance of bonds and notes
Ferrochrome Market Overview 2017
 Ferrochrome Market Overview 217 Presented by: Mark Beveridge Principal Consultant CRU Nickel, Chrome, Stainless Steel Group Key Themes Which factors define the chrome market? 1. Chinese demand and the
Other similar crisis: Euro, Emerging Markets
 Session 15. Understanding Macroeconomic Crises. Mexican Crisis 1994-95 Other similar crisis: Euro, Emerging Markets Global Scenarios 2017-2021 The Mexican Peso Crisis in 1994: Background An economy that
RHI Group >> Quarterly Report III/2006
 RHI Group >> Key Figures RHI Group Q1 - Q3 Change in million 2006 2005 in % Revenue 998.6 893.9 11.7 EBITDA 130.5 108.1 20.7 EBITDA margin 13.1% 12.1% 8.1 EBIT 97.5 78.3 24.5 EBIT margin 9.8% 8.8% 11.5
Interest Rates Continue to Climb
 SEPTEMBER 3, RETAIL RATE FORECASTS Interest Rates Continue to Climb # BEST OVERALL FORECASTER - CANADA HIGHLIGHTS ff North American economic growth rebounded in the spring. ff The Bank of Canada and the
North American Steel Industry Recent Market Developments, Future Prospects and Key Challenges
 North American Steel Industry Recent Market Developments, Future Prospects and Key Challenges OECD Steel Committee June 8-9, 29 Paris, France * American Iron and Steel Institute (AISI) Steel Manufacturers
Presentation of the results
 Presentation of the results 1 st QUARTER OF 2018 TUBACEX has made sales and production efforts geared to improving our market standing in the Premium product segment, which now enable us to face this financial
Part. Situation and Economic Indicators of SMEs in 2012 and 2013
 Part 01 Situation and Economic Indicators of SMEs in 2012 and 2013 Chapter 1 + Gross Domestic Product of SMEs 1 Gross Domestic Product of SMEs The overall gross domestic product (GDP) of 2012 expanded
Portuguese Banking System: latest developments. 2 nd quarter 2018
 Portuguese Banking System: latest developments 2 nd quarter 218 Lisbon, 218 www.bportugal.pt Prepared with data available up to 26 th September of 218. Macroeconomic indicators and banking system data
Jan-Mar nd Preliminary GDP Estimate
 Japan's Economy 8 June 2016 (No. of pages: 5) Japanese report: 08 Jun 2016 Jan-Mar 2016 2 nd Preliminary GDP Estimate Real GDP growth rate revised upwards slightly from 1 st preliminary; results in accordance
Labour. Overview Latin America and the Caribbean. Executive Summary. ILO Regional Office for Latin America and the Caribbean
 2017 Labour Overview Latin America and the Caribbean Executive Summary ILO Regional Office for Latin America and the Caribbean Executive Summary ILO Regional Office for Latin America and the Caribbean
Acerinox, S.A. and Subsidiaries
 Acerinox, S.A. and Subsidiaries Consolidated Annual Accounts 31 December 2016 Consolidated Directors' Report 2016 (With Auditors Report Thereon) (Free translation from the original in Spanish. In the event
Positive trend in earnings and strong cash flow
 Positive trend in earnings and strong cash flow Presentation of the Q3/2017 result Martin Lindqvist, President & CEO Håkan Folin, CFO October 25, 2017 Agenda Q3/2017 and performance by division Financials
North American Steel Industry Recent Market Developments, Future Prospects and Key Challenges
 North American Steel Industry Recent Market Developments, Future Prospects and Key Challenges OECD Steel Committee December 1-11, 29 Paris, France * American Iron and Steel Institute (AISI) Steel Manufacturers
Exane BNP Paribas Basic Materials Seminar April 1st, Aperam 1
 Exane BNP Paribas Basic Materials Seminar April 1st, 2014 Aperam 1 Disclaimer Forward-Looking Statements This document may contain forward-looking information and statements about Aperam and its subsidiaries.
Annual Accounts CEO Roeland Baan CFO Chris de la Camp. February 2, 2017
 Annual Accounts 216 CEO Roeland Baan CFO Chris de la Camp February 2, 217 Today s attendees from Outokumpu Roeland Baan CEO Chris de la Camp CFO Tommi Järvenpää Director Investor Relations 2 Disclaimer
Previsions Macroeconòmiques. Macroeconomic scenario for the Catalan economy 2017 and June 2017
 PM Previsions Macroeconòmiques Macroeconomic scenario for the Catalan economy 2017 and 2018 June 2017 Previsions macroeconòmiques Macroeconomic scenario for the Catalan economy June 2017 ISSN: 2013-2182
Zenith Monthly Economic Report October 2011
 Zenith Monthly Economic Report October 211 ECONOMIC STATISTICS SUMMARY Cash Rate Inflation Rate (%) Unemployment Rate (%) GDP Annual Growth (%) Country Latest Last Change Latest Change Latest Change Past
Damstahl Bi-Monthly Stainless Steel Briefing December 2012
 Damstahl Bi-Monthly Stainless Steel Briefing December 2012 Damstahl 2012, Damstahl - a member of the NEUMO-Ehrenberg-Group - 1 - Damstahl Bi-Monthly Stainless Steel Briefing Issue 32, December 2012 Contents
Interim Report to 30 June 2004
 Interim Report to 30 June 2004 Q2 Rolls-Royce Motor Cars Limited 02 BMW Group an Overview 06 Automobiles 09 Motorcycles 11 Financial Services 13 BMW Stock 14 Financial Analysis 20 Group Financial Statements
Antonio Fazio: Overview of global economic and financial developments in first half 2004
 Antonio Fazio: Overview of global economic and financial developments in first half 2004 Address by Mr Antonio Fazio, Governor of the Bank of Italy, to the ACRI (Association of Italian Savings Banks),
World Economy Geopolitics Investment Strategy. The Impact of EU s Sovereign Risks on Turkish Economy. Presentation given by
 World Economy Geopolitics Investment Strategy OUTLOOK FOR WORLD S MAJOR FINANCIAL MARKETS The Impact of EU s Sovereign Risks on Turkish Economy Presentation given by Dr. Michael Ivanovitch, President MSI
Working capital: Unlocking excess cash
 Working capital: Unlocking excess cash Why was 2013 a significant year? India s economic growth rate fell to 5% in FY2013 the lowest figure in a decade. While this slowdown can be partly explained by the
EU steel market situation and outlook
 75nd Session of the OECD Steel Committee Paris, 5th December 2013 EU steel market situation and outlook EU economy: on the road to recovery 2013: economy turned the corner in Q2 Indicators strengthening
Part 1 Academic Reading 1
 Contents Introduction How to Use This Book v Part 1 Academic Reading 1 Unit 1 About the Academic Reading Test 1 Unit 2 The Skills You Need 7 Unit 3 Multiple-choice Questions 14 Unit 4 True/False/Not Given
Annual Press Conference 2010 Peter Löscher President and CEO, Siemens AG Munich, Germany, November 11, 2010
 Annual Press Conference 2010 Peter Löscher President and CEO, Munich,, November 11, 2010 Check against delivery. Siemens growth gains momentum We have just completed a very successful fiscal year. We are
PROJECT LINK FALL MEETING NEW YORK, OCTOBER 2015 COUNTRY REPORT : SWITZERLAND
 PROJECT LINK FALL MEETING NEW YORK, OCTOBER 2015 COUNTRY REPORT : SWITZERLAND Délia NILLES 1 1. Recent Trends and Selected Key Forecasts 1.1 Recent trends Switzerland's real GDP grew by 1.9% in 2014, but
Financial Statements Release 2017
 Financial Statements Release 217 CEO Roeland Baan CFO Chris de la Camp January 31, 218 Disclaimer This presentation contains, or may be deemed to contain, statements that are not historical facts but forward-looking
Analyst Meet Presentation Standalone Financial Results, Quarter Ended 30 Sep 2011
 Analyst Meet Presentation Standalone Financial Results, Quarter Ended 30 Sep 2011 Agenda Business Environment Key Developments Performance Overview Projects Update Guidance Update 2 Global economy Recovery
TUBOS REUNIDOS GROUP. Special Products & Integral Services Worldwide. Tubos Reunidos. November 2014
 Special Products & Integral Services Worldwide Tubos Reunidos 1 Content Tubos Reunidos Group 1. Market and Trends 2. Company Overview 3. 2014 2017 Strategic Plan 4. Financials 2 Tubos Reunidos Group Seamless
The real change in private inventories added 0.22 percentage points to the second quarter GDP growth, after subtracting 0.65% in the first quarter.
 QIRGRETA Monthly Macroeconomic Commentary United States The U.S. economy bounced back in the second quarter of 2007, growing at the fastest pace in more than a year. According the final estimates released
Solidly on track in achieving our targets
 Solidly on track in achieving our targets Roeland Baan, CEO Credit Suisse Steel & Mining Conference September 12, 2017 Disclaimer This presentation contains, or may be deemed to contain, statements that
The forecasts of the Labour Market Monitor
 The forecasts of the Labour Market Monitor Key points of the month As anticipated by the Afi-ASEMPLEO SLM Indicator, the unemployment rate rose to 18.75% in 1Q17. In April, Social Security enrolment surprised
ASEAN Insights: Regional trends
 ASEAN Insights: Regional trends January 2017 1. Global trends GLOBAL ECONOMY AND EQUITY MARKETS ENTER 2017 ON A STRONG NOTE DESPITE GEOPOLITICAL UNCERTAINTIES The global economy entered 2017 on a strong
SIP Aggressive Portfolio
 SIP LIFESTYLE PORTFOLIOS FACT SHEET (NOV 2015) SIP Aggressive Portfolio SIP Aggressive Portfolio is a unitized fund, which is designed to provide long term capital growth. It is designed for those who
Speech by Dr. Helmut Panke Member of the Board of Management of BMW AG Annual Accounts Press Conference of the BMW Group 19 March 2002
 - Check against delivery - Member of the Board of Management of BMW AG BMW Group Financial Statements 2001 Highlights 2001 Ladies and Gentlemen, 1. Introduction Key figures on an IAS basis The BMW Group
Consolidated net revenues from sales totalled Euro million (Euro million as at 30 September 2017)
") PRESS RELEASE PANARIAGROUP Industrie Ceramiche S.p.A.: The Board of Directors approves the Consolidated Financial Report as of 30 th September 2018. The trend in EUR/USD exchange rate, the international
PRESS RELEASE PANARIAGROUP Industrie Ceramiche S.p.A.: The Board of Directors approves the Consolidated Financial Report as of 30 th September 2018. The trend in EUR/USD exchange rate, the international
Fastenal Company Reports 2011 Second Quarter Earnings
 Fastenal Company Reports 2011 Second Quarter Earnings WINONA, Minn., July 12, 2011 (GLOBE NEWSWIRE) -- The Fastenal Company of Winona, MN (Nasdaq:FAST) reported the results of the quarter ended June 30,
U.S steel production rose slightly, remaining slightly ahead of last year and well ahead of two years ago.
 This is the Scrap Metal Commodities Recycling and Economic Report, by BENLEE and Raleigh and Goldsboro Recycling, February 26th, 2018. Last week, commodity prices and economic reports were mixed. U.S steel
QUARTERLY REPORT Q1 2010
 QUARTERLY REPORT Q1 2010 www.ence.es Growing the forest and growing with the forest 1 BUSINESS GROWTH AND MARKET OUTLOOK The growth for the quarter can be summarised with the following main figures: Healthy
Annual Report 2017 BME. 4 Financing
 4.FINANCING 34 Once again, in 2017 the Spanish stock exchange returned to a noteworthy position in the international scene due to the new investment flows channelled to its listed companies, increasing
BDO MONTHLY BUSINESS TRENDS INDICES April Copyright BDO LLP. All rights reserved.
 BDO MONTHLY BUSINESS TRENDS INDICES April 2017 Copyright BDO LLP. All rights reserved. INTRODUCTION The BDO Monthly Trends Indices are polls of polls that pull together the results of all the main UK business
UNITED STATES U.S. jobless claims fall 5,000 to 348,000. Applications for benefits at lowest level since February 2008.
 26 Mar 2012 UNITED STATES U.S. jobless claims fall 5,000 to 348,000. Applications for benefits at lowest level since February 2008. U.S. home sales fell in February, but upward revisions to January's pace
Economic Outlook. Technology Industries In Finland Growth of new orders and tender requests stalled s. 4
 Economic Outlook Technology Industries of Finland 4 218 Global And Finnish Economic Outlook Growth continues to slow down s. 3 Technology Industries In Finland Growth of new orders and tender requests
Webcast Third Quarter 2005 Results. Presentation:11/10/05 Paulo Penido Pinto Marques Director of Finance and Investor Relations
 Webcast Third Quarter 2005 Results Presentation:11/10/05 Paulo Penido Pinto Marques Director of Finance and Investor Relations Disclaimer Declarations relative to business perspectives of the Company,
Iron Ore & Steel Derivatives Let the Battle Begin
 Iron Ore & Steel Derivatives Let the Battle Begin Topics Raw Material Price Volatility Financial Hedging Attributes Iron Ore World Steel Exchange Scrap Presented by: DATE: Tuesday November 30, 2010 Patrick
Spanish Labour Market Monitor
 Spanish Labour Market Monitor Key points of the month The October increase in Social Security enrolment of over 11, is three times larger than last year, and takes the YoY rise to 3.4%. The Afi-ASEMPLEO
RECOVERY CONTINUES FOR LOGISTICS REAL ESTATE
 RECOVERY CONTINUES FOR LOGISTICS REAL ESTATE World events trigger soft patch The global economic soft patch in the first half of 2011 was primarily caused by the cost of oil reaching $114 per barrel, rising
Year in review Year in review Global Markets. Year ending: December 31, 2017 CAN: S&P/TSX 16,209 15, % MSCI All Country World Index
 Year in review Year in review Global Markets Year ending: December 31, EQUITY INDICES 29-DEC- 30-DEC- % CHG CAN: S&P/TSX 16,209 15,288 6.0% US: INDU 24,719 19,763 25.1% US: SPX 2,674 2,239 19.4% Nasdaq:
Portugal: GDP growth forecasts for 2018 reviewed upwards to 1.7%
 13 March 217 ECONOMIC ANALYSIS Portugal: GDP growth forecasts for 218 reviewed upwards to 1.7% Myriam Montañez Growth of the Portuguese economy in 4Q16 reached.6% QoQ 1, once again causing positive surprise
FIRST HALF 2012 RESULTS
 Press Release FIRST HALF 2012 RESULTS Santander registered attributable net profit of EUR 1.704 billion (-51%), after covering 70% of real estate provisions required by the latest Spanish regulations Pre-provision
INVESTMENT UPDATE. 4th May 2016 PERFORMANCE UPDATE
 INVESTMENT UPDATE 4th May 2016 PERFORMANCE UPDATE ASSET CLASS REVIEW SPOTLIGHT ON WOODFORD EQUITY INCOME FUND WHAT RISK ARE YOU TAKING WITH YOUR MONEY? FINAL COMMENT PERFORMANCE UPDATE The beginning of
ABI-CERVED OUTLOOK ON BAD LOANS TO BUSINESSES
 1/2 3,6k 1.000 1k 1,5k ABI-CERVED OUTLOOK ON BAD LOANS TO BUSINESSES Estimates and forecasts of the rates of new bad loans owed by non-financial companies, with breakdowns DECEMBER 2015 #2 (2 a+2b) 12,5%
Global Equity Trading Volumes Surge 36% in 1 st half 2015 driven by Mainland China
 EMBARGO: :1BST/1:1CET/19:1EDT Global Equity Trading Volumes Surge 36% in 1 st half 215 driven by Mainland China Global Equity Trading Volumes Ex Mainland China Up 5% Mainland China Share Trading Vols Rise
CHAIRMAN S REPORT GENERAL SHAREHOLDERS MEETING ACERINOX, S.A.
 CHAIRMAN S REPORT GENERAL SHAREHOLDERS MEETING ACERINOX, S.A. 1st June 26 1 Ladies and Gentlemen, As in previous years, before discussing what year 25 has been for our Society and its Group, please allow
Portuguese Banking System: latest developments. 1 st quarter 2018
 Portuguese Banking System: latest developments 1 st quarter 218 Lisbon, 218 www.bportugal.pt Prepared with data available up to 27 th June of 218. Macroeconomic indicators and banking system data are quarterly
Investor Day Isbergues November 26, Sandeep Jalan Chief Financial Officer. Aperam 0
 Investor Day Isbergues November 26, 2014 Sandeep Jalan Chief Financial Officer Aperam 0 Disclaimer Forward-Looking Statements This document may contain forward-looking information and statements about
Report for August 2017
 Report for ust 2017 Issued ust 31, 2017 National Association of Credit Management Combined Sectors At least the ride seems to have come to an end, but nobody really knows for how long. The data this month
Management Report. Banco Espírito Santo do Oriente, S.A.
 Management Report Banco Espírito Santo do Oriente, S.A. Summary of Management Report International Economic Framework The year under review was marked by a slowdown in global economic activity and GDP
Asia/Pacific Economic Overview
 Copyright E. I. du Pont de Nemours and Company. All rights reserved. Distribution, reproduction or copying of this copyrighted work without express written permission of DuPont is prohibited. Asia/Pacific
FY ended March 31, 2015 Restated *1. Year-on year change. Difference (forecast/ actual) FY ended December 31, December 31, 2015 Forecast *2
 FY ended December 31, December 31, 2015 Forecast *2") February 12, 2016 ISEKI & CO., LTD. Supplementary Information to Consolidated Financial Results (April 1, ) I. Consolidated business results for the fiscal year ended (Billions of yen, %) March 31, Restated
February 12, 2016 ISEKI & CO., LTD. Supplementary Information to Consolidated Financial Results (April 1, ) I. Consolidated business results for the fiscal year ended (Billions of yen, %) March 31, Restated
Interim Report January March 2016
 Q1 Interim Report January March 2016 Published on April 28, 2016 WACKER is one of the world s largest producers of hyperpure polycrystalline silicon, which is the key raw material for solar cells and semiconductors.
The Forecast for Emerging Markets
 The Forecast for Emerging Markets Monday, April 27, 2009 09:30 AM - 10:45 AM Moderator Komal Sri-Kumar, Managing Director, Chief Global Strategist, TCW Group Inc.; Senior Fellow, Milken Institute Speakers
BDO MONTHLY BUSINESS TRENDS INDICES March Copyright BDO LLP. All rights reserved.
 BDO MONTHLY BUSINESS TRENDS INDICES March 2018 Copyright BDO LLP. All rights reserved. INTRODUCTION The BDO Monthly Trends Indices are polls of polls that pull together the results of all the main UK business
Zenith Monthly Economic Report December 2011
 Zenith Monthly Economic Report December 211 ECONOMIC STATISTICS SUMMARY Cash Rate Inflation Rate (%) Unemployment Rate (%) GDP Annual Growth (%) Country Latest Last Change Latest Change Latest Change Past
Asian Insights What to watch closely in Asia in 2016
 Asian Insights What to watch closely in Asia in 2016 Q1 2016 The past year turned out to be a year where one of the oldest investment adages came true: Sell in May and go away, don t come back until St.
KEY BUSINESS INDICATORS AND FINANCIAL INFORMATION
 02.2 KEY BUSINESS INDICATORS AND FINANCIAL INFORMATION AT YEAR-END 2017, BANKIA INCREASED ITS PROFIT AND MAINTAINED ITS DIVIDEND PER SHARE, AFTER THE MERGER WITH BMN. During 2017 Bankia strengthened its
MANAGEMENT REPORT AS OF THE FIRST HALF OF 2012
 MANAGEMENT REPORT AS OF THE FIRST HALF OF 212 2 Highlights > Turnover rose approximately 4%, exceeding 1.12 billion > Group s international activity reached approximately 6% of total turnover > EBITDA
1. Executive Summary Chairman s Message Steel Industry Overview Standalone Financial Performance 7
 Table of Contents 1. Executive Summary 3 2. Chairman s Message 4 3. Steel Industry Overview 5 4. Standalone Financial Performance 7 5. Quarterly Performance Trends 10 6. Graphite India: At a Glance 12
Quarterly market summary
 Quarterly market summary 4th Quarter 2016 Economic overview Economies around the world appear to be relatively resilient, with data signalling that in many countries, economic activities are expanding
SECTOR OUTLOOK INDICATORS AND UP TO DATE FIGURES
 SECTOR OUTLOOK INDICATORS AND UP TO DATE FIGURES October 2017 STILL ONGOING GROWTH DURING FOURTH QUARTER Exports already suffer the impact of the strong euro; Russia is slowly coming back Positive outlook
> 7. equity and Bankinter shares $ $ > 1 +
 hare p orman equity and shares 3 3 3 5 5 5 5 3 $ $ $ $ > > > > 8 88 8 3 3 5 > 8 8 Annual Report 3. Business. Innovation Equity and rating The Group has an efficient equity structure, with the creation