GENERAL SHAREHOLDERS MEETING ACERINOX Business Year 2012
|
|
|
- Marylou Porter
- 6 years ago
- Views:
Transcription
1 GENERAL SHAREHOLDERS MEETING ACERINOX Business Year 2012 Madrid, June 5th 2013

2 ACERINOX EUROPA FACTORY

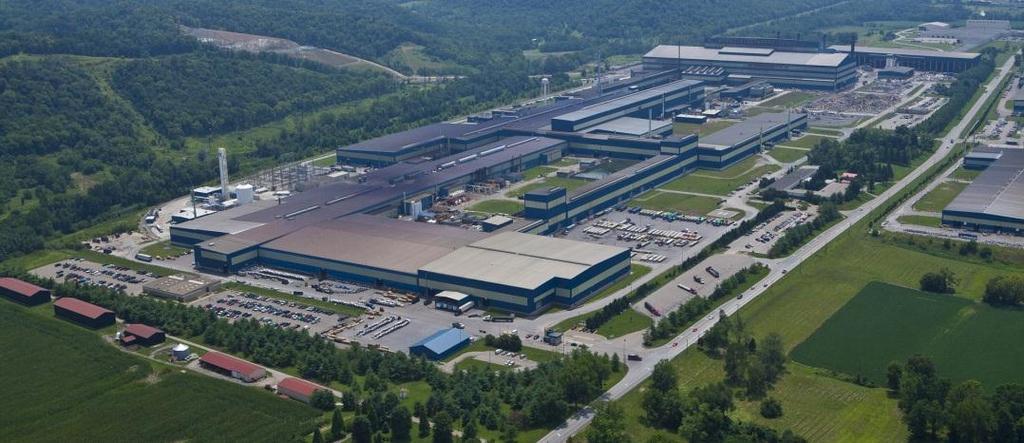
3 NORTH AMERICAN STAINLESS FACTORY
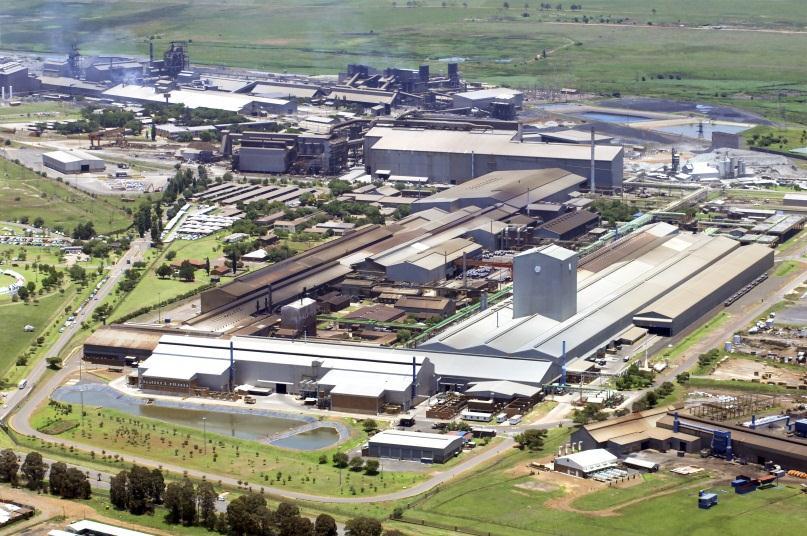
4 COLUMBUS STAINLESS FACTORY

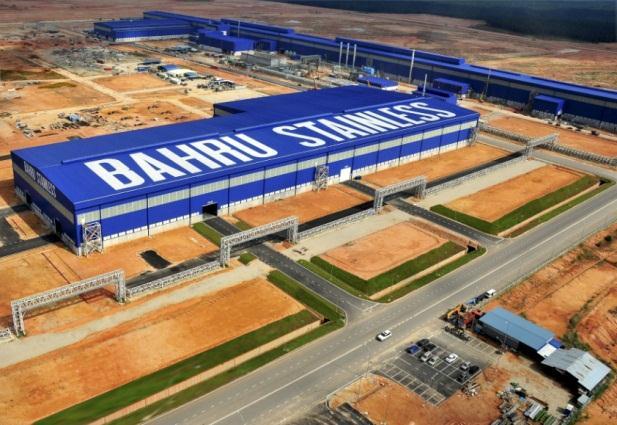
5 BAHRU STAINLESS FACTORY

6 ROLDAN FACTORY

7 INOXFIL FACTORY

8 GEOGRAPHICAL DISTRIBUTION OF ACERINOX NET SALES Year 2012 Oceania 0.5% Europe 37.2% Africa 6.3% Asia 7.0% Americas 49.0%


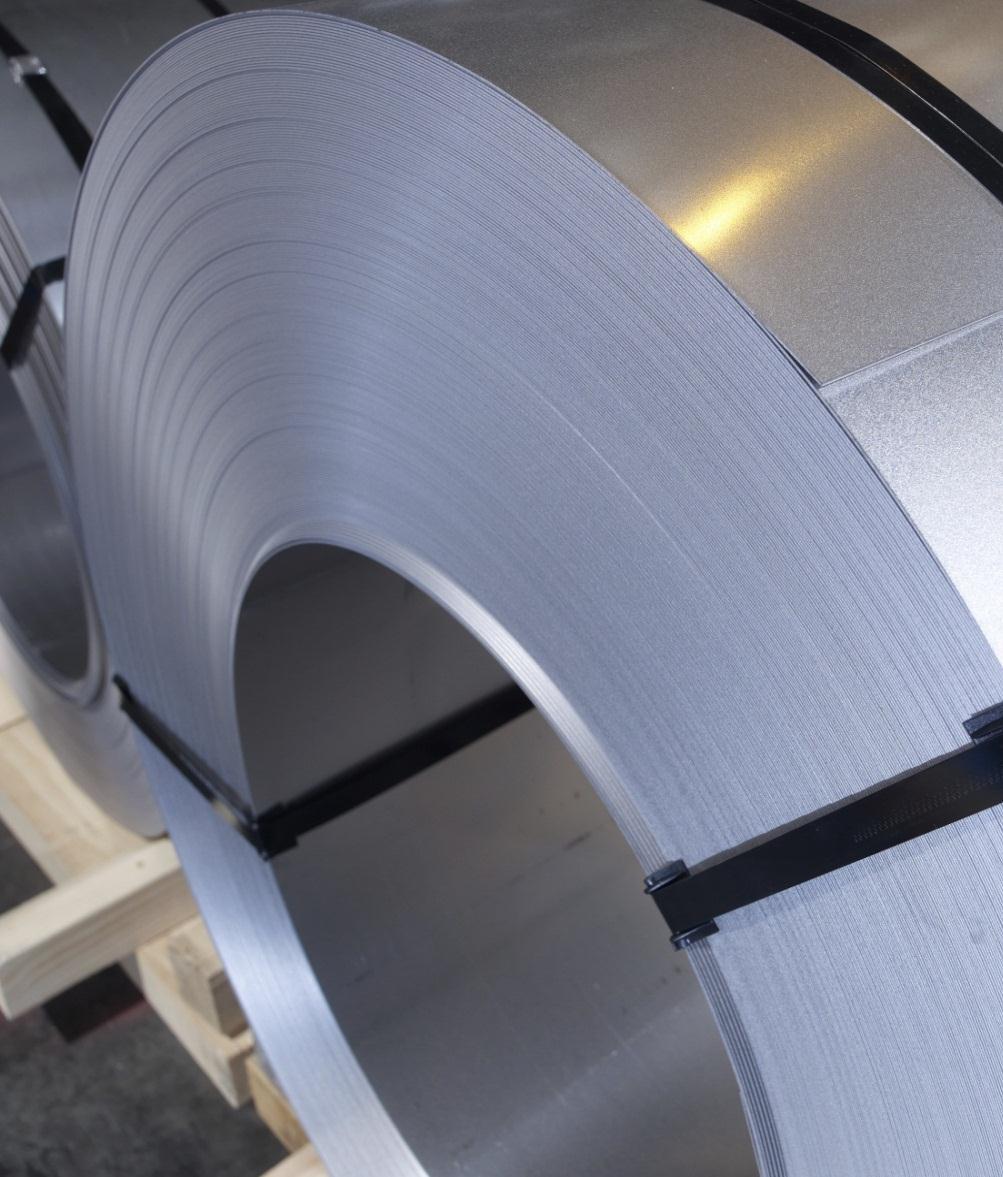
9 STAINLESS STEEL STRIP

10 OFF-SHORE OIL PLANT MADE OF STAINLESS STEEL

11 COOKING SCHOOL KITCHEN MADE OF STAINLESS STEEL

12 SCRAP AND FINISHED PRODUCT

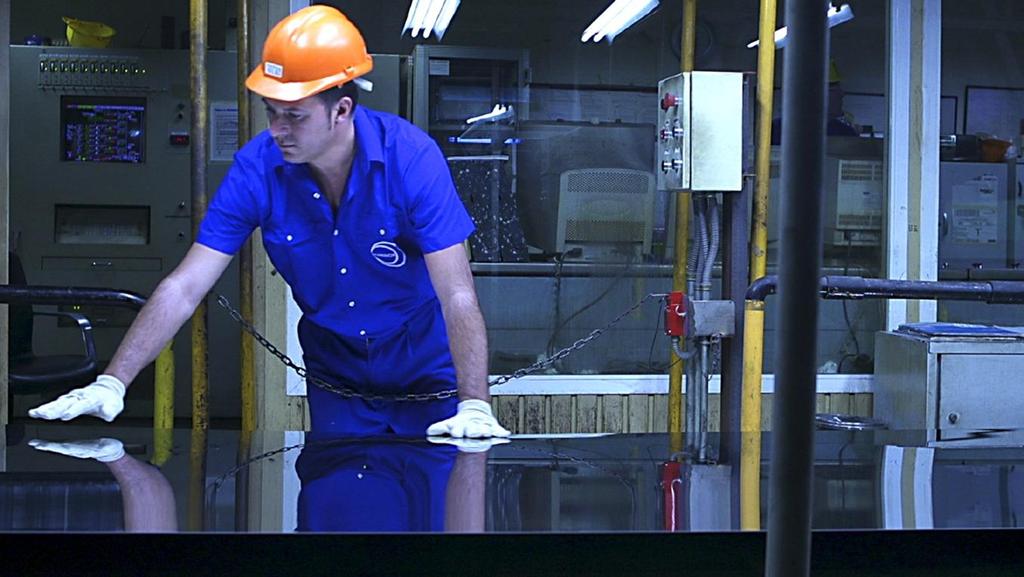
13 MELTING SHOP

14 PORT FACILITIES, ALGECIRAS BAY

15 HOT ROLLING


16 COMMERCIAL NETWORK Service Centers Warehouses Offices Commercial Agents Factories

17 STAINLESS STEEL WORLD PRODUCTION Thousand Mt. 35,000 46,0% 30,000 25,000 20,000 15,000 10, % China Asia w/o China Americas Europe + Africa 5,
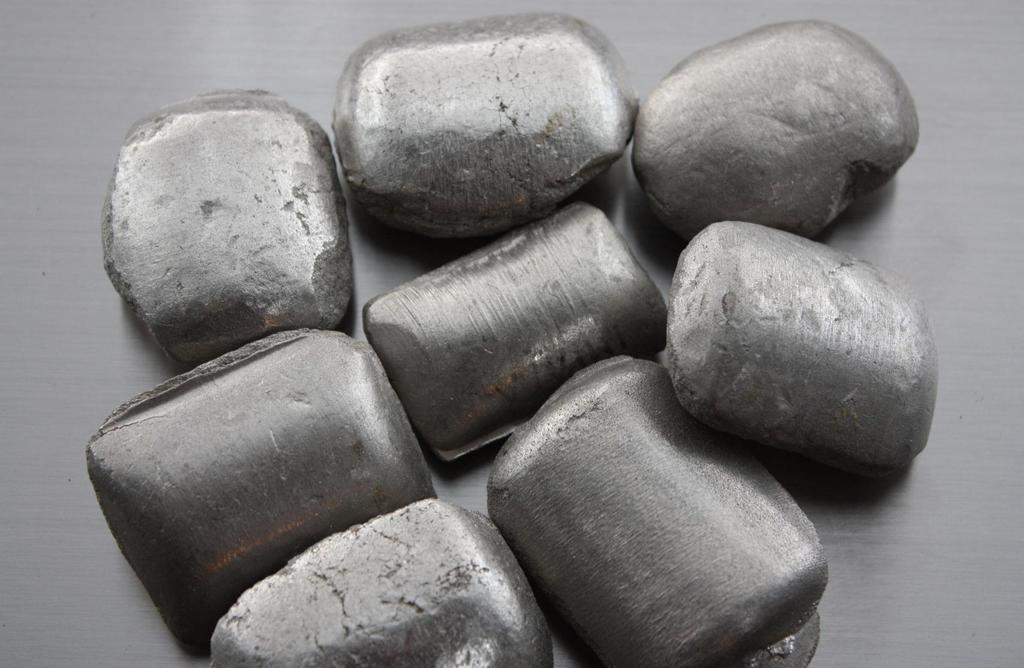
18 NICKEL BRIQUETTES


19 STAINLESS STEEL HOUSEHOLD APLLIANCES

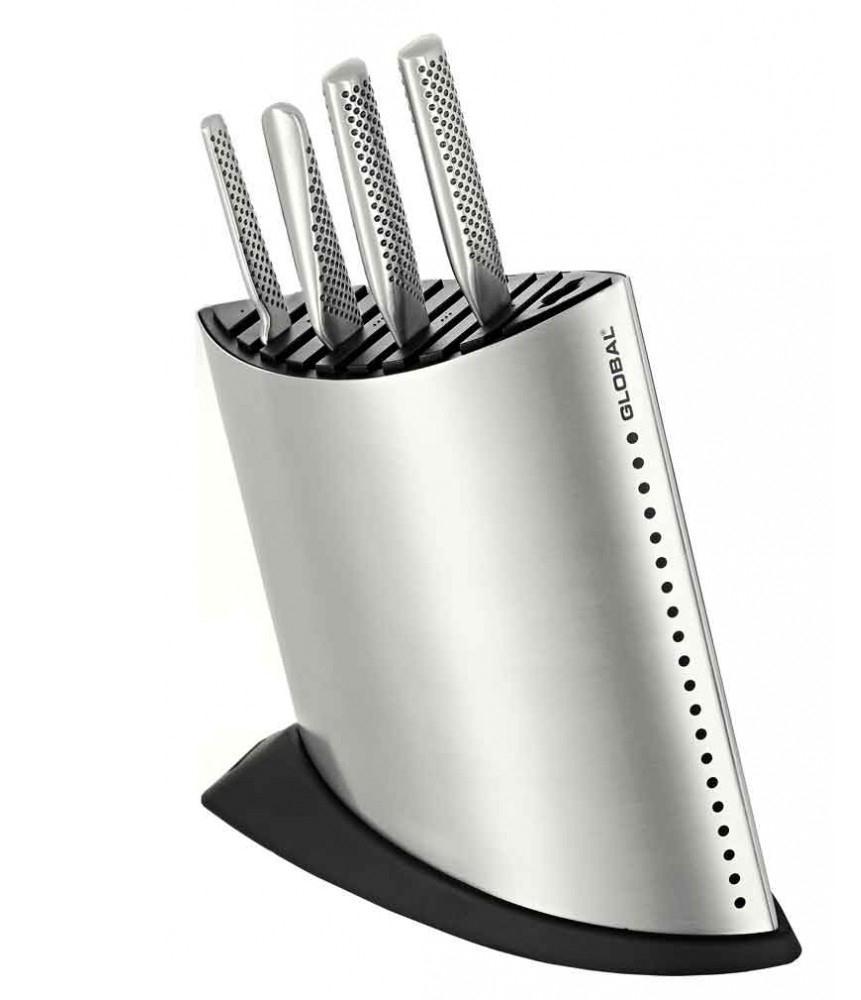
20 STAINLESS STEEL HOUSEHOLD APPLIANCES

21 EUROPEAN CONSOLIDATION I N O X U M A P E R A M O U T O K U M P U A C E R I N O X Melting Shop Factory w/o melting shop

22 ACERINOX EUROPA, CAMPO DE GIBRALTAR FACTORY


23 STAINLESS STEEL WORLD PRODUCTION Thousand Mt. 36,000 34,000 32,000 30,000 28,000 26,000 24,000 22,000 20,000 18,000 16,000 14,000 12,000 10,000 8,000 6,000 4,000 2, Stainless Steel World Production: 35.4 million Mt Compound annual growth rate : + 5.9% Source: VALE INCO & ISSF
24 EVOLUTION OF THE STAINLESS STEEL WORLD PRODUCTION Million Mt. Year 2008 Year 2009 Year 2010 Year 2011 Year % +26.4% +8.1% +5.2% Europe and Africa Asia Americas Source: ISSF

25 APPARENT CONSUMPTION % Variation over 2011 Europe -3.1% United States +8.8% Asia +2.4% South Africa +8.0%
26 OFFICIAL NICKEL PRICE IN THE L.M.E. [ ] Average price: cash / three months (USD/Mt. Ni.) 35,000 30,000 25,000 20,000 15,000 10, ,000 0 J F M A M J J A S O N D J F M A M J J A S O N D
27 RAW MATERIALS PRICE IN THE L.M.E. Year 2012 Daily values (US$/Mt. 3 months) 2,500 25,000 10,000 2,500 2,250 22,500 9,000 2,250 2,000 20,000 8,000 2,000 1,750 17,500 7,000 1,750 1,500 15,000 Jan Feb Mar Apr May Jun Jul Aug Sep Oct Nov Dec 6,000 1,500 Aluminium Nickel Copper Zinc
![PRODUCTION OF ACERINOX Year 2012 Flat Product [Mt] ACERINOX EUROPA NAS COLUMBUS BAHRU TOTAL Variation over 2011 MELTING SHOP 676,034 1,008,516 504,531 2,189,081 8.](/docs-images/73/68762299/images/28-0.jpg "3% HOT ROLLING 568,949 853,175 492,786 1,914,910 7.6% COLD ROLLING 431,400 664,435 265,775 56,482 1,418,092 11.")
28 PRODUCTION OF ACERINOX Year 2012 Flat Product [Mt] ACERINOX EUROPA NAS COLUMBUS BAHRU TOTAL Variation over 2011 MELTING SHOP 676,034 1,008, ,531 2,189, % HOT ROLLING 568, , ,786 1,914, % COLD ROLLING 431, , ,775 56,482 1,418, % Long Product [Mt] ROLDAN NAS TOTAL Variation over 2011 HOT ROLLING 90, , , % FINISHED PRODUCTS 84, , , %
29 MAIN FINANCIAL FIGURES OF ACERINOX Variation Net Sales 4, , % EBITDA % Results after Taxes and Minorities Net Financial Debt % Net Financial Deb / EBITDA % Net Financial Debt / Equity 33.9% 47.1% -28.0%


30 EVOLUTION OF THE STOCK EXCHANGE MARKET - ACERINOX & IBEX 35 Daily percentage data, year 2012 Acerinox Ibex 35 0,35 0,35 0,35 0,35 Jan Feb Mar Apr May Jun Jul Aug Sep Oct Nov Dec
31 EVOLUTION OF THE INVENTORIES OF ACERINOX % D J F M A M J J A S O N D J F M A M J J A S O N D J F M A M J J A S O N D J F M A M J J A S O N D J F M A M J J A S O N D J F M A M J J A S O N D -5% -10% -15% -20% -25% -30% -35% -40% -45% -50%
32 NET FINANCIAL DEBT OF THE CONSOLIDATED GROUP Million Euros 1,400 1,254 1,200 1,075 1,084 1,


33 CURRENT CREDIT LINES IN ACERINOX GROUP December 2012 Used credit facilities Syndicated Loan: 482 million USD Available credit facilities
34 RETURN TO SHAREHOLDERS Euros / Share Attendance Bonus AGM Issue Premium Refund Dividend
35 STRATEGIC PLAN GENERATIONAL TRANSITION PLAN GROUP CULTURE MODERN STRUCTURE EXCELLENCE PLANS GLOBAL EXPANSION
36 INVESTMENTS OF THE CONSOLIDATED GROUP Million Euros Acerinox, S.A Acerinox Europa NAS Columbus Bahru Stainless Roldan and Inoxfil Spanish Trading Companies Overseas T rading Companies T otal
37 COMMERCIAL NETWORK Service Centers Warehouses Offices Commercial Agents Factories

38 BAHRU STAINLESS FACTORY

39 BAHRU STAINLESS: TECHNICAL ASSISTANCE


40 BAHRU STAINLESS COMMERCIAL EXPANSION Offices Commercial Agents


41 FIRST COIL PROCESSED IN THE ANNEALING AND PICKLING LINE AP 2
42 EXCELLENCE PLAN Excellence Plan I Excellence plan II Excellence plan III chapters 15 chapters 16 chapters Internal benchmarking Internal benchmarking Internal benchmarking Realistic targets Recurrent savings: 133 million /year Result: 73% (97 million ) Realistic targets (including part of Excellence I) Recurrent savings: 90 million /year Already reach: 59% (53 million ) Realistic targets (including part of Excellence I and II) Recurrent savings: 60 million /year
43 PROCESSING LINE

44 RESEARCH AND DEVELOPMENT

45 PORT FACILITIES, ALGECIRAS BAY

46 START UP OF THE INTERNAL TRAINEE PROGRAMS


47 ENVIRONMENTAL COMMITMENT C a r b o n D i s c l o s u r e G l o b a l R e p o r t i n g I n i t i a t i v e ( G R I )
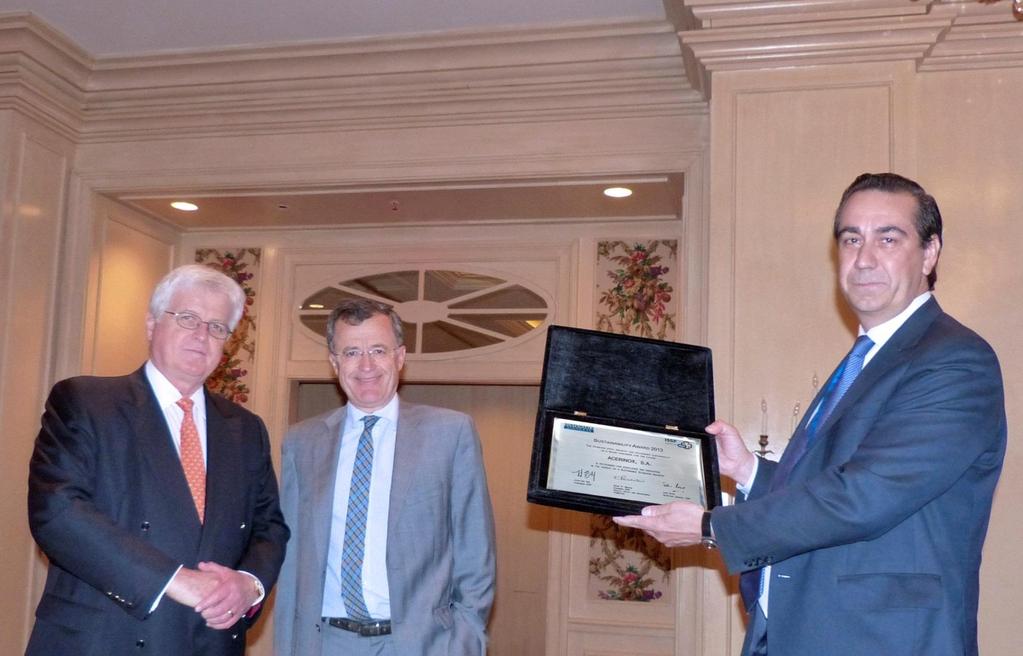
48 2013 SUSTAINABILITY AWARD


49 INTERNACIONAL RECOGNITION OF ACERINOX Mr. Felipe de Borbon presents to Acerinox the Award for the International Career of the Spanish Company (Círculo de Empresarios, January 2012) Acerinox receives the Trade & Innovation Award for its expansion in the US (AmChamSpain, September 2012)
50 <

51 Thank you very much
BUSINESS YEAR 2009 RESULTS
 BUSINESS YEAR 2009 RESULTS Madrid, 26 February 2010 WORLD PRODUCTION OF STAINLESS STEEL Thousand Mt. 30,000 28,000 26,000 24,000 22,000 20,000 18,000 16,000 14,000 12,000 10,000 8,000 6,000 4,000 2,000
Acerinox Results as of 30 September 2014 Results as of 30 September 2014
 Results as of 30 September 2014 Page 0 / 9 Results as of 30 September 2014 In the first nine months of the year, Acerinox has achieved a profit after taxes and minorities of 133.8 million euros Improvement
Results on 31 March, 2018
 Results on 31 March, 2018 Free translation from the original in Spanish. In the event of discrepancy, the Spanish-language version prevails Page 0 / 13 DISCLAIMER This document has been drawn up in good
Contents. Acerinox Group in Figures Letter from the Chairman Letter from the Chief Executive Officer... 8
 REPORT 2012 REPORT 2012 Contents Acerinox Group in Figures... 4 Letter from the Chairman... 6 Letter from the Chief Executive Officer... 8 1. Directors Report of Acerinox... 15 1. World Production...
MR. VICTORIANO MUÑOZ CAVA
 SPEECH OF MR. VICTORIANO MUÑOZ CAVA CHAIRMAN AND CHIEF EXECUTIVE OFFICER GENERAL SHAREHOLDERS MEETING Madrid, 14th June 27 Dear shareholders: I am pleased to inform you about the economic results of year
Summary. The ACERINOX Group in figures 6. Letter from the Chairman 8
 ANNUAL REPORT 2005 2 Summary 3 The ACERINOX Group in figures 6 Letter from the Chairman 8 1. Directors Report of the Consolidated Group 13 1. Productions 14 2. Raw Materials 16 3. Markets 20 4. Sales 24
Index. ACERINOX in numbers Letter from the Chairman Letter from the Chief Executive Officer Directors Report...
 ANNUAL REPORT2016 REPORT 2016 2 Index ACERINOX in numbers... 4 Letter from the Chairman... 6 Letter from the Chief Executive Officer... 10 Directors Report...16 1. Our business...18 1.1 Production Companies...20
CONTENTS. Acerinox Group in Figures Letter from the Chairman Letter from the Chief Executive Officer... 8
 REPORT 2013 REPORT 2013 CONTENTS Acerinox Group in Figures... 4 Letter from the Chairman... 6 Letter from the Chief Executive Officer... 8 Directors Report of Acerinox... 15 Acerinox 1. A Spanish Multinational
XML Publisher Balance Sheet Vision Operations (USA) Feb-02
 Feb-02") Page:1 Apr-01 May-01 Jun-01 Jul-01 ASSETS Current Assets Cash and Short Term Investments 15,862,304 51,998,607 9,198,226 Accounts Receivable - Net of Allowance 2,560,786
Page:1 Apr-01 May-01 Jun-01 Jul-01 ASSETS Current Assets Cash and Short Term Investments 15,862,304 51,998,607 9,198,226 Accounts Receivable - Net of Allowance 2,560,786
1Q of FY ending December 31, (0.2) (1.9) 11.3 (0.2) (0.2) (0.2) (0.2) (1.2) (89.2) 0.1
 (1.9) 11.3 (0.2) (0.2) (0.2) (0.2) (1.2) (89.2) 0.1") August 6, ISEKI & CO., LTD. Supplementary Information to Consolidated Financial Results (April 1, June 30, ) I. Consolidated business results for the three months ended June 30, (Billions of yen, %) Year-on
August 6, ISEKI & CO., LTD. Supplementary Information to Consolidated Financial Results (April 1, June 30, ) I. Consolidated business results for the three months ended June 30, (Billions of yen, %) Year-on
Annual Accounts February 1, 2007 Juha Rantanen, CEO.
 Annual Accounts 2006 February 1, 2007 Juha Rantanen, CEO www.outokumpu.com Highlights in 2006 Market development Improvement actions update and strategic direction Annual Accounts 2006 Outlook 2 February
Solidly on track in achieving our targets
 Solidly on track in achieving our targets Roeland Baan, CEO Credit Suisse Steel & Mining Conference September 12, 2017 Disclaimer This presentation contains, or may be deemed to contain, statements that
Investor Day Isbergues November 26, Sandeep Jalan Chief Financial Officer. Aperam 0
 Investor Day Isbergues November 26, 2014 Sandeep Jalan Chief Financial Officer Aperam 0 Disclaimer Forward-Looking Statements This document may contain forward-looking information and statements about
Months Consolidated Results. 28 April 2015
 1 28.04.2015 2015 3 Months Consolidated Results 28 April 2015 2 28.04.2015 DISCLAMIER Ereğli Demir Çelik Fabrikaları T.A.Ş. (Erdemir) may, when necessary, make written or verbal announcements about forward-looking
Southern Copper Corporation Highlights
 Southern Copper Corporation Highlights ht Southern Copper Corporation Highlights March 2009 January 2009 0 Safe Harbor Statement This presentation contains forward-looking statements, as defined by federal
Erdemir Group 2011 First Quarter Consolidated Financial Results. 06 May 2011
 Erdemir Group 2011 First Quarter Consolidated Financial Results 06 May 2011 2 / 26 DISCLAIMER Ereğli Demir Çelik Fabrikaları T.A.Ş. (Erdemir) may, when necessary, make written or verbal announcements about
CHAIRMAN S REPORT GENERAL SHAREHOLDERS MEETING ACERINOX, S.A.
 CHAIRMAN S REPORT GENERAL SHAREHOLDERS MEETING ACERINOX, S.A. 1st June 26 1 Ladies and Gentlemen, As in previous years, before discussing what year 25 has been for our Society and its Group, please allow
Nickel Market Outlook
 22/9/215 Nickel Market Outlook Stuart Harshaw This presentation may include statements that present Vale's expectations about future events or results. All statements, when based upon expectations about
Financial Statements Release 2017
 Financial Statements Release 217 CEO Roeland Baan CFO Chris de la Camp January 31, 218 Disclaimer This presentation contains, or may be deemed to contain, statements that are not historical facts but forward-looking
Highlights of Consolidated Results for the First Half and the Second Quarter of Fiscal Year ending March 31, 2016
 Highlights of Consolidated Results for the First Half and the Second Quarter of Fiscal Year ending March 31, 2016 (except for per share amounts) November 2, Six months ended Six months ended September
Months Consolidated Results. 25 April 2016
 1 25.04.2016 2016 3 Months Consolidated Results 25 April 2016 2 25.04.2016 DISCLAMIER Ereğli Demir Çelik Fabrikaları T.A.Ş. (Erdemir) may, when necessary, make written or verbal announcements about forward-looking
Q results. CEO Roeland Baan CFO Chris de la Camp. July 24, 2018
 Q2 2018 results CEO Roeland Baan CFO Chris de la Camp July 24, 2018 Disclaimer This presentation contains, or may be deemed to contain, statements that are not historical facts but forward-looking statements.
Autumn conference, Kepler Cheuvreux September 19 th, Aperam 1
 Autumn conference, Kepler Cheuvreux September 19 th, 2013 Aperam 1 Disclaimer Forward-Looking Statements This document may contain forward-looking information and statements about Aperam and its subsidiaries.
DG Gel cards for diagnosis in immunohaematology laboratories
 S E C O N D H A L F R E S U L T S 2 0 0 7 DG Gel cards for diagnosis in immunohaematology laboratories 2 G R I F O L S 2 0 0 7 General evolution of the year 2007 Total revenue amounted to 703.3MM euros,
Fourth Quarter 2016 Performance Summary
 Fourth Quarter 2016 Performance Summary Operational and Financial Highlights - 2016 Net profit rises by +2.5% to Euros 545.5 million Recurring sales (excluding Raw Materials and Others) rise by +4.5% (+4.6%
QUESTION 2. QUESTION 3 Which one of the following is most indicative of a flexible short-term financial policy?
 QUESTION 1 Compute the cash cycle based on the following information: Average Collection Period = 47 Accounts Payable Period = 40 Average Age of Inventory = 55 QUESTION 2 Jan 41,700 July 39,182 Feb 18,921
The LME Strategic pathway: how the exchange will continue to support the tin market
 Public The LME Strategic pathway: how the exchange will continue to support the tin market 6 th Annual Beer & Co. Tin Conference November 2018 SETTING THE GLOBAL STANDARD Strategic Pathway: overview 2
Spheria Australian Smaller Companies Fund
 29-Jun-18 $ 2.7686 $ 2.7603 $ 2.7520 28-Jun-18 $ 2.7764 $ 2.7681 $ 2.7598 27-Jun-18 $ 2.7804 $ 2.7721 $ 2.7638 26-Jun-18 $ 2.7857 $ 2.7774 $ 2.7690 25-Jun-18 $ 2.7931 $ 2.7848 $ 2.7764 22-Jun-18 $ 2.7771
Six months of FY ending December 31, (0.4) (1.9) 22.5 (0.4) (0.3) (0.4) (0.1) (0.4) (0.7) (2.0) 0.9 (1.
 (1.9) 22.5 (0.4) (0.3) (0.4) (0.1) (0.4) (0.7) (2.0) 0.9 (1.") November 11, ISEKI & CO., LTD. Supplementary Information to Consolidated Financial Results (April 1, September 30, ) I. Consolidated business results for the six months ended September 30, (Billions of
November 11, ISEKI & CO., LTD. Supplementary Information to Consolidated Financial Results (April 1, September 30, ) I. Consolidated business results for the six months ended September 30, (Billions of
Positive trend in earnings and strong cash flow
 Positive trend in earnings and strong cash flow Presentation of the Q3/2017 result Martin Lindqvist, President & CEO Håkan Folin, CFO October 25, 2017 Agenda Q3/2017 and performance by division Financials
Financial & Business Highlights For the Year Ended June 30, 2017
 Financial & Business Highlights For the Year Ended June, 17 17 16 15 14 13 12 Profit and Loss Account Operating Revenue 858 590 648 415 172 174 Investment gains net 5 162 909 825 322 516 Other 262 146
Business & Financial Services December 2017
 Business & Financial Services December 217 Completed Procurement Transactions by Month 2 4 175 15 125 1 75 5 2 1 Business Days to Complete 25 Jan Feb Mar Apr May Jun Jul Aug Sep Oct Nov Dec 217 Procurement
2008 FIRST QUARTER REPORT
 2008 FIRST QUARTER REPORT Net profit totalled 31.1 million euros, up +33% on the previous year Revenue rose +10.9% to 201.7 million euros EBITDA, with the sales margin widening to 29.5%, climbed +30% to
Third-quarter earnings burdened by raw material-related losses. Group adjusted EBITDA at EUR 56 million
 1 (23) Contents Highlights in the third quarter of 2017... 2 Highlights during the first nine months of 2017... 2 Business and financial outlook for the fourth quarter of 2017... 3 CEO Roeland Baan...
Second Quarter 2014 Results. July 24, 2014
 Second Quarter 2014 Results July 24, 2014 Forward Looking Information Both these slides and the accompanying oral presentation contain certain forward-looking statements within the meaning of the United
Asset Manager Performance Comparison
 Cape Peninsula University of Technology Retirement Fund August 2017 DISCLAIMER AND WARNINGS: Towers Watson (Pty) Ltd, a Willis Towers Watson company, is an authorised financial services provider. Although
SMM Quantitative Trading Strategy
 SMM Quantitative Trading Strategy Contract Arbitrage Type SHFE Copper None SHFE Aluminum None SHFE Lead SHFE Zinc Non-Ferrous SHFE Nickel SHFE Steel Rebar SHFE Hot-rolled coil Ferrous DCE Iron Ore None
Southern Copper Corporation November, 2016
 Southern Copper Corporation November, 2016 0 I. Introduction 1 Management Presenter Presenters Raul Jacob Title Vice President, Finance & CFO 2 Safe Harbor Statement This presentation contains certain
Asset Manager Performance Comparison
 Cape Peninsula University of Technology Retirement Fund September 2017 DISCLAIMER AND WARNINGS: Towers Watson (Pty) Ltd, a Willis Towers Watson company, is an authorised financial services provider. Although
Hulamin Limited Interim Results Presentation
 Hulamin Limited Interim Results Presentation For the half-year ended 30 June 2009 Abnormal Market Conditions Sharpest fall in global consumption of aluminium since 1975 oil shock Rolled products and extrusions
TERMS OF REFERENCE FOR THE INVESTMENT COMMITTEE
 I. PURPOSE The purpose of the Investment Committee (the Committee ) is to recommend to the Board the investment policy, including the asset mix policy and the appropriate benchmark for both ICBC and any
Interim Report Q3 2013
 Interim Report Q3 2013 CEO Mika Seitovirta CFO Reinhard Florey November 1, 2013 Disclaimer This presentation contains, or may be deemed to contain, statements that are not historical facts but forward-looking
WESTWOOD LUTHERAN CHURCH Summary Financial Statement YEAR TO DATE - February 28, Over(Under) Budget WECC Fund Actual Budget
 Budget WECC Fund Actual Budget") WESTWOOD LUTHERAN CHURCH Summary Financial Statement YEAR TO DATE - February 28, 2018 General Fund Actual A B C D E F WECC Fund Actual Revenue Revenue - Faith Giving 1 $ 213 $ 234 $ (22) - Tuition $ 226
WESTWOOD LUTHERAN CHURCH Summary Financial Statement YEAR TO DATE - February 28, 2018 General Fund Actual A B C D E F WECC Fund Actual Revenue Revenue - Faith Giving 1 $ 213 $ 234 $ (22) - Tuition $ 226
THE B E A CH TO WN S O F P ALM B EA CH
 THE B E A CH TO WN S O F P ALM B EA CH C OU N T Y F LO R I D A August www.luxuryhomemarketing.com PALM BEACH TOWNS SINGLE-FAMILY HOMES LUXURY INVENTORY VS. SALES JULY Sales Luxury Benchmark Price : 7,
Commodities Observing the fundamentals Written by: Dwayne Dippenaar, Research Analyst at Laurium Capital
 FUNDS ON FRIDAY b y G l a c i e r R e s e a r c h 24 J u n e 2 0 1 6 V o l u m e 8 6 7 Commodities Observing the fundamentals Written by: Dwayne Dippenaar, Research Analyst at Laurium Capital The South
Iron Ore & Steel Derivatives Let the Battle Begin
 Iron Ore & Steel Derivatives Let the Battle Begin Topics Raw Material Price Volatility Financial Hedging Attributes Iron Ore World Steel Exchange Scrap Presented by: DATE: Tuesday November 30, 2010 Patrick
Erdemir Group Months Consolidated Financial Results
 1 / 35 Erdemir Group 2014 9 Months Consolidated Financial Results 28 October 2014 2 / 35 DISCLAIMER Ereğli Demir Çelik Fabrikaları T.A.Ş. (Erdemir) may, when necessary, make written or verbal announcements
Webcast Third Quarter 2005 Results. Presentation:11/10/05 Paulo Penido Pinto Marques Director of Finance and Investor Relations
 Webcast Third Quarter 2005 Results Presentation:11/10/05 Paulo Penido Pinto Marques Director of Finance and Investor Relations Disclaimer Declarations relative to business perspectives of the Company,
Erdemir Group Months Consolidated Financial Results
 1 / 35 Erdemir Group 2014 6 Months Consolidated Financial Results 12 August 2014 2 / 35 DISCLAIMER Ereğli Demir Çelik Fabrikaları T.A.Ş. (Erdemir) may, when necessary, make written or verbal announcements
SCHMOLZ + BICKENBACH Investor Presentation Q3/9M 2015 Results Lucerne, 12 November 2015
 SCHMOLZ + BICKENBACH Investor Presentation Q3/9M 20 Results Lucerne, 2 November 20 Disclaimer This publication constitutes neither a prospectus within the meaning of article 652a and/or 6 of the Swiss
GCL Holdings Group. Company presentation 1H 2013 results
 GCL Holdings Group Company presentation 1H 2013 results Alessandria, September 13, 2013 Forward-looking statements This presentation may include, and the Company and its representatives may from time to
Cost Estimation of a Manufacturing Company
 Cost Estimation of a Manufacturing Company Name: Business: Date: Economics of One Unit: Manufacturing Company (Only complete if you are making a product, such as a bracelet or beauty product) Economics
Global Metals & Mining/Steel Conference. November 20, 2014
 Global Metals & Mining/Steel Conference November 20, 2014 Forward Looking Information Both these slides and the accompanying oral presentation contain certain forward-looking statements within the meaning
GCL Holdings Group. Company presentation 9M 2015 results
 GCL Holdings Group Company presentation 9M results November 27, Forward-looking Statements This presentation may include, and the Company and its representatives may from time to time make, written or
Erdemir Group Months Consolidated Financial Results. 11 November 2013
 Erdemir Group 2013 9 Months Consolidated Financial Results 11 November 2013 2 / 32 DISCLAIMER Ereğli Demir Çelik Fabrikaları T.A.Ş. (Erdemir) may, when necessary, make written or verbal announcements about
Blackstone s 2Q 18 Supplemental Financial Data. July 19, 2018
 Blackstone s 2Q 18 Supplemental Financial Data July 19, 2018 Total Segments Year-to-Date (Dollars in Thousands) 1Q'16 2Q'16 3Q'16 4Q'16 1Q'17 2Q'17 3Q'17 4Q'17 1Q'18 2Q'18 2Q'17 2Q'18 Revenues Management
GCL Holdings Group. Company presentation 1Q 2014 results
 GCL Holdings Group Company presentation 1Q 2014 results Alessandria, May 29, 2014 Forward-looking Statements This presentation may include, and the Company and its representatives may from time to time
Highlights of Consolidated Results for Fiscal Year ended March 31, 2016
 May 9, 2016 Highlights of Consolidated Results for Fiscal Year ended March 31, 2016 (except for per share amounts) Year ended Year ended March 31, March 31, 2016 2015 Change Y 745,888 Y 707,237 5.5 Operating
Review of Registered Charites Compliance Rates with Annual Reporting Requirements 2016
 Review of Registered Charites Compliance Rates with Annual Reporting Requirements 2016 October 2017 The Charities Regulator, in accordance with the provisions of section 14 of the Charities Act 2009, carried
Factor Leave Accruals. Accruing Vacation and Sick Leave
 Factor Leave Accruals Accruing Vacation and Sick Leave Factor Leave Accruals As part of the transition of non-exempt employees to biweekly pay, the UC Office of the President also requires standardization
Exam 1 Problem Solving Questions Review
 Exam 1 Problem Solving Questions Review SECTION 1 The following data were obtained from a recent quarterly report for Dell Computer (in millions): Net revenue $8,028 Cost of revenue $6,580 Inventories:
Erdemir Group 2009 Consolidated Financial Results
 Erdemir Group 2009 Consolidated Financial Results 22 February 2010 1 /28 DISCLAIMER Ereğli Demir Çelik Fabrikaları T.A.Ş. (Erdemir) may, when necessary, make written or verbal announcements about forward-looking
Third Quarter 2016 Performance Summary
 Third Quarter 2016 Performance Summary Operational and Financial Highlights - 9M 2016 Sales of the Bioscience Division grow by +6.5%, increasing Grifols revenues to EUR 2,951.7 million over EUR 1,000 million
RESULTS PRESENTATION FOR THE SIX MONTHS ENDED 30 JUNE 2018 PRESENTED BY ZANELE MATLALA (CEO) AND KAJAL BISSESSOR (FD)
 AND KAJAL BISSESSOR (FD)") RESULTS PRESENTATION FOR THE SIX MONTHS ENDED 30 JUNE 2018 i PRESENTED BY ZANELE MATLALA (CEO) AND KAJAL BISSESSOR (FD) Merafe Resources Ltd Results presentation for the year ended 31 December 2017 LEGAL
RESULTS PRESENTATION FOR THE SIX MONTHS ENDED 30 JUNE 2018 i PRESENTED BY ZANELE MATLALA (CEO) AND KAJAL BISSESSOR (FD) Merafe Resources Ltd Results presentation for the year ended 31 December 2017 LEGAL
Petercam's Benelux Conference September 16, Sandeep Jalan Chief Financial Officer. Aperam 1
 Petercam's Benelux Conference September 16, 2014 Sandeep Jalan Chief Financial Officer Aperam 1 Disclaimer Forward-Looking Statements This document may contain forward-looking information and statements
OTHER DEPOSITS FINANCIAL INSTITUTIONS DEPOSIT BARKAT SAVING ACCOUNT
 WEIGHTAGES JAN FEB MAR APR MAY JUN JUL AUG SEPT OCT NOV DEC ANNOUNCEMENT DATE 19.Dez.14 27.Jän.15 24.Feb.15 26.Mär.15 27.Apr.15 26.Mai.15 25.Jun.15 28.Jul.15 26.Aug.15 23.Sep.15 27.Okt.15 25.Nov.15 MUDARIB
KeyBanc Capital Markets Basic Materials and Packaging Conference. September 2017
 KeyBanc Capital Markets Basic Materials and Packaging Conference September 2017 1 Important Information About Ryerson Holding Corporation These materials do not constitute an offer or solicitation to purchase
FY ended March 31, 2015 Restated *1. Year-on year change. Difference (forecast/ actual) FY ended December 31, December 31, 2015 Forecast *2
 FY ended December 31, December 31, 2015 Forecast *2") February 12, 2016 ISEKI & CO., LTD. Supplementary Information to Consolidated Financial Results (April 1, ) I. Consolidated business results for the fiscal year ended (Billions of yen, %) March 31, Restated
February 12, 2016 ISEKI & CO., LTD. Supplementary Information to Consolidated Financial Results (April 1, ) I. Consolidated business results for the fiscal year ended (Billions of yen, %) March 31, Restated
Executive Summary. July 17, 2015
 Executive Summary July 17, 2015 The Revenue Estimating Conference adopted interest rates for use in the state budgeting process. The adopted interest rates take into consideration current benchmark rates
Global Equity Trading Volumes Surge 36% in 1 st half 2015 driven by Mainland China
 EMBARGO: :1BST/1:1CET/19:1EDT Global Equity Trading Volumes Surge 36% in 1 st half 215 driven by Mainland China Global Equity Trading Volumes Ex Mainland China Up 5% Mainland China Share Trading Vols Rise
11-Year Consolidated Financial Highlights
 11-Year Consolidated Financial Highlights As of March 31, 2017 2007.3 2008.3 2009.3 2010.3 Net Sales ( million) 1,376,958 1,487,496 1,660,162 1,415,718 Operating Profit ( million) 162,315 70,048 65,204
Investor Presentation
 March, 2010 1 Disclaimer This document can contain statements which constitute forward-looking statements. Such forward-looking statements are dependent on estimates, data or methods that may be incorrect
30 September 2009 QUARTERLY REPORT ABOUT MINARA
 QUARTERLY REPORT 30 September 2009 ABOUT MINARA Minara Resources Limited is a leading Australian resources company based in Perth, Western Australia. Minara Resources owns and operates the Murrin Murrin
Earnings Results. Second Quarter 2015
 Earnings Results Second Quarter 2015 Forward Looking Statements This presentation contains, or may be deemed to contain, forward-looking statements. By their nature, forward-looking statements involve
HUD NSP-1 Reporting Apr 2010 Grantee Report - New Mexico State Program
 HUD NSP-1 Reporting Apr 2010 Grantee Report - State Program State Program NSP-1 Grant Amount is $19,600,000 $9,355,381 (47.7%) has been committed $4,010,874 (20.5%) has been expended Grant Number HUD Region
The Copper Journal Weekly Report Index Of Charts
 Weekly Report Index Of Charts 1 Price & Inventory Report 2 Base Metals Barometer 3 Year To Date % Price Change 4 LME Nonferrous Metals YTD % Change 5 Precious Metals YTD % Price Change 6 Energy YTD % Price
Nickel Market Analysis
 Nickel Market Analysis When does the nickel price rally come? Kunihiko Mizuno, Nickel trader Disclaimer The statements in this presentation represent the considered views of Sumitomo corporation. It includes
Please scroll to find the 2018 and 2019 global fund holiday calendars.
 Please scroll to find the 2018 and 2019 global fund holiday calendars. 2018 Exchange-Traded fund holiday Vanguard Ireland-domiciled ETFs Jan Feb Mar Apr May Jun 1 2 5 12 15 25 9 12 14 15 16 19 28 20 29
SCHMOLZ + BICKENBACH Analysts/Investors Presentation FY/Q Results. Zurich, 24 March 2016
 SCHMOLZ + BICKENBACH Analysts/Investors Presentation FY/Q4 2015 Results Zurich, 24 March 2016 1 2 3 BUSINESS REVIEW FULL-YEAR 2015 FINANCIAL PERFORMANCE FULL-YEAR / FOURTH QUARTER 2015 ROADMAP & OUTLOOK
2QFY14 Results Presentation
 2QFY14 Results Presentation 1 Key highlights 3QFY14 Standalone performance Consolidated performance Key update Highest ever Crude Steel production: 3.19 million tonnes Gross Turnover: `12,651 crores Net
Monthly Rolling Economic Electronic Presentation August 2017
 CHILE AT A GLANCE Monthly Rolling Economic Electronic Presentation August 2017 CURRENT ECONOMIC PERFORMANCE GDP GROWTH (% over same quarter previous year) 3 2,5 2 1,5 1 0,5 0 QIV 2014 QI 2015 QII 2015
Performance Report October 2018
 Structured Investments Indicative Report October 2018 This report illustrates the indicative performance of all Structured Investment Strategies from inception to 31 October 2018 Matured Investment Strategies
QUARTERLY FINANCIAL REPORT March 31, 2018
 California Independent System Operator QUARTERLY FINANCIAL REPORT March 31, 2018 250 Outcropping Way Folsom, CA 95630 (916) 351-4000 CALIFORNIA INDEPENDENT SYSTEM OPERATOR CORPORATION QUARTERLY FINANCIAL
HIPIOWA - IOWA COMPREHENSIVE HEALTH ASSOCIATION Unaudited Balance Sheet As of July 31
 Unaudited Balance Sheet As of July 31 Total Enrollment: 407 Assets: Cash $ 9,541,661 $ 1,237,950 Invested Cash 781,689 8,630,624 Premiums Receivable 16,445 299,134 Prepaid 32,930 34,403 Assessments Receivable
Southern Copper Corporation
 Southern Copper Corporation June 2010 0 I. Introduction 1 Safe Harbor Statement This presentation contains certain statements that are neither reported financial results nor other historical information.
U.S. Steel Market Outlook. Amy Ebben ArcelorMittal USA November 30, 2018
 U.S. Steel Market Outlook Amy Ebben ArcelorMittal USA November 30, 2018 Agenda ArcelorMittal introduction U.S. steel industry performance and trade Global steel industry Review of steel markets 1 About
Southern Copper Corporation
 Southern Copper Corporation March 2010 0 I. Introduction 1 Management Presenters Presenters Raúl Jacob Title Manager of Financial Planning & IR 2 Corporate Structure 80.0% (*) Public Float 20.0% (*) 99.29
Steel Indexing & Price Transparency
 ISRI Convention & Expo Indexing & Price Transparency Patrick A. McCormick Managing Partner April 20, 2007 1 Price Indexing & Price Transparency New Tools for A New World Economy High Rates of Demand Growth
BAML Leveraged Finance Conference. November 2017
 BAML Leveraged Finance Conference November 2017 1 Important Information About Ryerson Holding Corporation These materials do not constitute an offer or solicitation to purchase or sell securities of Ryerson
Stainless Steel Nickel Hedging
 Stainless Steel Nickel Hedging Presented by Catherine Markey and Robert Fig International Stainless and Special Steel Summit 08 September 2011 - Munich Nickel hedging a stainless example Origins of commodity
Big Walnut Local School District
 Big Walnut Local School District Monthly Financial Report for the month ended September 30, 2013 Prepared By: Felicia Drummey Treasurer BIG WALNUT LOCAL SCHOOL DISTRICT SUMMARY OF YEAR TO DATE FINANCIAL
Loop Capital Metals & Mining Conference. March 2017
 Loop Capital Metals & Mining Conference March 2017 1 IMPORTANT INFORMATION ABOUT RYERSON HOLDING CORPORATION These materials do not constitute an offer or solicitation to purchase or sell securities of
Market analysis. Mines Smelters Zinc Copper. President & CEO Jan Johansson. Boliden s Capital Markets Days 7-8 June 2006 Odda, Norway
 Boliden s Capital Markets Days 7-8 June 2006 Odda, Norway Market analysis President & CEO Jan Johansson Mines Smelters Zinc Copper Boliden s Capital Markets Days 7-8 June 2006 Odda, Norway 2 Continued
Financial Report for the Month of SEPTEMBER
 WILLOUGHBY, OH Financial Report for the Month of SEPTEMBER Month Ended SEPTEMBER 30, 2013 BOARD OF EDUCATION Mrs. Margaret Warner, President SUPERINTENDENT Mr. Steve Thompson Mrs. Sharon Scott, Vice President
Text. improvement in earnings. Textdemand drove continued
 Good Textdemand drove continued improvement in earnings Text Presentation of the Q2/2018 results Martin Lindqvist, President & CEO Håkan Folin, CFO July 20, 2018 Agenda Market and demand trends Performance
LME Copper: Reflecting global supply and demand in the copper price. Matthew Chamberlain Metal Bulletin Copper Conference 26 February 2015
 LME Copper: Reflecting global supply and demand in the copper price Matthew Chamberlain Metal Bulletin Copper Conference 26 February 2015 Copper price Copper volumes and volatility Percentage Thousand
Economic Activity Index ( GDB-EAI ) For the month of May 2013 G O V E R N M E N T D E V E L O P M E N T B A N K F O R P U E R T O R I C O
 For the month of May 2013 G O V E R N M E N T D E V E L O P M E N T B A N K F O R P U E R T O R I C O") Economic Activity Index ( GDB-EAI ) For the month of May 2013 General Commentary May 2013 GDB-EAI for the month of May registered a 3.4% year-over-year ( YOY ) reduction May 2013 EAI was 126.7, a 3.4%
Economic Activity Index ( GDB-EAI ) For the month of May 2013 General Commentary May 2013 GDB-EAI for the month of May registered a 3.4% year-over-year ( YOY ) reduction May 2013 EAI was 126.7, a 3.4%
TUBOS REUNIDOS GROUP. Special Products & Integral Services Worldwide. Tubos Reunidos. November 2014
 Special Products & Integral Services Worldwide Tubos Reunidos 1 Content Tubos Reunidos Group 1. Market and Trends 2. Company Overview 3. 2014 2017 Strategic Plan 4. Financials 2 Tubos Reunidos Group Seamless
Ferrochrome Market Overview 2017
 Ferrochrome Market Overview 217 Presented by: Mark Beveridge Principal Consultant CRU Nickel, Chrome, Stainless Steel Group Key Themes Which factors define the chrome market? 1. Chinese demand and the
Big Walnut Local School District
 Big Walnut Local School District Monthly Financial Report for the month ended September 30, 2012 Prepared By: Felicia Drummey Treasurer BIG WALNUT LOCAL SCHOOL DISTRICT SUMMARY OF YEAR-TO-DATE FINANCIAL