Who is audited? Experimental study on rule-based tax auditing schemes
|
|
|
- Francis Preston
- 6 years ago
- Views:
Transcription

1 Social Design Engineering Series SDES Who is audited? Experimental study on rule-based tax auditing schemes Yoshio Kamijo Kochi University of Technology Research Center for Social Design Engineering, Kochi University of Technology Takehito Masuda Japan Society for the Promotion of Science Hiroshi Uemura Kochi University of Technology Research Center for Social Design Engineering, Kochi University of Technology 30th July, 2015 School of Economics and Management Research Center for Social Design Engineering Kochi University of Technology KUT-SDE working papers are preliminary research documents published by the School of Economics and Management jointly with the Research Center for Social Design Engineering at Kochi University of Technology. To facilitate prompt distribution, they have not been formally reviewed and edited. They are circulated in order to stimulate discussion and critical comment and may be revised. The views and interpretations expressed in these papers are those of the author(s). It is expected that most working papers will be published in some other form.
2 Who is audited? Experimental study on rule-based tax auditing schemes Yoshio Kamijo a, b, Takehito Masuda c, d, Hiroshi Uemura a, b a School of Economics and Management, Kochi University of Technology, Eikokuji-cho, Kochi-city, Kochi , Japan b Research Center for Social Design Engineering, Research Institute, Kochi University of Technology, Eikokuji-cho, Kochi-city, Kochi , Japan c Japan Society for the Promotion of Science, Kojimachi Business Center Building, Kojimachi, Chiyoda-ku, Tokyo , Japan d Institute of Social and Economic Research, Osaka University, 6-1, Mihogaoka, Ibaraki-city, Osaka, , Japan July 2015 Abstract In this study, we employ a game theoretic framework to formulate and analyze tax audit schemes. We test the theoretical predictions in a laboratory experiment. We compare audit schemes based on three audit rules: random audit rule, cut-off audit rule, and lowest income reporter audited rule (LIRA). While the cut-off audit rule is known to be optimal in theory, it has not been examined in a controlled laboratory experimental setting. The primary experimental finding is that LIRA rule yields the highest degree of truthful reporting among the rules, contrary to the theory. Moreover, the regression analysis shows that individual social norms regarding tax payment as well as the cut-off rule and the LIRA significantly increase the degree of truthful reporting. Our experimental finding that the LIRA yields the highest degree of truthful reporting is practically important because the tax authority in most countries assigns higher priority for enhancing tax compliance. Keywords: audit schemes; tax evasion; laboratory experiment; cut-off rule; lowest income reporter audited rule JEL Classification: C91; D81; H26 Corresponding author Takehito Masuda Postal address: Institute of Social and Economic Research, Osaka University, 6-1 Mihogaoka, Ibaraki, Osaka, , Japan. Phone: ; Fax: ; address: takehitomasuda@gmail.com Acknowledgments Yoshio Kamijo is grateful for the financial support received from JSPS Grant-in Aid for Exploratory Research and Grant-in-Aid for Scientific Research (B). Takehito Masuda thanks the discussant Kan Takeuchi, the participants at the 2015 Spring Japanese Economic Association Meeting, and the workshop participants at the Center for Experimental Economics, Kansai University,
3 1. Introduction Securing government tax revenues is a persistent and fundamental problem for all nations (Webber and Wildavsky 1986). The incentive for individuals and companies to avoid excessive tax payments is high, which leads to tax avoidance, tax evasion, and payment delays. The results of a well-known audit program the National Research Program, conducted by the US Internal Revenue Service (IRS) estimated the tax gap (i.e., tax that is due but not paid in a voluntary or timely manner) in 2006 to be 450 billion dollars; this amount represented approximately 3.2% of the nominal GDP for that year (Alm et al. 2015). Although the analyses of the tax gaps in other countries are limited for several reasons (such as resource constraints and non-publication of survey results), the gaps are estimated or speculated to be considerable (see Slemrod (2007) for details). Thus, research on policy devices to enhance tax compliance has become increasingly significant. Therefore, this study intends to analyze various rule-based audit schemes. A basic theoretical model of tax evasion is presented in Allingham and Sandmo (1972) and Yitzhaki (1974). Following the criminal decision model of Becker (1968), these prior studies assume that a taxpayer chooses the extent of tax evasion by comparing the expected benefit from the evasion and the expected cost of the evasion, similar to the gambling decision. An implication of the findings of these studies is that the audit probability, the tax rate, and the penalty rate affect tax compliance. These findings are partly supported by the results of empirical research (Clotfelter 1983; Kleven et al. 2011; Slemrod et al. 2001) and laboratory experiment (Beck et al. 1991; Collins and Plumlee 1991; Gërxhani and Schram 2006). 1 Another implication of the basic individual decision-making model is that under-reporting is a very common phenomenon, especially when the actual audit probability and penalty rate are taken into account. In other words, the deterrent effect of a random audit rule is weak. Obviously, tax compliance can be improved by increasing the audit probability and penalty rate. However, most governments face severe budget restrictions related to auditing, and changing the penalty rate would be controversial. Thus, if there is another audit rule that does not involve too much additional cost and does not change the penalty rate, that rule should be worth considering for actual use. A more sophisticated formulation of auditing would be to consider the auditor as the principal who designs the audit rules that is, ways to choose whom to audit among many taxpayers as agents in order to enhance the 1 For a survey on experimental research, see Alm (1991, 2012). 2
4 taxpayers compliance behavior under the audit resource constraint. The extant literature on tax auditing rules focuses on three types of auditing rules: one is a simple random rule and the other two are elaborate rules. In the first rule, a taxpayer is randomly chosen and inspected, irrespective of the reported incomes of the taxpayers. This rule is adopted quite often. It is the most common rule used in experiments to examine the canonical tax-evasion model of Allingham and Sandmo (1972) and Yitzhaki (1974) and to measure behavioral aspects of tax evasion decision-making (Baldry 1986; Kastlunger et al. 2009). The second rule is the cut-off rule where the probability of inspection is high for taxpayers whose income is less than some threshold; taxpayers whose income is over the threshold are never inspected. Based on their working experience with the federal tax authority and several state tax authorities in the US, Andreoni et al. (1998) reported that many tax agencies apparently do establish cut-off points and focus their audit resources on returns falling below the cut-offs (p. 832). Based on the principal-agent theory, Reinganum and Wilde (1986) and Sánchez and Sobel (1993) show that the cut-off rule enhances tax compliance and net tax revenue. Some prior empirical studies (Alm et al. (1993) conducted a laboratory experiment, and Dwenger et al. (2014) conducted a field experiment) examine the usefulness of this rule. However, the empirical research on the cut-off rule is limited, and no study checks the cut-off rule using the optimal audit probability and threshold. The third rule is one where lower reported incomes have higher probability of being audited. Under the restriction that an auditor can inspect only one reported income, this rule becomes a lowest income reporter audited (LIRA) rule where among the category of taxpayers who are considered a priori homogeneous, the auditor investigates the taxpayer whose reported income is the lowest. One justification for implementing the LIRA is that in the US, the IRS calculates a discriminant inventory function (DIF) score for each return and determines which tax returns to audit based on the DIF. Alm and McKee (2004) model an audit rule based on the DIF score such that the most downward deviating income from the average of the reported incomes is inspected, i.e., the LIRA rule. They analyze the LIRA rule theoretically and experimentally in a complete information setting with identical taxpayer incomes. Prior studies such as Collins and Plumlee (1991) and Coricelli et al. (2010) experimentally examine the LIRA rule in an incomplete information setting with multiple types of taxpayer income; however, these studies do not theoretically investigate the LIRA rule. In this study, we compare three audit rules (the random rule, the cut-off rule, and the LIRA rule) theoretically and experimentally. Our approach significantly differs 3
5 from the extant literature on these rules in three ways. First, we compare the rules in the same environment and with the same restriction, while prior studies typically investigate these rules one by one. We compare them in the setting of an incomplete information game with continuous type of taxpayers. Additionally, we impose the restriction that the expected number of audited taxpayers in equilibrium is the same across the three rules. Second, we choose the optimal parameters (audit probability and threshold) for the cut-off rule that would maximize the basic tax revenue (i.e., tax collected based on voluntary reporting). Moreover, we examine the cut-off rule with different parameters to validate the robustness of the rule. The third difference from the extant literature is that we derive an equilibrium strategy of a taxpayer in the LIRA rule under an incomplete information game. Thus, we can compare the experimental data with the theoretical prediction. In our experiment, four players with different taxable incomes simultaneously and privately report their incomes; based on their reports, tax proportionate to the reported incomes is levied. The true income of each taxpayer is private information. Each player has an incentive to under-report the true income in order to reduce the tax burden. Following the taxpayers reporting decisions, some of them may be inspected by the auditor. The audited taxpayer is determined by the rules (the random rule, the cut-off rule, or the LIRA). If an inspected taxpayer is found to have concealed income, the tax for this concealed income is levied, multiplied by the penalty rate. The theoretical analysis shows that the cut-off rule with an optimal choice of threshold dominates the other rules in terms of increasing compliance rate (the ratio of reported income to true income), minimizing evaded income, and maximizing tax revenue. The LIRA yields higher compliance rate and less evaded income than the random rule does; however, the random rule yields higher penalty and total tax revenue than the LIRA does. Our experimental findings are summarized as follows. The primary finding is that, contrary to the theory, the LIRA ranks first in terms of compliance rate among the rules, with significance for the optimal cut-off and random audit rules. On the other hand, the optimal cut-off audit rule does not induce the compliance rate of one under the cut-off point. Moreover, the compliance rate under the LIRA shows a significantly negative correlation with income. The logic behind the negative correlation is simple. Once the subjects in the LIRA understand that lower-income subjects have a higher chance of being audited (note that the reported income must be less than the true income), they naturally conceal more income as the true income becomes larger, as 4
6 predicted by the equilibrium strategy. Although we observe that the LIRA yields the highest basic tax, penalty, and total revenue, the ranking in revenue among the rules is vague because in pairwise comparison, the difference among the audit rules often does not achieve statistical significance. Similarly, although the random audit and optimal cut-off rule rank first in terms of penalty and total tax revenue, respectively, they do not achieve significance for the other rules. Second, the positive impact of the LIRA and cut-off audit rules on compliance rate is corroborated through the regression analysis by controlling the subjects identity and characteristics measured by the questionnaire related to tax payment awareness and risk attitude. Further, we found that tax awareness and the subjects need for tax audit are positively correlated with the compliance rate. In contrast, aggressiveness toward tax evasion is negatively correlated with the compliance rate. The latter result is in accordance with the findings of prior studies such as Kirchler (2007), which report that the social norms of the subjects related to tax payment influence the choice of tax evasion. The rest of this paper is organized as follows. In the following section, we present a basic theory of tax evasion decision-making; subsequently, we present our theoretical predictions related to several tax audit schemes. Section 3 describes our experimental design and procedure. In Section 4, we report the results of our experiment and statistically analyze them. Section 5 concludes the paper. 2. Theory of tax audit rules 2.1. Basic model This section summarizes the canonical model of taxpayer decision-making proposed by Allingham and Sandmo (1972) and Yitzhaki (1974). A taxpayer decides whether and to what extent to evade taxes in the same way that an individual would weigh a risky gambling decision. The taxpayer (an individual or a firm) has a true taxable income of Y, where Y > 0 ; the true taxable income is private information. Let t be the basic tax rate. The taxpayer pays ty as tax if (s)he reports his/her true income. However, if the income is under-reported, the taxpayer should pay tr, where R represents the under-reported income ( R Y ), and Y R represents the amount of evaded or concealed income. 2 However, detailed auditing is randomly executed in probability p, 2 There are other types of reporting decisions such as non-filing and late payment of taxes owed. However, according to the 2001 IRS estimate of the tax gap, under-reporting represents approximately 82% of the gap, and non-filing and late payment represent 8% and 10% of the gap, respectively (see Slemrod (2007)). Thus, the major source of the tax gap is under-reporting. 5
7 where the tax evasion is detected. In our model, tax evasion is revealed if the tax authority inspects the under-reporting taxpayer. In the event of an inspection, the individual must pay tq( Y R ), as penalty for the tax evasion, where q represents the penalty rate for the illegal activity ( q > 1). Thus, the penalty is proportional to the concealed income. The expected utility for an individual reporting his/her income as R (where 0 R Y ) is EU = 1 p U Y tr + pu Y tr tq Y R, where U is a utility function with and U Y > 0 for any Y > 0. By differentiating EU by R and EU 1 1. Thus, tax evasion R evaluating it at R = Y, we obtain ( ) R= Y= t pq U (( t ) Y ) occurs when pq < 1 or p < 1/ q. ( ) ( ) ( ) ( ) U ( Y ) > 0 ( ) While the evasion decision depends on neither the basic tax rate t nor the true income Y, the extent of the evasion may depend on these variables. 3 However, if we assume risk neutrality, the taxpayer fully evades tax liability (i.e., reports 0 income) whenever (s)he decides to evade taxes. In the discussion that follows, we assume risk neutrality for the taxpayers. A comprehensive review of the theory is presented in Andreoni et al. (1998). The canonical model does not deal with how the detection probability (p) is determined. Studies such as Alm and McKee (2004) reported that the determination of p is the result of the strategic interdependence between auditors and taxpayers. Thus, the detection probability seems to vary with the reported incomes (Reinganum and Wilde 1986; Sánchez and Sobel 1993), the past experience of cheating or auditing (Clark et al. 2004; Friesen 2003; Greenberg 1984; Harrington 1988), the relative positions of the reported income (Alm and McKee 2004; Collins and Plumlee 1991), etc. In order to ensure strategic interdependence among taxpayers, we assume that there are n taxpayers. In the following subsections (Sections ), we describe three audit rules (random audit rule, cut-off rule, lowest income reporter audit rule), and we theoretically show how the taxpayer decisions are different in the context of these three rules. We explain the three audit rules using the following parameters: n = 4, t = 0.2, and q = 3. This simplification facilitates the understanding of the rules, and we adopt this setting in our experiment. To compare these audit rules in a fair manner, we propose the condition that the (expected) number of investigated taxpayers in 3 Yitzhaki (1974) shows that under the assumption of decreasing absolute risk aversion, the extent of evasion decreases as the basic tax rate increases, and the extent of evasion increases as income increases. 6
8 equilibrium is one because of the resource constraints of the audit authority. We assume that the true income of each player is selected independently from an identical uniform distribution on [0, 1000]. For each taxpayer i ( i {1,2,3,4} ), Y and R denote i s true income and reported income, respectively. i i 2.2. Random audit rule In the random audit rule, the auditor chooses one of the four taxpayers at random, irrespective of their reported incomes. The chosen taxpayer is inspected. Under our setting, the probability of detection (p) is 1/ n = 1/4, and the penalty rate q is 3. Thus, p < 1/ q holds true, indicating that the optimal strategy for each taxpayer is to report 0 income. Thus, the random audit rule does not incentivize the taxpayers to report their true income Cut-off audit rule In the cut-off audit rule, the detection probability varies according to the reported incomes. In particular, we choose the cut-off audit context where the reported income in the income class [0, 750] is inspected with probability 1/3, and the reported income of the class with income more than 750 is never inspected. According to our selected parameters, the detection probability of 1/3 is the smallest probability for a taxpayer to report his/her income truthfully. The range of [0, 750] is determined by the restriction that the expected number of inspections is one out of four taxpayers ((1/ 3) (750 / 1000) = 1 / 4). The optimal strategy for a taxpayer in the cut-off audit rule is to report his/her income truthfully when the income is less than 750 and to report the threshold when the income is more than 750. Thus, in this audit rule, a taxpayer with higher income evades the tax burden. It is theoretically known that the cut-off rule discussed here is the tax-revenue maximizing audit rule (Sánchez and Sobel 1993). Additionally, we test the robustness of the cut-off rule with another parameter selection. In the second version of the cut-off rule, the reported income in the income class [0, 500] is inspected with probability 1/2, and the reported income of the class with income over 500 is never inspected. We name the first version Cut-off Optimal (Cut-off O) and the second version Cut-off Suboptimal (Cut-off S) Lowest income reporter audited rule In the lowest income reporter audited (LIRA) rule, the auditor investigates the lowest income among the four reported incomes. Thus, a strategic interdependence exists among the taxpayers. Since the true income of each taxpayer is private information, 7
9 this rule involves incomplete information (Harsanyi 1967). Under the LIRA rule, the lower the reported income is, the more likely the income is to be inspected. Therefore, the optimal strategy for the taxpayers is to report their income truthfully if the true income is less than some critical value c, and to cheat otherwise. The critical value c is calculated as follows. Assume that the four players follow the same strategy; thus, they report the true income when their income is less than c. Consider a taxpayer whose true income is c. The probability of detection when (s)he reports c is 3 (1 c / 1000), and this probability decreases in c. According to our selected parameters, a detection probability greater than or equal to 1/3 (= 1/q) is needed for truthfully reporting income (see Section 2.1). Since income c is the marginal value between the true income and the income when cheating, (1 c / 1000) must be 3 equal to 1/ q = 1/3. Thus, we have 1/3 c* = 1000 (1 (1 / q) ) 306. In fact (as shown in the Appendix), in the LIRA rule, the equilibrium strategy of each i becomes the one where (s)he truthfully reports the income ( Ri = Y i ) if Yi < c, and (s)he cheats by ey ( i ) ( Ri = Yi ey ( i )) if Yi c, where e represents the extent of cheating with ec ( ) = 0, ey ( i ) > 0 for Yi > c, and ey ( i ) > 0 for Yi c. Comparing the equilibrium strategies in the cut-off and LIRA rules, the income range of those who truthfully report income is larger in the cut-off rule than in the LIRA. Moreover, for any income Y > c, the taxpayer of type Y reports more income in the cut-off rule than in the LIRA (see Figure 1). Thus, the cut-off rule theoretically dominates the LIRA Summary of theoretical predictions under our parameter selection Figure 1 summarizes the equilibrium tax-reporting behaviors under the audit rules described in the preceding sections. The left panel of Figure 1 shows the prediction of the taxpayers reporting strategy under each audit rule. We see that the cut-off rule dominates the other rules, and the LIRA dominates the random audit rule. The predicted strategies under the LIRA and the two cut-off rules have kinks at Y = 306.6, 500and750, respectively. [Figure 1 here] To understand the right panel, we introduce a frequently used measure for the 8
10 degree of truthful reporting called the compliance rate, r= R/Y, which means that a player with true income Y > 0 reports R. Note that the definition of compliance rate in Alm et al. (2009) is (tax paid)/(tax owed); however, under the proportional tax model, this reduces to r. For example, if a player with income of 500 reports 220, the corresponding compliance rate is r = 220 / 500 = 44 0%.. Suppose that the compliance rate is sufficiently close to one (90%, for instance), and the tax is almost correctly levied; we can say that such an audit rule works. Hence, it seems natural to use the compliance rate. Given an audit rule a, a R ( Y ) denotes the taxpayers reporting strategy predicted a in Section 2. R = R ( Y ) yields the predicted compliance rate r a ( Y ) = R a ( Y )/ Y for every Y > 0. The right panel of Figure 1 illustrates a r () by audit rule a. Although the ranking among the mechanisms is preserved when converting the reporting strategy to the induced compliance rate, this normalization is useful for the mechanisms. Given the taxpayers reporting strategy, we can calculate the predicted revenue under each audit rule. Table 1 presents the expected tax revenue per taxpayer under these three rules, with revenues from the ordinal tax and the penalty. Consistent with the reporting behaviors, the tax revenue from reported income is highest in the cut-off rule, second highest in the LIRA, and lowest in the random rule. However, for the revenue from the penalty, this order is reversed. Overall, the total tax revenue is highest in the cut-off rule, second highest in the random rule, and lowest in the LIRA. [Table 1 here] 3. Experimental design We experimentally compare the audit rules discussed in Section 2. We have four treatments: Random, Cut-off O, Cut-off S and LIRA. Each of these treatments has two sessions. We conducted all the sessions at Kochi University of Technology s Experimental Social Design Lab in July 2014 and April Each session lasted one and a half hours. We used the experimental software z-tree (Fischbacher 2007). We recruited 140 student subjects from Kochi University of Technology through campus-wide advertisements. The number of subjects for each treatment is 24 for Random, 36 for Cut-off O, 40 for Cut-off S, and 40 for LIRA. No subject participated in more than one session. Moreover, none of them had prior experience in a similar type of experiment. The subjects were seated at individually partitioned computer terminals assigned by lottery. We did not allow any communication among the subjects. Each subject received a copy of the instructions. Additionally, the instructions were read aloud by an experimenter. Subsequently, the subjects answered a quiz about 9
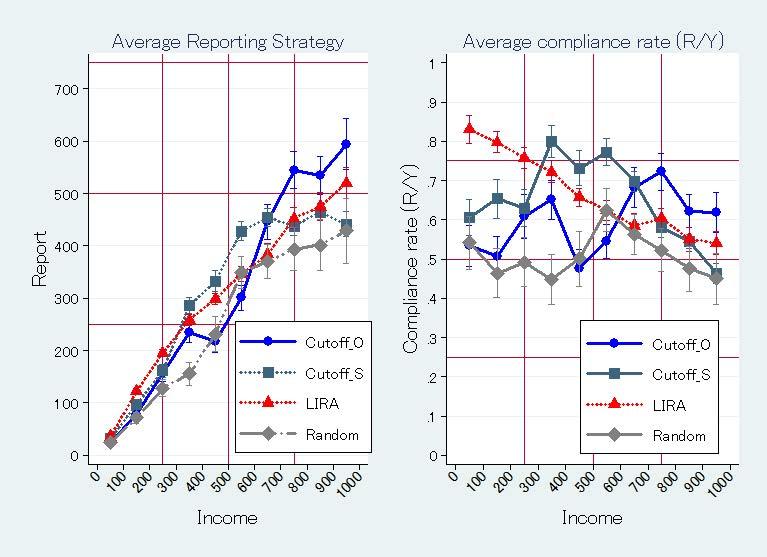
11 the audit rule in which they participated. Following the quiz, an experimenter publicly announced the answers of the quiz. The subjects then proceeded to 20 payment periods. In every session, we employed the stranger matching protocol so that every group in every period included four reporters. The subjects were informed that they would be randomly re-matched in every period. First, we explain the process followed in one period of the Random, Cut-off O, Cut-off S, and LIRA treatments. Once a group was formed, every reporter faces the reporting screen. At the reporting screen, (s)he privately receives and confirms his/her income, which is drawn independently from the uniform distribution on [0, 1000] (yen), with an increment of 10. Note that income is newly drawn by period, so that we have a one-shot incomplete information environment. Every reporter can confirm t = 0.2 and q = 3. Given this information, the reporter determines how much income to report, and (s)he inputs a number that is between 0 and his/her income, with an increment of 10. Once every subject inputs the reported income and clicks the OK button, the subjects proceed to the results screen. The results screen displays (from the top) one s own income (Y ), one s reported income ( R ), one s concealed income (Y R ), tax on reported income (tr ), penalty ( tq( Y R )), and one s payoff in the period. In every period after the second period, the history box appears, where the subjects can confirm the information contained in the results screen in all of the previous periods. Once all the subjects click the Next button, the subjects proceed to the next period. After participating in 20 payment periods, the subjects completed two sets of the questionnaire. The first set is related to taxpayer awareness. The questionnaire on taxpayer awareness is adapted from the one that is widely used in the literature (for instance, Gërxhani 2004; Lefebvre et al. 2015). For details about our questionnaire on taxpayer awareness, see Section 4.4. The second set included questions on lottery vs. safe cash choice to elicit the risk preferences of the subjects. After the questionnaires were completed, the subjects were immediately paid in cash (privately). Each subject was paid the show-up fee of 800 yen plus the total earnings over three periods, which were randomly decided by a lottery. 4. Experimental results 4.1. Tax gap We start with an overview of the distribution of tax gap. Given an observation ( Y i,t,r i,t ) where i and t are subject and period indices, respectively, the corresponding tax gap (or the foregone tax) is g i,t = 0 if audited, and g = t( Y R ) = 02. ( Y R ) if not audited. i,t i,t i,t i,t i,t 10
12 Figure 2 is the histogram of the tax gap by rule, with a bin size of 10. The horizontal and (reverse) vertical axes represent the fraction and tax gap, respectively. Table 2 presents the summary statistics for the tax gap by rule. [Figure 2 here] [Table 2 here] Although Cut-off O yields the lowest median tax gap of 2, Cut-off O simultaneously yields the highest standard deviation of tax gap of This is attributed to the large tax gap under Cut-off O. In particular, 3.82% of the Cut-off O data are in the high range of tax gap over 150, which is achieved if a subject evades income over 750 and is not audited. Moreover, note that the maximum possible tax gap per report (200) is achieved only when a subject with ( Y i,t,r i,t )=(1000,0) is not audited. In contrast, Cut-off S and LIRA succeeded in mitigating large evasion over 150 (1.00% for Cut-off S and 0.50% for LIRA) associated with lower standard deviation of tax gap, compared to Cut-off O. The data suggest that optimal cut-off does not incentivize subjects to report truthfully as much as expected, and that non-optimal cut-off and LIRA are better ways to do so Subjects reporting behavior In this subsection, we focus on reporting behavior, considering the reporting strategy averaged across subjects. Figure 3 is a counterpart of Figure 1 illustrating the subjects mean reporting strategy and compliance rate induced by the strategy by audit rule, with a bin size of 100. Capped spikes denote the standard error of the mean. [Figure 3 here] Figure 3 shows that the data highly deviate from the theoretical prediction. First, we consider the subjects in Random, shown in Figure 3 with dash-dot lines with diamonds. Although the theory predicts zero reporting for any income as shown in Figure 1, the left panel of Figure 3 shows that the subjects in Random report some fraction of their income. In particular, the compliance rate in Random fluctuates around 50%; i.e., the subjects report about a half of their true income, regardless of their income, as shown in the right panel of Figure 3. The second notable deviation from theory is that Cut-off O does not fully induce the compliance rate of one (that is, R = Y) for Y <= 750. Instead, the average compliance rate is less than 0.8 for any bin. A similar tendency is 11
13 observed in Cut-off S. Arriving at a consistent explanation for the upward shift in Random and the downward shift in Cut-offs is difficult. For example, in order to explain why the compliance rate in Random is higher than expected, assume that a fixed fraction of the subjects is the honest type; i.e., they unconditionally report their true income. The curve of observed strategy would be pushed up in every treatment, which contradicts the fact that the Cut-off O subjects under-report their income. A similar argument holds if we consider the tendency to obey the authority (i.e., the experimenters). Despite this difficulty, in section 4.4, we conduct a regression analysis controlling for individual attitudes toward tax payment. In contrast to the unclear basis of the compliance behavior under Cutoff O and Random, we can provide an intuitive explanation for the LIRA data (indicated with red dash lines with triangles) presented in Figure 3, which exhibit an almost monotonically decreasing compliance rate. This tendency is confirmed by the Spearman rank correlation test using individual observed income Y i,t > 0 and ri,t = R i,t /Yi,t. The test finds a significantly negative correlation between the two variables ( ρ = , p < 0.001). 4 The logic behind this negative correlation is simple. Once subjects in LIRA understand that lower-income subjects have a higher chance of being audited (the reported income must be less than the true income), they naturally conceal more income as the true income becomes larger. Hence, even if the subjects under LIRA do not calculate the audit probability based on a candidate equilibrium strategy profile and uniform income distribution, they can mimic such behavior. To present the following result related to compliance rate, we classify the income range into four quarters (Q) since the predicted strategies have kinks at Y = 250, 500, and 750: Q1: , Q2: , Q3: , Q4: The next result summarizes the result of the comparison test of the compliance rates of the various audit rules. Result 1. Based on the compliance rates, we obtain the following results. (i) The compliance rate significantly negatively correlates with income under the LIRA and Cutoff S rules, while the correlation is not significant in the Cut-off O and Random rules. 4 Results of Spearman rank test in other treatments are as follows. While under Cut-off O and Random there is no significant correlation between income ( ρ = , p = and ρ = , p = ), under Cut-off S there is a significant negative correlation between compliance rate and income ( ρ = , p < ). 12
14 (ii) In the combined data, the LIRA generates the highest mean and the lowest standard deviation in terms of compliance rates, with significant difference compared to both Cut-off O and Random. (iii) In the Q1 range of income, the LIRA yields the highest mean compliance rates, while in the Q2, Q3, and Q4 ranges of income, the Cut-off treatments do so. Support. We had presented the support for result (i) in the above. The evidence for result (ii) is presented in the first section of Table 3, which lists the compliance rates by mechanism in the five data sets: all the data (except 0 income) and income in Q1 Q4. When we consider all the data, the LIRA yields the highest compliance rate (66.34%) among the different audit rules. A pairwise comparison using t-test, where individual observed compliance rate r i,t is treated as a single unit, shows that any pair of rules (except Cut-off S and LIRA) has statistically significant differences in the mean compliance rate (t-statistic = for Cut-off O vs. Cut-off S; t-statistic = for Cut-off O vs. LIRA; t-statistic = for Cut-off O vs. Random; t-statistic = for Cut-off S vs. Random; t-statistic = for LIRA vs. Random). Moreover, the standard deviation of compliance rate is the lowest under the LIRA (0.27). The two-sample variance comparison test shows that standard deviation under the LIRA is significantly different from that under the other rules (F-statistic = for LIRA vs. Cut-off O; F-statistic = for LIRA vs. Cut-off S; F-statistic = for LIRA vs. Random). This suggests that the LIRA collects more basic tax revenue across a wide range of income classes compared to the other two rules. The subsequent sections of Table 3 suggests that the LIRA s high overall compliance rate is attributed mainly to reports from the Q1 and Q2 income ranges. This result is intuitive since the subjects with low income under the LIRA become truthful to avoid having the lowest reported income. If we focus on the data of the Q1 income range, the LIRA yields statistically significant higher compliance rate compared to the other rules (t-statistic = for LIRA vs. Cut-off O; t-statistic = for LIRA vs. Cut-off S; t-statistic = for LIRA vs. Random). In the Q2 range, the compliance rate under the LIRA is second highest, but it is not significant from the highest one, which is that under the Cut-off S rule (t-statistic = for LIRA vs. Cut-off O; t-statistic = for LIRA vs. Cut-off S; t-statistic = for LIRA vs. Random). In Q3 and Q4, the Cutoff treatments outperform the other rules. In Q3, Cut-off S yields the highest compliance rate of 69.32%, with significant difference compared to the other rules (t-statistic = for Cut-off S vs. Cut-off O; t-statistic = for 13
15 Cut-off S vs. LIRA; t-statistic = for Cut-off S vs. Random). In Q4, Cut-off O yields the highest compliance rate of 64.19%, with significant difference compared to the other rules (t-statistic = for Cut-off O vs. Cut-off S; t-statistic = for Cut-off O vs. LIRA; t-statistic = for Cut-off O vs. Random). [Table 3 here] 4.3. Revenue In this subsection, we compare the amount of tax collected, the amount of penalty collected, and the total revenue. In order to understand the data comprehensively, our analysis related to revenue involves two dimensions, i.e., a comparison among the rules and a comparison between the theory and the data for each rule. Table 4 presents the tax collected per report generated by each audit rule (in contrast, Table 1 presented the theoretical predictions of tax revenues). [Table 4 here] The rows are broadly categorized into tax revenue (Tax), penalty revenue (Penalty), and their total. For each category, we calculate the actual mean and the expected mean under the assumption that the subjects always followed the equilibrium report; subsequently, we calculate the difference between the actual mean and the expected mean. In the following discussion, subscripts i and t represent subject i and period t, respectively. Superscript e denotes the prediction. Based on Table 4, we get the following results. Result 2. With regard to revenue, the following hold true: (i) The LIRA generates the highest basic tax revenue among the four rules, with significant difference compared to Random. (ii) Random ranks highest in terms of penalty revenue among the four rules, with significant difference compared to Cut-off S and LIRA. (iii) Cut-off O yields the highest total tax revenue, but there is no significant difference in total revenue among the rules except for Cut-off O vs. Cut-off S. (iv) Moreover, Cutoff s total revenue is not significantly different from the predicted level, while the total revenues of Cut-off S, LIRA, and Random are significantly higher than the predicted level. 14
16 Support. For result (i), we focus on the category Tax. Notably, the LIRA yields the highest average tax revenue per report of 62.6 ± 1.53 (mean ± standard error), followed by Cut-off O (61.41 ± 2.23), Cut-off S (60.42 ± 1.52), and Random (52.28 ± 2.52). We run a t-test in which the individual observed tax ( Tax i,t ) is treated as a single unit. 5 The results of this test show that the mean tax values under the LIRA and Cut-off O are significantly higher than the ones under Random (t-statistic = for LIRA vs. Random; t-statistic = for Cut-off O vs. Random). Hence, the data partially support the ranking among the rules in terms of the basic tax revenue. In all the rules, the difference between the actual tax revenue and its theoretical benchmark (the mean of Tax e i,t ) is statistically significant. In particular, the Cut-off O, Cut-off S, and LIRA data are significantly lower than predicted (t-statistic = for Cut-off O; t-statistic = for Cut-off S; t-statistic = for LIRA), while the Random data are significantly higher than predicted (t-statistic = ). As for penalty, Random ranks highest (40.16 ± 5.05), followed by Cut-off O (32.68 ± 3.63), Cut-off S (25.60 ± 3.10), and LIRA (23.96 ± 2.87). These findings are associated with a statistically significant difference between Cut-off O and LIRA (t-statistic = ), Cut-off S and Random (t-statistic = ), and LIRA and Random (t-statistic = ). The findings contradict the theoretical predictions that Cut-off O would have no penalty revenue, and Random would have only penalty revenue. Simultaneously, each rule exhibits statistical differences in terms of penalty between the data and the theoretical benchmark, with an increase under Cut-off O (t-statistic = ), Cut-off S (t-statistic = 8.259), and LIRA (t-statistic = ), and a decrease under Random (t-statistic = ). Finally, we consider the total revenue from tax and penalty. The empirical ranking among the rules in terms of total revenue is qualitatively consistent with the theoretical one presented in Table 1. In the experiment, Cut-off O yields the highest total revenue per report (94.1), associated with a statistically significant difference compared to Cut-off S (t-statistic = ). However, Cut-off O s revenue is not significantly different from that under LIRA (86.6; t-statistic = ) or Random (92.5; t-statistic = ). Moreover, the mean revenue under Cut-off O is not significantly different from the predicted one (t-statistic = ), while the mean revenues under the other rules are significantly higher than the predicted ones (t-statistic = for 5 We run hypothetical tests, where each observation (e.g., R i,t, Tax i,t, Penalty i,t and so on) is treated as a single unit. 15
17 Cut-off S; t-statistic = for LIRA; t-statistic = for Random). In short, we find some revenue smoothing among the rules. The breakdown of the revenue shows that the subjects report their income truthfully even under Random, while Cut-off O does not incentivize the subjects to report income truthfully Regression results In this subsection, using multiple regression analyses, we confirm that audit scheme, amount of income, and awareness about tax payment affect the tax evasion decision. The regression analysis involving tax payment awareness enriches our understanding of the data. The analysis is in line with the claims put forward in the extant literature that the motivation to comply depends on the subjective constructs related to the tax phenomenon and the collective sense-making of subjective tax knowledge, the myths and legends about taxation and others tax behavior, the subjective constructs and evaluations of perceived and internalized norms, the perceived opportunities not to comply, and the perceptions of fairness (Braithwaite 2003). The aggregation of these variables results in the motivation and drive of taxpayers to behave honestly. The aggregation of subjective constructs and socially shared beliefs and evaluations is related to motivational postures (Braithwaite 2003). Each subject answered the question about tax awareness (tax payment awareness, acceptable tax rate, aggressiveness toward tax evasion, need for audits, satisfaction for public service) after the experiment. Moreover, all the participants completed the questionnaires for the measurement of risk preference. In order to measure the subjects degree of risk aversion, we set 11 lotteries vs. safe constant cash questions, varying the winning probability of the lottery from 0% to 100% with an increment of 10%. We measured each subject s switching point where (s)he begins to prefer the lottery to safe constant cash. We included the tax awareness and risk appetite of the participants (each answer to the questions) in the regression model as independent variables. We present the descriptive statistics before considering the determinants of cheating behavior. The definitions of the variables for the descriptive statistics and multiple regressions are presented in Table 5. The total number of observations is 2,800 (140 subjects 20 times). From these, 240 observations were excluded from the analyses since the subjects did not reply to the questions after the experiment. Further, 14 observations for which we were unable to calculate the decision time were excluded. Thus, 2,546 observations were used as the sample in our statistical analysis. 16
18 [Table 5 here] Comparison of true income reporting and under-reporting Table 6 presents the descriptive statistics for true income reporting and untrue income reporting (i.e., under-reporting). Subjects with high awareness regarding tax payment are less likely to cheat about their income (tax awareness: t = 4.08, p < 0.001). Moreover, subjects who do not feel the necessity for tax audits are more likely to evade tax payments (need for audit: t = 4.45, p < 0.001). Our results support the results reported in prior studies such as Braithwaite (2003). Moreover, the risk attitude of individuals affects their decision to evade tax. Subjects who dislike risky choices are likely to report their income truthfully (risk appetite: t = 3.02, p = 0.030). Finally, when a penalty was imposed on a subject, the probability that the subject would cheat about his/her income becomes high (Penalty(t-1): t = -5.52, p < 0.001). [Table 6 here] Multiple regression analyses By including the compliance rate as a dependent variable, we get Result 3, which is a counterpart of Result 2 (Section 4.3). Result 3. The linear regression model (Std. Err. adjusted for 20 clusters in task period) presents the following results. (i) All the audit rules have a positive correlation with the compliance rate. (ii) The tax awareness and the need for a tax audit institution of the subjects have a positive correlation with the compliance rate. (iii) The aggressiveness toward tax evasion and gender (specifically, male) have a negative correlation with the compliance rate. (iv) The time spent in order to report income has a positive correlation with the compliance rate. (v) The previous penalty has a negative correlation with the subsequent compliance rate. Support. Table 7 presents the results of the regression analysis. In our model, standard error is adjusted for 20 clusters in the task periods because each subject repeats the task 20 times. The dependent variable is the compliance rate. The independent variables include each income category (the low-income category being the omitted 17
19 reference category) and the tax payment awareness and risk appetite of each subject. Moreover, the model includes gender (1 if male and 0 if female), the time spent in order to report income, and the previous audit and penalty (Alm 1988; Coricelli et al.2010; Kastlunger et al. 2009). [Table 7 here] The main result of the regression analysis indicates that all the audit rules are positively correlated with the compliance rate (Cut-off O: t = 3.52, p = 0.002; Cut-off S: t = 5.01, p < 0.001; LIRA: t = 6.98, p < 0.001). This supports the result of the analysis of the subjects reporting behavior (Result 2(i)). That is, after controlling for the subjects attitudes toward tax compliance, the LIRA still leads to an increase in the compliance rate. Many factors such as personal norms, perceptions of fairness, and individual personality traits may affect the taxpayers income-reporting decision (Alm 2012; Cadsby et al. 2006; Kirchler 2007). For instance, Porcano (1988) finds that a person s honesty and tax compliance are significantly related to the under-reporting of income and tax evasion. Ahmed (2004) finds that shame displacement processes (i.e., anger toward the tax office) are negatively related to personal norms of tax honesty. Our results indicate that the tax awareness and the need for tax audit of the subjects have a positive correlation with the compliance rate (tax awareness: t = 2.84, p = 0.010; need for audit: t = 5.43, p < 0.001), and that the subjects aggressiveness toward tax evasion has a negative correlation with the compliance rate (aggressiveness: t = -2.03, p = 0.057). Moreover, some prior studies included gender as an independent variable in the regression model for the determinants of tax evasion. Lefebvre et al. (2015) find that male taxpayers tend to evade taxes. Our result supports this finding (male: t = -5.14, p < 0.001). Whether audits and fines can actually deter evasion is often debated (Kastlunger et al. 2009). Penalties are frequently assumed to be useful measures in prohibiting undesired behavior (Landsberger and Meilijson 1982). However, the results of prior studies examining the effects of fines on tax compliance are mixed. Friedland et al. (1978) find that higher punishment seems to be slightly more efficient in preventing evasion compared to higher audit rates. In contrast, Weck-Hannemann and Pommerehne (1989) find no significant effect of punishment. There are many explanations as to why fines do not have the predicted high effect on tax compliance. Kirchler (2007) suggests that taxpayers try to avoid taxes when the benefits that they 18
20 could gain are uncertain. Halperin and Tzur (1990) show that the proportion of evaders is not a sufficient reason to explain the low penalty rate. Our result shows that the previous amount of penalty has a negative correlation with the subsequent compliance rate (Penalty (t-1): t = , p < 0.001). 5. Conclusion The contributions of this study are as follows. We confirm that tax revenue can be improved by deciding the scheme for choosing the audited target, controlling tax, and penalty rate, and determining the auditing resources. Although this suggestion is based on theoretical predictions, we show that this actually works in a laboratory setting. Among the auditing rules considered, the LIRA ranks first in terms of the compliance rate contrary to the theoretical prediction that setting the appropriate cut-off point is optimal. A symmetric equilibrium strategy under the LIRA as a Bayesian game, which has been derived for the first time to the best of our knowledge, is qualitatively supported in the lab by the significant negative correlation between the compliance rate and true income. The fact that the LIRA ranks first in terms of basic tax revenue shows that the LIRA improves voluntary truthful reporting; however, this result has a limitation since significance appears only when LIRA is compared to Random. Moreover, the positive impact of LIRA and the Cut-off rules on compliance rate compared to Random is corroborated through the regression analysis by controlling the subjects identity and the characteristics measured by the questionnaire related to tax-payment awareness and risk attitude. Further, we found that tax awareness and the subjects need for tax audit are positively correlated with the compliance rate, while the aggressiveness toward tax evasion has a negative correlation with the compliance rate. The latter regression result is in line with prior experimental findings on the behavioral aspects of tax reporting decisions, which state that tax awareness, moral cost of tax evasion, other-regarding preferences, tendency to overestimate a small probability, and asymmetry between loss and gain (Alm 2012) may affect the performance of the rules. The experimental result that the LIRA had the highest performance in terms of compliance rate has some practical importance because the tax authority in most countries assigns higher priority to the enhancement of tax compliance. Moreover, the LIRA is the model for the auditing system based on the DIF score that is used by the IRS in the US. While the optimal cut-off also showed good performance in terms of tax compliance and tax revenue, determining the optimal parameter for a real population could be very difficult. In contrast, the LIRA works without information about the other 19
21 parameters because it utilizes the profile of reported incomes to determine whom to audit. Finally, we discuss the prospects for future research. In the audit schemes discussed in this study, the auditor decides the rule based on which the taxpayer is to be inspected. Another interesting experimental setting is the human audit condition, which is part of our ongoing research. In this setting, after the taxpayers make their decisions, the subject who plays the role of the auditor must use his/her own discretion to choose one of the four taxpayers as the target. Moreover, when the auditor has the costly option to inspect multiple taxpayers, even if the option does not pay, the compliance rate of the taxpayers may increase because of the taxpayers overestimation of the audit probability. Appendix. Theoretical analysis of the lowest income reporter audited (LIRA) rule Let N = {1,2,, n }, with n 2 as the set of taxpayers (individuals or firms) that should report their income to a tax authority. For i N, true income is denoted by Yi [ Y, Y h], where Y, and Y h are the lower and upper bounds of income, respectively. In our experiment, they are equal to 0 and 1000, respectively. Each i with income reports r [0, Y ] to the tax authority. i i In an income reporting game (IRG), taxpayers report their incomes simultaneously. Let ( r, r,, r ) [0,1000] n be the profile of the reported incomes. A 1 2 n tax authority observes the profile and inspects the individual with the lowest reported income. If there is a tie, a random selection is made from among the tied members. We assume that the true income of each individual is a random variable. Thus, we model IRG with a strategic inspection as a normal-form game with incomplete information (Harsanyi 1967). We assume that the true income YY ii of an individual is identically and independently distributed according to a continuous distribution function F on [0,1000]. Let f be a density function of F. Because the IRG with strategic auditing is a normal-form game with incomplete information, the strategy of player is a function that associates his/her realized true income Y i with reporting income rr ii. Let γ i be the strategy of player i. We adopt the symmetric Bayesian Nash equilibrium (BNE) ( γγ,,, γ), where every player uses the same strategy γ as a solution criterion to evaluate strategic auditing. We assume the following differentiability condition. Y i Assumption 1. A Bayesian equilibrium strategy γ is a continuous, differentiable, and increasing function with γ (0) = 0. 20
22 We explore the conditions that should be satisfied by γ. Suppose with the exception of player i with income Y (type Y player), follow strategy γγ. The expected payoff of the type Y player reporting Note that 1 1 γ ( ) 1 ( ) ( ) r Y is: n 1 ( ( )) ( ) n 1 individuals, U r, Y = Y tr 1 F γ r qt Y r. (1) n ( ( )) 1 F r is the probability of r being the lowest reported income among nn reported incomes. This is a continuous function in the domain [0, Y ] when γ is a continuous function. By differentiating U( ry, ) in r, we obtain the following: ( ( )) n ( ( )) ( ) ( r ) 1 γ ( r ) ( ) ( ( ( ))) U 1 ( ) ( ) 2 1 qt Y n 1 = t n 1 1 F γ r f γ r + 1 F γ r 1 qt. r γ For ( γγ,,, γ) to constitute a BNE, there must be a local maximum at r = γ( Y ). Thus, the following first-order condition should be satisfied: ( Y ) ( ) ( Y ) 0 if γ = Y U ( γ ( Y ), Y ) = 0 if 0 <γ Y < Y r 0 if γ = 0 (2) ( ) ( ) ( ) ( ) ( ) if ( ) 0 n 1 γ γ = 1 ( 1 F ( Y )) Y Y if Y Y q γ ' ( Y ) = Y γ Y if 0 < γ Y < Y n 2 ( n 1) ( 1 F ( Y )) f ( Y ) Y γ Y γ Y = Let YY be defined as follows: 1/ ( n 1) * 1 1 Y = F 1. q (3) Y Y F ( Y ) For < *, 1 n ( ) 1 1 < 0. q γ>0 from Assumption A1 and Y γ( Y ) 0, Y = γ( Y ) must hold for Y < Y *. Therefore, a type Y taxpayer for Y Y * sincerely reports his/her income. to Next, consider YY that satisfies Y > Y *. The differential equation can be reduced 21
23 where γ '( Y) + AY ( ) γ ( Y) = AY ( ) Y ( ) AY = n 2 ( ) ( ) n 1 ( 1 F ( Y )) ( 1) 1 ( ) n F Y f Y 1 q and AY ( ) > 0 for Y > Y *. A general solution of the above differential equation is ( ) ( ( ) ) A( Y ) dy A( Y ) dy γ Y = e A Y Ye dy + C with an initial condition AY ( ) = Y *. By using partial integration, Let condition: ( ) ( ) A Y dy ( ) A( Y ) dy A( Y ) dy A( Y ) dy γ Y = e Ye e dy + C A( Y ) dy ( ) = Y e e dy C. a( Y ) = A( Y ) dy, that is, an indefinite integral of AY ( ). Consider the initial Y a( z) ay ( ) Y a( z) ay ( ) * γ ( Y ) = Y e dz / e = Y e dz for Y > Y. Y * * Therefore, we have a candidate for an equilibrium strategy as follows: Y * Y for Y Y γ ( Y ) = Y a( z) ay ( ) * Y e dz for Y > Y. * Y (4) The next theorem states that γγ constitutes a BNE. Proposition 1. Let γγ be defined in (4). Strategy profile (γγ, γγ,, γγ) is a BNE. Proof. The payoff of type YY reporting rr is given by (1) and is reduced to ( ( )) U ry t Y t Y r q F r 1 (, ) = ( 1 ) + ( ) 1 1 γ ( ) n 1 (5) We consider the following cases separately: (i) Y < Y and (ii) Y Y. Case (i) Y < Y *. Because r Y < Y and γ ( r) = r, the payoff described by (5) is re-written as follows: * Since r Y Y n 1 ( ) ( ty ) ty ( r) q ( F( r) ) (6) <, and Y satisfies (3), 1 q( 1 F ( r) ) the taxpayer payoff is maximized at r= Y. n 1 is negative. Therefore, 22
24 Case (ii) Y Y. When r= Y in the domain [0, Y ]. Next, suppose r Y *. given by (2) is rewritten as follows: r Y *, the payoff is given by (6) and is maximized at n ( ( ( ))) ( ) ( ) > The first derivative of U( ry, ) 1 ( γ ( ) ) 1 ( r ) U n 2 qt r r 1 1 = t + ( n 1) ( 1 F ( γ ( r) )) f ( γ ( r) ) r γ γ ( ) n ( ( )) ( ( )) 1 ( γ ( r )) 1 γ γ ( r ) 1 2 qt Y F γ r qt + n 1 1 F γ r f γ r. * 1 Because ( ) Y <γ r < r and from (3), γ must satisfy the following: ( ) 1 n 1 ( 1 F ( Y )) q Y γ = γ n 2 ( n 1) ( 1 F ( Y )) f ( Y ) Using this, the first derivative is reduced to n ( 1 ( ( ))) ( 1) 1 ( ) ( Y ) ( Y ) n ( ( )) ( ( )) ( 1 ( n n 1 1 ( ))) ( 1 ( ( ))) ( ( 1 1 n 2 qt ( Y γ ( r ) 1 ) )) ( ( )) 1 γ ( γ ( r )) ( F ( 1 1 n 2 qt ( Y γ ( r ) 1 ) r )) f ( γ ( r) ) 1 γ ( γ ( r )) ( 1) 1 ( ) = ( n 1) 1 γ ( ). 1 ( ( ( ))) n 1 1 q 1 F γ r U n = t + ( n 1) ( 1 F ( γ ( r) )) f ( γ ( r) ) t n 2 r 1 1 ( n 1) ( 1 F ( ( r) )) f ( ( r γ γ )) + F γ r qt + n F γ r f γ r 1 1 = t + t q F γ r + F γ r qt + n F γ r f γ r. 1 ( γ ( r )) 1 γ γ ( r ) qt Y ( ) This is positive for r [ Y, γ ( Y )), negative for r ( γ ( Y ), Y ], and zero if r = γ ( Y ). Thus, U is maximized at r = γ ( Y ). Therefore, the proof ends. The following intuition can be gained from the preceding discussion. Because the lowest reporter is audited, the risk of punishment when cheating is high for low-income 23
25 taxpayers. This implies that sincere reporting is more likely to occur among low-income taxpayers. Assuming that every taxpayer with income less than YY honestly reports his/her true income, the payoff for a taxpayer with income YY when (s)he reports rr is given by (6). Therefore, as long as 1 q( 1 F ( r) ) n 1 is negative, the preferred action is to honestly report the income. The critical value of reporting income honestly is obtained when 1 q( 1 F ( r) ) n 1 * = 0 i.e., Y = Y. For a taxpayer whose income * exceeds Y, honest reporting is never a preferred action. The extent of tax evasion is a( z) ay ( ) captured by e dz / e * Y Y. The slope of γ in the domain ( ) ( ) * [ Y,1000] is 1 2 ay ( ) ay Y a( z) γ ( Y ) = 1 2 e e A ( Y ) e dz ay ( ) Y * ( e ) ( ) AY = ay ( ) e Y Y * az ( ) e dz > 0. Thus, the reported income itself is an increasing function, and Assumption A1 is fulfilled. Figure 1 is obtained by applying the formula in (4) to our experimental setting with numerical calculation of the integral. References Ahmed, E Validation of the Management of Shame State Shame Acknowledgment and Shame Displacement (MOSS-SASD) in the context of taxation. Working Paper. The Australian National University, Canberra, Australia. Allingham, M. G., & Sandmo, A. (1972). Income tax evasion: A theoretical analysis. Journal of Public Economics, 1(3 4), , doi: Alm, J. (1988). Uncertain tax policies, individual behavior, and welfare. The American Economic Review, Alm, J. (1991). A Perspective on the Experimental Analysis of Taxpayer Reporting. The Accounting Review, 66(3), , doi: / Alm, J. (2012). Measuring, explaining, and controlling tax evasion: Lessons from theory, experiments, and field studies. International Tax and Public Finance, 19(1), 54-77, doi: /s Alm, J., Cronshaw, M. B., & McKee, M. (1993). Tax compliance with endogenous audit selection rules.kyklos, 46(1),
26 Alm, J., & McKee, M. (2004). Tax compliance as a coordination game. Journal of Economic Behavior & Organization, 54(3), , doi: Alm, J., Bloomquist, K. M., & McKee, M. (2015). On the external validity of laboratory tax compliance experiments. Economic Inquiry, 53(2), Alm, J., Jackson, B. R., & McKee, M. (2009). Getting the word out: Enforcement information dissemination and compliance behavior. Journal of Public Economics, 93(3), Andreoni, J., Erard, B., & Feinstein, J. (1998). Tax compliance. Journal of Economic Literature, 36(2), , doi: / Baldry, J. C. (1986). Tax evasion is not a gamble: A report on two experiments. Economics Letters, 22(4), , doi: Beck, P. J., Jon, S. D., & Jung, W.-O. (1991). Experimental evidence on taxpayer reporting under uncertainty. The Accounting Review, 66(3), , doi: / Becker, G. S. (1968). Crime and Punishment: An Economic Approach. Journal of Political Economy, 76(2), , doi: / Braithwaite, V. (2003). Dancing with tax authorities: Motivational postures and non-compliant actions. In V. Braithwaite (Ed.), Taxing democracy: Understanding tax avoidance and evasion. (pp ). Aldershot, UK: Ashgate. Cadsby, C. B., Maynes, E., & Trivedi, V. U. (2006). Tax compliance and obedience to authority at home and in the lab: A new experimental approach. Experimental Economics, 9(4), Clark, J., Friesen, L., & Muller, A. (2004). The good, the bad, and the regulator: An experimental test of two conditional audit schemes. Economic Inquiry, 42(1), 69-87, doi: /ei/cbh045. Clotfelter, C. T. (1983). Tax evasion and tax rates: An analysis of individual returns. The Review of Economics and Statistics, 65(3), , doi: / Collins, J. H., & Plumlee, R. D. (1991). The taxpayer's labor and reporting decision: The effect of audit schemes. The Accounting Review, 66(3), , doi: / Coricelli, G., Joffily, M., Montmarquette, C., & Villeval, M. C. (2010). Cheating, emotions, and rationality: An experiment on tax evasion. Experimental Economics, 13(2), , doi: /s Dwenger, N., Kleven, H. J., Rasul, I., & Rincke, J. (2014). Extrinsic and intrinsic motivations for tax compliance: Evidence from a field experiment in Germany. Unpublished manuscript, May. 25
27 Fischbacher, U. (2007). z-tree: Zurich toolbox for ready-made economic experiments. Experimental economics, 10(2), Friedland, N., S. Maital,, and A. Rutenberg A simulation study of income tax evasion. Journal of Public Economics, 10(1), Friesen, L. (2003). Targeting enforcement to improve compliance with environmental regulations. Journal of Environmental Economics and Management, 46(1), 72-85, doi: Gërxhani, K. (2004). Tax evasion in transition: Outcome of an institutional clash? Testing Feige's conjecture in Albania. European Economic Review, 48(4), , doi: Gërxhani, K., & Schram, A. (2006). Tax evasion and income source: A comparative experimental study. Journal of Economic Psychology, 27(3), , doi: Greenberg, J. (1984). Avoiding tax avoidance: A (repeated) game-theoretic approach. Journal of Economic Theory, 32(1), 1-13, doi: Halperin, R., & Tzur, J. (1990). Tax evasion and the low penalty, low audit rate phenomenon. Journal of Accounting and Public Policy, 9(3), Harrington, W. (1988). Enforcement leverage when penalties are restricted. Journal of Public Economics, 37(1), 29-53, doi: Harsanyi, J. C. (1967). Games with incomplete information played by Bayesian players, I III Part I. The basic model. Management Science, 14(3), , doi: /mnsc Kastlunger, B., Kirchler, E., Mittone, L., & Pitters, J. (2009). Sequences of audits, tax compliance, and taxpaying strategies. Journal of Economic Psychology, 30(3), , doi: Kirchler, E. (2007). The economic psychology of tax behaviour. Cambridge: Cambridge University Press. Kleven, H. J., Knudsen, M. B., Kreiner, C. T., Pedersen, S., & Saez, E. (2011). Unwilling or unable to cheat? Evidence from a tax audit experiment in Denmark. Econometrica, 79(3), Landsberger, M., & Meilijson, I. (1982). Incentive generating state dependent penalty system: The case of income tax evasion. Journal of Public Economics, 19(3), Lefebvre, M., Pestieau, P., Riedl, A., & Villeval, M. (2015). Tax evasion and social information: An experiment in Belgium, France, and the Netherlands. International Tax and Public Finance, 1-25, doi: /s z. 26
28 Porcano, T. M. (1988). Correlates of tax evasion. Journal of Economic Psychology, 9(1), Reinganum, J. F., & Wilde, L. L. (1986). Equilibrium verification and reporting policies in a model of tax compliance. International Economic Review, 27(3), , doi: / Sánchez, I., & Sobel, J. (1993). Hierarchical design and enforcement of income tax policies. Journal of Public Economics, 50(3), , doi: Slemrod, J., Blumenthal, M., & Christian, C. (2001). Taxpayer response to an increased probability of audit: evidence from a controlled experiment in Minnesota. Journal of Public Economics, 79(3), Slemrod, J. (2007). Cheating ourselves: The economics of tax evasion. The Journal of Economic Perspectives, 21(1), 25-48, doi: / Webber, C., & Wildavsky, A. B. (1986). A history of taxation and expenditure in the Western world. New York: Simon & Schuster. Weck-Hannemann, H., and W. Pommerehne Einkommenssteuerhinterzie- hung in der Schweiz: Eine empirische Analyse. Schweizerische Zeitschrift fur Volkswirtschaft und Statistik 125(4): Yitzhaki, S. (1974). Income tax evasion: A theoretical analysis. Journal of Public Economics, 3(2), , doi: 27
29 Table 1 Theoretical predictions of tax revenues (including penalty) per taxpayer under different audit rules Audit Rule Cut-off O Cut-off S LIRA Random Tax Rev Penalty Rev Total
30 Table 2 Summary statistics for tax gap by audit rule Rule Cut-off O Cut-off S LIRA Random Median Standard Deviation Minimum Maximum
31 Table 3 Mean compliance rates in different data sets and the variance in all compliance rates Income Rule Cut-off O Cut-off S LIRA Random All (0.0156) (0.0124) (0.0095) (0.019) t -test vs. Cut-off S ** vs. LIRA *** N. Sig vs. Random *** *** *** Standard deviation of compliance rate F- test vs. Cut-off S *** vs. LIRA *** *** vs. Random N. Sig *** *** Q1: (0.033) (0.0306) (0.0194) (0.0406) t -test vs. Cut-off S * vs. LIRA *** *** vs. Random N. Sig *** *** Q2: (0.0316) (0.0275) (0.0159) (0.0416) t -test vs. Cut-off S *** vs. LIRA *** N. Sig vs. Random N. Sig *** *** Q3: (0.0302) (0.0195) (0.0168) (0.0328) t -test vs. Cut-off S * vs. LIRA N. Sig *** vs. Random N. Sig *** N. Sig Q4: (0.0292) (0.0142) (0.019) (0.0378) t -test vs. Cut-off S *** vs. LIRA *** N. Sig vs. Random *** N. Sig * Notes: a) The number in parentheses is the standard error of the mean. b) N.Sig. = not significant. p < 0.10, p < 0.05, p <
32 Table 4 Revenue from tax and penalty per report by audit rule Rule Cut-off O Cut-off S LIRA Random Number of observations Tax Mean (2.23) (1.52) (1.53) (2.52) t -test vs. Cut-off S N. Sig. vs. LIRA N. Sig. N. Sig. vs. Random *** N. Sig. *** Expected mean (1.88) (1.22) (1.01) (0) t -test actual vs. expected *** *** *** *** Penalty Mean (3.63) (3.10) (2.87) (5.05) t -test vs. Cut-off S N. Sig. vs. LIRA * N. Sig. vs. Random N. Sig. *** *** Expected mean (0) (0) (0.18) (1.95) t -test actual vs. expected *** *** *** *** Total Mean (3.74) (2.93) (2.95) (5.2) t -test vs. Cut-off S * vs. LIRA N. Sig. N. Sig. vs. Random N. Sig. N. Sig. N. Sig. Expected mean (1.88) (1.22) (1.09) (1.95) t -test actual vs. expected N. Sig. *** *** *** Notes: a) The number in parentheses is the standard error of the mean. b) Expected mean shows how much the subjects would earn if they always followed the equilibrium report, given their realized income. c) N.Sig. = not significant. p < 0.10, p < 0.05, p <
33 Table 5 Definition of variables Variable Definition IncomeQ1(reference) a) equal to 1 if Income is 10 or more and 250 or less, and 0 otherwise IncomeQ2 a) equal to 1 if Income is 260 or more and 500 or less, and 0 otherwise IncomeQ3 a) equal to 1 if Income is 510 or more and 750 or less, and 0 otherwise IncomeQ4 a) equal to 1 if Income is 760 or more and 1000 or less, and 0 otherwise Random(reference) a) equal to 1 if an audit scheme is Random, and 0 otherwise Cut-Off O a) equal to 1 if an audit scheme is Cut-Off O, and 0 otherwise Cut-Off S a) equal to 1 if an audit scheme is Cut-Off S, and 0 otherwise LIRA a) equal to 1 if an audit scheme is LIRA, and 0 otherwise Tax awareness b) the tax-payment awareness of a subject Acceptable tax rate the acceptable tax rate of a subject on 10,000 Aggressiveness b) the aggressiveness of a subject against tax evasion Needs for audit b) Satisfaction for public survices b) the needs for tax audit that a subject feels the satisfaction for public survices of a subject Risk appetite c) Male Decision time Audit (t-1) Penalty (t-1) the risk preference of a subject male of a subject time spent in order that a subject reports income equal to 1 if a subject was audited at the precious period (t-1), and 0 otherwise the amount of penalty (t-1) Notes: a) The variables are indicator variables. b) Each question is categorized into one of four questionnaire items: tax awareness, aggressiveness toward tax aversion, need for tax audit, and satisfaction with public services. 10 means that each answer for the questionnaire item of a subject is low, and 100 means that each item is high. For correspondence between each question and questionnaire item, see the online supplementary material. c) We used the answers for question 3 where every outcome is positive. A larger number means that the subject is risk-averse. 32
34 1 2 3 Table 6 Summary of descriptive statistics for true reporting vs. under-reporting Summary of Descriptive Statistics True Reporting Underreporting differences mean std.dev mean std.dev t or χ 2 IncomeQ *** IncomeQ *** IncomeQ *** IncomeQ *** Landom Cut-Off O *** Cut-Off S ** LIRA *** Tax awareness *** Acceptable tax rate Aggressiveness ** Needs for audit *** Satisfaction for pulic service Risk appetite ** Decision time * Male Audit (t-1) Penalty(t-1) *** Number of Ovservations n=1857 n=689 Notes: p < 0.10, p < 0.05, p <

35 1 Table 7 Determinants of compliance rate Notes: p < 0.10, p < 0.05, p <
 2 3 Notes: p < 0.10, p < 0.05, p < 0.")
36 1 Table 7 Determinants of compliance rate (Continued) 2 3 Notes: p < 0.10, p < 0.05, p <
37 Figure captions Fig. 1 Theoretical predictions of reported incomes under different audit rules Fig. 2 Tax gap by audit rule Fig. 3 Observed reporting behavior by audit rule 36

38

39
40
Who is audited? Experimental study on rule-based and human tax auditing schemes
 Social Design Engineering Series SDES-2015-9 Who is audited? Experimental study on rule-based and human tax auditing schemes Yoshio Kamijo Kochi University of Technology Research Center for Social Design
Effectiveness of the Cutoff Audit Rule and Inequality of Income
 α Effectiveness of the Cutoff Audit Rule and Inequality of Income by PISSAS DIMITRIOS a and KOTSIOS STELIOS b Department of Economics, National and Kapodistrian University of Athens, Athens, Greece. email:
Economic and Social Incentives for Tax Compliance: Evidence from a Field Experiment in Germany
 Economic and Social Incentives for Tax Compliance: Evidence from a Field Experiment in Germany Nadja Dwenger (MPI) Henrik Kleven (LSE) Imran Rasul (UCL) Johannes Rincke (Univ. of Erlangen-Nuremberg) July
Extrinsic and Intrinsic Motivations for Tax Compliance: Evidence from a Field Experiment in Germany
 Extrinsic and Intrinsic Motivations for Tax Compliance: Evidence from a Field Experiment in Germany Nadja Dwenger (MPI) Henrik Kleven (LSE) Imran Rasul (UCL) Johannes Rincke (Erlangen-Nuremberg) October
Risk Aversion and Tacit Collusion in a Bertrand Duopoly Experiment
 Risk Aversion and Tacit Collusion in a Bertrand Duopoly Experiment Lisa R. Anderson College of William and Mary Department of Economics Williamsburg, VA 23187 lisa.anderson@wm.edu Beth A. Freeborn College
Characterization of the Optimum
 ECO 317 Economics of Uncertainty Fall Term 2009 Notes for lectures 5. Portfolio Allocation with One Riskless, One Risky Asset Characterization of the Optimum Consider a risk-averse, expected-utility-maximizing
All Equilibrium Revenues in Buy Price Auctions
 All Equilibrium Revenues in Buy Price Auctions Yusuke Inami Graduate School of Economics, Kyoto University This version: January 009 Abstract This note considers second-price, sealed-bid auctions with
Chapter 2 Defining and Measuring Undeclared Work
 Chapter 2 Defining and Measuring Undeclared Work 2.1 Definition Undeclared work as to the definition used subsequently describes income from productive economic activities which are legal and taxable,
PAULI MURTO, ANDREY ZHUKOV
 GAME THEORY SOLUTION SET 1 WINTER 018 PAULI MURTO, ANDREY ZHUKOV Introduction For suggested solution to problem 4, last year s suggested solutions by Tsz-Ning Wong were used who I think used suggested
Why do people evade taxes? What should governments do about tax evasion?
 Cha 1 Why do people evade taxes? What should governments do about tax evasion? L E N T T E R M P R E S E N T A T I O N E S S A Y E C325: P U B L I C E C O N O M I C S Eugene Clifton Cha LT Presentation
Comparing Allocations under Asymmetric Information: Coase Theorem Revisited
 Comparing Allocations under Asymmetric Information: Coase Theorem Revisited Shingo Ishiguro Graduate School of Economics, Osaka University 1-7 Machikaneyama, Toyonaka, Osaka 560-0043, Japan August 2002
Payoff Scale Effects and Risk Preference Under Real and Hypothetical Conditions
 Payoff Scale Effects and Risk Preference Under Real and Hypothetical Conditions Susan K. Laury and Charles A. Holt Prepared for the Handbook of Experimental Economics Results February 2002 I. Introduction
Aggressive Corporate Tax Behavior versus Decreasing Probability of Fiscal Control (Preliminary and incomplete)
") Aggressive Corporate Tax Behavior versus Decreasing Probability of Fiscal Control (Preliminary and incomplete) Cristian M. Litan Sorina C. Vâju October 29, 2007 Abstract We provide a model of strategic
Aggressive Corporate Tax Behavior versus Decreasing Probability of Fiscal Control (Preliminary and incomplete) Cristian M. Litan Sorina C. Vâju October 29, 2007 Abstract We provide a model of strategic
Random Variables and Applications OPRE 6301
 Random Variables and Applications OPRE 6301 Random Variables... As noted earlier, variability is omnipresent in the business world. To model variability probabilistically, we need the concept of a random
Impact of Imperfect Information on the Optimal Exercise Strategy for Warrants
 Impact of Imperfect Information on the Optimal Exercise Strategy for Warrants April 2008 Abstract In this paper, we determine the optimal exercise strategy for corporate warrants if investors suffer from
THE CODING OF OUTCOMES IN TAXPAYERS REPORTING DECISIONS. A. Schepanski The University of Iowa
 THE CODING OF OUTCOMES IN TAXPAYERS REPORTING DECISIONS A. Schepanski The University of Iowa May 2001 The author thanks Teri Shearer and the participants of The University of Iowa Judgment and Decision-Making
Supplementary Material for: Belief Updating in Sequential Games of Two-Sided Incomplete Information: An Experimental Study of a Crisis Bargaining
 Supplementary Material for: Belief Updating in Sequential Games of Two-Sided Incomplete Information: An Experimental Study of a Crisis Bargaining Model September 30, 2010 1 Overview In these supplementary
KIER DISCUSSION PAPER SERIES
 KIER DISCUSSION PAPER SERIES KYOTO INSTITUTE OF ECONOMIC RESEARCH http://www.kier.kyoto-u.ac.jp/index.html Discussion Paper No. 657 The Buy Price in Auctions with Discrete Type Distributions Yusuke Inami
PAULI MURTO, ANDREY ZHUKOV. If any mistakes or typos are spotted, kindly communicate them to
 GAME THEORY PROBLEM SET 1 WINTER 2018 PAULI MURTO, ANDREY ZHUKOV Introduction If any mistakes or typos are spotted, kindly communicate them to andrey.zhukov@aalto.fi. Materials from Osborne and Rubinstein
FIGURE A1.1. Differences for First Mover Cutoffs (Round one to two) as a Function of Beliefs on Others Cutoffs. Second Mover Round 1 Cutoff.
 as a Function of Beliefs on Others Cutoffs. Second Mover Round 1 Cutoff.") APPENDIX A. SUPPLEMENTARY TABLES AND FIGURES A.1. Invariance to quantitative beliefs. Figure A1.1 shows the effect of the cutoffs in round one for the second and third mover on the best-response cutoffs
APPENDIX A. SUPPLEMENTARY TABLES AND FIGURES A.1. Invariance to quantitative beliefs. Figure A1.1 shows the effect of the cutoffs in round one for the second and third mover on the best-response cutoffs
On the provision of incentives in finance experiments. Web Appendix
 On the provision of incentives in finance experiments. Daniel Kleinlercher Thomas Stöckl May 29, 2017 Contents Web Appendix 1 Calculation of price efficiency measures 2 2 Additional information for PRICE
6.254 : Game Theory with Engineering Applications Lecture 3: Strategic Form Games - Solution Concepts
 6.254 : Game Theory with Engineering Applications Lecture 3: Strategic Form Games - Solution Concepts Asu Ozdaglar MIT February 9, 2010 1 Introduction Outline Review Examples of Pure Strategy Nash Equilibria
Expected utility theory; Expected Utility Theory; risk aversion and utility functions
 ; Expected Utility Theory; risk aversion and utility functions Prof. Massimo Guidolin Portfolio Management Spring 2016 Outline and objectives Utility functions The expected utility theorem and the axioms
Income Tax Evasion and the Penalty Structure. Abstract
 Income Tax Evasion and the Penalty Structure Rainald Borck DIW Berlin Abstract In the Allingham Sandmo (AS) model of tax evasion, fines are paid on evaded income, whereas in the Yitzhaki (Y) model fines
Department of Economics Working Paper
 Department of Economics Working Paper Number 13-24 October 2013 Efficient tax reporting: The effects of taxpayer information services Christian A. Vossler University of Tennessee Michael McKee Appalachian
Unemployment, tax evasion and the slippery slope framework
 MPRA Munich Personal RePEc Archive Unemployment, tax evasion and the slippery slope framework Gaetano Lisi CreaM Economic Centre (University of Cassino) 18. March 2012 Online at https://mpra.ub.uni-muenchen.de/37433/
experimental approach
 : an experimental approach Oxford University Gorman Workshop, Department of Economics November 5, 2010 Outline 1 2 3 4 5 6 7 The decision over when to retire is influenced by a number of factors. Individual
Informal Sector and Taxation
 MPRA Munich Personal RePEc Archive Informal Sector and Taxation Mohamed Jellal Al Makrîzî Institut d Economie 2. August 2009 Online at http://mpra.ub.uni-muenchen.de/17129/ MPRA Paper No. 17129, posted
Evolution of Strategies with Different Representation Schemes. in a Spatial Iterated Prisoner s Dilemma Game
 Submitted to IEEE Transactions on Computational Intelligence and AI in Games (Final) Evolution of Strategies with Different Representation Schemes in a Spatial Iterated Prisoner s Dilemma Game Hisao Ishibuchi,
Killing two birds with one stone: Reducing fiscal and welfare loss of tax evasion
 Noname manuscript No. (will be inserted by the editor) Killing two birds with one stone: Reducing fiscal and welfare loss of tax evasion Rostislav Staněk Ondřej Krčál Received: date / Accepted: date Abstract
An Experimental Study of Taxpayer Compliance. Behavior Under Alternative Reporting Regimes
 An Experimental Study of Taxpayer Compliance Behavior Under Alternative Reporting Regimes M.S. Plan B Paper University of Minnesota Applied Economics Graduate Program Matthew Bombyk Advisor: Dr. Laura
Trading Company and Indirect Exports
 Trading Company and Indirect Exports Kiyoshi Matsubara June 015 Abstract This article develops an oligopoly model of trade intermediation. In the model, manufacturing firm(s) wanting to export their products
Special Reports Tax Notes, Apr. 16, 1990, p Tax Notes 341 (Apr. 16, 1990)
") WHY ARE TAXES SO COMPLEX AND WHO BENEFITS? Special Reports Tax Notes, Apr. 16, 1990, p. 341 47 Tax Notes 341 (Apr. 16, 1990) Michelle J. White is Professor of Economics at the University of Michigan. This
WHY ARE TAXES SO COMPLEX AND WHO BENEFITS? Special Reports Tax Notes, Apr. 16, 1990, p. 341 47 Tax Notes 341 (Apr. 16, 1990) Michelle J. White is Professor of Economics at the University of Michigan. This
Investment Decisions and Negative Interest Rates
 Investment Decisions and Negative Interest Rates No. 16-23 Anat Bracha Abstract: While the current European Central Bank deposit rate and 2-year German government bond yields are negative, the U.S. 2-year
What are the additional assumptions that must be satisfied for Rabin s theorem to hold?
 Exam ECON 4260, Spring 2013 Suggested answers to Problems 1, 2 and 4 Problem 1 (counts 10%) Rabin s theorem shows that if a person is risk averse in a small gamble, then it follows as a logical consequence
An experimental investigation of evolutionary dynamics in the Rock- Paper-Scissors game. Supplementary Information
 An experimental investigation of evolutionary dynamics in the Rock- Paper-Scissors game Moshe Hoffman, Sigrid Suetens, Uri Gneezy, and Martin A. Nowak Supplementary Information 1 Methods and procedures
We examine the impact of risk aversion on bidding behavior in first-price auctions.
 Risk Aversion We examine the impact of risk aversion on bidding behavior in first-price auctions. Assume there is no entry fee or reserve. Note: Risk aversion does not affect bidding in SPA because there,
Working Paper. R&D and market entry timing with incomplete information
 - preliminary and incomplete, please do not cite - Working Paper R&D and market entry timing with incomplete information Andreas Frick Heidrun C. Hoppe-Wewetzer Georgios Katsenos June 28, 2016 Abstract
Problem Set 1. Debraj Ray Economic Development, Fall 2002
 Debraj Ray Economic Development, Fall 2002 Problem Set 1 You will benefit from doing these problems, but there is no need to hand them in. If you want more discussion in class on these problems, I will
FIN 48 and tax compliance
 FIN 48 and tax compliance Lillian F. Mills, University of Texas at Austin Leslie A. Robinson, Tuck School of Business at Dartmouth Richard C. Sansing, Tuck School of Business at Dartmouth and Tilburg University
Tax Gap Map Tax Year 2006 ($ billions)
") Tax Gap Map Tax Year 2006 ($ billions) Total Tax Liability $2,660 Gross Tax Gap: $450 (Voluntary Compliance Rate = 83.1%) Tax Paid Voluntarily & Timely: $2,210 Enforced & Other Late Payments of Tax $65
Tax Gap Map Tax Year 2006 ($ billions) Total Tax Liability $2,660 Gross Tax Gap: $450 (Voluntary Compliance Rate = 83.1%) Tax Paid Voluntarily & Timely: $2,210 Enforced & Other Late Payments of Tax $65
Mental Accounting in Tax Evasion Decisions An Experiment on Underreporting and Overdeducting
 Arbeitskreis Quantitative Steuerlehre Quantitative Research in Taxation Discussion Papers Martin Fochmann / Nadja Wolf Mental Accounting in Tax Evasion Decisions An Experiment on Underreporting and Overdeducting
Leverage Aversion, Efficient Frontiers, and the Efficient Region*
 Posted SSRN 08/31/01 Last Revised 10/15/01 Leverage Aversion, Efficient Frontiers, and the Efficient Region* Bruce I. Jacobs and Kenneth N. Levy * Previously entitled Leverage Aversion and Portfolio Optimality:
Evaluating Strategic Forecasters. Rahul Deb with Mallesh Pai (Rice) and Maher Said (NYU Stern) Becker Friedman Theory Conference III July 22, 2017
 and Maher Said (NYU Stern) Becker Friedman Theory Conference III July 22, 2017") Evaluating Strategic Forecasters Rahul Deb with Mallesh Pai (Rice) and Maher Said (NYU Stern) Becker Friedman Theory Conference III July 22, 2017 Motivation Forecasters are sought after in a variety of
Evaluating Strategic Forecasters Rahul Deb with Mallesh Pai (Rice) and Maher Said (NYU Stern) Becker Friedman Theory Conference III July 22, 2017 Motivation Forecasters are sought after in a variety of
Zhiling Guo and Dan Ma
 RESEARCH ARTICLE A MODEL OF COMPETITION BETWEEN PERPETUAL SOFTWARE AND SOFTWARE AS A SERVICE Zhiling Guo and Dan Ma School of Information Systems, Singapore Management University, 80 Stanford Road, Singapore
Sam Bucovetsky und Andreas Haufler: Preferential tax regimes with asymmetric countries
 Sam Bucovetsky und Andreas Haufler: Preferential tax regimes with asymmetric countries Munich Discussion Paper No. 2006-30 Department of Economics University of Munich Volkswirtschaftliche Fakultät Ludwig-Maximilians-Universität
Revenue Equivalence and Income Taxation
 Journal of Economics and Finance Volume 24 Number 1 Spring 2000 Pages 56-63 Revenue Equivalence and Income Taxation Veronika Grimm and Ulrich Schmidt* Abstract This paper considers the classical independent
THEORIES OF BEHAVIOR IN PRINCIPAL-AGENT RELATIONSHIPS WITH HIDDEN ACTION*
 1 THEORIES OF BEHAVIOR IN PRINCIPAL-AGENT RELATIONSHIPS WITH HIDDEN ACTION* Claudia Keser a and Marc Willinger b a IBM T.J. Watson Research Center and CIRANO, Montreal b BETA, Université Louis Pasteur,
Risk Aversion and Compliance in Markets for Pollution Control
 University of Massachusetts Amherst Department of Resource Economics Working Paper No. 26-2 http://www.umass.edu/resec/workingpapers Risk Aversion and Compliance in Markets for Pollution Control John K.
The Hidden Costs of Tax Evasion
 The Hidden Costs of Tax Evasion Collaborative Tax Evasion in Markets for Expert Services Loukas Balafoutas a Adrian Beck b Rudolf Kerschbamer b, * Matthias Sutter c, a a Department of Public Finance, University
Volume 39, Issue 1. Tax Framing and Productivity: evidence based on the strategy elicitation
 Volume 39, Issue 1 Tax Framing and Productivity: evidence based on the strategy elicitation Hamza Umer Graduate School of Economics, Waseda University Abstract People usually don't like to pay income tax
Making Hard Decision. ENCE 627 Decision Analysis for Engineering. Identify the decision situation and understand objectives. Identify alternatives
 CHAPTER Duxbury Thomson Learning Making Hard Decision Third Edition RISK ATTITUDES A. J. Clark School of Engineering Department of Civil and Environmental Engineering 13 FALL 2003 By Dr. Ibrahim. Assakkaf
Self-Government and Public Goods: An Experiment
 Self-Government and Public Goods: An Experiment Kenju Kamei and Louis Putterman Brown University Jean-Robert Tyran* University of Copenhagen * No blame for this draft. Centralized vs. Decentralized Sanctions
Learning Objectives = = where X i is the i t h outcome of a decision, p i is the probability of the i t h
 Learning Objectives After reading Chapter 15 and working the problems for Chapter 15 in the textbook and in this Workbook, you should be able to: Distinguish between decision making under uncertainty and
Liability, Insurance and the Incentive to Obtain Information About Risk. Vickie Bajtelsmit * Colorado State University
 \ins\liab\liabinfo.v3d 12-05-08 Liability, Insurance and the Incentive to Obtain Information About Risk Vickie Bajtelsmit * Colorado State University Paul Thistle University of Nevada Las Vegas December
A NOTE ON SANDRONI-SHMAYA BELIEF ELICITATION MECHANISM
 The Journal of Prediction Markets 2016 Vol 10 No 2 pp 14-21 ABSTRACT A NOTE ON SANDRONI-SHMAYA BELIEF ELICITATION MECHANISM Arthur Carvalho Farmer School of Business, Miami University Oxford, OH, USA,
The excess burden of tax evasion - An experimental detection-concealment contest
 School of Economics Working Paper 2004-07 The excess burden of tax evasion - An experimental detection-concealment contest Ralph-C Bayer and Matthias Sutter School of Economics University of Adelaide University,
Public Finance and Public Policy: Responsibilities and Limitations of Government. Presentation notes, chapter 9. Arye L. Hillman
 Public Finance and Public Policy: Responsibilities and Limitations of Government Arye L. Hillman Cambridge University Press, 2009 Second edition Presentation notes, chapter 9 CHOICE OF TAXATION Topics
Aggressive Corporate Tax Behavior versus Decreasing Probability of Fiscal Control
 Aggressive Corporate Tax Behavior versus Decreasing Probability of Fiscal Control Cristian M. Litan Sorina C. Vâju February 6, 2008 Abstract We provide a model of strategic interaction between the Internal
Relative Performance and Stability of Collusive Behavior
 Relative Performance and Stability of Collusive Behavior Toshihiro Matsumura Institute of Social Science, the University of Tokyo and Noriaki Matsushima Graduate School of Business Administration, Kobe
Economics and Computation
 Economics and Computation ECON 425/563 and CPSC 455/555 Professor Dirk Bergemann and Professor Joan Feigenbaum Reputation Systems In case of any questions and/or remarks on these lecture notes, please
MA200.2 Game Theory II, LSE
 MA200.2 Game Theory II, LSE Problem Set 1 These questions will go over basic game-theoretic concepts and some applications. homework is due during class on week 4. This [1] In this problem (see Fudenberg-Tirole
THEORIES OF TAX EVASION AND THE HIDDEN ECONOMY
 THEORIES OF TAX EVASION AND THE HIDDEN ECONOMY Nordic Workshop on Tax Evasion AGNAR SANDMO Norwegian School of Economics (NHH) TAX EVASION: AN OVERVIEW Point of departure: The expected utility theory of
BIASES OVER BIASED INFORMATION STRUCTURES:
 BIASES OVER BIASED INFORMATION STRUCTURES: Confirmation, Contradiction and Certainty Seeking Behavior in the Laboratory Gary Charness Ryan Oprea Sevgi Yuksel UCSB - UCSB UCSB October 2017 MOTIVATION News
Inflation Expectations and Behavior: Do Survey Respondents Act on their Beliefs? October Wilbert van der Klaauw
 Inflation Expectations and Behavior: Do Survey Respondents Act on their Beliefs? October 16 2014 Wilbert van der Klaauw The views presented here are those of the author and do not necessarily reflect those
Endowment inequality in public goods games: A re-examination by Shaun P. Hargreaves Heap* Abhijit Ramalingam** Brock V.
 CBESS Discussion Paper 16-10 Endowment inequality in public goods games: A re-examination by Shaun P. Hargreaves Heap* Abhijit Ramalingam** Brock V. Stoddard*** *King s College London **School of Economics
Auctions. Michal Jakob Agent Technology Center, Dept. of Computer Science and Engineering, FEE, Czech Technical University
 Auctions Michal Jakob Agent Technology Center, Dept. of Computer Science and Engineering, FEE, Czech Technical University AE4M36MAS Autumn 2015 - Lecture 12 Where are We? Agent architectures (inc. BDI
Problem Set 3: Suggested Solutions
 Microeconomics: Pricing 3E00 Fall 06. True or false: Problem Set 3: Suggested Solutions (a) Since a durable goods monopolist prices at the monopoly price in her last period of operation, the prices must
Strictness of Tax Compliance Norms: A Factorial Survey on the Acceptance of Inheritance Tax Evasion in Germany
 Strictness of Tax Compliance Norms: A Factorial Survey on the Acceptance of Inheritance Tax Evasion in Germany Martin Abraham, Kerstin Lorek, Friedemann Richter, Matthias Wrede Rational Choice Sociology
Taxpayer Services and Tax Compliance
 Bridgewater State University Virtual Commons - Bridgewater State University Economics Faculty Publications Economics Department 2007 Taxpayer Services and Tax Compliance James Alm Michael L. Jones Bridgewater
Game Theory and Economics Prof. Dr. Debarshi Das Department of Humanities and Social Sciences Indian Institute of Technology, Guwahati
 Game Theory and Economics Prof. Dr. Debarshi Das Department of Humanities and Social Sciences Indian Institute of Technology, Guwahati Module No. # 03 Illustrations of Nash Equilibrium Lecture No. # 04
HW Consider the following game:
 HW 1 1. Consider the following game: 2. HW 2 Suppose a parent and child play the following game, first analyzed by Becker (1974). First child takes the action, A 0, that produces income for the child,
An Experimental Study of Compliance and Leverage in Auditing and Regulatory. Enforcement * Timothy N. Cason Purdue University. and
 An Experimental Study of and Leverage in Auditing and Regulatory Enforcement * Timothy N. Cason Purdue University and Lata Gangadharan University of Melbourne March 2005 Abstract Evidence suggests that
Ph.D. Preliminary Examination MICROECONOMIC THEORY Applied Economics Graduate Program August 2017
 Ph.D. Preliminary Examination MICROECONOMIC THEORY Applied Economics Graduate Program August 2017 The time limit for this exam is four hours. The exam has four sections. Each section includes two questions.
DIVIDEND POLICY AND THE LIFE CYCLE HYPOTHESIS: EVIDENCE FROM TAIWAN
 The International Journal of Business and Finance Research Volume 5 Number 1 2011 DIVIDEND POLICY AND THE LIFE CYCLE HYPOTHESIS: EVIDENCE FROM TAIWAN Ming-Hui Wang, Taiwan University of Science and Technology
Risk aversion, Under-diversification, and the Role of Recent Outcomes
 Risk aversion, Under-diversification, and the Role of Recent Outcomes Tal Shavit a, Uri Ben Zion a, Ido Erev b, Ernan Haruvy c a Department of Economics, Ben-Gurion University, Beer-Sheva 84105, Israel.
UC Berkeley Haas School of Business Economic Analysis for Business Decisions (EWMBA 201A) Fall Module I
 Fall Module I") UC Berkeley Haas School of Business Economic Analysis for Business Decisions (EWMBA 201A) Fall 2018 Module I The consumers Decision making under certainty (PR 3.1-3.4) Decision making under uncertainty
UC Berkeley Haas School of Business Economic Analysis for Business Decisions (EWMBA 201A) Fall 2018 Module I The consumers Decision making under certainty (PR 3.1-3.4) Decision making under uncertainty
Chapter 23: Choice under Risk
 Chapter 23: Choice under Risk 23.1: Introduction We consider in this chapter optimal behaviour in conditions of risk. By this we mean that, when the individual takes a decision, he or she does not know
Mixed strategies in PQ-duopolies
 19th International Congress on Modelling and Simulation, Perth, Australia, 12 16 December 2011 http://mssanz.org.au/modsim2011 Mixed strategies in PQ-duopolies D. Cracau a, B. Franz b a Faculty of Economics
Limitations of Dominance and Forward Induction: Experimental Evidence *
 Limitations of Dominance and Forward Induction: Experimental Evidence * Jordi Brandts Instituto de Análisis Económico (CSIC), Barcelona, Spain Charles A. Holt University of Virginia, Charlottesville VA,
Mean-Variance Portfolio Theory
 Mean-Variance Portfolio Theory Lakehead University Winter 2005 Outline Measures of Location Risk of a Single Asset Risk and Return of Financial Securities Risk of a Portfolio The Capital Asset Pricing
Thank you very much for your participation. This survey will take you about 15 minutes to complete.
 This appendix provides sample surveys used in the experiments. Our study implements the experiment through Qualtrics, and we use the Qualtrics functionality to randomize participants to different treatment
Factors that Affect Fiscal Externalities in an Economic Union
 Factors that Affect Fiscal Externalities in an Economic Union Timothy J. Goodspeed Hunter College - CUNY Department of Economics 695 Park Avenue New York, NY 10021 USA Telephone: 212-772-5434 Telefax:
Tax audit impact on voluntary compliance
 MPRA Munich Personal RePEc Archive Tax audit impact on voluntary compliance Yongzhi Niu New York State Department of Taxation and Finance 11. May 2010 Online at https://mpra.ub.uni-muenchen.de/22651/ MPRA
Chapter 7 Tax Compliance and Evasion 1
 Chapter 7 Tax Compliance and Evasion 1 a 7.1 Introduction It is not unusual to be offered a discount for payment in cash. This is almost routine in the employment of the services of builders, plumbers
Social preferences I and II
 Social preferences I and II Martin Kocher University of Munich Course in Behavioral and Experimental Economics Motivation - De gustibus non est disputandum. (Stigler and Becker, 1977) - De gustibus non
The mean-variance portfolio choice framework and its generalizations
 The mean-variance portfolio choice framework and its generalizations Prof. Massimo Guidolin 20135 Theory of Finance, Part I (Sept. October) Fall 2014 Outline and objectives The backward, three-step solution
On the Performance of the Lottery Procedure for Controlling Risk Preferences *
 On the Performance of the Lottery Procedure for Controlling Risk Preferences * By Joyce E. Berg ** John W. Dickhaut *** And Thomas A. Rietz ** July 1999 * We thank James Cox, Glenn Harrison, Vernon Smith
Ph.D. Preliminary Examination MICROECONOMIC THEORY Applied Economics Graduate Program June 2017
 Ph.D. Preliminary Examination MICROECONOMIC THEORY Applied Economics Graduate Program June 2017 The time limit for this exam is four hours. The exam has four sections. Each section includes two questions.
Ideal Bootstrapping and Exact Recombination: Applications to Auction Experiments
 Ideal Bootstrapping and Exact Recombination: Applications to Auction Experiments Carl T. Bergstrom University of Washington, Seattle, WA Theodore C. Bergstrom University of California, Santa Barbara Rodney
Qualified Research Activities
 Page 15 Qualified Research Activities ORS 317.152, 317.153 Year Enacted: 1989 Transferable: No ORS 317.154 Length: 1-year Means Tested: No Refundable: No Carryforward: 5-year TER 1.416, 1.417 Kind of cap:
INDIVIDUAL AND HOUSEHOLD WILLINGNESS TO PAY FOR PUBLIC GOODS JOHN QUIGGIN
 This version 3 July 997 IDIVIDUAL AD HOUSEHOLD WILLIGESS TO PAY FOR PUBLIC GOODS JOH QUIGGI American Journal of Agricultural Economics, forthcoming I would like to thank ancy Wallace and two anonymous
EC 202. Lecture notes 14 Oligopoly I. George Symeonidis
 EC 202 Lecture notes 14 Oligopoly I George Symeonidis Oligopoly When only a small number of firms compete in the same market, each firm has some market power. Moreover, their interactions cannot be ignored.
Asset Allocation. Cash Flow Matching and Immunization CF matching involves bonds to match future liabilities Immunization involves duration matching
 Asset Allocation Strategic Asset Allocation Combines investor s objectives, risk tolerance and constraints with long run capital market expectations to establish asset allocations Create the policy portfolio
Optimal income tax structure with favoritism
 DISCUSSION PAPER April 216 No. 75 Optimal income tax structure with favoritism ideki SAO* Faculty of Economics, Kyushu Sangyo University ----- *E-Mail: hsato@ip.kyusan-u.ac.jp Optimal income tax structure
Loss-leader pricing and upgrades
 Loss-leader pricing and upgrades Younghwan In and Julian Wright This version: August 2013 Abstract A new theory of loss-leader pricing is provided in which firms advertise low below cost) prices for certain
On Delays in Project Completion With Cost Reduction: An Experiment
 On Delays in Project Completion With Cost Reduction: An Experiment June 25th, 2009 Abstract We examine the voluntary provision of a public project via binary contributions when contributions may be made
General Instructions
 General Instructions This is an experiment in the economics of decision-making. The instructions are simple, and if you follow them carefully and make good decisions, you can earn a considerable amount
Asset Pricing in Financial Markets
 Cognitive Biases, Ambiguity Aversion and Asset Pricing in Financial Markets E. Asparouhova, P. Bossaerts, J. Eguia, and W. Zame April 17, 2009 The Question The Question Do cognitive biases (directly) affect
Directed Search and the Futility of Cheap Talk
 Directed Search and the Futility of Cheap Talk Kenneth Mirkin and Marek Pycia June 2015. Preliminary Draft. Abstract We study directed search in a frictional two-sided matching market in which each seller