Pasco County, Florida. Multi-Modal Mobility Fee 2018 Update Study
|
|
|
- Wilfred Holmes
- 5 years ago
- Views:
Transcription
1 Pasco County, Florida Multi-Modal Mobility 2018 Update Study PCPT December 3, 2018
2 PASCO COUNTY 2018 MULTI MODAL MOBILITY FEE UPDATE STUDY Prepared for: Pasco County, Florida Prepared by: W.E. Oliver, P.E., LLC AECOM, Inc. Kittelson and Associates, Inc. December 3,
3 PASCO COUNTY 2018 MULTI MODAL MOBILITY FEE UPDATE STUDY Executive Summary Pasco County has updated its mobility fee to respond to a changing economic and legislative environment. The County s first multi modal mobility fee was adopted in 2011 as a multi modal replacement to its prior transportation impact fee. A fee update was undertaken in 2014, which allowed fees to remain the same in the face of anticipated increased growth rates and increased transportation system costs, based on adoption of the second local option gasoline tax. Since 2014, the economic climate has continued to improve. While growth rates have not matched the 2014 forecast, growth continues in 2018 as the economy continues to improve, and the costs of transportation facilities continue to increase. In addition to the update required by the County s Mobility regulations to address current technical aspects of the fee, in 2018 the County wished to expand the incentive strategies implemented in 2014 and generally maintain the same fee rates. This was possible in 2018 due to an anticipated slower growth rate and stronger property tax increment revenues than in These also enabled the County to achieve better quality of service goals as well as continuing the incentives programs previously implemented. Partial incentives continue to be provided for retail, recreational, institutional, and residential uses, as well. Administrative procedures will ensure that the appropriate levels of tax revenues are transferred to capital programs to annually round out the fee incentives. The fee structure continues to recognize that the urban area will be served by more congested roads and more dependence on public transit, the suburban area will be served by less congested roads and less public transit, and the rural area by even less congested roads and very little public transit. Bicycle facilities and sidewalks are anticipated in all areas. In addition, the continued commitment of Second Local Option Gasoline Tax, Penny for Pasco Sales Tax, and tax increment revenues from the Multi Modal Transportation Fund were relied upon to help fund increased transit operating costs with an expanded system and to incentivize specific job creating land uses and other desired forms of development. W.E. Oliver, P.E., LLC i 2018 Mobility Update Study December 3, 2018 Pasco County, Florida
4 PASCO COUNTY 2018 MULTI MODAL MOBILITY FEE STUDY Table of Contents Executive Summary...i 1.0 Introduction Changes to Current Variables Individual Land Use Trip Characteristics Conversion of Vehicle Trips to Person Trips Reduced Travel Demand for MUTRM, TND and TOD Cost of Transportation Capacity Capacity Addition Ratio Cross District Travel Analysis Calculations County Gasoline Tax Penny for Pasco Sales Tax Equivalent State/Federal Motor Fuel Tax Transit Tax Tax Increment District Revenue Facility Life Interest Rate Fuel Efficiency Effective Days per Year Toll Facility/Interstate Highway Travel Adjustment Factor Revenues for s Program Gasoline Tax Penny for Pasco Sales Tax Property Tax Increment Proposed Schedules Mobility Schedules Example Calculation Indexing Alternate s for Urban Apartments and Mini Warehouse Uses W.E. Oliver, P.E., LLC ii 2018 Mobility Update Study December 3, 2018 Pasco County, Florida
5 List of Figures Figure 1 1 Districts and Planned Improvements Figure 3 1 Harbors/West Market Area Vacant Parcels Zone List of Tables Table 2 1 Development of Trip Length Adjustments by District Table 2 2 Multi Modal Transportation System Cost per Person Mile of Capacity Table 2 3 Equivalent Pennies of Motor Fuel Tax Table 3 1 Budget Estimate Table 3 2 Comparison of 2018 to 2014 s Budgets Table 4 1 Urban Standard Schedule ( District A) Table 4 2 Urban Mixed Use Trip Reduction Measures Schedule ( District A) Table 4 3 Urban Traditional Neighborhood Development Schedule ( District A) Table 4 4 Urban Transit Oriented Development and West (Harbors) Market Area Vacant Parcel Zone Schedule ( District A) Table 4 5 Urban West (Harbors) Market Area Redevelopment District Schedule ( District A) Table 4 6 Suburban Standard Schedule ( District B) Table 4 7 Suburban Mixed Use Trip Reduction Measures Schedule ( District B) Table 4 8 Suburban Traditional Neighborhood Development Schedule ( District B) Table 4 9 Suburban Transit Oriented Development Schedule ( District B) Table 4 10 Rural Standard Schedule ( District C) Table 4 11 Rural Mixed Use Trip Reduction Measures Schedule ( District C) Table 4 12 Rural Traditional Neighborhood Development Schedule ( District C) Appendices APPENDIX A: APPENDIX B: APPENDIX C: APPENDIX D: APPENDIX E: APPENDIX F: APPENDIX G: Trip Characteristics Update Travel Demand of MUTRM, TND, TOD, Mining Uses, and Residential Trip Rates by Size Cost Component Calculations Cross District Travel Analysis Component Calculations and s Revenue Estimates Condensed Schedules for Publication Example Calculation for Mining Land Use W.E. Oliver, P.E., LLC iii 2018 Mobility Update Study December 3, 2018 Pasco County, Florida
6 PASCO COUNTY, FLORIDA MULTI MODAL MOBILITY FEE 2018 UPDATE STUDY SECTION 1 INTRODUCTION Pasco County's history with transportation impact and mobility fees dates back to They were adopted to assist the County in providing adequate roads for expected growth. In July, 2011, the fee was modified to a Multi Modal Mobility, to allow their expenditure on all modes of transportation, to encourage economic development, and to encourage forms of development desired by the County. Per the enacting regulations, an update is required every three years at a minimum to reflect current conditions. This report documents updates to technical aspects of the fee schedule, such as lower anticipated growth rates, changes in transportation revenue programs, and increased costs of providing transportation facilities and services. Some of the specific changes incorporated include: Addition of four new land use categories to the fee schedules, Re proportioned allocation of tax increment revenues to transit, roadway capital, and maintenance and operations, Updating traffic generation rates for some land uses to address a newly released version of the Institute of Transportation Engineers Trip Generation reference, and Making revisions to the County s Mobility Administrative Procedures manual. These changes are documented in the subsequent chapters of this report. The fee developed in this study will continue to fund transit, bicycle, and pedestrian capital facilities as well as roads, in keeping with a legislative emphasis on developing multi modal transportation systems to provide mobility options to citizens of Pasco County. The fee also supports the Comprehensive Plan designation of a geographically tiered (urban, suburban, and rural) growth management and mobility strategy. A part of the mobility fee strategy is the implementation of funding mechanisms that are consistent with the development densities and mobility strategies defined for each geographic area. In the urban area, a transit oriented mobility plan has been adopted with a higher degree of roadway congestion. In the suburban and rural areas, correspondingly less transit and higher levels of roadway service are intended. Figure 1 1 illustrates the area boundaries and the currently adopted Mobility 2040 long range transportation plan roadway improvements. This report is the technical support document to the regulations and documents the fee structure. schedules reflecting the above incentives are included in this report, as well as material supporting the specific parameters used in the fee calculations. W.E. Oliver, P.E., LLC Mobility Update Study December 3, 2018 Pasco County, Florida


7 Figure 1 1: Districts and Planned Improvements 1-1 W.E. Oliver, P.E., LLC Mobility Update Study December 3, 2018 Pasco County, Florida
8 The general equation used to compute the mobility fee for a given land use is: Net Mobility = Impact Cost Self s s The total impact cost is the product of the demand for travel placed on the transportation system times the unit cost of providing for that travel at a prescribed quality of service. The demand is expressed in units of person miles of transportation system capacity consumed. Rather than focusing on roads, bicycles, and pedestrians only, this multi modal mobility fee integrates the capital costs of transit as well. The unit cost of building transportation system capacity is expressed in units of dollars per person mile, and takes into consideration the level of service goal in each subarea of the County. Self credits are an estimate of the revenues generated by the new development itself, that are allocated to transportation system capacity expansion. s are fee reductions to encourage certain forms and locations of development, funded by revenues generated by the pre existing tax base. Thus, the fee represents an "up front" payment for a portion of the cost to provide or replace the transportation facilities consumed by a development. The general topics discussed in this report are as follows: Travel Demand Component, Costs Component, Component, Other variables used in the mobility fee formula, s for favored land uses, Development of fee schedules, and Example fee calculation. Florida Statutes indicate that impact fees must be based on the most current data available. While this study was in progress, Pasco County had also begun to update its long range transportation plan (LRTP) to a horizon year of 2045; however, that plan was not complete at the time this study was completed. Thus, unless otherwise noted, references herein to Pasco County s LRTP refer to the adopted Mobility 2040 transportation plan. W.E. Oliver, P.E., LLC Mobility Update Study December 3, 2018 Pasco County, Florida
9 SECTION 2 CHANGES TO CURRENT FEE VARIABLES There are 11 input components used in the current fee equation: Number of daily trips generated, Length of those trips, Proportion of travel that is new travel, Cost per person mile of capacity, Capacity addition ratio, s for revenues generated by development, Facility life, Interest rate, Fuel efficiency, Effective days per year, and Interstate/toll facility adjustment factor. As necessary, modifications were made to the input components to reflect the current demand, cost, and revenue data obtained for this Update Study. A review of the input components and the proposed changes to them are presented in the following sections. 2.1 Individual Land Use Trip Characteristics The amount of transportation system consumed by a land development activity is calculated using the following units of measure: Number of trips generated, Length of those trips, and Proportion of travel that is new travel, rather than travel that might have already been on the road system. Trip characteristic variables in Pasco County s Mobility s have been obtained primarily from two sources: (1) previous studies conducted nationally and throughout Florida and (2) the Institute of Transportation Engineers (ITE) Trip Generation reference report. For this update, traffic generation rates were updated to reflect information provided in the 10 th Edition Institute of Transportation Engineers Trip Generation reference, released in late 2017, and the changes are summarized in Appendix A. Where the trip generation rates reflected blending of local studies and ITE rates, the blended rates were adjusted to reflect the 10 th Edition Trip Generation rates. Changes that resulted in decreases in travel demand of more than five percent are identified for 26 of the 81 land uses in the fee schedule and increases for 19 uses. The reasons for these changes are attributable to changes indicated in the ITE Trip Generation 10 th Edition reference. While none of the standard average trip lengths for individual land uses were updated in this study, the adjustments associated with each market area (e.g. Urban, Suburban, and Rural) were updated W.E. Oliver, P.E., LLC Mobility Update Study December 3, 2018 Pasco County, Florida
10 making use of data from the adopted 2040 Tampa Bay Regional Planning Model (TBRPM) and the Mobility 2040 plan. Since the analysis process was based on a sampling of trip lengths in different areas of Pasco County, the results of this update effort were combined with a similar sampling from the 2014 update study. Table 2 1 summarizes the results of this modeling exercise, and reconfirms that trips in the rural area tend to be the longest, trips in the suburban area tend to be near average, and trips in the urban area the shortest for each of the model input land use variables used for the analysis. Table 2 1: Development of Trip Length Adjustments by District Residential Industrial Commercial Service Avg Trip Avg Trip Avg Trip Avg Trip District Trips VMT Len Trips VMT Len Trips VMT Len Trips VMT Len U 2,955 18, ,232 11, ,933 52, ,112 15, S 1,967 19, ,030 9, ,431 42, ,763 12, R 2,071 24, , ,918 61, ,406 14, Urban Adjustment: Suburban Adjustment: Rural Adjustment: Legend: Study Value Study Value Average Four new land uses were added to the fee schedules, and the Warehousing land use category was divided into two different land uses. The four land uses added were: Ice Hockey Arena, Non veterinary kennel ( Doggy Day Care ), Breakfast/Lunch only Restaurant, and Fast Casual Restaurant. The Warehouse land use was divided into Active and Passive warehouse types. Development of the trip characteristics for each of these land uses is also documented in Appendix A Conversion of Vehicle Trips to Person Trips For application in a mixed transit and roadway mode, it was necessary to estimate travel in units of person miles. No extensive source of person trip travel generation by land use is available, such as is available for vehicle trips in the ITE Trip Generation reference. It is reasonable to assume that most of the trip generation rate studies in Trip Generation were undertaken in low transit environments, so the person trip generation characteristics for each land use in the fee schedule relied on the ITE vehicle trip generation data. Vehicle trips were converted to person trips by applying a vehicle trip to person trip conversion factor of This value was derived from Pasco County data from the TBRPM (version 8.2). W.E. Oliver, P.E., LLC Mobility Update Study December 3, 2018 Pasco County, Florida
11 2.3. Reduced Travel Demand for MUTRM, TND, and TOD Pasco County is seeking to encourage development forms which minimize the need for travel. Developments meeting certain design criteria, diversity of land uses, density, and proximity to transit services accomplish this objective. Developments exhibiting certain design criteria can be qualified as Mixed Use Trip Reduction Measures (MUTRM) development, Traditional Neighborhood Developments (TND), or Transit Oriented Developments (TOD). Pasco County has developed (or is developing) criteria for the Land Development Code to qualify developments in these categories. Mobility fee rates that reflect the reduced travel generation associated with these forms of development are appropriate. Information contained in the Rimpo/Jones & Stokes 2007 documentation from the URBan EMISsions (URBEMIS) 9.2 software program continues to provide the best source for developing differential estimates of the reductions in travel for MUTRM, TND, and TOD developments from the travel levels of their corresponding standard development forms. The reductions, more completely documented in Appendix B, are based on residential density, the mix of land uses, presence of local serving retail, presence and proximity to transit service, presence of bicycle and pedestrian facilities, and density of the road network. These considerations have led to an estimate that MUTRM development generates percent, TND developments generate percent, and TOD developments generate percent of the travel that their standard counterparts do. These reductions in travel demand are built in to the mobility fee schedules for the MUTRM, TND, and TOD land uses. 2.4 Cost of Transportation Capacity The cost of providing transportation system capacity has increased since 2014, by approximately 6.7 percent. Transportation facility cost information from Pasco County, the Florida Department of Transportation (Florida DOT), and National Highway Construction Cost Index were used to develop a unit cost for adding a lane mile of roadway capacity, including bike lanes and sidewalks. Appendix C provides the data and other support information utilized to estimate the cost increase from The capital costs of providing capacity for transit was estimated based on the County s October, 2013, Public Transit Development Plan (TDP) and the cost index information referenced above, since that version of the TDP is still the current adopted version. Since an impact fee only addresses the capital aspects of providing transportation, operating, maintenance, and administrative costs were excluded. The excluded transit operating costs can be substantial, however, and they are further addressed later in this report. Plans for transit service in the later stages of the Mobility 2040 plan include the development of premium bus rapid transit on dedicated or managed transit way lanes which are more costly per person mile, and the possible introduction of commuter rail and re structuring of transit routes to access that system. These more extensive service enhancements were not considered in this cost model, because they depend on the adoption of additional funding sources. These service expansions and revenue sources are not assured, so they were not relied upon for this fee study. However, this mobility fee structure does consider the expansion of non premium transit services from approximately 6,200 bus miles per day to 16,600 bus miles per day. This increase is based on an estimated allocation of 15 percent of tax increment W.E. Oliver, P.E., LLC Mobility Update Study December 3, 2018 Pasco County, Florida
12 revenues to fund increased transit operating costs. This service expansion would come from added routes, increased frequency of buses, and lengthening the hours of service provided by Pasco County Public Transit. Bicycle and pedestrian facilities provide for relatively small quantities of travel short trip lengths and low volumes and there is little data on bicycle or pedestrian travel generation or trip lengths. Thus, travel demand for these modes by land use cannot be analyzed as readily as vehicular or transit travel can. Because of their relatively small role in the urban travel scheme, they do not have a significant effect on evaluating the costs of providing for mobility. However, bike and pedestrian facilities are important on a road for safety and mobility reasons, and they are a standard part of urban streets and rural roadways. Their costs are included in standard roadway cross sections for which costs are estimated, and their costs are thereby included in the mobility fee. Their costs have been estimated at 4.3, 2.3, and 1.8 percent of the total roadway costs, for the urban, suburban, and rural fee districts, respectively. Table 2 2 summarizes how roadway and transit costs per person mile of capacity were combined to a single system cost per person mile of capacity. The combination considers the relative magnitude of transit system expansion and road system expansion planned, in terms of person miles of capacity. Transit system expansion is relatively small compared to the road system expansion plans, but is largest in the urban area. Table 2 2 Multi Modal Transportation System Cost per Person Mile of Capacity (by District) network capacity: Urban District Suburban District Rural District Person-Miles Capacity Added: 5,933,837 5,107,977 2,059,080 Cost per Person-Mile: $ $ $ Cost: $1,977,340,707 $1,721,641,920 $648,754,343 Transit network capacity: Person-Miles Transit Capacity Added: 43,039 40,169 23,337 Cost per Person-Mile: $ $1, $1, Transit Cost: $38,151,605 44,713,058 26,892,179 Mixed Mode Capacity, Costs: Person-Miles of Capacity Added: 5,976,876 5,148,146 2,082,417 Cost: $2,015,492,313 $1,766,354,977 $675,646,522 Cost/PMC: $ $ $ Capacity Addition Ratio The capacity addition ratio relates the number of person miles of transportation system capacity that will be added per person mile of travel growth that occurs. The assessable person miles of travel generated by a land use that travels within each of the three fee districts are multiplied by the capacity addition ratio for that district to indicate the number of person miles of capacity that are needed to provide mobility for that land use at the rate consistent with the goals of the adopted comprehensive plan. The capacity addition ratio can be greater or less than 1.00, but it cannot be set at a rate so high as to assess for a better W.E. Oliver, P.E., LLC Mobility Update Study December 3, 2018 Pasco County, Florida
13 quality of service than is currently provided unless other funds, generated by non growth sources, are also committed to bring the current quality of service to that same level. Nor should it be set at a level that exceeds the quality of service that the County realistically expects to deliver in the future. Most current road impact fees are initially computed based on assumptions that capacity will be funded by growth at a rate of 1:1 (or less) relative to growth, where the 1.00 is based on the limit of acceptable roadway service, as established by the adopted level of service standard. Then, fees are discounted to a level of political acceptability. In the absence of other funding to add capacity, continued addition of capacity at this rate will have the long term result of average conditions being at the policy stated limit of acceptable roadway service for any one road so roughly half the transportation system would operate at conditions worse than the adopted standard and half would operate at conditions better than the adopted standard. In the absence of other funding, addition of capacity at a 1:1 rate does not accomplish the requirement of common level of service standards which require that no roads exceed the adopted standard, and that this condition be sustained into the future. Thus, it is useful to monitor transportation system operating conditions. In the urban fee district, the estimated average 2015 level of system utilization (person miles of travel divided by person miles of capacity) was estimated to be (Note: 2015 was used for this estimate because that is the latest year where an inventory of major road network capacity is available associated with the 2045 transportation plan update work in progress.) This is an average condition, so some specific locations in the transportation system currently operate at low levels of congestion and other locations are very congested. The Mobility 2040 plan (with expected travel growth and planned improvements) estimates that the average level of system utilization in urban fee district will increase to This rate of increase reflects the addition of only 0.67 person miles of capacity per person mile of growth in travel, and indicates more severe congestion. This 2018 fee update study, however, establishes a revenue program that could add person miles of capacity per person mile of travel growth increase. This occurs in part because of current stronger tax revenue and slower growth forecasts than were expected in 2014 when the Mobility 2040 plan was developed. With these newer forecasts, the estimated level of urban fee district system utilization in 2043 would still increase, but only to an average utilization of In the rural fee district, the County wishes to preserve the existing rural character. This intention is expressed in policies in both the Land Use and Transportation elements of the Comprehensive Plan, to wit: POLICY TRA 2.3.4: RURAL RESIDENTIAL ROADS (CONSISTENT WITH POLICY FLU ) Pasco County shall recognize the importance of rural residential roads within the Northeast Pasco County Rural Area for the purposes of protecting rural character and shall ensure that these roadways sustain and maintain this character. For the purposes of this policy, "ruralresidential roads" include Lake Iola, Happy Hill, Frazee Hill, Jessamine, Johnston, and Scharber. and W.E. Oliver, P.E., LLC Mobility Update Study December 3, 2018 Pasco County, Florida
14 POLICY TRA 2.3.5: RURAL ROAD SYSTEM (CONSISTENT WITH POLICY FLU ) The collector and arterial roadway system within the Northeast Pasco County Rural Area predominantly consists of two (2) lane facilities. Specific collector, arterial, and rural residential roads shall not be expected to require, nor are they planned to receive, capacity improvements over the twenty (20) year planning period, unless otherwise consistent with Chapter 7, Transportation Element, Table 7 2a, Pasco County Corridor Preservation Table. When not inconsistent with State law or County ordinances and policies, the County shall discourage additional roadway expansions of these facilities beyond two (2) lanes. The 2015 estimated level of system use (person miles of travel divided by person miles of capacity) in the rural fee district is estimated to be The Mobility 2040 plan estimates that by 2040 the level of system utilization in the rural fee district will increase to In an area where predominantly two and four lane roads are expected to serve (and in the absence of other revenues dedicated to system capacity), adding capacity at a rate of 1.33 person miles of capacity per person mile of growth in travel (e.g. 1/0.75) should enable the system to trend toward an average of 75 percent full, allowing the adopted level of service D standard to be maintained. Based on the lower rate of expected growth, and stronger tax increment revenues, by 2043 the estimated level of system utilization is In the suburban fee district, in between conditions are encountered. A suburban development pattern is desired where transit plays a role in mobility, albeit a lesser role than in the urban area. The County s goals are to maintain traditional level of service D standards, although with greater levels of congestion than in the rural area. In the suburban area the rate at which transportation system capacity will be built per unit of transportation growth will be less than in the rural area. In the suburban area, where a mixture of four and six lane arterials would be in keeping with the suburban character (and in the absence of other revenues dedicated to system capacity), adding capacity at a rate of 1.25 personmiles of capacity per person mile of growth in travel (e.g. 1/0.80) will allow the estimated 2015 average system utilization of to trend toward maintaining an average system utilization of 80 percent full, and should enable adopted level of service D standards to be maintained. Again, based on the lower rate of expected growth, and stronger tax increment revenues, by 2043 the estimated level of system utilization in the suburban district is This revenue program should be incorporated into the 2045 long range transportation plan update, which was beginning at the time of this fee update study. 2.6 Cross District Travel Traffic generated in each sub area of the County does not remain exclusively within that sub area. For example, some travel generated in the rural area travels into and through the suburban and/or urban areas en route to its destination. It is appropriate in the calculation of the mobility fee to recognize, and adjust for, the different capacity costs and quality of service expectations when travel generated in one district crosses into other districts. To that end, an analysis of cross district travel was undertaken and used to adjust the unit cost of travel applied to each land use. W.E. Oliver, P.E., LLC Mobility Update Study December 3, 2018 Pasco County, Florida
15 The extent of travel from a land use that makes use of roads in each of the other districts depends upon the length of the trip (shorter trips have a greater proportion of travel in their home district as opposed to other districts) and on the geographic boundary of the district itself. For various trip lengths, the extent of travel in its own and adjacent districts was estimated using Geographic Information Systems (GIS) software and data from the TBRPM. The TBRPM application made use of the Mobility 2040 plan road network. Since the district boundaries did not change from 2014, the 2014 analysis was relied on for this update. Additional discussion of the GIS analysis is provided in Appendix D. An example of the application of the cross district travel analysis to develop the unit cost for system capacity is provided below for a single family home in the urban fee district: Per the fee schedule provided in Table 4 1, a single family home in the urban fee district has a chargeable trip length of 5.86 miles. From the geographic analysis, as shown in Appendix D Table 4, percent of this travel remains in the urban fee district, percent travels in the suburban fee district, and 5.95 percent travels in the rural district. The capacity addition ratios for urban, suburban, and rural fee districts, as discussed in section 2.5, are 0.95, 1.25, and 1.33, respectively, and the unit cost per personmile of travel, as shown in Table 2 2, are $337.22, $343.11, and $324.45, respectively. These values are combined as follows: Weighted cost/person mile of capacity = Sum of (% travel in district * capacity addition ratio for district * cost per person mile of capacity for district) Weighted $$/pmc = (0.7072*0.95*$ *1.25*$ *1.33*$324.45) Weighted $$/pmc = $ Calculations The credit calculations included a review of revenues from gasoline and sales taxes, and since this fee is multi modal, transit revenues utilized for capital aspects of transit system expansion were considered. In addition, credit for tax increment revenues was also considered County Gasoline Tax The present value of gasoline taxes generated by new development over a 25 year period is credited against the cost of the roadway system consumed by travel associated with the development. This is because travel from new development generates gasoline tax revenues, a portion of which is typically allocated to the expansion of the transportation system. In support of the mobility program, the Second Local Option Gasoline Tax of 5 cents per gallon was adopted in 2014 for adding roadway capacity. The Board of County Commissioners receives percent of the revenues, for an equivalent rate of 4.7 pennies per gallon. Other motor fuel taxes collected by the County are allocated to transportation system operations and maintenance, and are therefore not considered for system expansion credits Penny for Pasco Sales Tax Equivalent A credit is also given in recognition of the portion of the Penny for Pasco sales tax revenues that are W.E. Oliver, P.E., LLC Mobility Update Study December 3, 2018 Pasco County, Florida
16 dedicated to transportation capacity expansion projects. Originally adopted in 2004 for ten years, this tax was readopted in 2012 for an additional ten years (e.g. through 2024). Beginning in 2015, 40 percent of the 45 percent of the proceeds that are allocated to the County (e.g. 18 percent of the total proceeds) was dedicated to transportation capital projects. This tax credit is allocated as an equivalent gasoline tax (that is, in proportion to the travel generated by the development), the portion allocated to transportation capital generating the equivalent of 6.69 pennies per gallon. For purposes of the mobility fee, this revenue source was assumed to be renewed for the duration of the 25 year planning period State and Federal Motor Fuel Tax In addition, state expenditures on state roads were reviewed and a credit for the capacity expansion portion was provided. The equivalent number of pennies allocated to fund state projects was determined using information for a 12 year period of the Florida DOT Work Program (2012 through 2023). This information was used to develop a list of capacity adding roadway projects similar to, but more extensive than, that previously utilized to determine the per lane mile costs of construction. The equivalency analysis is provided in Appendix E Table 2. The work programs included improvements to Interstate 75, which constituted a sizeable and unusual inflow of capital funds to the work program. The full amount of these funds was not fully recognized because Interstate improvements are not consistently funded on an annual basis in any given County as other arterial road improvements are. It has been since the late 1950 s and early 1960 s that the last funding of major lane addition improvements to I 75 were implemented, so these funds were assumed to occur over a 50 year period, as was done in the 2014 fee update. This assumption resulted in an equivalent of cents of gasoline tax per gallon a number similar to the 25.6 cents determined in the 2014 study, considering in addition that a portion of the State motor fuel tax is indexed to fuel prices Transit Tax Local, state, and federal revenue sources for transit capital expenditures were considered. Though capital funds for transit expansion are more readily available, funding transit operations is more of a challenge. Current federal policies typically provide 80 percent of funding for transit capital infrastructure, so that percentage of the non roadway transit capital cost was converted to an equivalent gasoline tax credit of 0.62 pennies per gallon. Detailed calculations are provided in Appendix C Table C Tax Increment Revenue A credit for potential application of property tax to transportation system expansion was also incorporated into the mobility fee. The ordinance that establishes the tax increment revenue program to support the economic incentives and mobility fee program allows the use of the tax increment revenues generated for transportation system expansion after debt service, funding of specific land use fees (incentives), and transit and roadway operations and maintenance. In 2018, a greater share of these revenues is expected to be used to fund transportation system expansion than in 2014, so a greater recognition of the new growth contribution to the tax increment revenue source was incorporated into the fee than in W.E. Oliver, P.E., LLC Mobility Update Study December 3, 2018 Pasco County, Florida
17 Table 2 3 summarizes the contribution of each component of the gasoline tax and equivalent credit. Revenue Table 2 3 Equivalent Pennies of Motor Fuel Tax Equivalent Pennies/Gallon Data County 2 nd LOGT $ BoCC Adoption, 2014 Penny for Pasco Sales Tax $ Appendix Table E 3 State/Federal Gas Tax (s) $ Appendix Table E 1 State/Federal Transit Capital Funding $ Appendix Table C 3 : $ The portion of property tax allocated to transportation system expansion over the 25 year fee planning period was estimated at percent. The credit for a specific land use was estimated based on a typical tax value of land use per fee unit of development, based on a review of the 2017 tax roll tax value (dated May, 2018). For example, a recently constructed single family home in the suburban area of size 1,501 to 2,499 square feet was estimated to have a taxable value of $151,756. A tax credit for this use was estimated as the present value of the current mill property tax rate and that 5.775% of the annual tax would be allocated to transportation system expansion, or PV ($151,756 x * ) over 25 years at 3.3 percent discount rate = $1,123. Appendix E Table E 5 provides a summary of the property values estimated for each land use and the equations by which the credit was calculated. 2.8 Facility Life The facility life relates to the time period over which revenues might be bonded to pay for an improvement. The life used in the current fee is 25 years, which was used in prior Pasco fees and is typical of impact fees in many other communities; therefore, no change is recommended for this variable. 2.9 Interest Rate This is the discount rate at which tax revenues might be bonded. It is used to compute the present value of the gasoline taxes and other credits generated by new development. The previous update study used a rate of five (5) percent, but as a result of changing economic trends a rate of 3.3 percent is used in this update. This rate is consistent with guidance provided by the Florida DOT for developing long range financial forecasts for long range transportation plans Fuel Efficiency The fuel efficiency (i.e., the average miles traveled per gallon of fuel consumed) of the fleet of motor vehicles using the road system over the next 25 years is used to estimate the quantity of gasoline consumed by travel associated with a particular land use. In the 2014 Mobility, a fuel efficiency rate of miles per gallon (mpg) was used. Per data provided by the Federal Highway Administration W.E. Oliver, P.E., LLC Mobility Update Study December 3, 2018 Pasco County, Florida
18 (Highway Statistics Table VM 1, 2016, provided in Appendix E Table E 6), the fleet fuel efficiency has improved since the 2014 study data was undertaken, and the current fuel efficiency estimate is miles per gallon Effective Days per Year An effective 365 days per year of operation was assumed for all land uses in the current fee. However, this will not be the case for all land uses since some uses operate only on weekdays (e.g., office buildings) and/or only seasonally (e.g., schools). The use of 365 days per year, therefore, provides a "conservative" element, ensuring that gasoline and equivalent gasoline taxes are adequately credited against the fee. No changes to the effective days per year are proposed in this fee update Toll Facility/Interstate Highway Travel Adjustment Factor Pasco County s mobility fee includes I 75 travel in its considerations. However, travel on the Suncoast Parkway, a toll facility, was excluded from the travel demand considerations, since drivers pay for that facility through the payment of tolls each time they pass through a toll gate. The quantity of travel generated by each fee district that makes use of the Suncoast Parkway was estimated using the selectzone traffic assignment procedures of the TBRPM, which indicated that 1.7, 1.0, and 3.8 percent of the travel generated in the urban, suburban, and rural districts, respectively, make use of the Suncoast Parkway. The fee calculations designate a portion of the fee for Florida s Strategic Intermodal System. These funds are to be spent in consultation with the Florida DOT. In a similar way to Toll Facility travel, the portion of travel from each fee district making use of I 75 was estimated in the same way making use of the TBRPM s select zone travel assignment procedures. These values are similar to those in the 2014 fee. W.E. Oliver, P.E., LLC Mobility Update Study December 3, 2018 Pasco County, Florida
19 SECTION 3 REVENUES FOR INCENTIVES PROGRAM To encourage tourism, attract development that creates employment opportunities, encourage compact development locations and forms of development, and encourage redevelopment in areas in need of redevelopment, Pasco County provides reduced mobility fees as incentives. Specifically, the following incentive strategies have been incorporated into the fee structure: Office, industrial, and hotel/motel development at any location in the County is not charged a mobility fee, Redevelopment in the Harbors/West Market Area of the County is not charged a mobility fee, s for urban and rural developments exhibiting certain Mixed Use, Travel Reducing Measures (MUTRM) are 75 percent of the corresponding Standard fee rates, s for urban and rural Traditional Neighborhood Development (TND) are 50 percent of the corresponding Standard fee rates, s for urban Transit Oriented Development (TOD) are 25 percent of the corresponding Standard fee rates, and Reduced fees for suburban district MUTRM, TND, and TOD match the corresponding urban fee district rates. In the 2018 Update, the County expanded the incentives program to add the following incentives: Reduce mobility fees for residential homes on 5+ acre lots in the rural district to match the corresponding size suburban district residential home fees, and Provide a new incentive to encourage development of vacant parcels in designated portions of the West (Harbors) Market Area, allowing such development to pay a fee of 25 percent of the corresponding Standard fee rates, matching the urban fee district TOD fees (this is in addition to the already existing zero fee incentive to redevelopment in the Harbors (West) district). These designated areas are illustrated in Figure 3 1. Revenues not required to fund these incentive programs are applied to fund transportation system expansion and to reduce mobility fees for other new development not specifically incentivized through the above programs. In light of reduced growth rates and stronger than previously expected growth in tax revenues (primarily the property tax increment source), and evidence from building permitting since the 2014 fee update (collaborated by input from the development community that certain forms of development were proving to be less attractive than previously thought), it was possible to accomplish all of these objectives. For fairness to all development subject to an impact fee while also seeking to provide incentives for desired forms of development, revenues must be committed from non growth sources to fund the incentives (in other words, pay for the incentive portions of fees that the developer is not required to W.E. Oliver, P.E., LLC Mobility Update Study December 3, 2018 Pasco County, Florida
 Market")


20 Figure 3 1: West (Harbors) Market Area Vacant Parcels Zone Legend W.E. Oliver, P.E., LLC Mobility Update Study December 3, 2018 Pasco County, Florida
21 pay). The County s Multi Modal Tax Increment Ordinance (Chapter 2, Article VI, Division 3 of the Pasco County Code) requires the subsidy be addressed on an annual basis, from County gasoline tax funds, Penny for Pasco sales tax funds, and/or revenue proceeds from the Multi Modal Tax Increment fund. In this analysis, the revenues generated by these three sources were estimated in order that a budget for incentives could be established to avoid failure to meet quality of service goals by over incentivizing. For the gasoline taxes and Penny for Pasco Sales Tax, the proportion of these funds generated by development that existed more than 25 years ago was considered useable for incentives, as the portions of these funds generated by development that has existed for 25 years or less would be considered to still be funding their own share of transportation system capacity expansion. For the tax increment source, since it is newer, the proportion of total property tax generated by development existing at the time the increment revenue source first generated revenues (2013) was determined to be useable for incentives. These proportions were estimated over the coming 25 years (the planning horizon of this study) as approximately 66 percent of the motor fuel tax and Penny for Pasco Sales Tax, and 87 percent of the tax increment revenues. The estimates are further discussed below, and worksheets summarizing the estimates are provided in Appendix E. 3.1 Gasoline Tax Gasoline tax revenues from only the five cent second local option gasoline tax will be allocated for transportation system capacity expansion. Each penny of gasoline tax currently generates approximately $1.7 million per year. 94 percent of that revenue, or approximately $1.6 million per year per penny, is returned to the control of Pasco County. With improving fleet fuel efficiency, the amount of gasoline consumed per vehicle by the vehicle fleet using Pasco County s roads is expected to decline. This feature, plus the effects of inflation, results in the value of gasoline taxes becoming weaker and weaker with each passing year. However, the revenue so garnered is not inconsequential, as this source of revenue will contribute an estimated $138.9 million (present value) to apply toward mobility fee subsidies over the 25 year planning horizon of the fee study. 3.2 Penny for Pasco Sales Tax The Penny for Pasco sales tax was adopted initially in 2004 to fund capital needs, including schools, transportation, and other needs. It was renewed in 2012 for an additional ten years (through 2024). Starting in 2015, the portion of the County share (45 percent) of the Penny for Pasco Sales Tax allocated to transportation was increased to 40 percent, resulting in an estimated annual revenue to transportation in 2018 of $11.3 million. Considering growth, increases in income at percent per year, and discounting at 3.3 percent per year, the sales tax revenue generated by the existing Pasco County are estimated to result in a $180.6 million (present value) contribution to the budget for potential subsidies. 3.3 Property Tax Increment The Board of County Commissioners is continuing to commit a portion of ad valorem property tax increment district revenues to the provision of transportation system capacity and operations. This commitment is described in Chapter 2, Article VI, Division 3 of the Pasco County Code, the Multi Modal W.E. Oliver, P.E., LLC Mobility Update Study December 3, 2018 Pasco County, Florida
22 Tax Increment Ordinance. The revenues to be dedicated to transportation purposes are established under a tax increment strategy. The tax increment strategy establishes a floor valuation of the property tax base, and as the value of the tax base increases, the tax increment (the difference between the taxable valuation in the current year minus the floor value) begins to generate revenue. A commitment of one third of the millage rate, applied to the incremental increase in value, establishes the tax increment yield that will be allocated for transportation purposes. This revenue source was created to respond to transportation maintenance, operations, as well as capital. There is no requirement that any of these funds be spent on capital, and this source of revenue is to be applied to incentives only if the gasoline tax and sales tax revenues are inadequate. When established, it was thought that none, if any, of these revenues would be used for transportation system expansion, so little of the revenue was allocated as a self credit. However, in 2018, a more sizeable proportion of tax increment revenues (55 percent) is planned for system expansion, and the County felt it was appropriate to recognize that growth would generate a larger portion of the tax increment revenues (see section 2.7.5). The portions not recognized as self credits (e.g. the revenues generated by pre increment development) were estimated as revenues that could be used to fund other transportation purposes notably transit operating costs, roadway maintenance, or to fund mobility fee incentives. An estimate of the tax increment revenues was based on discussions with Pasco County s Office of Management and Budget, and review of historical tax valuations. The floor for the tax increment was re adopted in 2012, when County property values were at a relatively low point. In 2013, initial revenues from the tax increment were realized, and increasing proceeds are expected as the value of the tax base appreciates and Save Our Homes tax limits are re set through home sales. Additional details of the tax increment revenue projection are discussed in Appendix E, and this source of revenue has been estimated to contribute $543.0 million (present value) to the various transportation purposes over the 25 year planning horizon of the mobility fee. Tax increment revenues are back end loaded meaning that less revenues will be generated in early years because the value of the tax base will appreciate, or grow, slowly. As the difference increases, the tax increment revenues will also increase. Depending on the rate of growth that actually occurs, the tax increment strategy might not keep pace with the need to fund the fee discounts. To date, however, gasoline taxes and Penny for Pasco revenues have been adequate to meet mobility fee subsidy needs. Table 3 1 summarizes forecasts of the Second Local Option Gasoline Tax, the Penny for Pasco Sales Tax, and the Multi Modal Tax Increment district revenues as discussed above. The three sources combine to create a total present value amount of $862.1 million eligible to subsidize mobility fee incentives. In the strategic planning phase of this study, the past three years of permitted land uses was reviewed and the amount of funding needed to provide the desired incentives was reviewed. As indicated above, actual permitting of incentivized land uses was less than forecasted in 2014, so for the 2018 update, W.E. Oliver, P.E., LLC Mobility Update Study December 3, 2018 Pasco County, Florida
23 Table 3 1 Budget Estimate Tax Year 2nd LOGT P4P Sales Tax Increment 2019 $5,836,569 $8,636,377 $8,179,942 $22,652, $5,965,794 $8,446,065 $9,619,905 $24,031, $6,109,784 $8,259,946 $11,084,686 $25,454, $6,260,355 $8,077,929 $12,455,000 $26,793, $6,286,164 $7,899,923 $18,459,964 $32,646, $6,385,287 $7,725,839 $19,958,839 $34,069, $6,489,659 $7,555,592 $21,285,823 $35,331, $6,612,199 $7,389,096 $22,429,854 $36,431, $6,126,955 $7,226,269 $23,381,951 $36,735, $6,151,688 $7,067,030 $24,323,017 $37,541, $6,175,772 $6,911,301 $25,253,628 $38,340, $6,165,197 $6,759,002 $26,174,348 $39,098, $5,946,164 $6,900,426 $27,085,722 $39,932, $5,760,852 $7,037,890 $27,988,281 $40,787, $5,482,353 $7,046,132 $26,475,666 $39,004, $5,237,767 $6,958,165 $27,288,263 $39,484, $5,185,335 $6,822,177 $28,094,166 $40,101, $4,851,122 $7,049,759 $28,893,813 $40,794, $4,621,398 $6,921,650 $29,687,630 $41,230, $4,735,281 $6,798,563 $30,476,031 $42,009, $4,813,744 $6,719,754 $31,259,422 $42,792, $4,499,814 $6,651,803 $32,038,197 $43,189, $4,427,981 $6,617,158 $32,812,741 $43,857, $4,417,286 $6,581,235 $33,583,429 $44,581, $4,342,391 $6,564,046 $34,350,625 $45,257,062 Present Value: $138,886,909 $180,623,129 $612,640,944 $932,150,983 Note: Transit Operating, way Maintenance, and Tax Increment Self- allocations (as indicated in the 2014 Study report version of this table) have already been deducted from the above numbers. smaller amounts of incentivized development were budgeted for. However, to offset increased costs of transportation facilities, the expanded incentives program, a goal of better quality of transportation service in the urban district, and maintaining the 2014 fee rates, all of the $932.2 million was estimated as needed. Table 3 2 compares the 2018 incentives budgets by land use group with the 2014 budgets. In addition, the strategic planning phase of this study assumed that an additional homestead exemption proposed by the State legislature would be approved by voters in November, In fact, this exemption was not approved, and the revenue estimates in this report have been updated to reflect the proposal s failure. As a result, the tax increment revenue forecasts are 13 percent higher. This revenue will allow the capacity addition ratio (see section 2.5) in the urban area to be increased to (up from 0.85 in 2014 ), improving conditions in response to concerns regarding increasing congestion expressed by the study Stakeholder Group members and in recent County resident surveys. W.E. Oliver, P.E., LLC Mobility Update Study December 3, 2018 Pasco County, Florida
24 Table 3 2: Comparison of 2018 to 2014 s Budgets 1 "Urban" Office/Industrial Match $0 $97.8 $ Countywide TOD 25% of Urban Std $38.7 $ West (Harbors) MA Redevelopment/Vacant Parce Match $0 $39.2 $ Countywide TND 50% of Urban Std, $52.2 $ % of Rural Std 5 "Urban" Hotel/Lodging Match $0 $3.5 $7.3 6 Countywide MUTRM 75% of Urban Std, $70.8 $ % of Rural Std 1 "Suburban" Office/Industrial New - $0 $44.4 $ "Suburban" Hotel/Lodging New - $0 $1.5 $2.5 3 "Rural" Office/Industrial New - $0 $23.7 $ "Rural" Hotel/Lodging New - $0 $0.6 $2.4 5 "Rural" Large Lot SFDU Match 2014 Suburban SFDU n/a $9.6 6 "Urban" Retail/Institutional/Recreational Match 2011 $5,641 $23.9 $ "Urban" Residential 0.8 $5,835 $1.0 $ Suburban Retail/Institutional/Recreational Match 2011 $7,051 $10.6 $ Rural Retail/Institutional/Recreational Match 2011 $8,813 $4.4 $8.0 3 Suburban Residential Match 2011 $8,570 $0.0 $ Rural Residential Match 2011 $9,800 $1.6 $71.7 : $413.9 $938.6 s Budget: $431.2 $938.6 Margin: $17.3 $0.0 Tier 1 Tier 2 Tier 3 The expected rate of growth is an important consideration in establishing the extent to which the above incentives budget can be used to provide incentives. The following paragraphs provide an illustration of this concept. The population projections for Pasco County on which the 2045 long range transportation plan (and this study) are based is 1.99 percent per year through At this rate, an increase of 9.2 million personmiles of travel is estimated over the coming 25 years. If 9.2 million person miles of capacity is built over the same period to match the growth (an overall county Capacity Addition Ratio of 1:1), then the cost of that capacity (at $337.50/person mile) would be $3.0 billion, and the $938.6 million of potential incentives funds could address 31 percent of that need. If, on the other hand, a faster growth rate occurs, say 2.5 percent per year, then 12.3 million person miles of capacity would be needed, costing $4.2 billion, and the $ million could address only 23 percent of the needed capacity requiring lesser incentives or acceptance of poorer quality of service in the transportation system. Because the fee reduction considerations discussed above are sensitive to the growth rate, it will be important for the County to monitor the rate of growth and adjust the fee from time to time to ensure revenues keep pace with the needs of growth. This can be accomplished as a part of the monitoring of fee collections and the required five year updates of the mobility fee. W.E. Oliver, P.E., LLC Mobility Update Study December 3, 2018 Pasco County, Florida
25 SECTION 4 PROPOSED MOBILITY FEE SCHEDULES 4.1 Mobility Schedules This section presents the proposed transportation mobility fee schedules for Pasco County, and provides an example fee calculation. The proposed fee schedules are provided in Tables 4 1 through 4 12, in the following order: 4 1) Urban Standard 4 2) Urban MUTRM 4 3) Urban TND 4 4) Urban TOD/West (Harbors) Market Area Vacant Parcel 4 5) Urban West (Harbors) Market Area Redevelopment 4 6) Suburban Standard 4 7) Suburban MUTRM 4 8) Suburban TND 4 9) Suburban TOD 4 10) Rural Standard 4 11) Rural MUTRM 4 12) Rural TND These tables present an expanded version, providing the values and intermediate computations of various aspects of the fees, the extent to which incentives have lowered the fees, and disaggregation of the fee into the Interstate/SIS, Transit, and Bike/Pedestrian components. Condensed versions of the tables indicating the fee rates to be paid only, more suitable for inclusion in an adoption ordinance or public dissemination, are provided in Appendix F. Each table lists the major land use categories and the proposed mobility fees for the individual land uses contained in each of the major categories. For each land use, the tables present the travel demand component variables (trip rate, trip length, and percent new trips), the total impact cost, the annual gas tax and tax increment credits and present value of the credits, the net mobility fee, the amount by which each fee value might be discounted, the current (2014) Pasco County mobility fee and the percent difference between the proposed mobility fee and the current fee. It should be noted that the Net Mobility s contained in these tables represent the transportation mobility fee per unit of land use that would be charged in Pasco County. The methodology used herein to calculate these fees has been developed to satisfy the proportionality concept of the dual rational nexus test. As a result, development is charged based upon the proportion of person miles of travel (demand) it is expected to generate on the transportation system. In these fee schedules, 975 specific fee rates have been calculated, for 82 different land uses in 12 geographic or development form categories. Of these: 60 fees arise from new land uses not in the 2014 fee schedules, No fees are higher than in 2014, 48 fees are lower due to expanding the tax increment self credit, changes in trip making data, or (in one case) correction of a calculation error in the 2014 fee schedule), and 867 of the 2014 fees remain unchanged. W.E. Oliver, P.E., LLC Mobility Update Study December 3, 2018 Pasco County, Florida
26 County wide Parameters: Pasco County Land Use Code ITE LUC Table 4 1 Urban Standard Schedule ( District A) Revenue period: 25 P4P Equivalent Pennies: 6.7 Include carrying cost?: No TOD Deduction: 0.00% Discount Rate: 3.30% 2nd LOFT County pennies to capacity: 5.0 Include Interstates?: Yes TND Deduction: 0.00% Fuel efficiency: Existing State pennies to capacity: MUTRM Deduction: 0.00% Days/yr: 365 Tax Inc Fin Millage Rate to capacity: Factor to convert VMT to PMT: 1.42 Existing County pennies to capital: 0 Toll.fwy discount: 1.7% Land Use Unit Trip Rate (veh trips) TGR Standard Trip Length TL Market Area Trip Length Adjustment Factor Chargeable Trip length (mi) Trip length for revenue (mi) % New Trips % NT Gross assessable pmt/day Weighted Capacity Addition Ratio Needed PMC Needed PMC After Fwy/Toll/ TOD/TND/ MUTRM Deduct Weighted Cost/PMC Impact Cost PV County Gas Tax ($$/yr): PV P4P Equivalent PV Federal/ State Gas Tax Revenue ($$/yr) PV Sub Countywide selfcredits: PV Tax Before Increment % Self RESIDENTIAL: Single Family (Detached) 210.1P Less than 1,500 s.f. & Annual Hh Income less than 80% SHIP Definition (2) du 4.10 A 7.61 C % V $352 $5,898 $ $ $1, $1,682 $561 $3,656 9% $341 $3,315 $3,962 $3,135 $2,680 $455 $37 $143 $3,315 0% 210.2P to 1,500 s.f. du 6.25 A 7.61 C % V $352 $8,991 $ $ $1, $2,564 $886 $5,541 25% $1,368 $4,173 $6,009 $3,948 $3,375 $573 $46 $179 $4,173 0% 210.3P ,501 to 2,499 s.f. du 7.81 A 7.61 C % V $352 $11,235 $ $ $2, $3,203 $1,123 $6,909 16% $1,074 $5,835 $7,493 $5,519 $4,718 $801 $65 $251 $5,835 0% 210.4P ,500 s.f. and greater du 9.20 A 7.61 C % V $352 $13,235 $ $ $2, $3,774 $1,976 $7,486 15% $1,157 $6,329 $8,174 $5,987 $5,118 $869 $70 $272 $6,329 0% 210.5P "Low Income" SHIP defined Multi Family (2) du 3.46 A 5.87 C % V $351 $3,826 $ $ $ $1,120 $296 $2,409 11% $268 $2,141 $2,608 $2,025 $1,731 $294 $24 $92 $2,141 0% Multi Family Apartments du 6.60 B 5.87 C % V $351 $7,297 $ $ $1, $2,137 $881 $4,280 7% $309 $3,971 $4,659 $3,756 $3,211 $545 $44 $171 $3,971 0% Low Rise Condominium/Townhouse (1 to 2 stories) du 6.40 H 5.87 J % V $351 $7,076 $ $ $1, $2,072 $786 $4,218 5% $209 $4,009 $4,586 $3,792 $3,242 $550 $45 $172 $4,009 0% High Rise Condominium (3 or more stories) du 4.18 H 5.87 J % V $351 $4,622 $ $ $ $1,353 $786 $2,482 5% $124 $2,358 $2,722 $2,231 $1,908 $324 $26 $101 $2,882 18% Mobile Home Park du 4.17 C 5.29 C % V $350 $4,146 $ $ $ $1,230 $204 $2,712 19% $505 $2,207 $2,928 $2,087 $1,784 $303 $25 $95 $2,207 0% Age Restricted Single Family (3) du 3.62 D 6.23 C % V $351 $4,248 $ $ $ $1,237 $886 $2,125 9% $201 $1,924 $2,346 $1,819 $1,555 $264 $22 $83 $1,924 0% Age Restricted Multi Family (3) du 3.45 D 3.77 C % V $347 $2,423 $94.98 $ $ $757 $881 $785 10% $76 $709 $911 $671 $574 $97 $8 $30 $984 28% Congregate Care Facility (Attached) (3) du 2.02 B 3.54 C % C $347 $959 $37.96 $50.79 $ $303 $160 $497 10% $49 $448 $547 $424 $363 $61 $5 $19 $547 18% LODGING: Hotel room 8.36 D 7.20 C % C $352 $7,920 $ $ $1, $2,258 $306 $5, % $5,355 $0 $5,767 $0 $0 $0 $0 $0 $0 0% Motel room 3.35 D 4.99 C % C $350 $2,551 $94.99 $ $ $757 $184 $1, % $1,610 $0 $1,743 $0 $0 $0 $0 $0 $0 0% Resort Hotel room 5.83 H 7.02 C % C $352 $6,772 $ $ $1, $1,935 $306 $4, % $4,531 $0 $4,883 $0 $0 $0 $0 $0 $0 0% RECREATION: General Recreation acre 2.28 H 5.37 K % K $350 $2,184 $80.69 $ $ $643 $148 $1,393 54% $747 $646 $1,506 $610 $521 $89 $8 $28 $646 0% RV Park RV space 1.62 H 4.83 L % L $349 $1,547 $57.95 $77.55 $ $462 $204 $881 17% $151 $730 $962 $690 $590 $100 $9 $31 $730 0% Marina berth 2.41 B 6.95 M % K $352 $3,005 $ $ $ $859 $155 $1,990 37% $739 $1,251 $2,146 $1,183 $1,011 $172 $14 $54 $1,251 0% Golf Course hole B 6.95 M % K $352 $37,882 $1, $1, $7, $10,834 $823 $26,225 41% $10,774 $15,451 $28,193 $14,617 $12,496 $2,121 $170 $664 $15,451 0% Miniature Golf Course hole 3.30 H 6.95 M % K $352 $4,115 $ $ $ $1,177 $75 $2,863 61% $1,743 $1,120 $3,077 $1,059 $905 $154 $13 $48 $1,120 0% Bowling Alley 1,000 sf H 5.41 N % K $350 $32,164 $1, $1, $6, $9,466 $358 $22,340 55% $12,193 $10,147 $24,012 $9,599 $8,207 $1,392 $112 $436 $10,147 0% Movie Theater screen H 2.33 C % C $344 $42,515 $1, $2, $10, $14,476 $876 $27,163 53% $14,319 $12,844 $29,372 $12,150 $10,398 $1,752 $142 $552 $12,844 0% Racquet Club/Health Club/Spa/Dance Studio 1,000 sf H 5.41 N % W $350 $14,141 $ $ $2, $4,162 $358 $9,621 54% $5,198 $4,423 $10,356 $4,184 $3,577 $607 $49 $190 $4,423 0% Community Center/Gymnasium 1,000 sf B 7.06 K % K $352 $36,505 $1, $1, $7, $10,427 $358 $25,721 64% $16,576 $9,145 $27,618 $8,651 $7,396 $1,255 $101 $393 $9,145 0% 496P n/a Ice Skating Arena 1,000 sf 9.95 H 9.21 H % K $354 $16,512 $ $ $3, $4,608 $358 $11,546 93% $10,750 $796 $12,404 $753 $644 $109 $9 $34 new n/a INSTITUTIONS: Elementary School student 1.89 B 4.52 O % K $350 $1,535 $56.98 $76.25 $ $454 $11 $1,069 59% $628 $441 $1,149 $417 $357 $60 $5 $19 $441 0% Middle School student 2.13 B 4.52 O % K $350 $1,946 $72.25 $96.68 $ $576 $13 $1,357 54% $729 $628 $1,458 $594 $508 $86 $7 $27 $628 0% High School student 2.03 B 4.52 O % K $350 $1,854 $68.85 $92.14 $ $549 $14 $1,292 49% $628 $664 $1,388 $627 $536 $91 $8 $29 $664 0% University/Jr College (7,500 or fewer students) (Private) student 1.74 B 6.95 M % K $353 $2,463 $87.37 $ $ $697 $15 $1,751 27% $468 $1,283 $1,879 $1,213 $1,037 $176 $15 $55 $1,283 0% University/Jr College (more than 7,500 students) (Private) student 1.21 B 6.95 M % K $353 $1,714 $60.80 $81.37 $ $485 $15 $1,214 21% $255 $959 $1,303 $907 $775 $132 $11 $41 $959 0% Church 1,000 sf 6.95 B 4.10 K % K $349 $5,745 $ $ $1, $1,723 $0 $4,021 25% $999 $3,022 $4,320 $2,858 $2,444 $414 $34 $130 $3,022 0% Day Care student 4.09 B 2.13 C % C $344 $1,401 $59.41 $79.50 $ $474 $13 $915 70% $644 $271 $987 $256 $219 $37 $3 $12 $271 0% Cemetery acre 6.02 B 6.95 M % H $353 $8,991 $ $ $1, $2,543 $447 $6,002 46% $2,774 $3,228 $6,469 $3,053 $2,610 $443 $36 $139 $3,228 0% Hospital 1,000 sf B 6.95 M % K $353 $12,977 $ $ $2, $3,670 $333 $8,974 7% $590 $8,384 $9,649 $7,930 $6,779 $1,151 $93 $361 $9,027 7% Nursing Home bed 3.06 B 2.72 C % C $347 $1,649 $66.15 $88.52 $ $527 $160 $962 45% $430 $532 $1,047 $503 $430 $73 $6 $23 $532 0% OFFICE: General Office 50,000 sf or less (4) 1,000 sf G 5.41 C % C $351 $12,135 $ $ $2, $3,521 $587 $8, % $8,027 $0 $8,658 $0 $0 $0 $0 $0 $0 0% 710.1P General Office 50, ,000 sf (4) 1,000 sf G 5.41 C % C $351 $11,885 $ $ $2, $3,448 $807 $7, % $7,629 $0 $8,247 $0 $0 $0 $0 $0 $0 0% 710.2P General Office 100, ,000 sf (4) 1,000 sf G 5.41 C % C $351 $11,640 $ $ $2, $3,377 $807 $7, % $7,456 $0 $8,061 $0 $0 $0 $0 $0 $0 0% 710.3P General Office 200, ,000 sf (4) 1,000 sf G 5.41 C % C $351 $11,401 $ $ $2, $3,308 $807 $7, % $7,286 $0 $7,878 $0 $0 $0 $0 $0 $0 0% 710.4P General Office greater than 400,000 sf (5) 1,000 sf 9.97 G 5.41 C % C $351 $11,166 $ $ $2, $3,240 $807 $7, % $7,119 $0 $7,699 $0 $0 $0 $0 $0 $0 0% Corporate Headquarters Building 1,000 sf 7.95 H 5.41 N % N $351 $8,905 $ $ $1, $2,584 $807 $5, % $5,514 $0 $5,977 $0 $0 $0 $0 $0 $0 0% Medical Office 1,000 sf B 5.83 C % C $352 $40,714 $1, $1, $8, $11,713 $807 $28, % $28,194 $0 $30,309 $0 $0 $0 $0 $0 $0 0% Office Park 1,000 sf D 7.47 C % Q $353 $17,621 $ $ $3, $4,951 $807 $11, % $11,863 $0 $12,778 $0 $0 $0 $0 $0 $0 0% Research and Development Center 1,000 sf D 5.65 Q % Q $352 $12,767 $ $ $2, $3,683 $807 $8, % $8,277 $0 $8,940 $0 $0 $0 $0 $0 $0 0% 770.P 640 Veterinarian Clinic 1,000 sf B 5.36 P % P $351 $24,119 $ $1, $4, $7,004 $587 $16, % $16,528 $0 $17,782 $0 $0 $0 $0 $0 $0 0% $$ Allocated for Net Mobility Full (1) (Incl Int) Interstate/ SIS (Excl Int) Transit Bike/Ped 2014 Mobility Percent change from 2014 to 2018 Net Mobility 4-2
27 County wide Parameters: Pasco County Land Use Code ITE LUC Table 4 1 (continued) Urban Standard Schedule ( District A) Revenue period: 25 P4P Equivalent Pennies: 6.7 Include carrying cost?: No TOD Deduction: 0.00% Discount Rate: 3.30% 2nd LOFT County pennies to capacity: 5.0 Include Interstates?: Yes TND Deduction: 0.00% Fuel efficiency: Existing State pennies to capacity: MUTRM Deduction: 0.00% Days/yr: 365 Tax Inc Fin Millage Rate to capacity: Factor to convert VMT to PMT: 1.42 Existing County pennies to capital: 0 Toll.fwy discount: 1.7% Land Use Unit Trip Rate (veh trips) TGR Standard Trip Length TL Market Area Trip Length Adjustment Factor Chargeable Trip length (mi) Trip length for revenue (mi) % New Trips % NT Gross assessable pmt/day Weighted Capacity Addition Ratio Needed PMC Needed PMC After Fwy/Toll/ TOD/TND/ MUTRM Deduct Weighted Cost/PMC Impact Cost PV County Gas Tax ($$/yr): PV P4P Equivalent PV Federal/ State Gas Tax Revenue ($$/yr) PV Sub Countywide selfcredits: PV Tax Before Increment % Self RETAIL: Mini Warehouse 1,000 sf 1.51 B 3.26 K % N $347 $927 $36.62 $49.00 $ $292 $123 $512 20% $101 $411 $560 $388 $332 $56 $5 $18 $411 0% Hardware/Paint 1,000 sf 9.14 B 1.96 R % R $344 $2,032 $89.37 $ $ $712 $516 $804 45% $364 $440 $910 $416 $356 $60 $5 $19 $3,647 88% Retail 50,000 sfgla or less (4) 1,000 sfgla G 1.96 S % S $344 $16,689 $ $ $4, $5,850 $516 $10,323 39% $4,074 $6,249 $11,191 $5,911 $5,059 $852 $69 $269 $6,249 0% 820.1P Retail 50, ,000 sfgla (4) 1,000 sfgla G 2.52 S % S $346 $16,570 $ $ $3, $5,477 $496 $10,597 47% $4,956 $5,641 $11,458 $5,335 $4,564 $771 $63 $243 $5,641 0% 820.2P Retail 200, ,000 sfgla (4) 1,000 sfgla G 2.77 S % S $346 $15,897 $ $ $3, $5,165 $496 $10,236 47% $4,836 $5,400 $11,062 $5,108 $4,370 $738 $60 $232 $5,400 0% 820.3P Retail 400, ,000 sfgla (4) 1,000 sfgla G 3.01 S % S $347 $15,865 $ $ $3, $5,060 $1,495 $9,311 45% $4,223 $5,088 $10,135 $4,813 $4,117 $696 $56 $219 $5,088 0% 820.4P Retail 600, ,000 sfgla (4) 1,000 sfgla G 3.26 S % S $347 $16,290 $ $ $3, $5,130 $1,495 $9,666 45% $4,375 $5,291 $10,512 $5,004 $4,280 $724 $59 $228 $5,291 0% 820.5P Retail greater than 800,000 sfgla (5) 1,000 sfgla G 3.51 S % S $347 $15,590 $ $ $3, $4,856 $1,495 $9,240 40% $3,656 $5,584 $10,050 $5,282 $4,518 $764 $62 $240 $5,584 0% Specialty Retail 1,000 sf H 3.54 C % C $347 $30,786 $1, $1, $6, $9,578 $516 $20,693 50% $10,256 $10,437 $22,293 $9,873 $8,444 $1,429 $115 $449 $10,437 0% 830.P n/a Non Veterinary Kennel 1,000 sf Y 2.13 X % X $344 $14,141 $ $ $3, $4,780 $516 $8,846 45% $4,000 $4,846 $9,580 $4,584 $3,923 $661 $54 $208 new n/a New/Used Auto Sales 1,000 sf B 4.83 C % C $350 $21,936 $ $1, $4, $6,505 $565 $14,866 46% $6,782 $8,084 $16,005 $7,647 $6,538 $1,109 $89 $348 $8,084 0% Tire Store 1,000 sf B 3.80 T % T $348 $16,027 $ $ $3, $4,920 $516 $10,591 55% $5,862 $4,729 $11,424 $4,473 $3,825 $648 $53 $203 $4,729 0% Supermarket 1,000 sf B 2.18 C % C $344 $26,410 $1, $1, $6, $9,041 $236 $17,133 51% $8,765 $8,368 $18,505 $7,915 $6,774 $1,141 $93 $360 $8,368 0% Convenience Store w/gas Pumps 1,000 sf D 1.59 C % C $341 $56,482 $2, $3, $14, $21,043 $187 $35,252 42% $14,916 $20,336 $38,187 $19,238 $16,475 $2,763 $224 $874 $20,336 0% Home Improvement Superstore 1,000 sf B 2.52 U % U $346 $10,576 $ $ $2, $3,496 $496 $6,584 52% $3,454 $3,130 $7,134 $2,960 $2,532 $428 $35 $135 $3,130 0% Pharmacy/Drug Store with and without Drive Thru 1,000 sf D 2.18 C % C $344 $14,154 $ $ $3, $4,846 $516 $8,793 50% $4,405 $4,388 $9,529 $4,150 $3,551 $599 $49 $189 $4,388 0% Furniture Store 1,000 sf 6.30 B 6.39 C % C $352 $4,507 $ $ $ $1,296 $516 $2,696 55% $1,492 $1,204 $2,930 $1,138 $973 $165 $14 $52 $1,204 0% Bank/Savings w/drive In 1,000 sf D 2.58 C % C $346 $24,191 $ $1, $5, $7,961 $810 $15,420 17% $2,690 $12,730 $16,677 $12,042 $10,302 $1,740 $141 $547 $12,730 0% 929P n/a Breakfast and Lunch Restaurant 1,000 sf Y 3.33 C % C $347 $35,809 $1, $1, $7, $11,241 $802 $23,766 45% $10,785 $12,981 $25,627 $12,280 $10,503 $1,777 $143 $558 new n/a Fast Casual Restaurant 1,000 sf Y 3.33 C % C $347 $86,995 $3, $4, $19, $27,309 $802 $58,885 45% $26,606 $32,279 $63,405 $30,535 $26,117 $4,418 $356 $1,388 new n/a Quality Restaurant 1,000 sf D 3.30 C % C $347 $45,459 $1, $2, $10, $14,289 $802 $30,367 47% $14,356 $16,011 $32,729 $15,146 $12,954 $2,192 $177 $688 $16,011 0% High Turnover Restaurant 1,000 sf D 3.33 C % C $347 $53,606 $2, $2, $11, $16,828 $802 $35,977 45% $16,319 $19,658 $38,762 $18,596 $15,905 $2,691 $217 $845 $19,658 0% Fast Food Restaurant w/drive Thru 1,000 sf D 2.15 C % C $344 $124,703 $5, $7, $30, $42,817 $1,683 $80,203 49% $39,253 $40,950 $86,683 $38,738 $33,152 $5,586 $451 $1,761 $40,950 0% Quick Lube bays B 3.80 T % T $348 $22,478 $ $1, $4, $6,900 $283 $15,295 50% $7,618 $7,677 $16,463 $7,262 $6,210 $1,052 $85 $330 $7,677 0% Auto Repair or Body Shop 1,000 sf H 3.80 T % T $348 $17,662 $ $ $3, $5,422 $565 $11,675 44% $5,145 $6,530 $12,593 $6,177 $5,282 $895 $72 $281 $6,530 0% Gasoline Station fuel pos B 2.00 C % C $344 $16,030 $ $ $3, $5,593 $47 $10,391 51% $5,281 $5,110 $11,224 $4,833 $4,136 $697 $57 $220 $5,110 0% Self Service Car Wash bays D 2.29 C % C $344 $13,862 $ $ $3, $4,697 $19 $9,147 16% $1,450 $7,697 $9,867 $7,281 $6,231 $1,050 $85 $331 $7,697 0% 913.P 913 Convenience/Gasoline/Fast Food Store 1,000 sf D 2.78 C % C $346 $178,485 $7, $9, $40, $57,952 $187 $120,346 53% $63,556 $56,790 $129,621 $53,723 $45,960 $7,763 $625 $2,442 $56,790 0% INDUSTRIAL: General Light Industrial 1,000 sf 4.96 B 5.41 N % N $352 $5,772 $ $ $1, $1,666 $274 $3, % $3,832 $0 $4,132 $0 $0 $0 $0 $0 $0 0% General Heavy Industrial 1,000 sf 1.50 B 5.41 N % N $352 $1,746 $63.20 $84.58 $ $504 $274 $ % $968 $0 $1,059 $0 $0 $0 $0 $0 $0 0% Industrial Park 1,000 sf 3.37 B 5.41 N % N $352 $3,922 $ $ $ $1,132 $274 $2, % $2,516 $0 $2,720 $0 $0 $0 $0 $0 $0 0% Manufacturing 1,000 sf 3.93 B 5.41 N % N $352 $4,573 $ $ $ $1,320 $274 $2, % $2,979 $0 $3,217 $0 $0 $0 $0 $0 $0 0% Passive Warehouse (Storage Warehouse) 1,000 sf 1.74 B 5.41 N % N $352 $2,025 $73.32 $98.11 $ $584 $283 $1, % $1,158 $0 $1,263 $0 $0 $0 $0 $0 new n/a /156 Active Warehouse (Fulfillment Center/Parcel Hub) 1,000 sf 7.97 B 6.95 M % N $353 $11,963 $ $ $2, $3,370 $283 $8, % $8,311 $0 $8,932 $0 $0 $0 $0 $0 new n/a 160.P 153 Airport Hangar 1,000 sf 3.56 H 5.41 N % N $352 $4,143 $ $ $ $1,196 $274 $2, % $2,673 $0 $2,888 $0 $0 $0 $0 $0 $0 0% OTHER: 199.P n/a Mining 1,000 cy 0.01 H I % I $356 $67 $0.14 $1.61 $14.76 $17 $3 $48 0% $0 $48 $51 $45 $38 $7 $1 $2 $57 16% $$ Allocated for Net Mobility Full (1) Notes: (1) This value is the total value of transportation system consumed, less credits for revenues committed to transportation system expansion that are generated by the use itself. This value includes Interstate costs and "carrying costs", but not toll road costs. It does consider the proportion of trip length, varying system costs, and transportation system performance goals that vary by fee district. (2) Specific calculations for the "low income" category can be seen in Appendix B of the 2014 Mobility Update Study. (3) The statistical relationship between the trip generation rate for the age restricted single family, age restricted multi family, and congregate care facility was used to interpolate the trip length. (4) The trip generation rate recommended for the office and retail size categories used the end point of the range due to the nature of the ITE equation to be conservative for smaller developments. (5) The trip generation rate used for the office and retail open ended size categories used the size 200,000 s.f. larger than the beginning of the size range, as the size ranges increase in 200,000 s.f. increments. s of trip rate, percent new trips, and trip length are as follows: (A) National studies (NHTS, AHS, Census) (I) Independent Study (Collier County) (Q) Same as LUC 770 (Business Park) (Y) Other National Studies (B) ITE 10th Edition Trip Generation (J) Same as LUC 220 (R) Same as LUC 820 (<50k) (C) Florida Studies Database (K) Florida Schedules (S) FL Curve (D) Blend ITE 10th & FL Studies (L) Same as LUC 240 (T) Same as LUC 942 (Auto Care Center) (E) Blend ITE 6th & FL Studies (M) Same as LUC 210 (U) Same as LUC 820 (50k 200k) (F) ITE Regression Analysis (N) Same as LUC 710 (V) n/a (G) ITE 10th equation (O) Model Based Trip Length (W) Same as LUC 492 (Health Club) (H) Previous Pasco MMTIF Study (P) Same as LUC 630 (Clinic) (X) Same as LUC 595 (DayCare) F:\WEO PE\Projects\ AECOM Pasco Mobilty 2017\3. Analysis\ Schedule Spreadsheets\[Mobility Schedules 2018 v6.xlsm]urban (Incl Int) Interstate/ SIS (Excl Int) Transit Bike/Ped 2014 Mobility Percent change from 2014 to 2018 Net Mobility 4-3
28 County wide Parameters: Pasco County Land Use Code ITE LUC Table 4 2 Urban Mixed Use Trip Reduction Measures Schedule ( District A) Revenue period: 25 P4P Equivalent Pennies: 6.7 Include carrying cost?: No TOD Deduction: 0.00% Discount Rate: 3.30% 2nd LOFT County pennies to capacity: 5 Include Interstates?: Yes TND Deduction: 0.00% Fuel efficiency: Existing State pennies to capacity: MUTRM Deduction: 8.02% Days/yr: 365 Tax Inc Fin Millage Rate to capacity: Factor to convert VMT to PMT: 1.42 Existing County pennies to capital: 0 Toll.fwy discount: 1.7% Land Use Unit Trip Rate (veh trips) TGR Standard Trip Length TL Market Area Trip Length Adjustment Factor Chargeable Trip length (mi) Trip length for revenue (mi) % New Trips % NT Gross assessable pmt/day Weighted Capacity Addition Ratio Needed PMC Needed PMC After Fwy/Toll/ TOD/TND/ MUTRM Deduct Weighted Cost/PMC Impact Cost PV County Gas Tax ($$/yr): PV P4P Equivalent PV Federal/ State Gas Tax Revenue ($$/yr) PV Sub Countywide selfcredits: PV Tax Before Increment % Self RESIDENTIAL: Single Family (Detached) 210.1P Less than 1,500 s.f. & Annual Hh Income less than 80% SHIP Definition (2) du 4.10 A 7.61 C % V $352 $5,425 $ $ $1, $1,547 $561 $3,317 25% $831 $2,486 $3,599 $2,351 $2,010 $341 $28 $107 $2,486 0% 210.2P to 1,500 s.f. du 6.25 A 7.61 C % V $352 $8,270 $ $ $1, $2,358 $886 $5,026 38% $1,896 $3,130 $5,456 $2,960 $2,530 $430 $35 $135 $3,130 0% 210.3P ,501 to 2,499 s.f. du 7.81 A 7.61 C % V $352 $10,334 $ $ $2, $2,947 $1,123 $6,265 30% $1,889 $4,376 $6,802 $4,139 $3,538 $601 $49 $188 $4,376 0% 210.4P ,500 s.f. and greater du 9.20 A 7.61 C % V $352 $12,174 $ $ $2, $3,471 $1,976 $6,727 29% $1,980 $4,747 $7,360 $4,490 $3,838 $652 $53 $204 $4,747 0% 210.5P "Low Income" SHIP defined Multi Family (2) du 3.46 A 5.87 C % V $351 $3,519 $ $ $ $1,030 $296 $2,192 27% $586 $1,606 $2,375 $1,519 $1,299 $220 $18 $69 $1,606 0% Multi Family Apartments du 6.60 B 5.87 C % V $351 $6,712 $ $ $1, $1,965 $881 $3,866 23% $888 $2,978 $4,215 $2,817 $2,408 $409 $33 $128 $2,978 0% Low Rise Condominium/Townhouse (1 to 2 stories) du 6.40 H 5.87 J % V $351 $6,509 $ $ $1, $1,906 $786 $3,817 21% $810 $3,007 $4,155 $2,844 $2,431 $413 $34 $129 $3,007 0% High Rise Condominium (3 or more stories) du 4.18 H 5.87 J % V $351 $4,251 $ $ $ $1,245 $786 $2,220 20% $451 $1,769 $2,441 $1,673 $1,430 $243 $20 $76 $2,162 18% Mobile Home Park du 4.17 C 5.29 C % V $350 $3,813 $ $ $ $1,131 $204 $2,479 33% $824 $1,655 $2,677 $1,565 $1,338 $227 $19 $71 $1,655 0% Age Restricted Single Family (3) du 3.62 D 6.23 C % V $351 $3,907 $ $ $ $1,138 $886 $1,884 23% $441 $1,443 $2,087 $1,365 $1,167 $198 $16 $62 $1,443 0% Age Restricted Multi Family (3) du 3.45 D 3.77 C % V $347 $2,229 $87.36 $ $ $696 $881 $651 18% $119 $532 $767 $503 $430 $73 $6 $23 $738 28% Congregate Care Facility (Attached) (3) du 2.02 B 3.54 C % C $347 $882 $34.91 $46.72 $ $278 $160 $444 24% $108 $336 $490 $318 $272 $46 $4 $14 $410 18% LODGING: Hotel room 8.36 D 7.20 C % C $352 $7,284 $ $ $1, $2,077 $306 $4, % $4,901 $0 $5,280 $0 $0 $0 $0 $0 $0 0% Motel room 3.35 D 4.99 C % C $350 $2,347 $87.37 $ $ $697 $184 $1, % $1,466 $0 $1,588 $0 $0 $0 $0 $0 $0 0% Resort Hotel room 5.83 H 7.02 C % C $352 $6,229 $ $ $1, $1,780 $306 $4, % $4,143 $0 $4,467 $0 $0 $0 $0 $0 $0 0% RECREATION: General Recreation acre 2.28 H 5.37 K % K $350 $2,009 $74.22 $99.32 $ $592 $148 $1,269 62% $784 $485 $1,374 $458 $391 $67 $6 $21 $485 0% RV Park RV space 1.62 H 4.83 L % L $349 $1,423 $53.31 $71.33 $ $425 $204 $794 31% $246 $548 $868 $517 $442 $75 $7 $24 $548 0% Marina berth 2.41 B 6.95 M % K $352 $2,764 $99.16 $ $ $790 $155 $1,818 48% $880 $938 $1,962 $887 $758 $129 $11 $40 $938 0% Golf Course hole B 6.95 M % K $352 $34,844 $1, $1, $7, $9,965 $823 $24,056 52% $12,468 $11,588 $25,866 $10,962 $9,371 $1,591 $128 $498 $11,588 0% Miniature Golf Course hole 3.30 H 6.95 M % K $352 $3,785 $ $ $ $1,082 $75 $2,627 68% $1,787 $840 $2,824 $794 $679 $115 $10 $36 $840 0% Bowling Alley 1,000 sf H 5.41 N % K $350 $29,585 $1, $1, $6, $8,707 $358 $20,520 63% $12,910 $7,610 $22,057 $7,199 $6,155 $1,044 $84 $327 $7,610 0% Movie Theater screen H 2.33 C % C $344 $39,105 $1, $2, $9, $13,315 $876 $24,914 61% $15,281 $9,633 $26,946 $9,113 $7,799 $1,314 $106 $414 $9,633 0% Racquet Club/Health Club/Spa/Dance Studio 1,000 sf H 5.41 N % W $350 $13,007 $ $ $2, $3,828 $358 $8,821 62% $5,504 $3,317 $9,497 $3,137 $2,682 $455 $37 $143 $3,317 0% Community Center/Gymnasium 1,000 sf B 7.06 K % K $352 $33,578 $1, $1, $6, $9,590 $358 $23,629 71% $16,770 $6,859 $25,374 $6,488 $5,547 $941 $76 $295 $6,859 0% 496P n/a Ice Skating Arena 1,000 sf 9.95 H 9.21 H % K $354 $15,187 $ $ $2, $4,239 $358 $10,591 94% $9,994 $597 $11,380 $564 $482 $82 $7 $26 new n/a INSTITUTIONS: Elementary School student 1.89 B 4.52 O % K $350 $1,412 $52.41 $70.14 $ $418 $11 $982 66% $651 $331 $1,056 $313 $268 $45 $4 $14 $331 0% Middle School student 2.13 B 4.52 O % K $350 $1,790 $66.45 $88.93 $ $530 $13 $1,247 62% $776 $471 $1,340 $445 $380 $65 $6 $20 $471 0% High School student 2.03 B 4.52 O % K $350 $1,706 $63.33 $84.75 $ $505 $14 $1,187 58% $689 $498 $1,276 $471 $403 $68 $6 $21 $498 0% University/Jr College (7,500 or fewer students) (Private) student 1.74 B 6.95 M % K $353 $2,265 $80.37 $ $ $641 $15 $1,609 40% $647 $962 $1,727 $910 $778 $132 $11 $41 $962 0% University/Jr College (more than 7,500 students) (Private) student 1.21 B 6.95 M % K $353 $1,577 $55.93 $74.84 $ $446 $15 $1,115 36% $396 $719 $1,197 $680 $581 $99 $8 $31 $719 0% Church 1,000 sf 6.95 B 4.10 K % K $349 $5,284 $ $ $1, $1,585 $0 $3,699 39% $1,432 $2,267 $3,973 $2,145 $1,834 $311 $25 $97 $2,267 0% Day Care student 4.09 B 2.13 C % C $344 $1,289 $54.65 $73.13 $ $436 $13 $840 76% $637 $203 $907 $191 $163 $28 $3 $9 $203 0% Cemetery acre 6.02 B 6.95 M % H $353 $8,270 $ $ $1, $2,339 $447 $5,484 56% $3,063 $2,421 $5,914 $2,290 $1,958 $332 $27 $104 $2,421 0% Hospital 1,000 sf B 6.95 M % K $353 $11,937 $ $ $2, $3,376 $333 $8,228 24% $1,940 $6,288 $8,848 $5,948 $5,085 $863 $70 $270 $6,770 7% Nursing Home bed 3.06 B 2.72 C % C $347 $1,517 $60.85 $81.42 $ $485 $160 $872 54% $473 $399 $951 $377 $322 $55 $5 $17 $399 0% OFFICE: General Office 50,000 sf or less (4) 1,000 sf G 5.41 C % C $351 $11,161 $ $ $2, $3,238 $587 $7, % $7,336 $0 $7,916 $0 $0 $0 $0 $0 $0 0% 710.1P General Office 50, ,000 sf (4) 1,000 sf G 5.41 C % C $351 $10,932 $ $ $2, $3,172 $807 $6, % $6,953 $0 $7,521 $0 $0 $0 $0 $0 $0 0% 710.2P General Office 100, ,000 sf (4) 1,000 sf G 5.41 C % C $351 $10,707 $ $ $2, $3,107 $807 $6, % $6,793 $0 $7,349 $0 $0 $0 $0 $0 $0 0% 710.3P General Office 200, ,000 sf (4) 1,000 sf G 5.41 C % C $351 $10,486 $ $ $2, $3,043 $807 $6, % $6,637 $0 $7,182 $0 $0 $0 $0 $0 $0 0% 710.4P General Office greater than 400,000 sf (5) 1,000 sf 9.97 G 5.41 C % C $351 $10,271 $ $ $2, $2,980 $807 $6, % $6,483 $0 $7,017 $0 $0 $0 $0 $0 $0 0% Corporate Headquarters Building 1,000 sf 7.95 H 5.41 N % N $351 $8,191 $ $ $1, $2,377 $807 $5, % $5,007 $0 $5,433 $0 $0 $0 $0 $0 $0 0% Medical Office 1,000 sf B 5.83 C % C $352 $37,449 $1, $1, $7, $10,774 $807 $25, % $25,868 $0 $27,814 $0 $0 $0 $0 $0 $0 0% Office Park 1,000 sf D 7.47 C % Q $353 $16,208 $ $ $3, $4,554 $807 $10, % $10,846 $0 $11,689 $0 $0 $0 $0 $0 $0 0% Research and Development Center 1,000 sf D 5.65 Q % Q $352 $11,743 $ $ $2, $3,387 $807 $7, % $7,548 $0 $8,158 $0 $0 $0 $0 $0 $0 0% 770.P 640 Veterinarian Clinic 1,000 sf B 5.36 P % P $351 $22,185 $ $1, $4, $6,442 $587 $15, % $15,156 $0 $16,309 $0 $0 $0 $0 $0 $0 0% $$ Allocated for Net Mobility Full (1) (Incl Int) Interstate/ SIS (Excl Int) Transit Bike/Ped 2014 Mobility Percent change from 2014 to 2018 Net Mobility 4-4
29 County wide Parameters: Pasco County Land Use Code ITE LUC Table 4 2 (continued) Urban Mixed Use Trip Reduction Measures Schedule ( District A) Revenue period: 25 P4P Equivalent Pennies: 6.7 Include carrying cost?: No TOD Deduction: 0.00% Discount Rate: 3.30% 2nd LOFT County pennies to capacity: 5 Include Interstates?: Yes TND Deduction: 0.00% Fuel efficiency: Existing State pennies to capacity: MUTRM Deduction: 8.02% Days/yr: 365 Tax Inc Fin Millage Rate to capacity: Factor to convert VMT to PMT: 1.42 Existing County pennies to capital: 0 Toll.fwy discount: 1.7% Land Use Unit Trip Rate (veh trips) TGR Standard Trip Length TL Market Area Trip Length Adjustment Factor Chargeable Trip length (mi) Trip length for revenue (mi) % New Trips % NT Gross assessable pmt/day Weighted Capacity Addition Ratio Needed PMC Needed PMC After Fwy/Toll/ TOD/TND/ MUTRM Deduct Weighted Cost/PMC Impact Cost PV County Gas Tax ($$/yr): PV P4P Equivalent PV Federal/ State Gas Tax Revenue ($$/yr) PV Sub Countywide selfcredits: PV Tax Before Increment % Self RETAIL: Mini Warehouse 1,000 sf 1.51 B 3.26 K % N $347 $853 $33.68 $45.07 $ $268 $123 $461 33% $153 $308 $506 $291 $249 $42 $4 $13 $308 0% Hardware/Paint 1,000 sf 9.14 B 1.96 R % R $344 $1,869 $82.20 $ $ $655 $516 $699 53% $369 $330 $796 $312 $267 $45 $4 $14 $2,735 88% Retail 50,000 sfgla or less (4) 1,000 sfgla G 1.96 S % S $344 $15,350 $ $ $3, $5,381 $516 $9,454 50% $4,767 $4,687 $10,252 $4,433 $3,794 $639 $52 $202 $4,687 0% 820.1P Retail 50, ,000 sfgla (4) 1,000 sfgla G 2.52 S % S $346 $15,241 $ $ $3, $5,038 $496 $9,707 56% $5,476 $4,231 $10,499 $4,002 $3,424 $578 $47 $182 $4,231 0% 820.2P Retail 200, ,000 sfgla (4) 1,000 sfgla G 2.77 S % S $346 $14,622 $ $ $3, $4,751 $496 $9,376 57% $5,326 $4,050 $10,135 $3,831 $3,277 $554 $45 $174 $4,050 0% 820.3P Retail 400, ,000 sfgla (4) 1,000 sfgla G 3.01 S % S $347 $14,593 $ $ $3, $4,654 $1,495 $8,444 55% $4,628 $3,816 $9,202 $3,610 $3,088 $522 $42 $164 $3,816 0% 820.4P Retail 600, ,000 sfgla (4) 1,000 sfgla G 3.26 S % S $347 $14,984 $ $ $3, $4,719 $1,495 $8,770 55% $4,802 $3,968 $9,549 $3,753 $3,210 $543 $44 $171 $3,968 0% 820.5P Retail greater than 800,000 sfgla (5) 1,000 sfgla G 3.51 S % S $347 $14,340 $ $ $3, $4,467 $1,495 $8,379 50% $4,191 $4,188 $9,124 $3,961 $3,388 $573 $47 $180 $4,188 0% Specialty Retail 1,000 sf H 3.54 C % C $347 $28,317 $1, $1, $6, $8,810 $516 $18,992 59% $11,164 $7,828 $20,464 $7,404 $6,332 $1,072 $87 $337 $7,828 0% 830.P n/a Non Veterinary Kennel 1,000 sf Y 2.13 C % C $344 $13,007 $ $ $3, $4,397 $516 $8,095 55% $4,460 $3,635 $8,771 $3,439 $2,943 $496 $40 $156 new n/a New/Used Auto Sales 1,000 sf B 4.83 C % C $350 $20,177 $ $1, $4, $5,984 $565 $13,628 56% $7,565 $6,063 $14,676 $5,735 $4,903 $832 $67 $261 $6,063 0% Tire Store 1,000 sf B 3.80 T % T $348 $14,741 $ $ $3, $4,525 $516 $9,700 63% $6,153 $3,547 $10,466 $3,354 $2,868 $486 $40 $153 $3,547 0% Supermarket 1,000 sf B 2.18 C % C $344 $24,292 $1, $1, $5, $8,316 $236 $15,740 60% $9,464 $6,276 $17,002 $5,936 $5,080 $856 $70 $270 $6,276 0% Convenience Store w/gas Pumps 1,000 sf D 1.59 C % C $341 $51,952 $2, $3, $13, $19,356 $187 $32,410 53% $17,158 $15,252 $35,109 $14,428 $12,356 $2,072 $168 $656 $15,252 0% Home Improvement Superstore 1,000 sf B 2.52 U % U $346 $9,728 $ $ $2, $3,216 $496 $6,016 61% $3,668 $2,348 $6,522 $2,221 $1,900 $321 $26 $101 $2,348 0% Pharmacy/Drug Store with and without Drive Thru 1,000 sf D 2.18 C % C $344 $13,019 $ $ $3, $4,457 $516 $8,047 59% $4,756 $3,291 $8,723 $3,112 $2,663 $449 $37 $142 $3,291 0% Furniture Store 1,000 sf 6.30 B 6.39 C % C $352 $4,146 $ $ $ $1,192 $516 $2,438 63% $1,535 $903 $2,654 $854 $730 $124 $10 $39 $903 0% Bank/Savings w/drive In 1,000 sf D 2.58 C % C $346 $22,251 $ $1, $5, $7,323 $810 $14,118 32% $4,570 $9,548 $15,275 $9,031 $7,726 $1,305 $106 $411 $9,548 0% 929P n/a Breakfast and Lunch Restaurant 1,000 sf Y 3.33 C % C $347 $32,937 $1, $1, $7, $10,339 $802 $21,796 55% $12,060 $9,736 $23,507 $9,209 $7,876 $1,333 $108 $419 new n/a Fast Casual Restaurant 1,000 sf Y 3.33 C % C $347 $80,018 $3, $4, $17, $25,118 $802 $54,098 55% $29,889 $24,209 $58,256 $22,901 $19,587 $3,314 $267 $1,041 new n/a Quality Restaurant 1,000 sf D 3.30 C % C $347 $41,813 $1, $2, $9, $13,143 $802 $27,867 57% $15,859 $12,008 $30,040 $11,359 $9,715 $1,644 $133 $516 $12,008 0% High Turnover Restaurant 1,000 sf D 3.33 C % C $347 $49,307 $1, $2, $10, $15,478 $802 $33,027 55% $18,283 $14,744 $35,589 $13,947 $11,929 $2,018 $163 $634 $14,744 0% Fast Food Restaurant w/drive Thru 1,000 sf D 2.15 C % C $344 $114,702 $4, $6, $27, $39,383 $1,683 $73,636 58% $42,923 $30,713 $79,596 $29,054 $24,865 $4,189 $338 $1,321 $30,713 0% Quick Lube bays B 3.80 T % T $348 $20,675 $ $1, $4, $6,347 $283 $14,046 59% $8,288 $5,758 $15,120 $5,446 $4,657 $789 $64 $248 $5,758 0% Auto Repair or Body Shop 1,000 sf H 3.80 T % T $348 $16,245 $ $ $3, $4,987 $565 $10,693 54% $5,795 $4,898 $11,537 $4,633 $3,962 $671 $54 $211 $4,898 0% Gasoline Station fuel pos B 2.00 C % C $344 $14,745 $ $ $3, $5,145 $47 $9,554 60% $5,721 $3,833 $10,320 $3,625 $3,102 $523 $43 $165 $3,833 0% Self Service Car Wash bays D 2.29 C % C $344 $12,751 $ $ $3, $4,320 $19 $8,412 31% $2,639 $5,773 $9,074 $5,461 $4,674 $787 $64 $248 $5,773 0% 913.P 913 Convenience/Gasoline/Fast Food Store 1,000 sf D 2.78 C % C $346 $164,170 $6, $8, $37, $53,304 $187 $110,680 62% $68,087 $42,593 $119,210 $40,293 $34,471 $5,822 $469 $1,831 $42,593 0% INDUSTRIAL: General Light Industrial 1,000 sf 4.96 B 5.41 N % N $352 $5,309 $ $ $1, $1,532 $274 $3, % $3,503 $0 $3,779 $0 $0 $0 $0 $0 $0 0% General Heavy Industrial 1,000 sf 1.50 B 5.41 N % N $352 $1,606 $58.13 $77.79 $ $463 $274 $ % $868 $0 $952 $0 $0 $0 $0 $0 $0 0% Industrial Park 1,000 sf 3.37 B 5.41 N % N $352 $3,607 $ $ $ $1,041 $274 $2, % $2,292 $0 $2,480 $0 $0 $0 $0 $0 $0 0% Manufacturing 1,000 sf 3.93 B 5.41 N % N $352 $4,207 $ $ $ $1,214 $274 $2, % $2,719 $0 $2,937 $0 $0 $0 $0 $0 $0 0% Passive Warehouse (Storage Warehouse) 1,000 sf 1.74 B 5.41 N % N $352 $1,862 $67.44 $90.24 $ $538 $283 $1, % $1,042 $0 $1,139 $0 $0 $0 $0 $0 new n/a /156 Active Warehouse (Fulfillment Center/Parcel Hub) 1,000 sf 7.97 B 6.95 M % N $353 $11,004 $ $ $2, $3,100 $283 $7, % $7,622 $0 $8,193 $0 $0 $0 $0 $0 new n/a 160.P 153 Airport Hangar 1,000 sf 3.56 H 5.41 N % N $352 $3,811 $ $ $ $1,100 $274 $2, % $2,437 $0 $2,635 $0 $0 $0 $0 $0 $0 0% $$ Allocated for Net Mobility Full (1) (Incl Int) Interstate/ SIS (Excl Int) ######### $0 #DIV/0! Notes: (1) This value is the total value of transportation system consumed, less credits for revenues committed to transportation system expansion that are generated by the use itself. This value includes Interstate costs and "carrying costs", but not toll road costs. It does consider the proportion of trip length, varying system costs, and transportation system performance goals that vary by fee district. (2) Specific calculations for the "low income" category can be seen in Appendix B of the 2014 Mobility Update Study. (3) The statistical relationship between the trip generation rate for the age restricted single family, age restricted multi family, and congregate care facility was used to interpolate the trip length. (4) The trip generation rate recommended for the office and retail size categories used the end point of the range due to the nature of the ITE equation to be conservative for smaller developments. (5) The trip generation rate used for the office and retail open ended size categories used the size 200,000 s.f. larger than the beginning of the size range, as the size ranges increase in 200,000 s.f. increments. s of trip rate, percent new trips, and trip length are as follows: (A) National studies (NHTS, AHS, Census) (I) Independent Study (Collier County) (Q) Same as LUC 770 (Business Park) (Y) Other National Studies (B) ITE 10th Edition Trip Generation (J) Same as LUC 220 (R) Same as LUC 820 (<50k) (C) Florida Studies Database (K) Florida Schedules (S) FL Curve (D) Blend ITE 10th & FL Studies (L) Same as LUC 240 (T) Same as LUC 942 (Auto Care Center) (E) Blend ITE 6th & FL Studies (M) Same as LUC 210 (U) Same as LUC 820 (50k 200k) (F) ITE Regression Analysis (N) Same as LUC 710 (V) n/a (G) ITE 10th equation (O) Model Based Trip Length (W) Same as LUC 492 (Health Club) (H) Previous Pasco MMTIF Study (P) Same as LUC 630 (Clinic) (X) Same as LUC 595 (DayCare) F:\WEO PE\Projects\ AECOM Pasco Mobilty 2017\3. Analysis\ Schedule Spreadsheets\[Mobility Schedules 2018 v6.xlsm]urban Transit Bike/Ped 2014 Mobility Percent change from 2014 to 2018 Net Mobility 4-5
30 County wide Parameters: Pasco County Land Use Code ITE LUC Table 4 3 Urban Traditional Neighborhood Development Schedule ( District A) Revenue period: 25 P4P Equivalent Pennies: 6.7 Include carrying cost?: No TOD Deduction: 0.00% Discount Rate: 3.30% 2nd LOFT County pennies to capacity: 5 Include Interstates?: Yes TND Deduction: 11.36% Fuel efficiency: Existing State pennies to capacity: MUTRM Deduction: 0.00% Days/yr: 365 Tax Inc Fin Millage Rate to capacity: Factor to convert VMT to PMT: 1.42 Existing County pennies to capital: 0 Toll.fwy discount: 1.7% Land Use Unit Trip Rate (veh trips) TGR Standard Trip Length TL Market Area Trip Length Adjustment Factor Chargeable Trip length (mi) Trip length for revenue (mi) % New Trips % NT Gross assessable pmt/day Weighted Capacity Addition Ratio Needed PMC Needed PMC After Fwy/Toll/ TOD/TND/ MUTRM Deduct Weighted Cost/PMC Impact Cost PV County Gas Tax ($$/yr): PV P4P Equivalent PV Federal/ State Gas Tax Revenue ($$/yr) PV Sub Countywide selfcredits: PV Tax Before Increment % Self RESIDENTIAL: Single Family (Detached) 210.1P Less than 1,500 s.f. & Annual Hh Income less than 80% SHIP Definition (2) du 4.10 A 7.61 C % V $352 $5,228 $ $ $1, $1,491 $561 $3,177 48% $1,519 $1,658 $3,448 $1,568 $1,340 $228 $19 $71 $1,658 0% 210.2P to 1,500 s.f. du 6.25 A 7.61 C % V $352 $7,970 $ $ $1, $2,272 $886 $4,811 57% $2,724 $2,087 $5,225 $1,974 $1,688 $286 $23 $90 $2,087 0% 210.3P ,501 to 2,499 s.f. du 7.81 A 7.61 C % V $352 $9,959 $ $ $2, $2,840 $1,123 $5,996 51% $3,078 $2,918 $6,514 $2,760 $2,359 $401 $33 $125 $2,918 0% 210.4P ,500 s.f. and greater du 9.20 A 7.61 C % V $352 $11,731 $ $ $2, $3,345 $1,976 $6,411 51% $3,246 $3,165 $7,021 $2,994 $2,560 $434 $35 $136 $3,165 0% 210.5P "Low Income" SHIP defined Multi Family (2) du 3.46 A 5.87 C % V $351 $3,391 $ $ $ $993 $296 $2,102 49% $1,031 $1,071 $2,278 $1,013 $866 $147 $12 $46 $1,071 0% Multi Family Apartments du 6.60 B 5.87 C % V $351 $6,468 $ $ $1, $1,894 $881 $3,693 46% $1,707 $1,986 $4,030 $1,879 $1,607 $272 $22 $85 $1,986 0% Low Rise Condominium/Townhouse (1 to 2 stories) du 6.40 H 5.87 J % V $351 $6,272 $ $ $1, $1,837 $786 $3,649 45% $1,644 $2,005 $3,975 $1,896 $1,621 $275 $23 $86 $2,005 0% High Rise Condominium (3 or more stories) du 4.18 H 5.87 J % V $351 $4,097 $ $ $ $1,200 $786 $2,111 44% $932 $1,179 $2,324 $1,115 $953 $162 $13 $51 $1,441 18% Mobile Home Park du 4.17 C 5.29 C % V $350 $3,675 $ $ $ $1,090 $204 $2,381 54% $1,277 $1,104 $2,572 $1,044 $893 $151 $13 $47 $1,104 0% Age Restricted Single Family (3) du 3.62 D 6.23 C % V $351 $3,765 $ $ $ $1,096 $886 $1,783 46% $821 $962 $1,979 $910 $778 $132 $11 $41 $962 0% Age Restricted Multi Family (3) du 3.45 D 3.77 C % V $347 $2,148 $84.19 $ $ $671 $881 $596 40% $241 $355 $707 $336 $287 $49 $4 $15 $492 28% Congregate Care Facility (Attached) (3) du 2.02 B 3.54 C % C $347 $850 $33.64 $45.02 $ $268 $160 $422 47% $198 $224 $466 $211 $180 $31 $3 $10 $274 18% LODGING: Hotel room 8.36 D 7.20 C % C $352 $7,020 $ $ $1, $2,002 $306 $4, % $4,712 $0 $5,077 $0 $0 $0 $0 $0 $0 0% Motel room 3.35 D 4.99 C % C $350 $2,261 $84.20 $ $ $671 $184 $1, % $1,407 $0 $1,524 $0 $0 $0 $0 $0 $0 0% Resort Hotel room 5.83 H 7.02 C % C $352 $6,002 $ $ $1, $1,715 $306 $3, % $3,981 $0 $4,293 $0 $0 $0 $0 $0 $0 0% RECREATION: General Recreation acre 2.28 H 5.37 K % K $350 $1,936 $71.52 $95.71 $ $570 $148 $1,218 73% $895 $323 $1,318 $305 $261 $44 $4 $14 $323 0% RV Park RV space 1.62 H 4.83 L % L $349 $1,371 $51.37 $68.74 $ $410 $204 $758 52% $393 $365 $829 $344 $294 $50 $5 $16 $365 0% Marina berth 2.41 B 6.95 M % K $352 $2,664 $95.55 $ $ $762 $155 $1,747 64% $1,121 $626 $1,885 $592 $506 $86 $7 $27 $626 0% Golf Course hole B 6.95 M % K $352 $33,578 $1, $1, $6, $9,603 $823 $23,152 67% $15,426 $7,726 $24,897 $7,309 $6,249 $1,060 $85 $332 $7,726 0% Miniature Golf Course hole 3.30 H 6.95 M % K $352 $3,647 $ $ $ $1,043 $75 $2,529 78% $1,969 $560 $2,719 $529 $452 $77 $7 $24 $560 0% Bowling Alley 1,000 sf H 5.41 N % K $350 $28,511 $1, $1, $5, $8,391 $358 $19,762 74% $14,688 $5,074 $21,243 $4,800 $4,104 $696 $56 $218 $5,074 0% Movie Theater screen H 2.33 C % C $344 $37,685 $1, $2, $9, $12,831 $876 $23,978 73% $17,556 $6,422 $25,936 $6,075 $5,199 $876 $71 $276 $6,422 0% Racquet Club/Health Club/Spa/Dance Studio 1,000 sf H 5.41 N % W $350 $12,535 $ $ $2, $3,689 $358 $8,488 74% $6,276 $2,212 $9,139 $2,092 $1,789 $303 $25 $95 $2,212 0% Community Center/Gymnasium 1,000 sf B 7.06 K % K $352 $32,358 $1, $1, $6, $9,242 $358 $22,758 80% $18,185 $4,573 $24,440 $4,325 $3,697 $628 $51 $197 $4,573 0% 496P n/a Ice Skating Arena 1,000 sf 9.95 H 9.21 H % K $354 $14,636 $ $ $2, $4,085 $358 $10,193 96% $9,795 $398 $10,954 $376 $321 $55 $5 $17 new n/a INSTITUTIONS: Elementary School student 1.89 B 4.52 O % K $350 $1,360 $50.51 $67.59 $ $403 $11 $946 77% $725 $221 $1,017 $208 $178 $30 $3 $10 $221 0% Middle School student 2.13 B 4.52 O % K $350 $1,725 $64.04 $85.70 $ $511 $13 $1,201 74% $887 $314 $1,291 $296 $253 $43 $4 $14 $314 0% High School student 2.03 B 4.52 O % K $350 $1,644 $61.03 $81.67 $ $487 $14 $1,143 71% $811 $332 $1,229 $314 $268 $46 $4 $14 $332 0% University/Jr College (7,500 or fewer students) (Private) student 1.74 B 6.95 M % K $353 $2,183 $77.45 $ $ $617 $15 $1,550 59% $908 $642 $1,664 $606 $518 $88 $8 $28 $642 0% University/Jr College (more than 7,500 students) (Private) student 1.21 B 6.95 M % K $353 $1,519 $53.90 $72.12 $ $430 $15 $1,074 55% $594 $480 $1,153 $453 $387 $66 $6 $21 $480 0% Church 1,000 sf 6.95 B 4.10 K % K $349 $5,092 $ $ $1, $1,528 $0 $3,564 58% $2,053 $1,511 $3,829 $1,429 $1,222 $207 $17 $65 $1,511 0% Day Care student 4.09 B 2.13 C % C $344 $1,242 $52.66 $70.47 $ $420 $13 $809 83% $673 $136 $874 $128 $109 $19 $2 $6 $136 0% Cemetery acre 6.02 B 6.95 M % H $353 $7,970 $ $ $1, $2,254 $447 $5,269 69% $3,655 $1,614 $5,683 $1,527 $1,305 $222 $18 $69 $1,614 0% Hospital 1,000 sf B 6.95 M % K $353 $11,503 $ $ $2, $3,253 $333 $7,917 47% $3,725 $4,192 $8,515 $3,965 $3,390 $575 $47 $180 $4,514 7% Nursing Home bed 3.06 B 2.72 C % C $347 $1,461 $58.64 $78.47 $ $467 $160 $834 68% $568 $266 $910 $252 $216 $36 $3 $11 $266 0% OFFICE: General Office 50,000 sf or less (4) 1,000 sf G 5.41 C % C $351 $10,756 $ $ $2, $3,121 $587 $7, % $7,049 $0 $7,608 $0 $0 $0 $0 $0 $0 0% 710.1P General Office 50, ,000 sf (4) 1,000 sf G 5.41 C % C $351 $10,535 $ $ $2, $3,057 $807 $6, % $6,671 $0 $7,218 $0 $0 $0 $0 $0 $0 0% 710.2P General Office 100, ,000 sf (4) 1,000 sf G 5.41 C % C $351 $10,318 $ $ $2, $2,994 $807 $6, % $6,517 $0 $7,053 $0 $0 $0 $0 $0 $0 0% 710.3P General Office 200, ,000 sf (4) 1,000 sf G 5.41 C % C $351 $10,106 $ $ $2, $2,932 $807 $6, % $6,366 $0 $6,891 $0 $0 $0 $0 $0 $0 0% 710.4P General Office greater than 400,000 sf (5) 1,000 sf 9.97 G 5.41 C % C $351 $9,898 $ $ $2, $2,872 $807 $6, % $6,219 $0 $6,733 $0 $0 $0 $0 $0 $0 0% Corporate Headquarters Building 1,000 sf 7.95 H 5.41 N % N $351 $7,893 $ $ $1, $2,290 $807 $4, % $4,796 $0 $5,206 $0 $0 $0 $0 $0 $0 0% Medical Office 1,000 sf B 5.83 C % C $352 $36,089 $1, $1, $7, $10,382 $807 $24, % $24,899 $0 $26,774 $0 $0 $0 $0 $0 $0 0% Office Park 1,000 sf D 7.47 C % Q $353 $15,619 $ $ $3, $4,389 $807 $10, % $10,423 $0 $11,235 $0 $0 $0 $0 $0 $0 0% Research and Development Center 1,000 sf D 5.65 Q % Q $352 $11,316 $ $ $2, $3,264 $807 $7, % $7,245 $0 $7,833 $0 $0 $0 $0 $0 $0 0% 770.P 640 Veterinarian Clinic 1,000 sf B 5.36 P % P $351 $21,379 $ $1, $4, $6,208 $587 $14, % $14,584 $0 $15,695 $0 $0 $0 $0 $0 $0 0% $$ Allocated for Net Mobility Full (1) (Incl Int) Interstate/ SIS (Excl Int) Transit Bike/Ped 2014 Mobility Percent change from 2014 to 2018 Net Mobility 4-6
31 County wide Parameters: Pasco County Land Use Code ITE LUC Table 4 3 (continued) Urban Traditional Neighborhood Development Schedule ( District A) Revenue period: 25 P4P Equivalent Pennies: 6.7 Include carrying cost?: No TOD Deduction: 0.00% Discount Rate: 3.30% 2nd LOFT County pennies to capacity: 5 Include Interstates?: Yes TND Deduction: 11.36% Fuel efficiency: Existing State pennies to capacity: MUTRM Deduction: 0.00% Days/yr: 365 Tax Inc Fin Millage Rate to capacity: Factor to convert VMT to PMT: 1.42 Existing County pennies to capital: 0 Toll.fwy discount: 1.7% Land Use Unit Trip Rate (veh trips) TGR Standard Trip Length TL Market Area Trip Length Adjustment Factor Chargeable Trip length (mi) Trip length for revenue (mi) % New Trips % NT Gross assessable pmt/day Weighted Capacity Addition Ratio Needed PMC Needed PMC After Fwy/Toll/ TOD/TND/ MUTRM Deduct Weighted Cost/PMC Impact Cost PV County Gas Tax ($$/yr): PV P4P Equivalent PV Federal/ State Gas Tax Revenue ($$/yr) PV Sub Countywide selfcredits: PV Tax Before Increment % Self RETAIL: Mini Warehouse 1,000 sf 1.51 B 3.26 K % N $347 $822 $32.46 $43.43 $ $259 $123 $440 53% $234 $206 $483 $194 $166 $28 $3 $9 $206 0% Hardware/Paint 1,000 sf 9.14 B 1.96 R % R $344 $1,802 $79.21 $ $ $632 $516 $654 66% $434 $220 $748 $208 $178 $30 $3 $9 $1,824 88% Retail 50,000 sfgla or less (4) 1,000 sfgla G 1.96 S % S $344 $14,793 $ $ $3, $5,185 $516 $9,092 66% $5,967 $3,125 $9,861 $2,956 $2,530 $426 $35 $134 $3,125 0% 820.1P Retail 50, ,000 sfgla (4) 1,000 sfgla G 2.52 S % S $346 $14,687 $ $ $3, $4,855 $496 $9,336 70% $6,515 $2,821 $10,100 $2,668 $2,282 $386 $32 $121 $2,821 0% 820.2P Retail 200, ,000 sfgla (4) 1,000 sfgla G 2.77 S % S $346 $14,091 $ $ $3, $4,578 $496 $9,017 70% $6,317 $2,700 $9,749 $2,554 $2,185 $369 $30 $116 $2,700 0% 820.3P Retail 400, ,000 sfgla (4) 1,000 sfgla G 3.01 S % S $347 $14,063 $ $ $3, $4,485 $1,495 $8,083 69% $5,539 $2,544 $8,814 $2,407 $2,059 $348 $28 $109 $2,544 0% 820.4P Retail 600, ,000 sfgla (4) 1,000 sfgla G 3.26 S % S $347 $14,440 $ $ $3, $4,547 $1,495 $8,398 68% $5,752 $2,646 $9,148 $2,502 $2,140 $362 $30 $114 $2,646 0% 820.5P Retail greater than 800,000 sfgla (5) 1,000 sfgla G 3.51 S % S $347 $13,819 $ $ $3, $4,304 $1,495 $8,020 65% $5,228 $2,792 $8,738 $2,641 $2,259 $382 $31 $120 $2,792 0% Specialty Retail 1,000 sf H 3.54 C % C $347 $27,289 $1, $1, $5, $8,490 $516 $18,284 71% $13,065 $5,219 $19,702 $4,937 $4,223 $714 $58 $224 $5,219 0% 830.P n/a Non Veterinary Kennel 1,000 sf Y 2.13 C % C $344 $12,535 $ $ $2, $4,237 $516 $7,782 69% $5,359 $2,423 $8,433 $2,292 $1,962 $330 $27 $104 new n/a New/Used Auto Sales 1,000 sf B 4.83 C % C $350 $19,444 $ $ $4, $5,766 $565 $13,113 69% $9,071 $4,042 $14,123 $3,823 $3,269 $554 $45 $174 $4,042 0% Tire Store 1,000 sf B 3.80 T % T $348 $14,206 $ $ $3, $4,361 $516 $9,329 75% $6,964 $2,365 $10,068 $2,236 $1,912 $324 $27 $102 $2,365 0% Supermarket 1,000 sf B 2.18 C % C $344 $23,410 $1, $1, $5, $8,014 $236 $15,159 72% $10,975 $4,184 $16,376 $3,957 $3,386 $571 $47 $180 $4,184 0% Convenience Store w/gas Pumps 1,000 sf D 1.59 C % C $341 $50,065 $2, $3, $13, $18,653 $187 $31,226 67% $21,058 $10,168 $33,828 $9,619 $8,238 $1,381 $112 $437 $10,168 0% Home Improvement Superstore 1,000 sf B 2.52 U % U $346 $9,375 $ $ $2, $3,099 $496 $5,780 73% $4,215 $1,565 $6,267 $1,480 $1,266 $214 $18 $67 $1,565 0% Pharmacy/Drug Store with and without Drive Thru 1,000 sf D 2.18 C % C $344 $12,546 $ $ $3, $4,295 $516 $7,736 72% $5,542 $2,194 $8,388 $2,075 $1,776 $299 $25 $94 $2,194 0% Furniture Store 1,000 sf 6.30 B 6.39 C % C $352 $3,995 $ $ $ $1,149 $516 $2,331 74% $1,729 $602 $2,539 $569 $486 $83 $7 $26 $602 0% Bank/Savings w/drive In 1,000 sf D 2.58 C % C $346 $21,443 $ $1, $4, $7,057 $810 $13,576 53% $7,211 $6,365 $14,691 $6,020 $5,150 $870 $71 $274 $6,365 0% 929P n/a Breakfast and Lunch Restaurant 1,000 sf Y 3.33 C % C $347 $31,741 $1, $1, $7, $9,964 $802 $20,975 69% $14,484 $6,491 $22,624 $6,140 $5,251 $889 $72 $279 new n/a Fast Casual Restaurant 1,000 sf Y 3.33 C % C $347 $77,113 $3, $4, $17, $24,206 $802 $52,104 69% $35,964 $16,140 $56,111 $15,268 $13,059 $2,209 $178 $694 new n/a Quality Restaurant 1,000 sf D 3.30 C % C $347 $40,295 $1, $2, $8, $12,666 $802 $26,826 70% $18,820 $8,006 $28,920 $7,573 $6,477 $1,096 $89 $344 $8,006 0% High Turnover Restaurant 1,000 sf D 3.33 C % C $347 $47,517 $1, $2, $10, $14,916 $802 $31,799 69% $21,970 $9,829 $34,268 $9,297 $7,952 $1,345 $109 $423 $9,829 0% Fast Food Restaurant w/drive Thru 1,000 sf D 2.15 C % C $344 $110,537 $4, $6, $26, $37,953 $1,683 $70,901 71% $50,426 $20,475 $76,644 $19,369 $16,576 $2,793 $226 $880 $20,475 0% Quick Lube bays B 3.80 T % T $348 $19,924 $ $1, $4, $6,116 $283 $13,525 72% $9,686 $3,839 $14,561 $3,631 $3,105 $526 $43 $165 $3,839 0% Auto Repair or Body Shop 1,000 sf H 3.80 T % T $348 $15,655 $ $ $3, $4,806 $565 $10,284 68% $7,019 $3,265 $11,098 $3,089 $2,642 $447 $36 $140 $3,265 0% Gasoline Station fuel pos B 2.00 C % C $344 $14,209 $ $ $3, $4,958 $47 $9,205 72% $6,650 $2,555 $9,943 $2,416 $2,068 $348 $29 $110 $2,555 0% Self Service Car Wash bays D 2.29 C % C $344 $12,288 $ $ $2, $4,163 $19 $8,106 53% $4,257 $3,849 $8,744 $3,640 $3,115 $525 $43 $166 $3,849 0% 913.P 913 Convenience/Gasoline/Fast Food Store 1,000 sf D 2.78 C % C $346 $158,209 $6, $8, $36, $51,369 $187 $106,654 73% $78,259 $28,395 $114,875 $26,861 $22,980 $3,881 $313 $1,221 $28,395 0% INDUSTRIAL: General Light Industrial 1,000 sf 4.96 B 5.41 N % N $352 $5,116 $ $ $1, $1,477 $274 $3, % $3,366 $0 $3,632 $0 $0 $0 $0 $0 $0 0% General Heavy Industrial 1,000 sf 1.50 B 5.41 N % N $352 $1,547 $56.02 $74.97 $ $447 $274 $ % $827 $0 $907 $0 $0 $0 $0 $0 $0 0% Industrial Park 1,000 sf 3.37 B 5.41 N % N $352 $3,476 $ $ $ $1,003 $274 $2, % $2,199 $0 $2,380 $0 $0 $0 $0 $0 $0 0% Manufacturing 1,000 sf 3.93 B 5.41 N % N $352 $4,054 $ $ $ $1,170 $274 $2, % $2,610 $0 $2,821 $0 $0 $0 $0 $0 $0 0% Passive Warehouse (Storage Warehouse) 1,000 sf 1.74 B 5.41 N % N $352 $1,795 $64.99 $86.96 $ $518 $283 $ % $994 $0 $1,087 $0 $0 $0 $0 $0 new n/a /156 Active Warehouse (Fulfillment Center/Parcel Hub) 1,000 sf 7.97 B 6.95 M % N $353 $10,604 $ $ $2, $2,987 $283 $7, % $7,334 $0 $7,886 $0 $0 $0 $0 $0 new n/a 160.P 153 Airport Hangar 1,000 sf 3.56 H 5.41 N % N $352 $3,672 $ $ $ $1,060 $274 $2, % $2,338 $0 $2,529 $0 $0 $0 $0 $0 $0 0% $$ Allocated for Net Mobility Full (1) (Incl Int) Interstate/ SIS (Excl Int) ######### $0 #DIV/0! Notes: (1) This value is the total value of transportation system consumed, less credits for revenues committed to transportation system expansion that are generated by the use itself. This value includes Interstate costs and "carrying costs", but not toll road costs. It does consider the proportion of trip length, varying system costs, and transportation system performance goals that vary by fee district. (2) Specific calculations for the "low income" category can be seen in Appendix B of the 2014 Mobility Update Study. (3) The statistical relationship between the trip generation rate for the age restricted single family, age restricted multi family, and congregate care facility was used to interpolate the trip length. (4) The trip generation rate recommended for the office and retail size categories used the end point of the range due to the nature of the ITE equation to be conservative for smaller developments. (5) The trip generation rate used for the office and retail open ended size categories used the size 200,000 s.f. larger than the beginning of the size range, as the size ranges increase in 200,000 s.f. increments. s of trip rate, percent new trips, and trip length are as follows: (A) National studies (NHTS, AHS, Census) (I) Independent Study (Collier County) (Q) Same as LUC 770 (Business Park) (Y) Other National Studies (B) ITE 10th Edition Trip Generation (J) Same as LUC 220 (R) Same as LUC 820 (<50k) (C) Florida Studies Database (K) Florida Schedules (S) FL Curve (D) Blend ITE 10th & FL Studies (L) Same as LUC 240 (T) Same as LUC 942 (Auto Care Center) (E) Blend ITE 6th & FL Studies (M) Same as LUC 210 (U) Same as LUC 820 (50k 200k) (F) ITE Regression Analysis (N) Same as LUC 710 (V) n/a (G) ITE 10th equation (O) Model Based Trip Length (W) Same as LUC 492 (Health Club) (H) Previous Pasco MMTIF Study (P) Same as LUC 630 (Clinic) (X) Same as LUC 595 (DayCare) F:\WEO PE\Projects\ AECOM Pasco Mobilty 2017\3. Analysis\ Schedule Spreadsheets\[Mobility Schedules 2018 v6.xlsm]urban Transit Bike/Ped 2014 Mobility Percent change from 2014 to 2018 Net Mobility 4-7
32 County wide Parameters: Pasco County Land Use Code ITE LUC Table 4 4 Urban Transit Oriented Development and West (Harbors) Market Area Vacant Parcel Zone Schedule ( District A) Revenue period: 25 P4P Equivalent Pennies: 6.7 Include carrying cost?: No TOD Deduction: 20.46% Discount Rate: 3.30% 2nd LOFT County pennies to capacity: 5 Include Interstates?: Yes TND Deduction: 0.00% Fuel efficiency: Existing State pennies to capacity: MUTRM Deduction: 0.00% Days/yr: 365 Tax Inc Fin Millage Rate to capacity: Factor to convert VMT to PMT: 1.42 Existing County pennies to capital: 0 Toll.fwy discount: 1.7% Land Use Unit Trip Rate (veh trips) TGR Standard Trip Length TL Market Area Trip Length Adjustment Factor Chargeable Trip length (mi) Trip length for revenue (mi) % New Trips % NT Gross assessable pmt/day Weighted Capacity Addition Ratio Needed PMC Needed PMC After Fwy/Toll/ TOD/TND/ MUTRM Deduct Weighted Cost/PMC Impact Cost PV County Gas Tax ($$/yr): PV P4P Equivalent PV Federal/ State Gas Tax Revenue ($$/yr) PV Sub Countywide selfcredits: PV Tax Before Increment % Self RESIDENTIAL: Single Family (Detached) 210.1P Less than 1,500 s.f. & Annual Hh Income less than 80% SHIP Definition (2) du 4.10 A 7.61 C % V $352 $4,691 $ $ $ $1,338 $561 $2,793 70% $1,964 $829 $3,037 $783 $669 $114 $10 $36 $829 0% 210.2P to 1,500 s.f. du 6.25 A 7.61 C % V $352 $7,152 $ $ $1, $2,039 $886 $4,226 75% $3,183 $1,043 $4,598 $986 $843 $143 $12 $45 $1,043 0% 210.3P ,501 to 2,499 s.f. du 7.81 A 7.61 C % V $352 $8,937 $ $ $1, $2,548 $1,123 $5,265 72% $3,806 $1,459 $5,730 $1,379 $1,179 $200 $17 $63 $1,459 0% 210.4P ,500 s.f. and greater du 9.20 A 7.61 C % V $352 $10,527 $ $ $2, $3,002 $1,976 $5,550 71% $3,968 $1,582 $6,097 $1,496 $1,279 $217 $18 $68 $1,582 0% 210.5P "Low Income" SHIP defined Multi Family (2) du 3.46 A 5.87 C % V $351 $3,043 $ $ $ $891 $296 $1,856 71% $1,321 $535 $2,014 $506 $433 $73 $6 $23 $535 0% Multi Family Apartments du 6.60 B 5.87 C % V $351 $5,804 $ $ $1, $1,700 $881 $3,224 69% $2,231 $993 $3,525 $939 $803 $136 $11 $43 $993 0% Low Rise Condominium/Townhouse (1 to 2 stories) du 6.40 H 5.87 J % V $351 $5,628 $ $ $1, $1,648 $786 $3,194 69% $2,192 $1,002 $3,487 $947 $810 $137 $12 $43 $1,002 0% High Rise Condominium (3 or more stories) du 4.18 H 5.87 J % V $351 $3,676 $ $ $ $1,076 $786 $1,813 67% $1,223 $590 $2,004 $558 $477 $81 $7 $25 $721 18% Mobile Home Park du 4.17 C 5.29 C % V $350 $3,298 $ $ $ $978 $204 $2,116 74% $1,564 $552 $2,287 $521 $445 $76 $7 $24 $552 0% Age Restricted Single Family (3) du 3.62 D 6.23 C % V $351 $3,379 $ $ $ $984 $886 $1,509 68% $1,028 $481 $1,685 $454 $388 $66 $6 $21 $481 0% Age Restricted Multi Family (3) du 3.45 D 3.77 C % V $347 $1,927 $75.55 $ $ $602 $881 $444 60% $267 $177 $544 $167 $143 $24 $2 $8 $246 28% Congregate Care Facility (Attached) (3) du 2.02 B 3.54 C % C $347 $763 $30.19 $40.40 $ $241 $160 $363 69% $251 $112 $402 $105 $90 $15 $2 $5 $137 18% LODGING: Hotel room 8.36 D 7.20 C % C $352 $6,299 $ $ $1, $1,796 $306 $4, % $4,197 $0 $4,524 $0 $0 $0 $0 $0 $0 0% Motel room 3.35 D 4.99 C % C $350 $2,029 $75.56 $ $ $602 $184 $1, % $1,243 $0 $1,349 $0 $0 $0 $0 $0 $0 0% Resort Hotel room 5.83 H 7.02 C % C $352 $5,386 $ $ $1, $1,539 $306 $3, % $3,541 $0 $3,821 $0 $0 $0 $0 $0 $0 0% RECREATION: General Recreation acre 2.28 H 5.37 K % K $350 $1,737 $64.18 $85.88 $ $512 $148 $1,077 85% $915 $162 $1,168 $153 $131 $22 $2 $7 $162 0% RV Park RV space 1.62 H 4.83 L % L $349 $1,230 $46.10 $61.69 $ $367 $204 $659 72% $476 $183 $723 $172 $147 $25 $3 $8 $183 0% Marina berth 2.41 B 6.95 M % K $352 $2,390 $85.74 $ $ $684 $155 $1,551 80% $1,238 $313 $1,675 $296 $253 $43 $4 $13 $313 0% Golf Course hole B 6.95 M % K $352 $30,131 $1, $1, $6, $8,617 $823 $20,691 81% $16,828 $3,863 $22,257 $3,654 $3,124 $530 $43 $166 $3,863 0% Miniature Golf Course hole 3.30 H 6.95 M % K $352 $3,273 $ $ $ $936 $75 $2,262 88% $1,982 $280 $2,432 $264 $226 $38 $4 $12 $280 0% Bowling Alley 1,000 sf H 5.41 N % K $350 $25,584 $ $1, $5, $7,529 $358 $17,696 86% $15,159 $2,537 $19,026 $2,400 $2,052 $348 $28 $109 $2,537 0% Movie Theater screen H 2.33 C % C $344 $33,816 $1, $1, $8, $11,514 $876 $21,426 85% $18,215 $3,211 $23,183 $3,037 $2,599 $438 $36 $138 $3,211 0% Racquet Club/Health Club/Spa/Dance Studio 1,000 sf H 5.41 N % W $350 $11,248 $ $ $2, $3,310 $358 $7,580 85% $6,474 $1,106 $8,164 $1,045 $893 $152 $13 $48 $1,106 0% Community Center/Gymnasium 1,000 sf B 7.06 K % K $352 $29,036 $1, $1, $5, $8,293 $358 $20,385 89% $18,099 $2,286 $21,894 $2,162 $1,848 $314 $26 $98 $2,286 0% 496P n/a Ice Skating Arena 1,000 sf 9.95 H 9.21 H % K $354 $13,133 $ $ $2, $3,665 $358 $9,110 98% $8,911 $199 $9,793 $187 $160 $27 $3 $9 new n/a INSTITUTIONS: Elementary School student 1.89 B 4.52 O % K $350 $1,221 $45.32 $60.65 $ $361 $11 $848 87% $738 $110 $911 $103 $88 $15 $2 $5 $110 0% Middle School student 2.13 B 4.52 O % K $350 $1,548 $57.46 $76.90 $ $458 $13 $1,077 85% $920 $157 $1,157 $148 $126 $22 $2 $7 $157 0% High School student 2.03 B 4.52 O % K $350 $1,475 $54.77 $73.29 $ $437 $14 $1,025 84% $859 $166 $1,101 $157 $134 $23 $2 $7 $166 0% University/Jr College (7,500 or fewer students) (Private) student 1.74 B 6.95 M % K $353 $1,959 $69.50 $93.00 $ $554 $15 $1,390 77% $1,069 $321 $1,492 $303 $259 $44 $4 $14 $321 0% University/Jr College (more than 7,500 students) (Private) student 1.21 B 6.95 M % K $353 $1,363 $48.36 $64.72 $ $386 $15 $962 75% $722 $240 $1,033 $227 $194 $33 $3 $10 $240 0% Church 1,000 sf 6.95 B 4.10 K % K $349 $4,569 $ $ $ $1,371 $0 $3,199 76% $2,443 $756 $3,436 $714 $610 $104 $9 $33 $756 0% Day Care student 4.09 B 2.13 C % C $344 $1,114 $47.26 $63.24 $ $377 $13 $725 91% $657 $68 $783 $64 $55 $9 $1 $3 $68 0% Cemetery acre 6.02 B 6.95 M % H $353 $7,152 $ $ $1, $2,023 $447 $4,682 83% $3,875 $807 $5,054 $763 $652 $111 $9 $35 $807 0% Hospital 1,000 sf B 6.95 M % K $353 $10,322 $ $ $2, $2,919 $333 $7,070 70% $4,974 $2,096 $7,606 $1,982 $1,694 $288 $24 $90 $2,257 7% Nursing Home bed 3.06 B 2.72 C % C $347 $1,311 $52.62 $70.41 $ $419 $160 $732 82% $599 $133 $800 $125 $107 $18 $2 $6 new n/a OFFICE: General Office 50,000 sf or less (4) 1,000 sf G 5.41 C % C $351 $9,652 $ $ $1, $2,800 $587 $6, % $6,265 $0 $6,766 $0 $0 $0 $0 $0 $0 0% 710.1P General Office 50, ,000 sf (4) 1,000 sf G 5.41 C % C $351 $9,453 $ $ $1, $2,743 $807 $5, % $5,903 $0 $6,394 $0 $0 $0 $0 $0 $0 0% 710.2P General Office 100, ,000 sf (4) 1,000 sf G 5.41 C % C $351 $9,259 $ $ $1, $2,686 $807 $5, % $5,765 $0 $6,246 $0 $0 $0 $0 $0 $0 0% 710.3P General Office 200, ,000 sf (4) 1,000 sf G 5.41 C % C $351 $9,068 $ $ $1, $2,631 $807 $5, % $5,630 $0 $6,101 $0 $0 $0 $0 $0 $0 0% 710.4P General Office greater than 400,000 sf (5) 1,000 sf 9.97 G 5.41 C % C $351 $8,882 $ $ $1, $2,577 $807 $5, % $5,497 $0 $5,959 $0 $0 $0 $0 $0 $0 0% Corporate Headquarters Building 1,000 sf 7.95 H 5.41 N % N $351 $7,083 $ $ $1, $2,055 $807 $4, % $4,221 $0 $4,589 $0 $0 $0 $0 $0 $0 0% Medical Office 1,000 sf B 5.83 C % C $352 $32,384 $1, $1, $6, $9,316 $807 $22, % $22,260 $0 $23,943 $0 $0 $0 $0 $0 $0 0% Office Park 1,000 sf D 7.47 C % Q $353 $14,016 $ $ $2, $3,938 $807 $9, % $9,270 $0 $9,999 $0 $0 $0 $0 $0 $0 0% Research and Development Center 1,000 sf D 5.65 Q % Q $352 $10,155 $ $ $2, $2,929 $807 $6, % $6,418 $0 $6,946 $0 $0 $0 $0 $0 $0 0% 770.P 640 Veterinarian Clinic 1,000 sf B 5.36 P % P $351 $19,184 $ $ $3, $5,571 $587 $13, % $13,027 $0 $14,024 $0 $0 $0 $0 $0 $0 0% $$ Allocated for Net Mobility Full (1) (Incl Int) Interstate/ SIS (Excl Int) Transit Bike/Ped 2014 Mobility Percent change from 2014 to 2018 Net Mobility 4-8
33 County wide Parameters: Pasco County Land Use Code ITE LUC Table 4 4 (continued) Urban Transit Oriented Development and West (Harbors) Market Area Vacant Parcel Zone Schedule ( District A) Revenue period: 25 P4P Equivalent Pennies: 6.7 Include carrying cost?: No TOD Deduction: 20.46% Discount Rate: 3.30% 2nd LOFT County pennies to capacity: 5 Include Interstates?: Yes TND Deduction: 0.00% Fuel efficiency: Existing State pennies to capacity: MUTRM Deduction: 0.00% Days/yr: 365 Tax Inc Fin Millage Rate to capacity: Factor to convert VMT to PMT: 1.42 Existing County pennies to capital: 0 Toll.fwy discount: 1.7% Land Use Unit Trip Rate (veh trips) TGR Standard Trip Length TL Market Area Trip Length Adjustment Factor Chargeable Trip length (mi) Trip length for revenue (mi) % New Trips % NT Gross assessable pmt/day Weighted Capacity Addition Ratio Needed PMC Needed PMC After Fwy/Toll/ TOD/TND/ MUTRM Deduct Weighted Cost/PMC Impact Cost PV County Gas Tax ($$/yr): PV P4P Equivalent PV Federal/ State Gas Tax Revenue ($$/yr) PV Sub Countywide selfcredits: PV Tax Before Increment % Self RETAIL: Mini Warehouse 1,000 sf 1.51 B 3.26 K % N $347 $737 $29.12 $38.97 $ $232 $123 $382 73% $279 $103 $421 $97 $83 $14 $2 $4 $103 0% Hardware/Paint 1,000 sf 9.14 B 1.96 R % R $344 $1,617 $71.08 $95.12 $ $567 $516 $534 79% $424 $110 $618 $103 $88 $15 $2 $5 $912 88% Retail 50,000 sfgla or less (4) 1,000 sfgla G 1.96 S % S $344 $13,274 $ $ $3, $4,653 $516 $8,106 81% $6,544 $1,562 $8,795 $1,477 $1,264 $213 $18 $67 $1,562 0% 820.1P Retail 50, ,000 sfgla (4) 1,000 sfgla G 2.52 S % S $346 $13,180 $ $ $3, $4,357 $496 $8,327 83% $6,917 $1,410 $9,012 $1,333 $1,140 $193 $16 $61 $1,410 0% 820.2P Retail 200, ,000 sfgla (4) 1,000 sfgla G 2.77 S % S $346 $12,644 $ $ $2, $4,108 $496 $8,040 83% $6,690 $1,350 $8,698 $1,277 $1,092 $185 $15 $58 $1,350 0% 820.3P Retail 400, ,000 sfgla (4) 1,000 sfgla G 3.01 S % S $347 $12,619 $ $ $2, $4,025 $1,495 $7,100 82% $5,828 $1,272 $7,756 $1,203 $1,029 $174 $14 $55 $1,272 0% 820.4P Retail 600, ,000 sfgla (4) 1,000 sfgla G 3.26 S % S $347 $12,957 $ $ $2, $4,081 $1,495 $7,382 82% $6,059 $1,323 $8,055 $1,251 $1,070 $181 $15 $57 $1,323 0% 820.5P Retail greater than 800,000 sfgla (5) 1,000 sfgla G 3.51 S % S $347 $12,400 $ $ $2, $3,863 $1,495 $7,043 80% $5,647 $1,396 $7,688 $1,320 $1,129 $191 $16 $60 $1,396 0% Specialty Retail 1,000 sf H 3.54 C % C $347 $24,487 $ $1, $5, $7,618 $516 $16,354 84% $13,745 $2,609 $17,626 $2,468 $2,111 $357 $29 $112 $2,609 0% 830.P n/a Non Veterinary Kennel 1,000 sf Y 2.13 C % C $344 $11,248 $ $ $2, $3,802 $516 $6,930 83% $5,718 $1,212 $7,515 $1,146 $981 $165 $14 $52 new n/a New/Used Auto Sales 1,000 sf B 4.83 C % C $350 $17,448 $ $ $3, $5,174 $565 $11,708 83% $9,687 $2,021 $12,615 $1,911 $1,634 $277 $23 $87 $2,021 0% Tire Store 1,000 sf B 3.80 T % T $348 $12,747 $ $ $2, $3,913 $516 $8,319 86% $7,137 $1,182 $8,981 $1,117 $955 $162 $14 $51 $1,182 0% Supermarket 1,000 sf B 2.18 C % C $344 $21,007 $ $1, $5, $7,191 $236 $13,579 85% $11,487 $2,092 $14,670 $1,978 $1,693 $285 $24 $90 $2,092 0% Convenience Store w/gas Pumps 1,000 sf D 1.59 C % C $341 $44,925 $2, $2, $11, $16,738 $187 $28,001 82% $22,917 $5,084 $30,336 $4,809 $4,118 $691 $56 $219 $5,084 0% Home Improvement Superstore 1,000 sf B 2.52 U % U $346 $8,412 $ $ $1, $2,781 $496 $5,136 85% $4,353 $783 $5,573 $740 $633 $107 $9 $34 $783 0% Pharmacy/Drug Store with and without Drive Thru 1,000 sf D 2.18 C % C $344 $11,258 $ $ $2, $3,854 $516 $6,889 84% $5,792 $1,097 $7,474 $1,037 $887 $150 $13 $47 $1,097 0% Furniture Store 1,000 sf 6.30 B 6.39 C % C $352 $3,585 $ $ $ $1,031 $516 $2,039 85% $1,738 $301 $2,225 $284 $243 $41 $4 $13 $301 0% Bank/Savings w/drive In 1,000 sf D 2.58 C % C $346 $19,242 $ $1, $4, $6,332 $810 $12,099 74% $8,916 $3,183 $13,099 $3,010 $2,575 $435 $36 $137 $3,183 0% 929P n/a Breakfast and Lunch Restaurant 1,000 sf Y 3.33 C % C $347 $28,482 $1, $1, $6, $8,941 $802 $18,739 83% $15,494 $3,245 $20,219 $3,069 $2,625 $444 $36 $140 new n/a Fast Casual Restaurant 1,000 sf Y 3.33 C % C $347 $69,196 $2, $3, $15, $21,721 $802 $46,673 83% $38,603 $8,070 $50,268 $7,634 $6,529 $1,105 $89 $347 new n/a Quality Restaurant 1,000 sf D 3.30 C % C $347 $36,158 $1, $1, $8, $11,366 $802 $23,990 83% $19,987 $4,003 $25,869 $3,786 $3,238 $548 $45 $172 $4,003 0% High Turnover Restaurant 1,000 sf D 3.33 C % C $347 $42,638 $1, $2, $9, $13,385 $802 $28,452 83% $23,537 $4,915 $30,667 $4,649 $3,976 $673 $55 $211 $4,915 0% Fast Food Restaurant w/drive Thru 1,000 sf D 2.15 C % C $344 $99,189 $4, $5, $24, $34,057 $1,683 $63,449 84% $53,211 $10,238 $68,603 $9,685 $8,289 $1,396 $113 $440 $10,238 0% Quick Lube bays B 3.80 T % T $348 $17,879 $ $ $3, $5,488 $283 $12,108 84% $10,189 $1,919 $13,037 $1,814 $1,551 $263 $22 $83 $1,919 0% Auto Repair or Body Shop 1,000 sf H 3.80 T % T $348 $14,048 $ $ $3, $4,312 $565 $9,171 82% $7,538 $1,633 $9,901 $1,545 $1,321 $224 $18 $70 $1,633 0% Gasoline Station fuel pos B 2.00 C % C $344 $12,751 $ $ $3, $4,449 $47 $8,255 85% $6,977 $1,278 $8,918 $1,208 $1,034 $174 $15 $55 $1,278 0% Self Service Car Wash bays D 2.29 C % C $344 $11,026 $ $ $2, $3,736 $19 $7,272 74% $5,348 $1,924 $7,845 $1,819 $1,557 $262 $22 $83 $1,924 0% 913.P 913 Convenience/Gasoline/Fast Food Store 1,000 sf D 2.78 C % C $346 $141,967 $5, $7, $32, $46,095 $187 $95,685 85% $81,487 $14,198 $103,062 $13,430 $11,489 $1,941 $157 $611 $14,198 0% INDUSTRIAL: General Light Industrial 1,000 sf 4.96 B 5.41 N % N $352 $4,591 $ $ $ $1,325 $274 $2, % $2,992 $0 $3,231 $0 $0 $0 $0 $0 $0 0% General Heavy Industrial 1,000 sf 1.50 B 5.41 N % N $352 $1,388 $50.27 $67.27 $ $401 $274 $ % $714 $0 $786 $0 $0 $0 $0 $0 $0 0% Industrial Park 1,000 sf 3.37 B 5.41 N % N $352 $3,119 $ $ $ $900 $274 $1, % $1,945 $0 $2,107 $0 $0 $0 $0 $0 $0 0% Manufacturing 1,000 sf 3.93 B 5.41 N % N $352 $3,638 $ $ $ $1,050 $274 $2, % $2,314 $0 $2,503 $0 $0 $0 $0 $0 $0 0% Passive Warehouse (Storage Warehouse) 1,000 sf 1.74 B 5.41 N % N $352 $1,611 $58.31 $78.04 $ $465 $283 $ % $863 $0 $947 $0 $0 $0 $0 $0 new n/a /156 Active Warehouse (Fulfillment Center/Parcel Hub) 1,000 sf 7.97 B 6.95 M % N $353 $9,516 $ $ $1, $2,680 $283 $6, % $6,552 $0 $7,047 $0 $0 $0 $0 $0 new n/a 160.P 153 Airport Hangar 1,000 sf 3.56 H 5.41 N % N $352 $3,295 $ $ $ $951 $274 $2, % $2,070 $0 $2,241 $0 $0 $0 $0 $0 $0 0% $$ Allocated for Net Mobility Full (1) (Incl Int) Interstate/ SIS (Excl Int) ######### $0 #DIV/0! Notes: (1) This value is the total value of transportation system consumed, less credits for revenues committed to transportation system expansion that are generated by the use itself. This value includes Interstate costs and "carrying costs", but not toll road costs. It does consider the proportion of trip length, varying system costs, and transportation system performance goals that vary by fee district. (2) Specific calculations for the "low income" category can be seen in Appendix B of the 2014 Mobility Update Study. (3) The statistical relationship between the trip generation rate for the age restricted single family, age restricted multi family, and congregate care facility was used to interpolate the trip length. (4) The trip generation rate recommended for the office and retail size categories used the end point of the range due to the nature of the ITE equation to be conservative for smaller developments. (5) The trip generation rate used for the office and retail open ended size categories used the size 200,000 s.f. larger than the beginning of the size range, as the size ranges increase in 200,000 s.f. increments. s of trip rate, percent new trips, and trip length are as follows: (A) National studies (NHTS, AHS, Census) (I) Independent Study (Collier County) (Q) Same as LUC 770 (Business Park) (Y) Other National Studies (B) ITE 10th Edition Trip Generation (J) Same as LUC 220 (R) Same as LUC 820 (<50k) (C) Florida Studies Database (K) Florida Schedules (S) FL Curve (D) Blend ITE 10th & FL Studies (L) Same as LUC 240 (T) Same as LUC 942 (Auto Care Center) (E) Blend ITE 6th & FL Studies (M) Same as LUC 210 (U) Same as LUC 820 (50k 200k) (F) ITE Regression Analysis (N) Same as LUC 710 (V) n/a (G) ITE 10th equation (O) Model Based Trip Length (W) Same as LUC 492 (Health Club) (H) Previous Pasco MMTIF Study (P) Same as LUC 630 (Clinic) (X) Same as LUC 595 (DayCare) F:\WEO PE\Projects\ AECOM Pasco Mobilty 2017\3. Analysis\ Schedule Spreadsheets\[Mobility Schedules 2018 v6.xlsm]urban Transit Bike/Ped 2014 Mobility Percent change from 2014 to 2018 Net Mobility 4-9
34 County wide Parameters: Pasco County Land Use Code ITE LUC Table 4 5 Urban West (Harbors) Market Area Redevelopment District Schedule ( District A) Revenue period: 25 P4P Equivalent Pennies: 6.7 Include carrying cost?: No TOD Deduction: 0.00% Discount Rate: 3.30% 2nd LOFT County pennies to capacity: 5 Include Interstates?: Yes TND Deduction: 0.00% Fuel efficiency: Existing State pennies to capacity: MUTRM Deduction: 0.00% Days/yr: 365 Tax Inc Fin Millage Rate to capacity: Factor to convert VMT to PMT: 1.42 Existing County pennies to capital: 0 Toll.fwy discount: 1.7% Land Use Unit Trip Rate (veh trips) TGR Standard Trip Length TL Market Area Trip Length Adjustment Factor Chargeable Trip length (mi) Trip length for revenue (mi) % New Trips % NT Gross assessable pmt/day Weighted Capacity Addition Ratio Needed PMC Needed PMC After Fwy/Toll/ TOD/TND/ MUTRM Deduct Weighted Cost/PMC Impact Cost PV County Gas Tax ($$/yr): PV P4P Equivalent PV Federal/ State Gas Tax Revenue ($$/yr) PV Sub Countywide selfcredits: PV Tax Before Increment % Self RESIDENTIAL: Single Family (Detached) 210.1P Less than 1,500 s.f. & Annual Hh Income less than 80% SHIP Definition (2) du 4.10 A 7.61 C % V $352 $5,898 $ $ $1, $1,682 $561 $3, % $3,656 $0 $3,962 $0 $0 $0 $0 $0 $0 0% 210.2P to 1,500 s.f. du 6.25 A 7.61 C % V $352 $8,991 $ $ $1, $2,564 $886 $5, % $5,541 $0 $6,009 $0 $0 $0 $0 $0 $0 0% 210.3P ,501 to 2,499 s.f. du 7.81 A 7.61 C % V $352 $11,235 $ $ $2, $3,203 $1,123 $6, % $6,909 $0 $7,493 $0 $0 $0 $0 $0 $0 0% 210.4P ,500 s.f. and greater du 9.20 A 7.61 C % V $352 $13,235 $ $ $2, $3,774 $1,976 $7, % $7,486 $0 $8,174 $0 $0 $0 $0 $0 $0 0% 210.5P "Low Income" SHIP defined Multi Family (2) du 3.46 A 5.87 C % V $351 $3,826 $ $ $ $1,120 $296 $2, % $2,409 $0 $2,608 $0 $0 $0 $0 $0 $0 0% Multi Family Apartments du 6.60 B 5.87 C % V $351 $7,297 $ $ $1, $2,137 $881 $4, % $4,280 $0 $4,659 $0 $0 $0 $0 $0 $0 0% Low Rise Condominium/Townhouse (1 to 2 stories) du 6.40 H 5.87 J % V $351 $7,076 $ $ $1, $2,072 $786 $4, % $4,218 $0 $4,586 $0 $0 $0 $0 $0 $0 0% High Rise Condominium (3 or more stories) du 4.18 H 5.87 J % V $351 $4,622 $ $ $ $1,353 $786 $2, % $2,482 $0 $2,722 $0 $0 $0 $0 $0 $0 0% Mobile Home Park du 4.17 C 5.29 C % V $350 $4,146 $ $ $ $1,230 $204 $2, % $2,712 $0 $2,928 $0 $0 $0 $0 $0 $0 0% Age Restricted Single Family (3) du 3.62 D 6.23 C % V $351 $4,248 $ $ $ $1,237 $886 $2, % $2,125 $0 $2,346 $0 $0 $0 $0 $0 $0 0% Age Restricted Multi Family (3) du 3.45 D 3.77 C % V $347 $2,423 $94.98 $ $ $757 $881 $ % $785 $0 $911 $0 $0 $0 $0 $0 $0 0% Congregate Care Facility (Attached) (3) du 2.02 B 3.54 C % C $347 $959 $37.96 $50.79 $ $303 $160 $ % $497 $0 $547 $0 $0 $0 $0 $0 $0 0% LODGING: Hotel room 8.36 D 7.20 C % C $352 $7,920 $ $ $1, $2,258 $306 $5, % $5,355 $0 $5,767 $0 $0 $0 $0 $0 $0 0% Motel room 3.35 D 4.99 C % C $350 $2,551 $94.99 $ $ $757 $184 $1, % $1,610 $0 $1,743 $0 $0 $0 $0 $0 $0 0% Resort Hotel room 5.83 H 7.02 C % C $352 $6,772 $ $ $1, $1,935 $306 $4, % $4,531 $0 $4,883 $0 $0 $0 $0 $0 $0 0% RECREATION: General Recreation acre 2.28 H 5.37 K % K $350 $2,184 $80.69 $ $ $643 $148 $1, % $1,393 $0 $1,506 $0 $0 $0 $0 $0 $0 0% RV Park RV space 1.62 H 4.83 L % L $349 $1,547 $57.95 $77.55 $ $462 $204 $ % $881 $0 $962 $0 $0 $0 $0 $0 $0 0% Marina berth 2.41 B 6.95 M % K $352 $3,005 $ $ $ $859 $155 $1, % $1,990 $0 $2,146 $0 $0 $0 $0 $0 $0 0% Golf Course hole B 6.95 M % K $352 $37,882 $1, $1, $7, $10,834 $823 $26, % $26,225 $0 $28,193 $0 $0 $0 $0 $0 $0 0% Miniature Golf Course hole 3.30 H 6.95 M % K $352 $4,115 $ $ $ $1,177 $75 $2, % $2,863 $0 $3,077 $0 $0 $0 $0 $0 $0 0% Bowling Alley 1,000 sf H 5.41 N % K $350 $32,164 $1, $1, $6, $9,466 $358 $22, % $22,340 $0 $24,012 $0 $0 $0 $0 $0 $0 0% Movie Theater screen H 2.33 C % C $344 $42,515 $1, $2, $10, $14,476 $876 $27, % $27,163 $0 $29,372 $0 $0 $0 $0 $0 $0 0% Racquet Club/Health Club/Spa/Dance Studio 1,000 sf H 5.41 N % W $350 $14,141 $ $ $2, $4,162 $358 $9, % $9,621 $0 $10,356 $0 $0 $0 $0 $0 $0 0% Community Center/Gymnasium 1,000 sf B 7.06 K % K $352 $36,505 $1, $1, $7, $10,427 $358 $25, % $25,721 $0 $27,618 $0 $0 $0 $0 $0 $0 0% 496P n/a Ice Skating Arena 1,000 sf 9.95 H 9.21 H % K $354 $16,512 $ $ $3, $4,608 $358 $11, % $11,546 $0 $12,404 $0 $0 $0 $0 $0 new n/a INSTITUTIONS: Elementary School student 1.89 B 4.52 O % K $350 $1,535 $56.98 $76.25 $ $454 $11 $1, % $1,069 $0 $1,149 $0 $0 $0 $0 $0 $0 0% Middle School student 2.13 B 4.52 O % K $350 $1,946 $72.25 $96.68 $ $576 $13 $1, % $1,357 $0 $1,458 $0 $0 $0 $0 $0 $0 0% High School student 2.03 B 4.52 O % K $350 $1,854 $68.85 $92.14 $ $549 $14 $1, % $1,292 $0 $1,388 $0 $0 $0 $0 $0 $0 0% University/Jr College (7,500 or fewer students) (Private) student 1.74 B 6.95 M % K $353 $2,463 $87.37 $ $ $697 $15 $1, % $1,751 $0 $1,879 $0 $0 $0 $0 $0 $0 0% University/Jr College (more than 7,500 students) (Private) student 1.21 B 6.95 M % K $353 $1,714 $60.80 $81.37 $ $485 $15 $1, % $1,214 $0 $1,303 $0 $0 $0 $0 $0 $0 0% Church 1,000 sf 6.95 B 4.10 K % K $349 $5,745 $ $ $1, $1,723 $0 $4, % $4,021 $0 $4,320 $0 $0 $0 $0 $0 $0 0% Day Care student 4.09 B 2.13 C % C $344 $1,401 $59.41 $79.50 $ $474 $13 $ % $915 $0 $987 $0 $0 $0 $0 $0 $0 0% Cemetery acre 6.02 B 6.95 M % H $353 $8,991 $ $ $1, $2,543 $447 $6, % $6,002 $0 $6,469 $0 $0 $0 $0 $0 $0 0% Hospital 1,000 sf B 6.95 M % K $353 $12,977 $ $ $2, $3,670 $333 $8, % $8,974 $0 $9,649 $0 $0 $0 $0 $0 $0 0% Nursing Home bed 3.06 B 2.72 C % C $347 $1,649 $66.15 $88.52 $ $527 $160 $ % $962 $0 $1,047 $0 $0 $0 $0 $0 new n/a OFFICE: General Office 50,000 sf or less (4) 1,000 sf G 5.41 C % C $351 $12,135 $ $ $2, $3,521 $587 $8, % $8,027 $0 $8,658 $0 $0 $0 $0 $0 $0 0% 710.1P General Office 50, ,000 sf (4) 1,000 sf G 5.41 C % C $351 $11,885 $ $ $2, $3,448 $807 $7, % $7,629 $0 $8,247 $0 $0 $0 $0 $0 $0 0% 710.2P General Office 100, ,000 sf (4) 1,000 sf G 5.41 C % C $351 $11,640 $ $ $2, $3,377 $807 $7, % $7,456 $0 $8,061 $0 $0 $0 $0 $0 $0 0% 710.3P General Office 200, ,000 sf (4) 1,000 sf G 5.41 C % C $351 $11,401 $ $ $2, $3,308 $807 $7, % $7,286 $0 $7,878 $0 $0 $0 $0 $0 $0 0% 710.4P General Office greater than 400,000 sf (5) 1,000 sf 9.97 G 5.41 C % C $351 $11,166 $ $ $2, $3,240 $807 $7, % $7,119 $0 $7,699 $0 $0 $0 $0 $0 $0 0% Corporate Headquarters Building 1,000 sf 7.95 H 5.41 N % N $351 $8,905 $ $ $1, $2,584 $807 $5, % $5,514 $0 $5,977 $0 $0 $0 $0 $0 $0 0% Medical Office 1,000 sf B 5.83 C % C $352 $40,714 $1, $1, $8, $11,713 $807 $28, % $28,194 $0 $30,309 $0 $0 $0 $0 $0 $0 0% Office Park 1,000 sf D 7.47 C % Q $353 $17,621 $ $ $3, $4,951 $807 $11, % $11,863 $0 $12,778 $0 $0 $0 $0 $0 $0 0% Research and Development Center 1,000 sf D 5.65 Q % Q $352 $12,767 $ $ $2, $3,683 $807 $8, % $8,277 $0 $8,940 $0 $0 $0 $0 $0 $0 0% 770.P 640 Veterinarian Clinic 1,000 sf B 5.36 P % P $351 $24,119 $ $1, $4, $7,004 $587 $16, % $16,528 $0 $17,782 $0 $0 $0 $0 $0 $0 0% $$ Allocated for Net Mobility Full (1) (Incl Int) Interstate/ SIS (Excl Int) Transit Bike/Ped 2014 Mobility Percent change from 2014 to 2018 Net Mobility 4-10
35 County wide Parameters: Pasco County Land Use Code ITE LUC Table 4 5 (continued) Urban West (Harbors) Market Area Redevelopment District Schedule ( District A) Revenue period: 25 P4P Equivalent Pennies: 6.7 Include carrying cost?: No TOD Deduction: 0.00% Discount Rate: 3.30% 2nd LOFT County pennies to capacity: 5 Include Interstates?: Yes TND Deduction: 0.00% Fuel efficiency: Existing State pennies to capacity: MUTRM Deduction: 0.00% Days/yr: 365 Tax Inc Fin Millage Rate to capacity: Factor to convert VMT to PMT: 1.42 Existing County pennies to capital: 0 Toll.fwy discount: 1.7% Land Use Unit Trip Rate (veh trips) TGR Standard Trip Length TL Market Area Trip Length Adjustment Factor Chargeable Trip length (mi) Trip length for revenue (mi) % New Trips % NT Gross assessable pmt/day Weighted Capacity Addition Ratio Needed PMC Needed PMC After Fwy/Toll/ TOD/TND/ MUTRM Deduct Weighted Cost/PMC Impact Cost PV County Gas Tax ($$/yr): PV P4P Equivalent PV Federal/ State Gas Tax Revenue ($$/yr) PV Sub Countywide selfcredits: PV Tax Before Increment % Self RETAIL: Mini Warehouse 1,000 sf 1.51 B 3.26 K % N $347 $927 $36.62 $49.00 $ $292 $123 $ % $512 $0 $560 $0 $0 $0 $0 $0 $0 0% Hardware/Paint 1,000 sf 9.14 B 1.96 R % R $344 $2,032 $89.37 $ $ $712 $516 $ % $804 $0 $910 $0 $0 $0 $0 $0 $0 0% Retail 50,000 sfgla or less (4) 1,000 sfgla G 1.96 S % S $344 $16,689 $ $ $4, $5,850 $516 $10, % $10,323 $0 $11,191 $0 $0 $0 $0 $0 $0 0% 820.1P Retail 50, ,000 sfgla (4) 1,000 sfgla G 2.52 S % S $346 $16,570 $ $ $3, $5,477 $496 $10, % $10,597 $0 $11,458 $0 $0 $0 $0 $0 $0 0% 820.2P Retail 200, ,000 sfgla (4) 1,000 sfgla G 2.77 S % S $346 $15,897 $ $ $3, $5,165 $496 $10, % $10,236 $0 $11,062 $0 $0 $0 $0 $0 $0 0% 820.3P Retail 400, ,000 sfgla (4) 1,000 sfgla G 3.01 S % S $347 $15,865 $ $ $3, $5,060 $1,495 $9, % $9,311 $0 $10,135 $0 $0 $0 $0 $0 $0 0% 820.4P Retail 600, ,000 sfgla (4) 1,000 sfgla G 3.26 S % S $347 $16,290 $ $ $3, $5,130 $1,495 $9, % $9,666 $0 $10,512 $0 $0 $0 $0 $0 $0 0% 820.5P Retail greater than 800,000 sfgla (5) 1,000 sfgla G 3.51 S % S $347 $15,590 $ $ $3, $4,856 $1,495 $9, % $9,240 $0 $10,050 $0 $0 $0 $0 $0 $0 0% Specialty Retail 1,000 sf H 3.54 C % C $347 $30,786 $1, $1, $6, $9,578 $516 $20, % $20,693 $0 $22,293 $0 $0 $0 $0 $0 $0 0% 830.P n/a Non Veterinary Kennel 1,000 sf Y 2.13 C % C $344 $14,141 $ $ $3, $4,780 $516 $8, % $8,846 $0 $9,580 $0 $0 $0 $0 $0 new n/a New/Used Auto Sales 1,000 sf B 4.83 C % C $350 $21,936 $ $1, $4, $6,505 $565 $14, % $14,866 $0 $16,005 $0 $0 $0 $0 $0 $0 0% Tire Store 1,000 sf B 3.80 T % T $348 $16,027 $ $ $3, $4,920 $516 $10, % $10,591 $0 $11,424 $0 $0 $0 $0 $0 $0 0% Supermarket 1,000 sf B 2.18 C % C $344 $26,410 $1, $1, $6, $9,041 $236 $17, % $17,133 $0 $18,505 $0 $0 $0 $0 $0 $0 0% Convenience Store w/gas Pumps 1,000 sf D 1.59 C % C $341 $56,482 $2, $3, $14, $21,043 $187 $35, % $35,252 $0 $38,187 $0 $0 $0 $0 $0 $0 0% Home Improvement Superstore 1,000 sf B 2.52 U % U $346 $10,576 $ $ $2, $3,496 $496 $6, % $6,584 $0 $7,134 $0 $0 $0 $0 $0 $0 0% Pharmacy/Drug Store with and without Drive Thru 1,000 sf D 2.18 C % C $344 $14,154 $ $ $3, $4,846 $516 $8, % $8,793 $0 $9,529 $0 $0 $0 $0 $0 $0 0% Furniture Store 1,000 sf 6.30 B 6.39 C % C $352 $4,507 $ $ $ $1,296 $516 $2, % $2,696 $0 $2,930 $0 $0 $0 $0 $0 $0 0% Bank/Savings w/drive In 1,000 sf D 2.58 C % C $346 $24,191 $ $1, $5, $7,961 $810 $15, % $15,420 $0 $16,677 $0 $0 $0 $0 $0 $0 0% 929P n/a Breakfast and Lunch Restaurant 1,000 sf Y 3.33 C % C $347 $35,809 $1, $1, $7, $11,241 $802 $23, % $23,766 $0 $25,627 $0 $0 $0 $0 $0 new n/a Fast Casual Restaurant 1,000 sf Y 3.33 C % C $347 $86,995 $3, $4, $19, $27,309 $802 $58, % $58,885 $0 $63,405 $0 $0 $0 $0 $0 new n/a Quality Restaurant 1,000 sf D 3.30 C % C $347 $45,459 $1, $2, $10, $14,289 $802 $30, % $30,367 $0 $32,729 $0 $0 $0 $0 $0 $0 0% High Turnover Restaurant 1,000 sf D 3.33 C % C $347 $53,606 $2, $2, $11, $16,828 $802 $35, % $35,977 $0 $38,762 $0 $0 $0 $0 $0 $0 0% Fast Food Restaurant w/drive Thru 1,000 sf D 2.15 C % C $344 $124,703 $5, $7, $30, $42,817 $1,683 $80, % $80,203 $0 $86,683 $0 $0 $0 $0 $0 $0 0% Quick Lube bays B 3.80 T % T $348 $22,478 $ $1, $4, $6,900 $283 $15, % $15,295 $0 $16,463 $0 $0 $0 $0 $0 $0 0% Auto Repair or Body Shop 1,000 sf H 3.80 T % T $348 $17,662 $ $ $3, $5,422 $565 $11, % $11,675 $0 $12,593 $0 $0 $0 $0 $0 $0 0% Gasoline Station fuel pos B 2.00 C % C $344 $16,030 $ $ $3, $5,593 $47 $10, % $10,391 $0 $11,224 $0 $0 $0 $0 $0 $0 0% Self Service Car Wash bays D 2.29 C % C $344 $13,862 $ $ $3, $4,697 $19 $9, % $9,147 $0 $9,867 $0 $0 $0 $0 $0 $0 0% 913.P 913 Convenience/Gasoline/Fast Food Store 1,000 sf D 2.78 C % C $346 $178,485 $7, $9, $40, $57,952 $187 $120, % $120,346 $0 $129,621 $0 $0 $0 $0 $0 $0 0% INDUSTRIAL: General Light Industrial 1,000 sf 4.96 B 5.41 N % N $352 $5,772 $ $ $1, $1,666 $274 $3, % $3,832 $0 $4,132 $0 $0 $0 $0 $0 $0 0% General Heavy Industrial 1,000 sf 1.50 B 5.41 N % N $352 $1,746 $63.20 $84.58 $ $504 $274 $ % $968 $0 $1,059 $0 $0 $0 $0 $0 $0 0% Industrial Park 1,000 sf 3.37 B 5.41 N % N $352 $3,922 $ $ $ $1,132 $274 $2, % $2,516 $0 $2,720 $0 $0 $0 $0 $0 $0 0% Manufacturing 1,000 sf 3.93 B 5.41 N % N $352 $4,573 $ $ $ $1,320 $274 $2, % $2,979 $0 $3,217 $0 $0 $0 $0 $0 $0 0% Passive Warehouse (Storage Warehouse) 1,000 sf 1.74 B 5.41 N % N $352 $2,025 $73.32 $98.11 $ $584 $283 $1, % $1,158 $0 $1,263 $0 $0 $0 $0 $0 new n/a /156 Active Warehouse (Fulfillment Center/Parcel Hub) 1,000 sf 7.97 B 6.95 M % N $353 $11,963 $ $ $2, $3,370 $283 $8, % $8,311 $0 $8,932 $0 $0 $0 $0 $0 new n/a 160.P 153 Airport Hangar 1,000 sf 3.56 H 5.41 N % N $352 $4,143 $ $ $ $1,196 $274 $2, % $2,673 $0 $2,888 $0 $0 $0 $0 $0 $0 0% $$ Allocated for Net Mobility Full (1) (Incl Int) Interstate/ SIS (Excl Int) 4300% $0 #DIV/0! Notes: (1) This value is the total value of transportation system consumed, less credits for revenues committed to transportation system expansion that are generated by the use itself. This value includes Interstate costs and "carrying costs", but not toll road costs. It does consider the proportion of trip length, varying system costs, and transportation system performance goals that vary by fee district. (2) Specific calculations for the "low income" category can be seen in Appendix B of the 2014 Mobility Update Study. (3) The statistical relationship between the trip generation rate for the age restricted single family, age restricted multi family, and congregate care facility was used to interpolate the trip length. (4) The trip generation rate recommended for the office and retail size categories used the end point of the range due to the nature of the ITE equation to be conservative for smaller developments. (5) The trip generation rate used for the office and retail open ended size categories used the size 200,000 s.f. larger than the beginning of the size range, as the size ranges increase in 200,000 s.f. increments. s of trip rate, percent new trips, and trip length are as follows: (A) National studies (NHTS, AHS, Census) (I) Independent Study (Collier County) (Q) Same as LUC 770 (Business Park) (Y) Other National Studies (B) ITE 10th Edition Trip Generation (J) Same as LUC 220 (R) Same as LUC 820 (<50k) (C) Florida Studies Database (K) Florida Schedules (S) FL Curve (D) Blend ITE 10th & FL Studies (L) Same as LUC 240 (T) Same as LUC 942 (Auto Care Center) (E) Blend ITE 6th & FL Studies (M) Same as LUC 210 (U) Same as LUC 820 (50k 200k) (F) ITE Regression Analysis (N) Same as LUC 710 (V) n/a (G) ITE 10th equation (O) Model Based Trip Length (W) Same as LUC 492 (Health Club) (H) Previous Pasco MMTIF Study (P) Same as LUC 630 (Clinic) (X) Same as LUC 595 (DayCare) F:\WEO PE\Projects\ AECOM Pasco Mobilty 2017\3. Analysis\ Schedule Spreadsheets\[Mobility Schedules 2018 v6.xlsm]urban Transit Bike/Ped 2014 Mobility Percent change from 2014 to 2018 Net Mobility 4-11
36 County wide Parameters: Pasco County Land Use Code ITE LUC Table 4 6 Suburban Standard Schedule ( District B) Revenue period: 25 P4P Equivalent Pennies: 6.7 Include carrying cost?: No TOD Deduction: 0.00% Discount Rate: 3.30% 2nd LOFT County pennies to capacity: 5 Include Interstates?: Yes TND Deduction: 0.00% Fuel efficiency: Existing State pennies to capacity: MUTRM Deduction: 0.00% Days/yr: 365 Tax Inc Fin Millage Rate to capacity: Factor to convert VMT to PMT: 1.42 Existing County pennies to capital: 0 Toll.fwy discount: 1.7% Land Use Unit Trip Rate (veh trips) TGR Standard Trip Length TL Market Area Trip Length Adjustment Factor Chargeable Trip length (mi) Trip length for revenue (mi) % New Trips % NT Gross assessable pmt/day Weighted Capacity Addition Ratio Needed PMC Needed PMC After Fwy/Toll/ TOD/TND/ MUTRM Deduct Weighted Cost/PMC Impact Cost PV County Gas Tax ($$/yr): PV P4P Equivalent PV Federal/ State Gas Tax Revenue ($$/yr) PV Sub Countywide selfcredits: PV Tax Before Increment % Self RESIDENTIAL: Single Family (Detached) 210.1P Less than 1,500 s.f. & Annual Hh Income less than 80% SHIP Definition (2) du 4.10 A 7.61 C % V $388 $8,442 $ $ $1, $2,145 $382 $5,916 17% $1,032 $4,884 $6,355 $4,687 $4,014 $673 $85 $112 $4,884 0% 210.2P to 1,500 s.f. du 6.25 A 7.61 C % V $388 $12,869 $ $ $2, $3,269 $382 $9,219 33% $3,078 $6,141 $9,887 $5,893 $5,047 $846 $107 $141 $6,141 0% 210.3P ,501 to 2,499 s.f. du 7.81 A 7.61 C % V $388 $16,081 $ $ $2, $4,085 $382 $11,615 26% $3,045 $8,570 $12,450 $8,223 $7,043 $1,180 $150 $197 $8,570 0% 210.4P ,500 s.f. and greater du 9.20 A 7.61 C % V $388 $18,943 $ $ $3, $4,812 $382 $13,750 32% $4,438 $9,312 $14,734 $8,935 $7,652 $1,283 $163 $214 $9,312 0% 210.5P "Low Income" SHIP defined Multi Family (2) du 3.46 A 5.87 C % V $390 $5,514 $ $ $1, $1,421 $250 $3,843 18% $683 $3,160 $4,129 $3,032 $2,597 $435 $55 $73 $3,160 0% Multi Family Apartments du 6.60 B 5.87 C % V $390 $10,518 $ $ $1, $2,712 $743 $7,064 17% $1,219 $5,845 $7,610 $5,609 $4,805 $804 $102 $134 $5,845 0% Low Rise Condominium/Townhouse (1 to 2 stories) du 6.40 H 5.87 J % V $390 $10,199 $ $ $1, $2,629 $615 $6,955 15% $1,065 $5,890 $7,485 $5,652 $4,842 $810 $103 $135 $5,890 0% High Rise Condominium (3 or more stories) du 4.18 H 5.87 J % V $390 $6,661 $ $ $1, $1,717 $1,003 $3,941 15% $605 $3,336 $4,288 $3,200 $2,741 $459 $59 $77 $4,011 17% Mobile Home Park du 4.17 C 5.29 C % V $390 $5,995 $ $ $1, $1,557 $148 $4,290 24% $1,033 $3,257 $4,601 $3,125 $2,677 $448 $57 $75 $3,257 0% Age Restricted Single Family (3) du 3.62 D 6.23 C % V $389 $6,117 $ $ $1, $1,571 $698 $3,848 26% $997 $2,851 $4,166 $2,735 $2,343 $392 $50 $66 $2,851 0% Age Restricted Multi Family (3) du 3.45 D 3.77 C % V $391 $3,548 $ $ $ $950 $743 $1,856 21% $384 $1,472 $2,040 $1,412 $1,210 $202 $26 $34 $1,472 0% Congregate Care Facility (Attached) (3) du 2.02 B 3.54 C % C $391 $1,405 $47.54 $63.61 $ $379 $128 $898 9% $77 $821 $971 $787 $674 $113 $15 $19 $821 0% LODGING: Hotel room 8.36 D 7.20 C % C $389 $10,703 $ $ $1, $2,727 $248 $7, % $7,728 $0 $8,285 $0 $0 $0 $0 $0 $0 0% Motel room 3.35 D 4.99 C % C $390 $3,485 $ $ $ $909 $149 $2, % $2,427 $0 $2,608 $0 $0 $0 $0 $0 $0 0% Resort Hotel room 5.83 H 7.02 C % C $389 $9,159 $ $ $1, $2,336 $248 $6, % $6,576 $0 $7,052 $0 $0 $0 $0 $0 $0 0% RECREATION: General Recreation acre 2.28 H 5.37 K % K $390 $2,980 $97.00 $ $ $773 $111 $2,095 58% $1,207 $888 $2,250 $852 $730 $122 $16 $20 $888 0% RV Park RV space 1.62 H 4.83 L % L $390 $2,118 $69.54 $93.06 $ $554 $148 $1,416 32% $456 $960 $1,526 $921 $789 $132 $17 $22 $960 0% Marina berth 2.41 B 6.95 M % K $389 $4,065 $ $ $ $1,037 $124 $2,903 43% $1,262 $1,641 $3,114 $1,574 $1,348 $226 $29 $38 $1,641 0% Golf Course hole B 6.95 M % K $389 $51,239 $1, $2, $9, $13,076 $357 $37,805 47% $17,650 $20,155 $40,468 $19,340 $16,565 $2,775 $351 $464 $20,155 0% Miniature Golf Course hole 3.30 H 6.95 M % K $389 $5,566 $ $ $1, $1,420 $64 $4,082 64% $2,607 $1,475 $4,371 $1,415 $1,212 $203 $26 $34 $1,475 0% Bowling Alley 1,000 sf H 5.41 N % K $390 $43,883 $1, $1, $8, $11,382 $188 $32,314 59% $19,025 $13,289 $34,594 $12,751 $10,923 $1,828 $232 $306 $13,289 0% Movie Theater screen H 2.33 C % C $394 $59,709 $2, $2, $12, $17,056 $1,067 $41,586 58% $24,323 $17,263 $44,688 $16,565 $14,203 $2,362 $301 $397 $17,263 0% Racquet Club/Health Club/Spa/Dance Studio 1,000 sf H 5.41 N % W $390 $19,293 $ $ $3, $5,004 $188 $14,101 59% $8,285 $5,816 $15,104 $5,580 $4,780 $800 $102 $134 $5,816 0% Community Center/Gymnasium 1,000 sf B 7.06 K % K $389 $49,338 $1, $2, $8, $12,588 $188 $36,561 67% $24,608 $11,953 $39,125 $11,470 $9,824 $1,646 $208 $275 $11,953 0% 496P n/a Ice Skating Arena 1,000 sf 9.95 H 9.21 H % K $355 $20,321 $ $ $3, $5,582 $188 $14,551 92% $13,341 $1,210 $15,607 $1,160 $994 $166 $22 $28 new n/a INSTITUTIONS: Elementary School student 1.89 B 4.52 O % K $391 $1,655 $55.27 $73.96 $ $441 $11 $1,203 38% $463 $740 $1,289 $710 $608 $102 $13 $17 $740 0% Middle School student 2.13 B 4.52 O % K $391 $2,099 $70.07 $93.77 $ $559 $13 $1,527 31% $473 $1,054 $1,636 $1,011 $866 $145 $19 $24 $1,054 0% High School student 2.03 B 4.52 O % K $391 $2,000 $66.78 $89.37 $ $532 $14 $1,454 23% $341 $1,113 $1,558 $1,067 $914 $153 $20 $26 $1,113 0% University/Jr College (7,500 or fewer students) (Private) student 1.74 B 6.95 M % K $389 $2,625 $84.64 $ $ $675 $15 $1,935 0% $8 $1,927 $2,072 $1,849 $1,584 $265 $34 $44 $2,031 5% University/Jr College (more than 7,500 students) (Private) student 1.21 B 6.95 M % K $389 $1,827 $58.90 $78.82 $ $470 $15 $1,342 0% $5 $1,337 $1,437 $1,282 $1,098 $184 $24 $31 $1,518 12% Church 1,000 sf 6.95 B 4.10 K % K $391 $6,220 $ $ $1, $1,672 $0 $4,548 0% $20 $4,528 $4,871 $4,345 $3,723 $622 $79 $104 $5,152 12% Day Care student 4.09 B 2.13 C % C $395 $1,557 $57.82 $77.37 $ $461 $10 $1,086 52% $564 $522 $1,166 $500 $429 $71 $10 $12 $522 0% Cemetery acre 6.02 B 6.95 M % H $389 $9,584 $ $ $1, $2,463 $357 $6,763 24% $1,649 $5,114 $7,261 $4,907 $4,203 $704 $89 $118 $5,114 0% Hospital 1,000 sf B 6.95 M % K $389 $13,833 $ $ $2, $3,555 $266 $10,011 0% $25 $9,986 $10,730 $9,582 $8,207 $1,374 $174 $230 $11,407 12% Nursing Home bed 3.06 B 2.72 C % C $394 $1,808 $64.29 $86.04 $ $513 $128 $1,167 22% $261 $906 $1,261 $869 $745 $124 $16 $21 $906 0% OFFICE: General Office 50,000 sf or less (4) 1,000 sf G 5.41 C % C $390 $13,042 $ $ $2, $3,413 $571 $9, % $9,058 $0 $9,736 $0 $0 $0 $0 $0 $0 0% 710.1P General Office 50, ,000 sf (4) 1,000 sf G 5.41 C % C $390 $12,774 $ $ $2, $3,343 $662 $8, % $8,769 $0 $9,433 $0 $0 $0 $0 $0 $0 0% 710.2P General Office 100, ,000 sf (4) 1,000 sf G 5.41 C % C $390 $12,511 $ $ $2, $3,274 $662 $8, % $8,575 $0 $9,225 $0 $0 $0 $0 $0 $0 0% 710.3P General Office 200, ,000 sf (4) 1,000 sf G 5.41 C % C $390 $12,254 $ $ $2, $3,207 $662 $8, % $8,385 $0 $9,022 $0 $0 $0 $0 $0 $0 0% 710.4P General Office greater than 400,000 sf (5) 1,000 sf 9.97 G 5.41 C % C $390 $12,001 $ $ $2, $3,141 $662 $8, % $8,199 $0 $8,823 $0 $0 $0 $0 $0 $0 0% Corporate Headquarters Building 1,000 sf 7.95 H 5.41 N % N $390 $9,571 $ $ $1, $2,505 $662 $6, % $6,405 $0 $6,902 $0 $0 $0 $0 $0 $0 0% Medical Office 1,000 sf B 5.83 C % C $390 $43,626 $1, $1, $8, $11,352 $662 $31, % $31,612 $0 $33,879 $0 $0 $0 $0 $0 $0 0% Office Park 1,000 sf D 7.47 C % Q $389 $18,740 $ $ $3, $4,796 $662 $13, % $13,282 $0 $14,256 $0 $0 $0 $0 $0 $0 0% Research and Development Center 1,000 sf D 5.65 Q % Q $390 $13,680 $ $ $2, $3,570 $662 $9, % $9,448 $0 $10,159 $0 $0 $0 $0 $0 $0 0% 770.P 640 Veterinarian Clinic 1,000 sf B 5.36 P % P $390 $25,923 $ $1, $4, $6,790 $571 $18, % $18,562 $0 $19,909 $0 $0 $0 $0 $0 $0 0% $$ Allocated for Net Mobility Full (1) (Incl Int) Interstate/ SIS (Excl Int) Transit Bike/Ped 2014 Mobility Percent change from 2014 to 2018 Net Mobility 4-12
37 County wide Parameters: Pasco County Land Use Code ITE LUC Table 4 6 (continued) Suburban Standard Schedule ( District B) Revenue period: 25 P4P Equivalent Pennies: 6.7 Include carrying cost?: No TOD Deduction: 0.00% Discount Rate: 3.30% 2nd LOFT County pennies to capacity: 5 Include Interstates?: Yes TND Deduction: 0.00% Fuel efficiency: Existing State pennies to capacity: MUTRM Deduction: 0.00% Days/yr: 365 Tax Inc Fin Millage Rate to capacity: Factor to convert VMT to PMT: 1.42 Existing County pennies to capital: 0 Toll.fwy discount: 1.7% Land Use Unit Trip Rate (veh trips) TGR Standard Trip Length TL Market Area Trip Length Adjustment Factor Chargeable Trip length (mi) Trip length for revenue (mi) % New Trips % NT Gross assessable pmt/day Weighted Capacity Addition Ratio Needed PMC Needed PMC After Fwy/Toll/ TOD/TND/ MUTRM Deduct Weighted Cost/PMC Impact Cost PV County Gas Tax ($$/yr): PV P4P Equivalent PV Federal/ State Gas Tax Revenue ($$/yr) PV Sub Countywide selfcredits: PV Tax Before Increment % Self RETAIL: Mini Warehouse 1,000 sf 1.51 B 3.26 K % N $393 $1,040 $36.36 $48.66 $ $290 $98 $652 18% $119 $533 $706 $511 $438 $73 $10 $12 $533 0% Hardware/Paint 1,000 sf 9.14 B 1.96 R % R $395 $2,317 $88.80 $ $ $708 $405 $1,205 45% $547 $658 $1,325 $631 $541 $90 $12 $15 $4,602 86% Retail 50,000 sfgla or less (4) 1,000 sfgla G 1.96 S % S $395 $19,028 $ $ $4, $5,813 $405 $12,810 39% $4,988 $7,822 $13,799 $7,505 $6,437 $1,068 $137 $180 $7,822 0% 820.1P Retail 50, ,000 sfgla (4) 1,000 sfgla G 2.52 S % S $394 $18,725 $ $ $3, $5,441 $426 $12,859 45% $5,808 $7,051 $13,832 $6,766 $5,801 $965 $123 $162 $7,051 0% 820.2P Retail 200, ,000 sfgla (4) 1,000 sfgla G 2.77 S % S $394 $17,965 $ $ $3, $5,130 $426 $12,410 46% $5,716 $6,694 $13,343 $6,423 $5,507 $916 $117 $154 $6,694 0% 820.3P Retail 400, ,000 sfgla (4) 1,000 sfgla G 3.01 S % S $393 $17,808 $ $ $3, $5,025 $1,282 $11,500 45% $5,181 $6,319 $12,426 $6,064 $5,198 $866 $110 $145 $6,319 0% 820.4P Retail 600, ,000 sfgla (4) 1,000 sfgla G 3.26 S % S $393 $18,285 $ $ $3, $5,094 $1,282 $11,908 45% $5,354 $6,554 $12,858 $6,288 $5,390 $898 $115 $151 $6,554 0% 820.5P Retail greater than 800,000 sfgla (5) 1,000 sfgla G 3.51 S % S $393 $17,499 $ $ $3, $4,822 $1,282 $11,395 40% $4,535 $6,860 $12,304 $6,582 $5,642 $940 $120 $158 $6,860 0% Specialty Retail 1,000 sf H 3.54 C % C $393 $34,556 $1, $1, $6, $9,510 $405 $24,641 48% $11,901 $12,740 $26,437 $12,225 $10,479 $1,746 $222 $293 $12,740 0% 830.P n/a Non Veterinary Kennel 1,000 sf Y 2.13 C % C $395 $15,710 $ $ $3, $4,652 $405 $10,653 44% $4,700 $5,953 $11,470 $5,712 $4,899 $813 $104 $137 new n/a New/Used Auto Sales 1,000 sf B 4.83 C % C $391 $24,281 $ $1, $4, $6,458 $276 $17,547 44% $7,793 $9,754 $18,809 $9,360 $8,020 $1,340 $170 $224 $9,754 0% Tire Store 1,000 sf B 3.80 T % T $392 $17,891 $ $ $3, $4,885 $405 $12,601 54% $6,841 $5,760 $13,531 $5,527 $4,737 $790 $101 $132 $5,760 0% Supermarket 1,000 sf B 2.18 C % C $395 $30,111 $1, $1, $6, $8,982 $243 $20,886 50% $10,447 $10,439 $22,450 $10,017 $8,592 $1,425 $182 $240 $10,439 0% Convenience Store w/gas Pumps 1,000 sf D 1.59 C % C $397 $65,227 $2, $3, $14, $20,916 $101 $44,209 46% $20,185 $24,024 $47,599 $23,052 $19,783 $3,269 $419 $553 $24,024 0% Home Improvement Superstore 1,000 sf B 2.52 U % U $394 $11,952 $ $ $2, $3,473 $426 $8,054 51% $4,125 $3,929 $8,675 $3,770 $3,232 $538 $69 $90 $3,929 0% Pharmacy/Drug Store with and without Drive Thru 1,000 sf D 2.18 C % C $395 $16,138 $ $ $3, $4,814 $405 $10,919 50% $5,413 $5,506 $11,758 $5,283 $4,531 $752 $96 $127 $5,506 0% Furniture Store 1,000 sf 6.30 B 6.39 C % C $390 $4,957 $ $ $ $1,286 $405 $3,266 55% $1,791 $1,475 $3,523 $1,415 $1,212 $203 $26 $34 $1,475 0% Bank/Savings w/drive In 1,000 sf D 2.58 C % C $394 $27,338 $ $1, $5, $7,908 $576 $18,855 24% $4,471 $14,384 $20,275 $13,802 $11,834 $1,968 $251 $331 $14,384 0% 929P n/a Breakfast and Lunch Restaurant 1,000 sf Y 3.33 C % C $393 $40,193 $1, $1, $7, $11,162 $462 $28,569 44% $12,599 $15,970 $30,658 $15,325 $13,137 $2,188 $278 $367 new n/a Fast Casual Restaurant 1,000 sf Y 3.33 C % C $393 $97,648 $3, $4, $19, $27,117 $462 $70,069 44% $30,900 $39,169 $75,143 $37,586 $32,219 $5,367 $682 $901 new n/a Quality Restaurant 1,000 sf D 3.30 C % C $393 $51,025 $1, $2, $10, $14,189 $462 $36,374 46% $16,788 $19,586 $39,025 $18,795 $16,111 $2,684 $341 $450 $19,586 0% High Turnover Restaurant 1,000 sf D 3.33 C % C $393 $60,170 $2, $2, $11, $16,709 $462 $42,999 44% $18,945 $24,054 $46,125 $23,082 $19,786 $3,296 $419 $553 $24,054 0% Fast Food Restaurant w/drive Thru 1,000 sf D 2.15 C % C $395 $142,180 $5, $7, $30, $42,539 $1,263 $98,379 53% $51,667 $46,712 $105,767 $44,825 $38,447 $6,378 $813 $1,074 $46,712 0% Quick Lube bays B 3.80 T % T $392 $25,092 $ $1, $4, $6,851 $138 $18,104 49% $8,798 $9,306 $19,407 $8,930 $7,653 $1,277 $162 $214 $9,306 0% Auto Repair or Body Shop 1,000 sf H 3.80 T % T $392 $19,716 $ $ $3, $5,383 $276 $14,057 44% $6,123 $7,934 $15,082 $7,613 $6,525 $1,088 $139 $182 $7,934 0% Gasoline Station fuel pos B 2.00 C % C $395 $18,277 $ $ $3, $5,557 $25 $12,695 54% $6,867 $5,828 $13,644 $5,592 $4,796 $796 $102 $134 $5,828 0% Self Service Car Wash bays D 2.29 C % C $395 $15,805 $ $ $3, $4,666 $10 $11,129 5% $592 $10,537 $11,950 $10,111 $8,672 $1,439 $184 $242 $10,537 0% 913.P 913 Convenience/Gasoline/Fast Food Store 1,000 sf D 2.78 C % C $394 $201,702 $7, $9, $40, $57,556 $101 $144,044 56% $80,115 $63,929 $154,525 $61,346 $52,599 $8,747 $1,113 $1,470 $63,929 0% INDUSTRIAL: General Light Industrial 1,000 sf 4.96 B 5.41 N % N $390 $6,193 $ $ $1, $1,615 $210 $4, % $4,368 $0 $4,689 $0 $0 $0 $0 $0 $0 0% General Heavy Industrial 1,000 sf 1.50 B 5.41 N % N $390 $1,873 $61.27 $81.99 $ $488 $210 $1, % $1,174 $0 $1,271 $0 $0 $0 $0 $0 $0 0% Industrial Park 1,000 sf 3.37 B 5.41 N % N $390 $4,208 $ $ $ $1,097 $210 $2, % $2,900 $0 $3,119 $0 $0 $0 $0 $0 $0 0% Manufacturing 1,000 sf 3.93 B 5.41 N % N $390 $4,907 $ $ $ $1,280 $210 $3, % $3,417 $0 $3,672 $0 $0 $0 $0 $0 $0 0% Passive Warehouse (Storage Warehouse) 1,000 sf 1.74 B 5.41 N % N $390 $2,173 $71.07 $95.11 $ $567 $236 $1, % $1,370 $0 $1,483 $0 $0 $0 $0 $0 new n/a /156 Active Warehouse (Fulfillment Center/Parcel Hub) 1,000 sf 7.97 B 6.95 M % N $389 $12,736 $ $ $2, $3,265 $236 $9, % $9,236 $0 $9,897 $0 $0 $0 $0 $0 new n/a 160.P 153 Airport Hangar 1,000 sf 3.56 H 5.41 N % N $390 $4,445 $ $ $ $1,159 $210 $3, % $3,075 $0 $3,306 $0 $0 $0 $0 $0 $0 0% OTHER: n/a n/a Mining 1,000 cy 0.01 H I % I $387 $71 $0.13 $1.56 $14.28 $16 $3 $52 9% $5 $47 $55 $45 $39 $6 $1 $1 $47 0% $$ Allocated for Net Mobility Full (1) Notes: (1) This value is the total value of transportation system consumed, less credits for revenues committed to transportation system expansion that are generated by the use itself. This value includes Interstate costs and "carrying costs", but not toll road costs. It does consider the proportion of trip length, varying system costs, and transportation system performance goals that vary by fee district. (2) Specific calculations for the "low income" category can be seen in Appendix B of the 2014 Mobility Update Study. (3) The statistical relationship between the trip generation rate for the age restricted single family, age restricted multi family, and congregate care facility was used to interpolate the trip length. (4) The trip generation rate recommended for the office and retail size categories used the end point of the range due to the nature of the ITE equation to be conservative for smaller developments. (5) The trip generation rate used for the office and retail open ended size categories used the size 200,000 s.f. larger than the beginning of the size range, as the size ranges increase in 200,000 s.f. increments. s of trip rate, percent new trips, and trip length are as follows: (A) National studies (NHTS, AHS, Census) (I) Independent Study (Collier County) (Q) Same as LUC 770 (Business Park) (Y) Other National Studies (B) ITE 10th Edition Trip Generation (J) Same as LUC 220 (R) Same as LUC 820 (<50k) (C) Florida Studies Database (K) Florida Schedules (S) FL Curve (D) Blend ITE 10th & FL Studies (L) Same as LUC 240 (T) Same as LUC 942 (Auto Care Center) (E) Blend ITE 6th & FL Studies (M) Same as LUC 210 (U) Same as LUC 820 (50k 200k) (F) ITE Regression Analysis (N) Same as LUC 710 (V) n/a (G) ITE 10th equation (O) Model Based Trip Length (W) Same as LUC 492 (Health Club) (H) Previous Pasco MMTIF Study (P) Same as LUC 630 (Clinic) (X) Same as LUC 595 (DayCare) F:\WEO PE\Projects\ AECOM Pasco Mobilty 2017\3. Analysis\ Schedule Spreadsheets\[Mobility Schedules 2018 v6.xlsm]urban (Incl Int) Interstate/ SIS (Excl Int) Transit Bike/Ped 2014 Mobility Percent change from 2014 to 2018 Net Mobility 4-13
38 County wide Parameters: Pasco County Land Use Code ITE LUC Table 4 7 Suburban Mixed Use Trip Reduction Measures Schedule ( District B) Revenue period: 25 P4P Equivalent Pennies: 6.7 Include carrying cost?: No TOD Deduction: 0.00% Discount Rate: 3.30% 2nd LOFT County pennies to capacity: 5 Include Interstates?: Yes TND Deduction: 0.00% Fuel efficiency: Existing State pennies to capacity: MUTRM Deduction: 8.02% Days/yr: 365 Tax Inc Fin Millage Rate to capacity: Factor to convert VMT to PMT: 1.42 Existing County pennies to capital: 0 Toll.fwy discount: 1.7% Land Use Unit Trip Rate (veh trips) TGR Standard Trip Length TL Market Area Trip Length Adjustment Factor Chargeable Trip length (mi) Trip length for revenue (mi) % New Trips % NT Gross assessable pmt/day Weighted Capacity Addition Ratio Needed PMC Needed PMC After Fwy/Toll/ TOD/TND/ MUTRM Deduct Weighted Cost/PMC Impact Cost PV County Gas Tax ($$/yr): PV P4P Equivalent PV Federal/ State Gas Tax Revenue ($$/yr) PV Sub Countywide selfcredits: PV Tax Before Increment % Self RESIDENTIAL: Single Family (Detached) 210.1P Less than 1,500 s.f. & Annual Hh Income less than 80% SHIP Definition (2) du 4.10 A 7.61 C % V $388 $7,765 $ $ $1, $1,973 $382 $5,411 54% $2,925 $2,486 $5,815 $2,385 $2,043 $342 $44 $57 $2,486 0% 210.2P to 1,500 s.f. du 6.25 A 7.61 C % V $388 $11,837 $ $ $2, $3,007 $382 $8,449 63% $5,319 $3,130 $9,064 $3,003 $2,572 $431 $55 $72 $3,130 0% 210.3P ,501 to 2,499 s.f. du 7.81 A 7.61 C % V $388 $14,792 $ $ $2, $3,757 $382 $10,653 59% $6,277 $4,376 $11,421 $4,198 $3,595 $603 $77 $101 $4,376 0% 210.4P ,500 s.f. and greater du 9.20 A 7.61 C % V $388 $17,424 $ $ $3, $4,426 $382 $12,616 62% $7,869 $4,747 $13,522 $4,555 $3,901 $654 $83 $109 $4,747 0% 210.5P "Low Income" SHIP defined Multi Family (2) du 3.46 A 5.87 C % V $390 $5,072 $ $ $ $1,307 $250 $3,515 54% $1,909 $1,606 $3,778 $1,541 $1,320 $221 $28 $37 $1,606 0% Multi Family Apartments du 6.60 B 5.87 C % V $390 $9,675 $ $ $1, $2,494 $743 $6,438 54% $3,460 $2,978 $6,941 $2,858 $2,448 $410 $52 $68 $2,978 0% Low Rise Condominium/Townhouse (1 to 2 stories) du 6.40 H 5.87 J % V $390 $9,381 $ $ $1, $2,418 $615 $6,348 53% $3,341 $3,007 $6,836 $2,885 $2,471 $414 $53 $69 $3,007 0% High Rise Condominium (3 or more stories) du 4.18 H 5.87 J % V $390 $6,127 $ $ $1, $1,580 $1,003 $3,545 50% $1,776 $1,769 $3,863 $1,697 $1,454 $243 $31 $41 $2,162 18% Mobile Home Park du 4.17 C 5.29 C % V $390 $5,514 $ $ $1, $1,432 $148 $3,934 58% $2,279 $1,655 $4,220 $1,588 $1,360 $228 $29 $38 $1,655 0% Age Restricted Single Family (3) du 3.62 D 6.23 C % V $389 $5,626 $ $ $1, $1,445 $698 $3,484 59% $2,041 $1,443 $3,776 $1,384 $1,185 $199 $26 $33 $1,443 0% Age Restricted Multi Family (3) du 3.45 D 3.77 C % V $391 $3,264 $ $ $ $874 $743 $1,647 68% $1,115 $532 $1,817 $510 $437 $73 $10 $12 $738 28% Congregate Care Facility (Attached) (3) du 2.02 B 3.54 C % C $391 $1,292 $43.72 $58.51 $ $349 $128 $816 59% $480 $336 $883 $322 $276 $46 $6 $8 $410 18% LODGING: Hotel room 8.36 D 7.20 C % C $389 $9,845 $ $ $1, $2,509 $248 $7, % $7,089 $0 $7,600 $0 $0 $0 $0 $0 $0 0% Motel room 3.35 D 4.99 C % C $390 $3,205 $ $ $ $836 $149 $2, % $2,220 $0 $2,387 $0 $0 $0 $0 $0 $0 0% Resort Hotel room 5.83 H 7.02 C % C $389 $8,425 $ $ $1, $2,149 $248 $6, % $6,029 $0 $6,467 $0 $0 $0 $0 $0 $0 0% RECREATION: General Recreation acre 2.28 H 5.37 K % K $390 $2,741 $89.22 $ $ $711 $111 $1,918 75% $1,433 $485 $2,061 $465 $398 $67 $9 $11 $485 0% RV Park RV space 1.62 H 4.83 L % L $390 $1,948 $63.96 $85.59 $ $510 $148 $1,290 58% $742 $548 $1,392 $525 $450 $75 $10 $13 $548 0% Marina berth 2.41 B 6.95 M % K $389 $3,739 $ $ $ $954 $124 $2,660 65% $1,722 $938 $2,855 $899 $770 $129 $17 $22 $938 0% Golf Course hole B 6.95 M % K $389 $47,130 $1, $2, $8, $12,028 $357 $34,745 67% $23,157 $11,588 $37,194 $11,119 $9,524 $1,595 $202 $267 $11,588 0% Miniature Golf Course hole 3.30 H 6.95 M % K $389 $5,119 $ $ $ $1,306 $64 $3,749 78% $2,909 $840 $4,015 $806 $690 $116 $15 $19 $840 0% Bowling Alley 1,000 sf H 5.41 N % K $390 $40,364 $1, $1, $7, $10,469 $188 $29,707 74% $22,097 $7,610 $31,804 $7,302 $6,255 $1,047 $133 $175 $7,610 0% Movie Theater screen H 2.33 C % C $394 $54,920 $1, $2, $11, $15,689 $1,067 $38,165 75% $28,532 $9,633 $41,019 $9,243 $7,925 $1,318 $168 $222 $9,633 0% Racquet Club/Health Club/Spa/Dance Studio 1,000 sf H 5.41 N % W $390 $17,746 $ $ $3, $4,603 $188 $12,955 74% $9,638 $3,317 $13,877 $3,183 $2,727 $456 $58 $76 $3,317 0% Community Center/Gymnasium 1,000 sf B 7.06 K % K $389 $45,381 $1, $1, $8, $11,578 $188 $33,614 80% $26,755 $6,859 $35,972 $6,581 $5,637 $944 $120 $158 $6,859 0% 496P n/a Ice Skating Arena 1,000 sf 9.95 H 9.21 H % K $355 $18,691 $ $ $3, $5,134 $188 $13,369 96% $12,772 $597 $14,340 $572 $490 $82 $11 $14 new n/a INSTITUTIONS: Elementary School student 1.89 B 4.52 O % K $391 $1,522 $50.84 $68.03 $ $405 $11 $1,106 70% $775 $331 $1,185 $317 $272 $45 $6 $8 $331 0% Middle School student 2.13 B 4.52 O % K $391 $1,930 $64.45 $86.25 $ $514 $13 $1,403 66% $932 $471 $1,504 $451 $386 $65 $9 $11 $471 0% High School student 2.03 B 4.52 O % K $391 $1,840 $61.43 $82.20 $ $490 $14 $1,336 63% $838 $498 $1,432 $478 $410 $68 $9 $11 $498 0% University/Jr College (7,500 or fewer students) (Private) student 1.74 B 6.95 M % K $389 $2,415 $77.85 $ $ $621 $15 $1,779 46% $817 $962 $1,904 $923 $791 $132 $17 $22 $962 0% University/Jr College (more than 7,500 students) (Private) student 1.21 B 6.95 M % K $389 $1,680 $54.18 $72.50 $ $432 $15 $1,233 42% $514 $719 $1,321 $689 $590 $99 $13 $17 $719 0% Church 1,000 sf 6.95 B 4.10 K % K $391 $5,721 $ $ $1, $1,538 $0 $4,183 46% $1,916 $2,267 $4,480 $2,175 $1,864 $311 $40 $52 $2,267 0% Day Care student 4.09 B 2.13 C % C $395 $1,432 $53.18 $71.16 $ $424 $10 $998 80% $795 $203 $1,072 $194 $166 $28 $4 $5 $203 0% Cemetery acre 6.02 B 6.95 M % H $389 $8,815 $ $ $1, $2,266 $357 $6,192 61% $3,771 $2,421 $6,650 $2,322 $1,989 $333 $43 $56 $2,421 0% Hospital 1,000 sf B 6.95 M % K $389 $12,724 $ $ $2, $3,270 $266 $9,187 32% $2,899 $6,288 $9,848 $6,033 $5,168 $865 $110 $145 $6,770 7% Nursing Home bed 3.06 B 2.72 C % C $394 $1,663 $59.14 $79.14 $ $471 $128 $1,063 62% $664 $399 $1,150 $383 $328 $55 $7 $9 $399 0% OFFICE: General Office 50,000 sf or less (4) 1,000 sf G 5.41 C % C $390 $11,996 $ $ $2, $3,139 $571 $8, % $8,286 $0 $8,909 $0 $0 $0 $0 $0 $0 0% 710.1P General Office 50, ,000 sf (4) 1,000 sf G 5.41 C % C $390 $11,749 $ $ $2, $3,075 $662 $8, % $8,013 $0 $8,623 $0 $0 $0 $0 $0 $0 0% 710.2P General Office 100, ,000 sf (4) 1,000 sf G 5.41 C % C $390 $11,508 $ $ $2, $3,011 $662 $7, % $7,834 $0 $8,432 $0 $0 $0 $0 $0 $0 0% 710.3P General Office 200, ,000 sf (4) 1,000 sf G 5.41 C % C $390 $11,271 $ $ $2, $2,949 $662 $7, % $7,660 $0 $8,245 $0 $0 $0 $0 $0 $0 0% 710.4P General Office greater than 400,000 sf (5) 1,000 sf 9.97 G 5.41 C % C $390 $11,039 $ $ $2, $2,889 $662 $7, % $7,488 $0 $8,062 $0 $0 $0 $0 $0 $0 0% Corporate Headquarters Building 1,000 sf 7.95 H 5.41 N % N $390 $8,803 $ $ $1, $2,304 $662 $5, % $5,838 $0 $6,295 $0 $0 $0 $0 $0 $0 0% Medical Office 1,000 sf B 5.83 C % C $390 $40,127 $1, $1, $7, $10,441 $662 $29, % $29,024 $0 $31,109 $0 $0 $0 $0 $0 $0 0% Office Park 1,000 sf D 7.47 C % Q $389 $17,237 $ $ $3, $4,411 $662 $12, % $12,164 $0 $13,059 $0 $0 $0 $0 $0 $0 0% Research and Development Center 1,000 sf D 5.65 Q % Q $390 $12,583 $ $ $2, $3,283 $662 $8, % $8,638 $0 $9,291 $0 $0 $0 $0 $0 $0 0% 770.P 640 Veterinarian Clinic 1,000 sf B 5.36 P % P $390 $23,844 $ $1, $4, $6,245 $571 $17, % $17,028 $0 $18,267 $0 $0 $0 $0 $0 $0 0% $$ Allocated for Net Mobility Full (1) (Incl Int) Interstate/ SIS (Excl Int) Transit Bike/Ped 2014 Mobility Percent change from 2014 to 2018 Net Mobility 4-14
39 County wide Parameters: Pasco County Land Use Code ITE LUC Table 4 7 (continued) Suburban Mixed Use Trip Reduction Measures Schedule ( District B) Revenue period: 25 P4P Equivalent Pennies: 6.7 Include carrying cost?: No TOD Deduction: 0.00% Discount Rate: 3.30% 2nd LOFT County pennies to capacity: 5 Include Interstates?: Yes TND Deduction: 0.00% Fuel efficiency: Existing State pennies to capacity: MUTRM Deduction: 8.02% Days/yr: 365 Tax Inc Fin Millage Rate to capacity: Factor to convert VMT to PMT: 1.42 Existing County pennies to capital: 0 Toll.fwy discount: 1.7% Land Use Unit Trip Rate (veh trips) TGR Standard Trip Length TL Market Area Trip Length Adjustment Factor Chargeable Trip length (mi) Trip length for revenue (mi) % New Trips % NT Gross assessable pmt/day Weighted Capacity Addition Ratio Needed PMC Needed PMC After Fwy/Toll/ TOD/TND/ MUTRM Deduct Weighted Cost/PMC Impact Cost PV County Gas Tax ($$/yr): PV P4P Equivalent PV Federal/ State Gas Tax Revenue ($$/yr) PV Sub Countywide selfcredits: PV Tax Before Increment % Self RETAIL: Mini Warehouse 1,000 sf 1.51 B 3.26 K % N $393 $957 $33.44 $44.75 $ $267 $98 $592 48% $284 $308 $642 $295 $253 $42 $6 $7 $308 0% Hardware/Paint 1,000 sf 9.14 B 1.96 R % R $395 $2,131 $81.68 $ $ $651 $405 $1,075 69% $745 $330 $1,186 $316 $271 $45 $6 $8 $2,735 88% Retail 50,000 sfgla or less (4) 1,000 sfgla G 1.96 S % S $395 $17,502 $ $ $3, $5,347 $405 $11,750 60% $7,063 $4,687 $12,660 $4,497 $3,857 $640 $82 $108 $4,687 0% 820.1P Retail 50, ,000 sfgla (4) 1,000 sfgla G 2.52 S % S $394 $17,223 $ $ $3, $5,004 $426 $11,794 64% $7,563 $4,231 $12,689 $4,060 $3,481 $579 $74 $97 $4,231 0% 820.2P Retail 200, ,000 sfgla (4) 1,000 sfgla G 2.77 S % S $394 $16,524 $ $ $3, $4,718 $426 $11,380 64% $7,330 $4,050 $12,239 $3,886 $3,332 $554 $71 $93 $4,050 0% 820.3P Retail 400, ,000 sfgla (4) 1,000 sfgla G 3.01 S % S $393 $16,380 $ $ $3, $4,622 $1,282 $10,475 64% $6,659 $3,816 $11,326 $3,661 $3,138 $523 $67 $88 $3,816 0% 820.4P Retail 600, ,000 sfgla (4) 1,000 sfgla G 3.26 S % S $393 $16,819 $ $ $3, $4,686 $1,282 $10,850 63% $6,882 $3,968 $11,724 $3,807 $3,263 $544 $70 $91 $3,968 0% 820.5P Retail greater than 800,000 sfgla (5) 1,000 sfgla G 3.51 S % S $393 $16,096 $ $ $3, $4,435 $1,282 $10,378 60% $6,190 $4,188 $11,215 $4,019 $3,445 $574 $73 $96 $4,188 0% Specialty Retail 1,000 sf H 3.54 C % C $393 $31,785 $1, $1, $6, $8,747 $405 $22,633 65% $14,805 $7,828 $24,284 $7,511 $6,438 $1,073 $137 $180 $7,828 0% 830.P n/a Non Veterinary Kennel 1,000 sf Y 2.13 C % C $395 $14,450 $ $ $3, $4,279 $405 $9,766 63% $6,131 $3,635 $10,517 $3,487 $2,991 $496 $64 $84 new n/a New/Used Auto Sales 1,000 sf B 4.83 C % C $391 $22,333 $ $ $4, $5,940 $276 $16,118 62% $10,055 $6,063 $17,278 $5,818 $4,985 $833 $106 $139 $6,063 0% Tire Store 1,000 sf B 3.80 T % T $392 $16,456 $ $ $3, $4,493 $405 $11,558 69% $8,011 $3,547 $12,413 $3,403 $2,916 $487 $62 $82 $3,547 0% Supermarket 1,000 sf B 2.18 C % C $395 $27,697 $1, $1, $5, $8,262 $243 $19,191 67% $12,915 $6,276 $20,630 $6,022 $5,165 $857 $110 $144 $6,276 0% Convenience Store w/gas Pumps 1,000 sf D 1.59 C % C $397 $59,995 $2, $3, $13, $19,239 $101 $40,656 62% $25,404 $15,252 $43,773 $14,635 $12,560 $2,075 $266 $351 $15,252 0% Home Improvement Superstore 1,000 sf B 2.52 U % U $394 $10,993 $ $ $2, $3,194 $426 $7,374 68% $5,026 $2,348 $7,945 $2,253 $1,932 $321 $41 $54 $2,348 0% Pharmacy/Drug Store with and without Drive Thru 1,000 sf D 2.18 C % C $395 $14,844 $ $ $3, $4,428 $405 $10,011 67% $6,720 $3,291 $10,782 $3,157 $2,708 $449 $58 $76 $3,291 0% Furniture Store 1,000 sf 6.30 B 6.39 C % C $390 $4,559 $ $ $ $1,183 $405 $2,971 70% $2,068 $903 $3,208 $866 $742 $124 $16 $21 $903 0% Bank/Savings w/drive In 1,000 sf D 2.58 C % C $394 $25,146 $ $1, $5, $7,274 $576 $17,296 45% $7,748 $9,548 $18,603 $9,161 $7,855 $1,306 $167 $220 $9,548 0% 929P n/a Breakfast and Lunch Restaurant 1,000 sf Y 3.33 C % C $393 $36,970 $1, $1, $7, $10,266 $462 $26,241 63% $16,505 $9,736 $28,162 $9,342 $8,008 $1,334 $170 $224 new n/a Fast Casual Restaurant 1,000 sf Y 3.33 C % C $393 $89,816 $3, $4, $17, $24,942 $462 $64,412 62% $40,203 $24,209 $69,079 $23,230 $19,913 $3,317 $422 $557 new n/a Quality Restaurant 1,000 sf D 3.30 C % C $393 $46,933 $1, $2, $9, $13,051 $462 $33,419 64% $21,411 $12,008 $35,858 $11,523 $9,878 $1,645 $209 $276 $12,008 0% High Turnover Restaurant 1,000 sf D 3.33 C % C $393 $55,345 $1, $2, $10, $15,369 $462 $39,513 63% $24,769 $14,744 $42,389 $14,148 $12,128 $2,020 $257 $339 $14,744 0% Fast Food Restaurant w/drive Thru 1,000 sf D 2.15 C % C $395 $130,777 $4, $6, $27, $39,127 $1,263 $90,387 66% $59,674 $30,713 $97,183 $29,472 $25,279 $4,193 $535 $706 $30,713 0% Quick Lube bays B 3.80 T % T $392 $23,080 $ $1, $4, $6,301 $138 $16,641 65% $10,883 $5,758 $17,840 $5,525 $4,735 $790 $101 $132 $5,758 0% Auto Repair or Body Shop 1,000 sf H 3.80 T % T $392 $18,135 $ $ $3, $4,951 $276 $12,908 62% $8,010 $4,898 $13,850 $4,699 $4,027 $672 $86 $113 $4,898 0% Gasoline Station fuel pos B 2.00 C % C $395 $16,811 $ $ $3, $5,112 $25 $11,674 67% $7,841 $3,833 $12,548 $3,678 $3,155 $523 $67 $88 $3,833 0% Self Service Car Wash bays D 2.29 C % C $395 $14,538 $ $ $3, $4,292 $10 $10,236 44% $4,463 $5,773 $10,991 $5,539 $4,751 $788 $101 $133 $5,773 0% 913.P 913 Convenience/Gasoline/Fast Food Store 1,000 sf D 2.78 C % C $394 $185,525 $6, $8, $37, $52,940 $101 $132,484 68% $89,891 $42,593 $142,124 $40,871 $35,043 $5,828 $742 $980 $42,593 0% INDUSTRIAL: General Light Industrial 1,000 sf 4.96 B 5.41 N % N $390 $5,696 $ $ $1, $1,486 $210 $4, % $4,000 $0 $4,296 $0 $0 $0 $0 $0 $0 0% General Heavy Industrial 1,000 sf 1.50 B 5.41 N % N $390 $1,723 $56.36 $75.42 $ $449 $210 $1, % $1,063 $0 $1,153 $0 $0 $0 $0 $0 $0 0% Industrial Park 1,000 sf 3.37 B 5.41 N % N $390 $3,870 $ $ $ $1,009 $210 $2, % $2,651 $0 $2,852 $0 $0 $0 $0 $0 $0 0% Manufacturing 1,000 sf 3.93 B 5.41 N % N $390 $4,513 $ $ $ $1,177 $210 $3, % $3,126 $0 $3,361 $0 $0 $0 $0 $0 $0 0% Passive Warehouse (Storage Warehouse) 1,000 sf 1.74 B 5.41 N % N $390 $1,998 $65.37 $87.48 $ $521 $236 $1, % $1,242 $0 $1,345 $0 $0 $0 $0 $0 new n/a /156 Active Warehouse (Fulfillment Center/Parcel Hub) 1,000 sf 7.97 B 6.95 M % N $389 $11,715 $ $ $2, $3,003 $236 $8, % $8,476 $0 $9,085 $0 $0 $0 $0 $0 new n/a 160.P 153 Airport Hangar 1,000 sf 3.56 H 5.41 N % N $390 $4,088 $ $ $ $1,066 $210 $2, % $2,812 $0 $3,024 $0 $0 $0 $0 $0 $0 0% $$ Allocated for Net Mobility Full (1) (Incl Int) Interstate/ SIS (Excl Int) ######### $0 #DIV/0! Notes: (1) This value is the total value of transportation system consumed, less credits for revenues committed to transportation system expansion that are generated by the use itself. This value includes Interstate costs and "carrying costs", but not toll road costs. It does consider the proportion of trip length, varying system costs, and transportation system performance goals that vary by fee district. (2) Specific calculations for the "low income" category can be seen in Appendix B of the 2014 Mobility Update Study. (3) The statistical relationship between the trip generation rate for the age restricted single family, age restricted multi family, and congregate care facility was used to interpolate the trip length. (4) The trip generation rate recommended for the office and retail size categories used the end point of the range due to the nature of the ITE equation to be conservative for smaller developments. (5) The trip generation rate used for the office and retail open ended size categories used the size 200,000 s.f. larger than the beginning of the size range, as the size ranges increase in 200,000 s.f. increments. s of trip rate, percent new trips, and trip length are as follows: (A) National studies (NHTS, AHS, Census) (I) Independent Study (Collier County) (Q) Same as LUC 770 (Business Park) (Y) Other National Studies (B) ITE 10th Edition Trip Generation (J) Same as LUC 220 (R) Same as LUC 820 (<50k) (C) Florida Studies Database (K) Florida Schedules (S) FL Curve (D) Blend ITE 10th & FL Studies (L) Same as LUC 240 (T) Same as LUC 942 (Auto Care Center) (E) Blend ITE 6th & FL Studies (M) Same as LUC 210 (U) Same as LUC 820 (50k 200k) (F) ITE Regression Analysis (N) Same as LUC 710 (V) n/a (G) ITE 10th equation (O) Model Based Trip Length (W) Same as LUC 492 (Health Club) (H) Previous Pasco MMTIF Study (P) Same as LUC 630 (Clinic) (X) Same as LUC 595 (DayCare) F:\WEO PE\Projects\ AECOM Pasco Mobilty 2017\3. Analysis\ Schedule Spreadsheets\[Mobility Schedules 2018 v6.xlsm]urban Transit Bike/Ped 2014 Mobility Percent change from 2014 to 2018 Net Mobility 4-15
40 County wide Parameters: Pasco County Land Use Code ITE LUC Table 4 8 Suburban Traditional Neighborhood Development Schedule ( District B) Revenue period: 25 P4P Equivalent Pennies: 6.7 Include carrying cost?: No TOD Deduction: 0.00% Discount Rate: 3.30% 2nd LOFT County pennies to capacity: 5 Include Interstates?: Yes TND Deduction: 11.36% Fuel efficiency: Existing State pennies to capacity: MUTRM Deduction: 0.00% Days/yr: 365 Tax Inc Fin Millage Rate to capacity: Factor to convert VMT to PMT: 1.42 Existing County pennies to capital: 0 Toll.fwy discount: 1.7% Land Use Unit Trip Rate (veh trips) TGR Standard Trip Length TL Market Area Trip Length Adjustment Factor Chargeable Trip length (mi) Trip length for revenue (mi) % New Trips % NT Gross assessable pmt/day Weighted Capacity Addition Ratio Needed PMC Needed PMC After Fwy/Toll/ TOD/TND/ MUTRM Deduct Weighted Cost/PMC Impact Cost PV County Gas Tax ($$/yr): PV P4P Equivalent PV Federal/ State Gas Tax Revenue ($$/yr) PV Sub Countywide selfcredits: PV Tax Before Increment % Self RESIDENTIAL: Single Family (Detached) 210.1P Less than 1,500 s.f. & Annual Hh Income less than 80% SHIP Definition (2) du 4.10 A 7.61 C % V $388 $7,483 $ $ $1, $1,901 $382 $5,201 68% $3,543 $1,658 $5,590 $1,591 $1,363 $228 $29 $38 $1,658 0% 210.2P to 1,500 s.f. du 6.25 A 7.61 C % V $388 $11,407 $ $ $2, $2,898 $382 $8,128 74% $6,041 $2,087 $8,721 $2,002 $1,715 $287 $37 $48 $2,087 0% 210.3P ,501 to 2,499 s.f. du 7.81 A 7.61 C % V $388 $14,254 $ $ $2, $3,621 $382 $10,252 72% $7,334 $2,918 $10,993 $2,800 $2,398 $402 $51 $67 $2,918 0% 210.4P ,500 s.f. and greater du 9.20 A 7.61 C % V $388 $16,791 $ $ $3, $4,265 $382 $12,144 74% $8,979 $3,165 $13,017 $3,036 $2,600 $436 $56 $73 $3,165 0% 210.5P "Low Income" SHIP defined Multi Family (2) du 3.46 A 5.87 C % V $390 $4,888 $ $ $ $1,260 $250 $3,378 68% $2,307 $1,071 $3,632 $1,027 $880 $147 $19 $25 $1,071 0% Multi Family Apartments du 6.60 B 5.87 C % V $390 $9,323 $ $ $1, $2,404 $743 $6,177 68% $4,191 $1,986 $6,662 $1,905 $1,632 $273 $35 $46 $1,986 0% Low Rise Condominium/Townhouse (1 to 2 stories) du 6.40 H 5.87 J % V $390 $9,041 $ $ $1, $2,331 $615 $6,095 67% $4,090 $2,005 $6,565 $1,924 $1,648 $276 $35 $46 $2,005 0% High Rise Condominium (3 or more stories) du 4.18 H 5.87 J % V $390 $5,905 $ $ $1, $1,522 $1,003 $3,380 65% $2,201 $1,179 $3,687 $1,131 $969 $162 $21 $27 $1,441 18% Mobile Home Park du 4.17 C 5.29 C % V $390 $5,314 $ $ $ $1,380 $148 $3,786 71% $2,682 $1,104 $4,062 $1,059 $907 $152 $20 $25 $1,104 0% Age Restricted Single Family (3) du 3.62 D 6.23 C % V $389 $5,422 $ $ $ $1,393 $698 $3,332 71% $2,370 $962 $3,613 $923 $791 $132 $17 $22 $962 0% Age Restricted Multi Family (3) du 3.45 D 3.77 C % V $391 $3,145 $ $ $ $842 $743 $1,561 77% $1,206 $355 $1,724 $340 $291 $49 $7 $8 $492 28% Congregate Care Facility (Attached) (3) du 2.02 B 3.54 C % C $391 $1,245 $42.14 $56.39 $ $336 $128 $781 71% $557 $224 $846 $215 $184 $31 $4 $5 $274 18% LODGING: Hotel room 8.36 D 7.20 C % C $389 $9,487 $ $ $1, $2,418 $248 $6, % $6,822 $0 $7,315 $0 $0 $0 $0 $0 $0 0% Motel room 3.35 D 4.99 C % C $390 $3,089 $ $ $ $806 $149 $2, % $2,134 $0 $2,295 $0 $0 $0 $0 $0 $0 0% Resort Hotel room 5.83 H 7.02 C % C $389 $8,119 $ $ $1, $2,071 $248 $5, % $5,801 $0 $6,223 $0 $0 $0 $0 $0 $0 0% RECREATION: General Recreation acre 2.28 H 5.37 K % K $390 $2,641 $85.98 $ $ $685 $111 $1,845 82% $1,522 $323 $1,982 $310 $266 $44 $6 $7 $323 0% RV Park RV space 1.62 H 4.83 L % L $390 $1,878 $61.64 $82.48 $ $491 $148 $1,238 71% $873 $365 $1,336 $350 $300 $50 $7 $8 $365 0% Marina berth 2.41 B 6.95 M % K $389 $3,603 $ $ $ $919 $124 $2,559 76% $1,933 $626 $2,746 $601 $515 $86 $11 $14 $626 0% Golf Course hole B 6.95 M % K $389 $45,418 $1, $1, $8, $11,591 $357 $33,470 77% $25,744 $7,726 $35,830 $7,413 $6,349 $1,064 $135 $178 $7,726 0% Miniature Golf Course hole 3.30 H 6.95 M % K $389 $4,934 $ $ $ $1,259 $64 $3,611 84% $3,051 $560 $3,867 $537 $460 $77 $10 $13 $560 0% Bowling Alley 1,000 sf H 5.41 N % K $390 $38,898 $1, $1, $7, $10,089 $188 $28,621 82% $23,547 $5,074 $30,643 $4,868 $4,170 $698 $89 $117 $5,074 0% Movie Theater screen H 2.33 C % C $394 $52,926 $1, $2, $10, $15,119 $1,067 $36,740 83% $30,318 $6,422 $39,490 $6,162 $5,283 $879 $112 $148 $6,422 0% Racquet Club/Health Club/Spa/Dance Studio 1,000 sf H 5.41 N % W $390 $17,102 $ $ $3, $4,435 $188 $12,478 82% $10,266 $2,212 $13,367 $2,122 $1,818 $304 $39 $51 $2,212 0% Community Center/Gymnasium 1,000 sf B 7.06 K % K $389 $43,733 $1, $1, $7, $11,158 $188 $32,387 86% $27,814 $4,573 $34,659 $4,388 $3,758 $630 $80 $105 $4,573 0% 496P n/a Ice Skating Arena 1,000 sf 9.95 H 9.21 H % K $355 $18,012 $ $ $3, $4,947 $188 $12,877 97% $12,479 $398 $13,813 $382 $327 $55 $7 $9 new n/a INSTITUTIONS: Elementary School student 1.89 B 4.52 O % K $391 $1,467 $48.99 $65.56 $ $391 $11 $1,065 79% $844 $221 $1,141 $212 $182 $30 $4 $5 $221 0% Middle School student 2.13 B 4.52 O % K $391 $1,860 $62.11 $83.12 $ $495 $13 $1,352 77% $1,038 $314 $1,449 $301 $258 $43 $6 $7 $314 0% High School student 2.03 B 4.52 O % K $391 $1,773 $59.20 $79.22 $ $472 $14 $1,287 74% $955 $332 $1,379 $318 $272 $46 $6 $8 $332 0% University/Jr College (7,500 or fewer students) (Private) student 1.74 B 6.95 M % K $389 $2,327 $75.03 $ $ $598 $15 $1,714 63% $1,072 $642 $1,835 $615 $527 $88 $12 $15 $642 0% University/Jr College (more than 7,500 students) (Private) student 1.21 B 6.95 M % K $389 $1,619 $52.21 $69.87 $ $416 $15 $1,188 60% $708 $480 $1,272 $460 $394 $66 $9 $11 $480 0% Church 1,000 sf 6.95 B 4.10 K % K $391 $5,513 $ $ $1, $1,482 $0 $4,031 63% $2,520 $1,511 $4,318 $1,449 $1,242 $207 $27 $35 $1,511 0% Day Care student 4.09 B 2.13 C % C $395 $1,380 $51.25 $68.58 $ $409 $10 $961 86% $825 $136 $1,033 $130 $111 $19 $3 $3 $136 0% Cemetery acre 6.02 B 6.95 M % H $389 $8,495 $ $ $1, $2,184 $357 $5,954 73% $4,340 $1,614 $6,396 $1,548 $1,326 $222 $29 $37 $1,614 0% Hospital 1,000 sf B 6.95 M % K $389 $12,262 $ $ $2, $3,152 $266 $8,844 53% $4,652 $4,192 $9,481 $4,023 $3,446 $577 $73 $96 $4,514 7% Nursing Home bed 3.06 B 2.72 C % C $394 $1,602 $56.99 $76.26 $ $454 $128 $1,020 74% $754 $266 $1,103 $255 $219 $36 $5 $6 $266 0% OFFICE: General Office 50,000 sf or less (4) 1,000 sf G 5.41 C % C $390 $11,561 $ $ $2, $3,025 $571 $7, % $7,964 $0 $8,565 $0 $0 $0 $0 $0 $0 0% 710.1P General Office 50, ,000 sf (4) 1,000 sf G 5.41 C % C $390 $11,323 $ $ $2, $2,963 $662 $7, % $7,698 $0 $8,286 $0 $0 $0 $0 $0 $0 0% 710.2P General Office 100, ,000 sf (4) 1,000 sf G 5.41 C % C $390 $11,090 $ $ $2, $2,902 $662 $7, % $7,526 $0 $8,102 $0 $0 $0 $0 $0 $0 0% 710.3P General Office 200, ,000 sf (4) 1,000 sf G 5.41 C % C $390 $10,862 $ $ $2, $2,842 $662 $7, % $7,357 $0 $7,922 $0 $0 $0 $0 $0 $0 0% 710.4P General Office greater than 400,000 sf (5) 1,000 sf 9.97 G 5.41 C % C $390 $10,638 $ $ $1, $2,784 $662 $7, % $7,192 $0 $7,745 $0 $0 $0 $0 $0 $0 0% Corporate Headquarters Building 1,000 sf 7.95 H 5.41 N % N $390 $8,484 $ $ $1, $2,220 $662 $5, % $5,602 $0 $6,043 $0 $0 $0 $0 $0 $0 0% Medical Office 1,000 sf B 5.83 C % C $390 $38,670 $1, $1, $7, $10,062 $662 $27, % $27,946 $0 $29,955 $0 $0 $0 $0 $0 $0 0% Office Park 1,000 sf D 7.47 C % Q $389 $16,611 $ $ $3, $4,251 $662 $11, % $11,698 $0 $12,561 $0 $0 $0 $0 $0 $0 0% Research and Development Center 1,000 sf D 5.65 Q % Q $390 $12,126 $ $ $2, $3,164 $662 $8, % $8,300 $0 $8,930 $0 $0 $0 $0 $0 $0 0% 770.P 640 Veterinarian Clinic 1,000 sf B 5.36 P % P $390 $22,978 $ $1, $4, $6,018 $571 $16, % $16,389 $0 $17,583 $0 $0 $0 $0 $0 $0 0% $$ Allocated for Net Mobility Full (1) (Incl Int) Interstate/ SIS (Excl Int) Transit Bike/Ped 2014 Mobility Percent change from 2014 to 2018 Net Mobility 4-16
41 County wide Parameters: Pasco County Land Use Code ITE LUC Table 4 8 (continued) Suburban Traditional Neighborhood Development Schedule ( District B) Revenue period: 25 P4P Equivalent Pennies: 6.7 Include carrying cost?: No TOD Deduction: 0.00% Discount Rate: 3.30% 2nd LOFT County pennies to capacity: 5 Include Interstates?: Yes TND Deduction: 11.36% Fuel efficiency: Existing State pennies to capacity: MUTRM Deduction: 0.00% Days/yr: 365 Tax Inc Fin Millage Rate to capacity: Factor to convert VMT to PMT: 1.42 Existing County pennies to capital: 0 Toll.fwy discount: 1.7% Land Use Unit Trip Rate (veh trips) TGR Standard Trip Length TL Market Area Trip Length Adjustment Factor Chargeable Trip length (mi) Trip length for revenue (mi) % New Trips % NT Gross assessable pmt/day Weighted Capacity Addition Ratio Needed PMC Needed PMC After Fwy/Toll/ TOD/TND/ MUTRM Deduct Weighted Cost/PMC Impact Cost PV County Gas Tax ($$/yr): PV P4P Equivalent PV Federal/ State Gas Tax Revenue ($$/yr) PV Sub Countywide selfcredits: PV Tax Before Increment % Self RETAIL: Mini Warehouse 1,000 sf 1.51 B 3.26 K % N $393 $922 $32.23 $43.13 $ $257 $98 $567 64% $361 $206 $615 $197 $169 $28 $4 $5 $206 0% Hardware/Paint 1,000 sf 9.14 B 1.96 R % R $395 $2,054 $78.71 $ $ $627 $405 $1,022 78% $802 $220 $1,128 $211 $181 $30 $4 $5 $1,824 88% Retail 50,000 sfgla or less (4) 1,000 sfgla G 1.96 S % S $395 $16,866 $ $ $3, $5,152 $405 $11,309 72% $8,184 $3,125 $12,185 $2,998 $2,571 $427 $55 $72 $3,125 0% 820.1P Retail 50, ,000 sfgla (4) 1,000 sfgla G 2.52 S % S $394 $16,598 $ $ $3, $4,823 $426 $11,350 75% $8,529 $2,821 $12,212 $2,706 $2,320 $386 $50 $65 $2,821 0% 820.2P Retail 200, ,000 sfgla (4) 1,000 sfgla G 2.77 S % S $394 $15,924 $ $ $3, $4,547 $426 $10,952 75% $8,252 $2,700 $11,779 $2,591 $2,222 $369 $47 $62 $2,700 0% 820.3P Retail 400, ,000 sfgla (4) 1,000 sfgla G 3.01 S % S $393 $15,785 $ $ $3, $4,454 $1,282 $10,048 75% $7,504 $2,544 $10,868 $2,440 $2,091 $349 $45 $59 $2,544 0% 820.4P Retail 600, ,000 sfgla (4) 1,000 sfgla G 3.26 S % S $393 $16,208 $ $ $3, $4,516 $1,282 $10,410 75% $7,764 $2,646 $11,252 $2,538 $2,175 $363 $47 $61 $2,646 0% 820.5P Retail greater than 800,000 sfgla (5) 1,000 sfgla G 3.51 S % S $393 $15,511 $ $ $3, $4,274 $1,282 $9,955 72% $7,163 $2,792 $10,761 $2,679 $2,296 $383 $49 $64 $2,792 0% Specialty Retail 1,000 sf H 3.54 C % C $393 $30,630 $1, $1, $5, $8,429 $405 $21,796 76% $16,577 $5,219 $23,388 $5,008 $4,293 $715 $91 $120 $5,219 0% 830.P n/a Non Veterinary Kennel 1,000 sf Y 2.13 C % C $395 $13,925 $ $ $2, $4,124 $405 $9,397 74% $6,974 $2,423 $10,121 $2,324 $1,993 $331 $43 $56 new n/a New/Used Auto Sales 1,000 sf B 4.83 C % C $391 $21,522 $ $ $4, $5,724 $276 $15,522 74% $11,480 $4,042 $16,641 $3,878 $3,323 $555 $71 $93 $4,042 0% Tire Store 1,000 sf B 3.80 T % T $392 $15,858 $ $ $3, $4,330 $405 $11,124 79% $8,759 $2,365 $11,948 $2,269 $1,945 $324 $42 $54 $2,365 0% Supermarket 1,000 sf B 2.18 C % C $395 $26,691 $ $1, $5, $7,962 $243 $18,486 77% $14,302 $4,184 $19,872 $4,015 $3,444 $571 $73 $96 $4,184 0% Convenience Store w/gas Pumps 1,000 sf D 1.59 C % C $397 $57,817 $2, $3, $13, $18,540 $101 $39,176 74% $29,008 $10,168 $42,180 $9,757 $8,373 $1,384 $177 $234 $10,168 0% Home Improvement Superstore 1,000 sf B 2.52 U % U $394 $10,594 $ $ $2, $3,078 $426 $7,091 78% $5,526 $1,565 $7,641 $1,501 $1,287 $214 $28 $36 $1,565 0% Pharmacy/Drug Store with and without Drive Thru 1,000 sf D 2.18 C % C $395 $14,305 $ $ $3, $4,267 $405 $9,633 77% $7,439 $2,194 $10,376 $2,105 $1,805 $300 $39 $50 $2,194 0% Furniture Store 1,000 sf 6.30 B 6.39 C % C $390 $4,394 $ $ $ $1,140 $405 $2,849 79% $2,247 $602 $3,077 $577 $494 $83 $11 $14 $602 0% Bank/Savings w/drive In 1,000 sf D 2.58 C % C $394 $24,232 $ $1, $4, $7,009 $576 $16,647 62% $10,282 $6,365 $17,906 $6,108 $5,237 $871 $111 $146 $6,365 0% 929P n/a Breakfast and Lunch Restaurant 1,000 sf Y 3.33 C % C $393 $35,627 $1, $1, $6, $9,894 $462 $25,271 74% $18,780 $6,491 $27,122 $6,229 $5,340 $889 $113 $149 new n/a Fast Casual Restaurant 1,000 sf Y 3.33 C % C $393 $86,555 $3, $4, $16, $24,036 $462 $62,056 74% $45,916 $16,140 $66,554 $15,488 $13,276 $2,212 $281 $371 new n/a Quality Restaurant 1,000 sf D 3.30 C % C $393 $45,229 $1, $2, $8, $12,577 $462 $32,189 75% $24,183 $8,006 $34,539 $7,682 $6,585 $1,097 $140 $184 $8,006 0% High Turnover Restaurant 1,000 sf D 3.33 C % C $393 $53,335 $1, $2, $10, $14,811 $462 $38,061 74% $28,232 $9,829 $40,833 $9,431 $8,084 $1,347 $172 $226 $9,829 0% Fast Food Restaurant w/drive Thru 1,000 sf D 2.15 C % C $395 $126,029 $4, $6, $26, $37,707 $1,263 $87,059 76% $66,584 $20,475 $93,608 $19,647 $16,851 $2,796 $357 $471 $20,475 0% Quick Lube bays B 3.80 T % T $392 $22,242 $ $1, $4, $6,073 $138 $16,031 76% $12,192 $3,839 $17,187 $3,684 $3,157 $527 $67 $88 $3,839 0% Auto Repair or Body Shop 1,000 sf H 3.80 T % T $392 $17,477 $ $ $3, $4,771 $276 $12,429 74% $9,164 $3,265 $13,337 $3,133 $2,685 $448 $57 $75 $3,265 0% Gasoline Station fuel pos B 2.00 C % C $395 $16,201 $ $ $3, $4,926 $25 $11,250 77% $8,695 $2,555 $12,091 $2,451 $2,102 $349 $45 $59 $2,555 0% Self Service Car Wash bays D 2.29 C % C $395 $14,010 $ $ $2, $4,136 $10 $9,864 61% $6,015 $3,849 $10,592 $3,693 $3,167 $526 $67 $89 $3,849 0% 913.P 913 Convenience/Gasoline/Fast Food Store 1,000 sf D 2.78 C % C $394 $178,789 $6, $8, $36, $51,018 $101 $127,669 78% $99,274 $28,395 $136,960 $27,247 $23,362 $3,885 $495 $653 $28,395 0% INDUSTRIAL: General Light Industrial 1,000 sf 4.96 B 5.41 N % N $390 $5,489 $ $ $1, $1,432 $210 $3, % $3,847 $0 $4,133 $0 $0 $0 $0 $0 $0 0% General Heavy Industrial 1,000 sf 1.50 B 5.41 N % N $390 $1,660 $54.31 $72.68 $ $433 $210 $1, % $1,017 $0 $1,103 $0 $0 $0 $0 $0 $0 0% Industrial Park 1,000 sf 3.37 B 5.41 N % N $390 $3,730 $ $ $ $973 $210 $2, % $2,547 $0 $2,741 $0 $0 $0 $0 $0 $0 0% Manufacturing 1,000 sf 3.93 B 5.41 N % N $390 $4,349 $ $ $ $1,134 $210 $3, % $3,005 $0 $3,231 $0 $0 $0 $0 $0 $0 0% Passive Warehouse (Storage Warehouse) 1,000 sf 1.74 B 5.41 N % N $390 $1,926 $63.00 $84.31 $ $502 $236 $1, % $1,188 $0 $1,288 $0 $0 $0 $0 $0 new n/a /156 Active Warehouse (Fulfillment Center/Parcel Hub) 1,000 sf 7.97 B 6.95 M % N $389 $11,289 $ $ $2, $2,894 $236 $8, % $8,160 $0 $8,746 $0 $0 $0 $0 $0 new n/a 160.P 153 Airport Hangar 1,000 sf 3.56 H 5.41 N % N $390 $3,940 $ $ $ $1,028 $210 $2, % $2,702 $0 $2,907 $0 $0 $0 $0 $0 $0 0% $$ Allocated for Net Mobility Full (1) (Incl Int) Interstate/ SIS (Excl Int) ######### $0 #DIV/0! Notes: (1) This value is the total value of transportation system consumed, less credits for revenues committed to transportation system expansion that are generated by the use itself. This value includes Interstate costs and "carrying costs", but not toll road costs. It does consider the proportion of trip length, varying system costs, and transportation system performance goals that vary by fee district. (2) Specific calculations for the "low income" category can be seen in Appendix B of the 2014 Mobility Update Study. (3) The statistical relationship between the trip generation rate for the age restricted single family, age restricted multi family, and congregate care facility was used to interpolate the trip length. (4) The trip generation rate recommended for the office and retail size categories used the end point of the range due to the nature of the ITE equation to be conservative for smaller developments. (5) The trip generation rate used for the office and retail open ended size categories used the size 200,000 s.f. larger than the beginning of the size range, as the size ranges increase in 200,000 s.f. increments. s of trip rate, percent new trips, and trip length are as follows: (A) National studies (NHTS, AHS, Census) (I) Independent Study (Collier County) (Q) Same as LUC 770 (Business Park) (Y) Other National Studies (B) ITE 10th Edition Trip Generation (J) Same as LUC 220 (R) Same as LUC 820 (<50k) (C) Florida Studies Database (K) Florida Schedules (S) FL Curve (D) Blend ITE 10th & FL Studies (L) Same as LUC 240 (T) Same as LUC 942 (Auto Care Center) (E) Blend ITE 6th & FL Studies (M) Same as LUC 210 (U) Same as LUC 820 (50k 200k) (F) ITE Regression Analysis (N) Same as LUC 710 (V) n/a (G) ITE 10th equation (O) Model Based Trip Length (W) Same as LUC 492 (Health Club) (H) Previous Pasco MMTIF Study (P) Same as LUC 630 (Clinic) (X) Same as LUC 595 (DayCare) F:\WEO PE\Projects\ AECOM Pasco Mobilty 2017\3. Analysis\ Schedule Spreadsheets\[Mobility Schedules 2018 v6.xlsm]urban Transit Bike/Ped 2014 Mobility Percent change from 2014 to 2018 Net Mobility 4-17
42 County wide Parameters: Pasco County Land Use Code ITE LUC Table 4 9 Suburban Transit Oriented Development Schedule ( District B) Revenue period: 25 P4P Equivalent Pennies: 6.7 Include carrying cost?: No TOD Deduction: 20.46% Discount Rate: 3.30% 2nd LOFT County pennies to capacity: 5 Include Interstates?: Yes TND Deduction: 0.00% Fuel efficiency: Existing State pennies to capacity: MUTRM Deduction: 0.00% Days/yr: 365 Tax Inc Fin Millage Rate to capacity: Factor to convert VMT to PMT: 1.42 Existing County pennies to capital: 0 Toll.fwy discount: 1.7% Land Use Unit Trip Rate (veh trips) TGR Standard Trip Length TL Market Area Trip Length Adjustment Factor Chargeable Trip length (mi) Trip length for revenue (mi) % New Trips % NT Gross assessable pmt/day Weighted Capacity Addition Ratio Needed PMC Needed PMC After Fwy/Toll/ TOD/TND/ MUTRM Deduct Weighted Cost/PMC Impact Cost PV County Gas Tax ($$/yr): PV P4P Equivalent PV Federal/ State Gas Tax Revenue ($$/yr) PV Sub Countywide selfcredits: PV Tax Before Increment % Self RESIDENTIAL: Single Family (Detached) 210.1P Less than 1,500 s.f. & Annual Hh Income less than 80% SHIP Definition (2) du 4.10 A 7.61 C % V $388 $6,715 $ $ $1, $1,706 $382 $4,628 82% $3,799 $829 $4,977 $795 $681 $114 $15 $19 $829 0% 210.2P to 1,500 s.f. du 6.25 A 7.61 C % V $388 $10,236 $ $ $1, $2,600 $382 $7,254 86% $6,211 $1,043 $7,786 $1,000 $856 $144 $19 $24 $1,043 0% 210.3P ,501 to 2,499 s.f. du 7.81 A 7.61 C % V $388 $12,791 $ $ $2, $3,249 $382 $9,160 84% $7,701 $1,459 $9,825 $1,399 $1,198 $201 $26 $34 $1,459 0% 210.4P ,500 s.f. and greater du 9.20 A 7.61 C % V $388 $15,068 $ $ $2, $3,828 $382 $10,859 85% $9,277 $1,582 $11,641 $1,518 $1,300 $218 $28 $36 $1,582 0% 210.5P "Low Income" SHIP defined Multi Family (2) du 3.46 A 5.87 C % V $390 $4,386 $ $ $ $1,131 $250 $3,006 82% $2,471 $535 $3,233 $513 $439 $74 $10 $12 $535 0% Multi Family Apartments du 6.60 B 5.87 C % V $390 $8,366 $ $ $1, $2,157 $743 $5,467 82% $4,474 $993 $5,901 $952 $815 $137 $18 $23 $993 0% Low Rise Condominium/Townhouse (1 to 2 stories) du 6.40 H 5.87 J % V $390 $8,113 $ $ $1, $2,091 $615 $5,406 81% $4,404 $1,002 $5,828 $961 $823 $138 $18 $23 $1,002 0% High Rise Condominium (3 or more stories) du 4.18 H 5.87 J % V $390 $5,299 $ $ $ $1,366 $1,003 $2,930 80% $2,340 $590 $3,205 $565 $484 $81 $11 $14 $721 18% Mobile Home Park du 4.17 C 5.29 C % V $390 $4,768 $ $ $ $1,239 $148 $3,382 84% $2,830 $552 $3,630 $529 $453 $76 $10 $13 $552 0% Age Restricted Single Family (3) du 3.62 D 6.23 C % V $389 $4,865 $ $ $ $1,250 $698 $2,918 84% $2,437 $481 $3,171 $461 $395 $66 $9 $11 $481 0% Age Restricted Multi Family (3) du 3.45 D 3.77 C % V $391 $2,822 $94.80 $ $ $756 $743 $1,324 87% $1,147 $177 $1,471 $169 $145 $24 $4 $4 $246 28% Congregate Care Facility (Attached) (3) du 2.02 B 3.54 C % C $391 $1,117 $37.81 $50.60 $ $301 $128 $688 84% $576 $112 $746 $107 $92 $15 $2 $3 $137 18% LODGING: Hotel room 8.36 D 7.20 C % C $389 $8,513 $ $ $1, $2,169 $248 $6, % $6,097 $0 $6,539 $0 $0 $0 $0 $0 $0 0% Motel room 3.35 D 4.99 C % C $390 $2,772 $90.71 $ $ $723 $149 $1, % $1,900 $0 $2,044 $0 $0 $0 $0 $0 $0 0% Resort Hotel room 5.83 H 7.02 C % C $389 $7,285 $ $ $1, $1,858 $248 $5, % $5,180 $0 $5,558 $0 $0 $0 $0 $0 $0 0% RECREATION: General Recreation acre 2.28 H 5.37 K % K $390 $2,370 $77.15 $ $ $615 $111 $1,644 90% $1,482 $162 $1,767 $155 $133 $22 $3 $4 $162 0% RV Park RV space 1.62 H 4.83 L % L $390 $1,685 $55.31 $74.02 $ $441 $148 $1,096 83% $913 $183 $1,183 $175 $150 $25 $4 $4 $183 0% Marina berth 2.41 B 6.95 M % K $389 $3,233 $ $ $ $825 $124 $2,284 86% $1,971 $313 $2,452 $300 $257 $43 $6 $7 $313 0% Golf Course hole B 6.95 M % K $389 $40,756 $1, $1, $7, $10,401 $357 $29,997 87% $26,134 $3,863 $32,115 $3,706 $3,174 $532 $68 $89 $3,863 0% Miniature Golf Course hole 3.30 H 6.95 M % K $389 $4,427 $ $ $ $1,130 $64 $3,234 91% $2,954 $280 $3,464 $269 $230 $39 $5 $6 $280 0% Bowling Alley 1,000 sf H 5.41 N % K $390 $34,905 $1, $1, $6, $9,053 $188 $25,664 90% $23,127 $2,537 $27,477 $2,434 $2,085 $349 $45 $58 $2,537 0% Movie Theater screen H 2.33 C % C $394 $47,492 $1, $2, $9, $13,567 $1,067 $32,859 90% $29,648 $3,211 $35,327 $3,081 $2,642 $439 $56 $74 $3,211 0% Racquet Club/Health Club/Spa/Dance Studio 1,000 sf H 5.41 N % W $390 $15,346 $ $ $2, $3,980 $188 $11,178 90% $10,072 $1,106 $11,975 $1,061 $909 $152 $20 $25 $1,106 0% Community Center/Gymnasium 1,000 sf B 7.06 K % K $389 $39,243 $1, $1, $7, $10,012 $188 $29,042 92% $26,756 $2,286 $31,081 $2,193 $1,878 $315 $40 $53 $2,286 0% 496P n/a Ice Skating Arena 1,000 sf 9.95 H 9.21 H % K $355 $16,163 $ $ $3, $4,440 $188 $11,535 98% $11,336 $199 $12,375 $190 $163 $27 $4 $5 new n/a INSTITUTIONS: Elementary School student 1.89 B 4.52 O % K $391 $1,317 $43.96 $58.83 $ $350 $11 $955 88% $845 $110 $1,023 $105 $90 $15 $2 $3 $110 0% Middle School student 2.13 B 4.52 O % K $391 $1,669 $55.74 $74.59 $ $444 $13 $1,212 87% $1,055 $157 $1,299 $150 $128 $22 $3 $4 $157 0% High School student 2.03 B 4.52 O % K $391 $1,591 $53.12 $71.08 $ $423 $14 $1,154 86% $988 $166 $1,236 $159 $136 $23 $3 $4 $166 0% University/Jr College (7,500 or fewer students) (Private) student 1.74 B 6.95 M % K $389 $2,088 $67.32 $90.09 $ $537 $15 $1,536 79% $1,215 $321 $1,645 $308 $264 $44 $6 $7 $321 0% University/Jr College (more than 7,500 students) (Private) student 1.21 B 6.95 M % K $389 $1,453 $46.85 $62.70 $ $374 $15 $1,064 77% $824 $240 $1,140 $229 $196 $33 $5 $6 $240 0% Church 1,000 sf 6.95 B 4.10 K % K $391 $4,947 $ $ $ $1,330 $0 $3,617 79% $2,861 $756 $3,874 $725 $621 $104 $14 $17 $756 0% Day Care student 4.09 B 2.13 C % C $395 $1,238 $45.99 $61.54 $ $367 $10 $861 92% $793 $68 $926 $64 $55 $9 $2 $2 $68 0% Cemetery acre 6.02 B 6.95 M % H $389 $7,623 $ $ $1, $1,959 $357 $5,306 85% $4,499 $807 $5,703 $773 $662 $111 $15 $19 $807 0% Hospital 1,000 sf B 6.95 M % K $389 $11,003 $ $ $1, $2,828 $266 $7,908 73% $5,812 $2,096 $8,480 $2,011 $1,723 $288 $37 $48 $2,257 7% Nursing Home bed 3.06 B 2.72 C % C $394 $1,438 $51.14 $68.43 $ $408 $128 $902 85% $769 $133 $977 $127 $109 $18 $3 $3 $133 0% OFFICE: General Office 50,000 sf or less (4) 1,000 sf G 5.41 C % C $390 $10,374 $ $ $1, $2,715 $571 $7, % $7,088 $0 $7,627 $0 $0 $0 $0 $0 $0 0% 710.1P General Office 50, ,000 sf (4) 1,000 sf G 5.41 C % C $390 $10,160 $ $ $1, $2,659 $662 $6, % $6,840 $0 $7,368 $0 $0 $0 $0 $0 $0 0% 710.2P General Office 100, ,000 sf (4) 1,000 sf G 5.41 C % C $390 $9,951 $ $ $1, $2,604 $662 $6, % $6,685 $0 $7,202 $0 $0 $0 $0 $0 $0 0% 710.3P General Office 200, ,000 sf (4) 1,000 sf G 5.41 C % C $390 $9,746 $ $ $1, $2,551 $662 $6, % $6,534 $0 $7,041 $0 $0 $0 $0 $0 $0 0% 710.4P General Office greater than 400,000 sf (5) 1,000 sf 9.97 G 5.41 C % C $390 $9,546 $ $ $1, $2,498 $662 $6, % $6,386 $0 $6,882 $0 $0 $0 $0 $0 $0 0% Corporate Headquarters Building 1,000 sf 7.95 H 5.41 N % N $390 $7,613 $ $ $1, $1,992 $662 $4, % $4,959 $0 $5,354 $0 $0 $0 $0 $0 $0 0% Medical Office 1,000 sf B 5.83 C % C $390 $34,700 $1, $1, $6, $9,029 $662 $25, % $25,009 $0 $26,812 $0 $0 $0 $0 $0 $0 0% Office Park 1,000 sf D 7.47 C % Q $389 $14,906 $ $ $2, $3,815 $662 $10, % $10,429 $0 $11,204 $0 $0 $0 $0 $0 $0 0% Research and Development Center 1,000 sf D 5.65 Q % Q $390 $10,881 $ $ $2, $2,839 $662 $7, % $7,380 $0 $7,945 $0 $0 $0 $0 $0 $0 0% 770.P 640 Veterinarian Clinic 1,000 sf B 5.36 P % P $390 $20,619 $ $ $3, $5,401 $571 $14, % $14,648 $0 $15,719 $0 $0 $0 $0 $0 $0 0% $$ Allocated for Net Mobility Full (1) (Incl Int) Interstate/ SIS (Excl Int) Transit Bike/Ped 2014 Mobility Percent change from 2014 to 2018 Net Mobility 4-18
43 County wide Parameters: Pasco County Land Use Code ITE LUC Table 4 9 (continued) Suburban Transit Oriented Development Schedule ( District B) Revenue period: 25 P4P Equivalent Pennies: 6.7 Include carrying cost?: No TOD Deduction: 20.46% Discount Rate: 3.30% 2nd LOFT County pennies to capacity: 5 Include Interstates?: Yes TND Deduction: 0.00% Fuel efficiency: Existing State pennies to capacity: MUTRM Deduction: 0.00% Days/yr: 365 Tax Inc Fin Millage Rate to capacity: Factor to convert VMT to PMT: 1.42 Existing County pennies to capital: 0 Toll.fwy discount: 1.7% Land Use Unit Trip Rate (veh trips) TGR Standard Trip Length TL Market Area Trip Length Adjustment Factor Chargeable Trip length (mi) Trip length for revenue (mi) % New Trips % NT Gross assessable pmt/day Weighted Capacity Addition Ratio Needed PMC Needed PMC After Fwy/Toll/ TOD/TND/ MUTRM Deduct Weighted Cost/PMC Impact Cost PV County Gas Tax ($$/yr): PV P4P Equivalent PV Federal/ State Gas Tax Revenue ($$/yr) PV Sub Countywide selfcredits: PV Tax Before Increment % Self RETAIL: Mini Warehouse 1,000 sf 1.51 B 3.26 K % N $393 $828 $28.92 $38.70 $ $231 $98 $499 79% $396 $103 $542 $99 $85 $14 $2 $2 $103 0% Hardware/Paint 1,000 sf 9.14 B 1.96 R % R $395 $1,843 $70.63 $94.52 $ $563 $405 $875 87% $765 $110 $971 $105 $90 $15 $2 $3 $912 88% Retail 50,000 sfgla or less (4) 1,000 sfgla G 1.96 S % S $395 $15,135 $ $ $3, $4,623 $405 $10,106 85% $8,544 $1,562 $10,893 $1,498 $1,285 $213 $28 $36 $1,562 0% 820.1P Retail 50, ,000 sfgla (4) 1,000 sfgla G 2.52 S % S $394 $14,894 $ $ $3, $4,327 $426 $10,141 86% $8,731 $1,410 $10,915 $1,353 $1,160 $193 $25 $32 $1,410 0% 820.2P Retail 200, ,000 sfgla (4) 1,000 sfgla G 2.77 S % S $394 $14,289 $ $ $2, $4,080 $426 $9,784 86% $8,434 $1,350 $10,526 $1,295 $1,110 $185 $24 $31 $1,350 0% 820.3P Retail 400, ,000 sfgla (4) 1,000 sfgla G 3.01 S % S $393 $14,164 $ $ $2, $3,997 $1,282 $8,885 86% $7,613 $1,272 $9,621 $1,220 $1,046 $174 $23 $29 $1,272 0% 820.4P Retail 600, ,000 sfgla (4) 1,000 sfgla G 3.26 S % S $393 $14,544 $ $ $2, $4,052 $1,282 $9,209 86% $7,886 $1,323 $9,965 $1,269 $1,088 $181 $24 $30 $1,323 0% 820.5P Retail greater than 800,000 sfgla (5) 1,000 sfgla G 3.51 S % S $393 $13,919 $ $ $2, $3,835 $1,282 $8,801 84% $7,405 $1,396 $9,525 $1,339 $1,148 $191 $25 $32 $1,396 0% Specialty Retail 1,000 sf H 3.54 C % C $393 $27,486 $ $1, $5, $7,564 $405 $19,517 87% $16,908 $2,609 $20,945 $2,503 $2,145 $358 $46 $60 $2,609 0% 830.P n/a Non Veterinary Kennel 1,000 sf Y 2.13 C % C $395 $12,496 $ $ $2, $3,700 $405 $8,391 86% $7,179 $1,212 $9,040 $1,162 $997 $165 $22 $28 new n/a New/Used Auto Sales 1,000 sf B 4.83 C % C $391 $19,313 $ $ $3, $5,136 $276 $13,900 85% $11,879 $2,021 $14,904 $1,939 $1,661 $278 $36 $46 $2,021 0% Tire Store 1,000 sf B 3.80 T % T $392 $14,230 $ $ $2, $3,885 $405 $9,940 88% $8,758 $1,182 $10,680 $1,134 $972 $162 $21 $27 $1,182 0% Supermarket 1,000 sf B 2.18 C % C $395 $23,951 $ $1, $5, $7,144 $243 $16,563 87% $14,471 $2,092 $17,807 $2,007 $1,721 $286 $37 $48 $2,092 0% Convenience Store w/gas Pumps 1,000 sf D 1.59 C % C $397 $51,881 $2, $2, $11, $16,637 $101 $35,143 86% $30,059 $5,084 $37,839 $4,878 $4,186 $692 $89 $117 $5,084 0% Home Improvement Superstore 1,000 sf B 2.52 U % U $394 $9,507 $ $ $1, $2,762 $426 $6,319 88% $5,536 $783 $6,813 $751 $644 $107 $14 $18 $783 0% Pharmacy/Drug Store with and without Drive Thru 1,000 sf D 2.18 C % C $395 $12,836 $ $ $2, $3,829 $405 $8,602 87% $7,505 $1,097 $9,269 $1,052 $902 $150 $20 $25 $1,097 0% Furniture Store 1,000 sf 6.30 B 6.39 C % C $390 $3,943 $ $ $ $1,023 $405 $2,515 88% $2,214 $301 $2,720 $288 $247 $41 $6 $7 $301 0% Bank/Savings w/drive In 1,000 sf D 2.58 C % C $394 $21,745 $ $1, $4, $6,290 $576 $14,879 79% $11,696 $3,183 $16,009 $3,054 $2,618 $436 $56 $73 $3,183 0% 929P n/a Breakfast and Lunch Restaurant 1,000 sf Y 3.33 C % C $393 $31,970 $1, $1, $6, $8,878 $462 $22,629 86% $19,384 $3,245 $24,291 $3,113 $2,668 $445 $57 $75 new n/a Fast Casual Restaurant 1,000 sf Y 3.33 C % C $393 $77,669 $2, $3, $15, $21,569 $462 $55,638 85% $47,568 $8,070 $59,674 $7,743 $6,637 $1,106 $141 $186 new n/a Quality Restaurant 1,000 sf D 3.30 C % C $393 $40,585 $1, $1, $7, $11,286 $462 $28,837 86% $24,834 $4,003 $30,946 $3,841 $3,292 $549 $70 $92 $4,003 0% High Turnover Restaurant 1,000 sf D 3.33 C % C $393 $47,859 $1, $2, $9, $13,291 $462 $34,107 86% $29,192 $4,915 $36,593 $4,716 $4,042 $674 $86 $113 $4,915 0% Fast Food Restaurant w/drive Thru 1,000 sf D 2.15 C % C $395 $113,090 $4, $5, $23, $33,836 $1,263 $77,992 87% $67,754 $10,238 $83,868 $9,824 $8,426 $1,398 $179 $235 $10,238 0% Quick Lube bays B 3.80 T % T $392 $19,958 $ $ $3, $5,449 $138 $14,371 87% $12,452 $1,919 $15,408 $1,841 $1,578 $263 $34 $44 $1,919 0% Auto Repair or Body Shop 1,000 sf H 3.80 T % T $392 $15,682 $ $ $3, $4,282 $276 $11,125 85% $9,492 $1,633 $11,940 $1,566 $1,342 $224 $29 $38 $1,633 0% Gasoline Station fuel pos B 2.00 C % C $395 $14,538 $ $ $3, $4,420 $25 $10,092 87% $8,814 $1,278 $10,848 $1,226 $1,052 $174 $23 $29 $1,278 0% Self Service Car Wash bays D 2.29 C % C $395 $12,572 $ $ $2, $3,711 $10 $8,850 78% $6,926 $1,924 $9,503 $1,846 $1,583 $263 $34 $44 $1,924 0% 913.P 913 Convenience/Gasoline/Fast Food Store 1,000 sf D 2.78 C % C $394 $160,434 $5, $7, $32, $45,780 $101 $114,552 88% $100,354 $14,198 $122,889 $13,623 $11,680 $1,943 $248 $327 $14,198 0% INDUSTRIAL: General Light Industrial 1,000 sf 4.96 B 5.41 N % N $390 $4,926 $ $ $ $1,285 $210 $3, % $3,431 $0 $3,687 $0 $0 $0 $0 $0 $0 0% General Heavy Industrial 1,000 sf 1.50 B 5.41 N % N $390 $1,490 $48.73 $65.22 $ $389 $210 $ % $891 $0 $968 $0 $0 $0 $0 $0 $0 0% Industrial Park 1,000 sf 3.37 B 5.41 N % N $390 $3,347 $ $ $ $873 $210 $2, % $2,264 $0 $2,438 $0 $0 $0 $0 $0 $0 0% Manufacturing 1,000 sf 3.93 B 5.41 N % N $390 $3,903 $ $ $ $1,018 $210 $2, % $2,675 $0 $2,878 $0 $0 $0 $0 $0 $0 0% Passive Warehouse (Storage Warehouse) 1,000 sf 1.74 B 5.41 N % N $390 $1,728 $56.53 $75.65 $ $451 $236 $1, % $1,042 $0 $1,132 $0 $0 $0 $0 $0 new n/a /156 Active Warehouse (Fulfillment Center/Parcel Hub) 1,000 sf 7.97 B 6.95 M % N $389 $10,130 $ $ $1, $2,597 $236 $7, % $7,298 $0 $7,824 $0 $0 $0 $0 $0 new n/a 160.P 153 Airport Hangar 1,000 sf 3.56 H 5.41 N % N $390 $3,536 $ $ $ $922 $210 $2, % $2,403 $0 $2,587 $0 $0 $0 $0 $0 $0 0% $$ Allocated for Net Mobility Full (1) (Incl Int) Interstate/ SIS (Excl Int) ######### $0 #DIV/0! Notes: (1) This value is the total value of transportation system consumed, less credits for revenues committed to transportation system expansion that are generated by the use itself. This value includes Interstate costs and "carrying costs", but not toll road costs. It does consider the proportion of trip length, varying system costs, and transportation system performance goals that vary by fee district. (2) Specific calculations for the "low income" category can be seen in Appendix B of the 2014 Mobility Update Study. (3) The statistical relationship between the trip generation rate for the age restricted single family, age restricted multi family, and congregate care facility was used to interpolate the trip length. (4) The trip generation rate recommended for the office and retail size categories used the end point of the range due to the nature of the ITE equation to be conservative for smaller developments. (5) The trip generation rate used for the office and retail open ended size categories used the size 200,000 s.f. larger than the beginning of the size range, as the size ranges increase in 200,000 s.f. increments. s of trip rate, percent new trips, and trip length are as follows: (A) National studies (NHTS, AHS, Census) (I) Independent Study (Collier County) (Q) Same as LUC 770 (Business Park) (Y) Other National Studies (B) ITE 10th Edition Trip Generation (J) Same as LUC 220 (R) Same as LUC 820 (<50k) (C) Florida Studies Database (K) Florida Schedules (S) FL Curve (D) Blend ITE 10th & FL Studies (L) Same as LUC 240 (T) Same as LUC 942 (Auto Care Center) (E) Blend ITE 6th & FL Studies (M) Same as LUC 210 (U) Same as LUC 820 (50k 200k) (F) ITE Regression Analysis (N) Same as LUC 710 (V) n/a (G) ITE 10th equation (O) Model Based Trip Length (W) Same as LUC 492 (Health Club) (H) Previous Pasco MMTIF Study (P) Same as LUC 630 (Clinic) (X) Same as LUC 595 (DayCare) F:\WEO PE\Projects\ AECOM Pasco Mobilty 2017\3. Analysis\ Schedule Spreadsheets\[Mobility Schedules 2018 v6.xlsm]urban Transit Bike/Ped 2014 Mobility Percent change from 2014 to 2018 Net Mobility 4-19
44 County wide Parameters: Pasco County Land Use Code ITE LUC Table 4 10 Rural Standard Schedule ( District C) Revenue period: 25 P4P Equivalent Pennies: 6.7 Include carrying cost?: No TOD Deduction: 0.00% Discount Rate: 3.30% 2nd LOFT County pennies to capacity: 5.0 Include Interstates?: Yes TND Deduction: 0.00% Fuel efficiency: Existing State pennies to capacity: MUTRM Deduction: 0.00% Days/yr: 365 Tax Inc Fin Millage Rate to capacity: Factor to convert VMT to PMT: 1.42 Existing County pennies to capital: 0 Toll.fwy discount: 1.7% Land Use Unit Trip Rate (veh trips) TGR Standard Trip Length TL Market Area Trip Length Adjustment Factor Chargeable Trip length (mi) Trip length for revenue (mi) % New Trips % NT Gross assessable pmt/day Weighted Capacity Addition Ratio Needed PMC Needed PMC After Fwy/Toll/ TOD/TND/ MUTRM Deduct Weighted Cost/PMC Impact Cost PV County Gas Tax ($$/yr): PV P4P Equivalent PV Federal/ State Gas Tax Revenue ($$/yr) PV Sub Countywide selfcredits: PV Tax Before Increment % Self RESIDENTIAL: Single Family (Detached) 210.1P Less than 1,500 s.f. & Annual Hh Income less than 80% SHIP Definition( du 4.10 A 7.61 C % V $395 $10,578 $327 $438 $1,844 $2,609 $305 $7,663 27% $2,070 $5,593 $8,213 $5,332 $4,409 $923 $160 $101 $5,593 0% P LT 1,500 s.f. & HH Inc < 80% SHIP on 5+ ac lot du 4.10 A 7.61 C % V $395 $10,578 $327 $438 $1,844 $2,609 $305 $7,663 36% $2,779 $4,884 $8,213 $4,656 $3,850 $806 $140 $88 new n/a 210.2P to 1,500 s.f. du 6.25 A 7.61 C % V $395 $16,125 $499 $668 $2,811 $3,978 $305 $11,842 41% $4,816 $7,026 $12,680 $6,699 $5,540 $1,159 $201 $126 $7,026 0% P to 1,500 s.f. on 5+ ac lot du 6.25 A 7.61 C % V $395 $16,125 $499 $668 $2,811 $3,978 $305 $11,842 48% $5,701 $6,141 $12,680 $5,854 $4,841 $1,013 $176 $111 new n/a 210.3P ,501 to 2,499 s.f. du 7.81 A 7.61 C % V $395 $20,150 $623 $834 $3,513 $4,971 $305 $14,874 34% $5,074 $9,800 $15,921 $9,344 $7,727 $1,617 $280 $176 $9,800 0% P ,501 to 2,499 s.f. on 5+ ac lot du 7.81 A 7.61 C % V $395 $20,150 $623 $834 $3,513 $4,971 $305 $14,874 42% $6,304 $8,570 $15,921 $8,171 $6,757 $1,414 $245 $154 new n/a 210.4P ,500 s.f. and greater du 9.20 A 7.61 C % V $395 $23,736 $734 $983 $4,138 $5,855 $305 $17,575 39% $6,852 $10,723 $18,809 $10,224 $8,455 $1,769 $306 $193 $10,723 0% P ,500 s.f. and greater on 5+ ac lot du 9.20 A 7.61 C % V $395 $23,736 $734 $983 $4,138 $5,855 $305 $17,575 47% $8,263 $9,312 $18,809 $8,878 $7,342 $1,536 $266 $168 new n/a 210.5P "Low Income" SHIP defined Multi Family (2) du 3.46 A 5.87 C % V $397 $6,910 $216 $289 $1,218 $1,724 $207 $4,979 27% $1,350 $3,629 $5,338 $3,460 $2,848 $612 $104 $65 $3,629 0% Multi Family Apartments du 6.60 B 5.87 C % V $397 $13,181 $413 $552 $2,324 $3,289 $616 $9,276 28% $2,582 $6,694 $9,961 $6,383 $5,255 $1,128 $191 $120 $6,694 0% Low Rise Condominium/Townhouse (1 to 2 stories) du 6.40 H 5.87 J % V $397 $12,781 $400 $535 $2,254 $3,189 $550 $9,042 26% $2,306 $6,736 $9,706 $6,423 $5,287 $1,136 $192 $121 $6,736 0% High Rise Condominium (3 or more stories) du 4.18 H 5.87 J % V $397 $8,348 $261 $350 $1,472 $2,083 $550 $5,715 9% $495 $5,220 $6,148 $4,977 $4,097 $880 $149 $94 $5,220 0% Mobile Home Park du 4.17 C 5.29 C % V $397 $7,514 $237 $317 $1,333 $1,886 $111 $5,517 32% $1,786 $3,731 $5,908 $3,557 $2,924 $633 $107 $67 $3,731 0% Age Restricted Single Family (3) du 3.62 D 6.23 C % V $396 $7,665 $239 $320 $1,348 $1,907 $558 $5,199 37% $1,919 $3,280 $5,598 $3,127 $2,577 $550 $94 $59 $3,280 0% Age Restricted Multi Family (3) du 3.45 D 3.77 C % V $400 $4,462 $143 $192 $808 $1,144 $616 $2,702 35% $952 $1,750 $2,934 $1,668 $1,360 $308 $50 $32 $1,750 0% Congregate Care Facility (Attached) (3) du 2.02 B 3.54 C % C $401 $1,771 $57 $76 $322 $456 $112 $1,204 19% $226 $978 $1,296 $932 $758 $174 $28 $18 $978 0% LODGING: Hotel room 8.36 D 7.20 C % C $395 $13,062 $406 $543 $2,286 $3,235 $214 $9, % $9,613 $0 $10,292 $0 $0 $0 $0 $0 $0 0% Motel room 3.35 D 4.99 C % C $398 $4,262 $135 $180 $759 $1,074 $128 $3, % $3,060 $0 $3,281 $0 $0 $0 $0 $0 $0 0% Resort Hotel room 5.83 H 7.02 C % C $396 $11,178 $347 $465 $1,957 $2,770 $214 $8, % $8,194 $0 $8,775 $0 $0 $0 $0 $0 $0 0% RECREATION: General Recreation acre 2.28 H 5.37 K % K $398 $3,643 $115 $153 $646 $914 $74 $2,655 61% $1,608 $1,047 $2,844 $998 $819 $179 $30 $19 $1,047 0% RV Park RV space 1.62 H 4.83 L % L $398 $2,591 $82 $110 $462 $654 $111 $1,825 38% $701 $1,124 $1,960 $1,071 $877 $194 $33 $20 $1,124 0% Marina berth 2.41 B 6.95 M % K $396 $4,961 $154 $206 $869 $1,230 $117 $3,614 47% $1,694 $1,920 $3,872 $1,830 $1,510 $320 $55 $35 $1,920 0% Golf Course hole B 6.95 M % K $396 $62,532 $1,945 $2,602 $10,956 $15,503 $106 $46,922 50% $23,380 $23,542 $50,172 $22,447 $18,525 $3,922 $671 $424 $23,542 0% Miniature Golf Course hole 3.30 H 6.95 M % K $396 $6,792 $211 $283 $1,190 $1,684 $52 $5,056 66% $3,328 $1,728 $5,409 $1,647 $1,359 $288 $50 $31 $1,728 0% Bowling Alley 1,000 sf H 5.41 N % K $398 $53,646 $1,688 $2,258 $9,508 $13,454 $151 $40,042 61% $24,495 $15,547 $42,829 $14,823 $12,165 $2,658 $444 $280 $15,547 0% Movie Theater screen H 2.33 C % C $406 $73,864 $2,490 $3,332 $14,027 $19,848 $777 $53,239 60% $31,785 $21,454 $57,077 $20,456 $16,442 $4,014 $612 $386 $21,454 0% Racquet Club/Health Club/Spa/Dance Studio 1,000 sf H 5.41 N % W $398 $23,586 $742 $993 $4,180 $5,915 $151 $17,520 61% $10,709 $6,811 $18,746 $6,493 $5,329 $1,164 $195 $123 $6,811 0% Community Center/Gymnasium 1,000 sf B 7.06 K % K $396 $60,260 $1,872 $2,506 $10,549 $14,927 $151 $45,183 69% $31,227 $13,956 $48,314 $13,307 $10,982 $2,325 $398 $251 $13,956 0% 496P n/a Ice Skating Arena 1,000 sf 9.95 H 9.21 H % K $356 $24,387 $832 $1,114 $4,689 $6,635 $151 $17,601 92% $16,150 $1,451 $18,869 $1,383 $1,184 $199 $42 $26 new n/a INSTITUTIONS: Elementary School student 1.89 B 4.52 O % K $399 $2,263 $72 $96 $405 $574 $11 $1,678 47% $793 $885 $1,796 $843 $689 $154 $26 $16 $885 0% Middle School student 2.13 B 4.52 O % K $399 $2,870 $91 $122 $514 $727 $13 $2,129 41% $872 $1,257 $2,278 $1,198 $979 $219 $36 $23 $1,257 0% High School student 2.03 B 4.52 O % K $399 $2,735 $87 $116 $490 $693 $14 $2,028 35% $700 $1,328 $2,170 $1,266 $1,035 $231 $38 $24 $1,328 0% University/Jr College (7,500 or fewer students) (Private) student 1.74 B 6.95 M % K $396 $3,577 $111 $149 $627 $887 $15 $2,675 8% $221 $2,454 $2,861 $2,340 $1,931 $409 $70 $44 $2,454 0% University/Jr College (more than 7,500 students) (Private) student 1.21 B 6.95 M % K $396 $2,489 $77 $104 $436 $617 $15 $1,857 8% $153 $1,703 $1,986 $1,623 $1,340 $284 $49 $31 $1,835 7% Church 1,000 sf 6.95 B 4.10 K % K $400 $8,512 $272 $365 $1,535 $2,172 $0 $6,341 1% $81 $6,260 $6,783 $5,968 $4,868 $1,100 $179 $113 $6,267 0% Day Care student 4.09 B 2.13 C % C $406 $2,145 $73 $98 $413 $585 $9 $1,551 54% $834 $717 $1,663 $683 $549 $134 $21 $13 $717 0% Cemetery acre 6.02 B 6.95 M % H $396 $13,058 $406 $543 $2,288 $3,238 $250 $9,570 35% $3,397 $6,173 $10,248 $5,886 $4,857 $1,029 $176 $111 $6,173 0% Hospital 1,000 sf B 6.95 M % K $396 $18,846 $586 $784 $3,302 $4,673 $233 $13,940 1% $177 $13,763 $14,920 $13,122 $10,829 $2,293 $393 $248 $13,800 0% Nursing Home bed 3.06 B 2.72 C % C $404 $2,484 $82 $110 $464 $657 $112 $1,716 35% $593 $1,123 $1,845 $1,070 $864 $206 $33 $20 $1,123 0% OFFICE: General Office 50,000 sf or less (4) 1,000 sf G 5.41 C % C $398 $17,795 $560 $749 $3,154 $4,463 $381 $12, % $12,950 $0 $13,875 $0 $0 $0 $0 $0 $0 0% 710.1P General Office 50, ,000 sf (4) 1,000 sf G 5.41 C % C $398 $17,428 $548 $734 $3,089 $4,371 $525 $12, % $12,532 $0 $13,438 $0 $0 $0 $0 $0 $0 0% 710.2P General Office 100, ,000 sf (4) 1,000 sf G 5.41 C % C $398 $17,070 $537 $719 $3,026 $4,281 $525 $12, % $12,264 $0 $13,151 $0 $0 $0 $0 $0 $0 0% 710.3P General Office 200, ,000 sf (4) 1,000 sf G 5.41 C % C $398 $16,718 $526 $704 $2,963 $4,193 $525 $12, % $12,000 $0 $12,869 $0 $0 $0 $0 $0 $0 0% 710.4P General Office greater than 400,000 sf (5) 1,000 sf 9.97 G 5.41 C % C $398 $16,374 $515 $689 $2,902 $4,107 $525 $11, % $11,743 $0 $12,594 $0 $0 $0 $0 $0 $0 0% Corporate Headquarters Building 1,000 sf 7.95 H 5.41 N % N $398 $13,058 $411 $550 $2,315 $3,275 $525 $9, % $9,258 $0 $9,937 $0 $0 $0 $0 $0 $0 0% Medical Office 1,000 sf B 5.83 C % C $397 $59,508 $1,865 $2,496 $10,508 $14,869 $525 $44, % $44,114 $0 $47,206 $0 $0 $0 $0 $0 $0 0% Office Park 1,000 sf D 7.47 C % Q $395 $25,533 $792 $1,059 $4,460 $6,311 $525 $18, % $18,697 $0 $20,024 $0 $0 $0 $0 $0 $0 0% Research and Development Center 1,000 sf D 5.65 Q % Q $397 $18,660 $586 $784 $3,302 $4,672 $525 $13, % $13,463 $0 $14,433 $0 $0 $0 $0 $0 $0 0% 770.P 640 Veterinarian Clinic 1,000 sf B 5.36 P % P $398 $35,369 $1,114 $1,490 $6,274 $8,877 $381 $26, % $26,110 $0 $27,948 $0 $0 $0 $0 $0 $0 0% $$ Allocated for Net Mobility Full (1) (Incl Int) Interstate/ SIS (Excl Int) Transit Bike/Ped 2014 Mobility Percent change from 2014 to 2018 Net Mobility 4-20
45 County wide Parameters: Pasco County Land Use Code ITE LUC Table 4 10 (continued) Rural Standard Schedule ( District C) Revenue period: 25 P4P Equivalent Pennies: 6.7 Include carrying cost?: No TOD Deduction: 0.00% Discount Rate: 3.30% 2nd LOFT County pennies to capacity: 5.0 Include Interstates?: Yes TND Deduction: 0.00% Fuel efficiency: Existing State pennies to capacity: MUTRM Deduction: 0.00% Days/yr: 365 Tax Inc Fin Millage Rate to capacity: Factor to convert VMT to PMT: 1.42 Existing County pennies to capital: 0 Toll.fwy discount: 1.7% Land Use Unit Trip Rate (veh trips) TGR Standard Trip Length TL Market Area Trip Length Adjustment Factor Chargeable Trip length (mi) Trip length for revenue (mi) % New Trips % NT Gross assessable pmt/day Weighted Capacity Addition Ratio Needed PMC Needed PMC After Fwy/Toll/ TOD/TND/ MUTRM Deduct Weighted Cost/PMC Impact Cost PV County Gas Tax ($$/yr): PV P4P Equivalent PV Federal/ State Gas Tax Revenue ($$/yr) PV Sub Countywide selfcredits: PV Tax Before Increment % Self RETAIL: Mini Warehouse 1,000 sf 1.51 B 3.26 K % N $401 $1,664 $54 $72 $303 $429 $74 $1,162 45% $526 $636 $1,248 $606 $493 $113 $19 $11 $636 0% Hardware/Paint 1,000 sf 9.14 B 1.96 R % R $406 $3,736 $127 $171 $718 $1,016 $351 $2,369 58% $1,363 $1,006 $2,563 $959 $771 $188 $29 $18 $5,812 83% Retail 50,000 sfgla or less (4) 1,000 sfgla G 1.96 S % S $406 $30,676 $1,046 $1,400 $5,895 $8,342 $351 $21,983 55% $12,125 $9,858 $23,577 $9,400 $7,556 $1,844 $281 $177 $9,858 0% 820.1P Retail 50, ,000 sfgla (4) 1,000 sfgla G 2.52 S % S $404 $30,111 $996 $1,332 $5,609 $7,937 $369 $21,805 60% $12,992 $8,813 $23,370 $8,402 $6,786 $1,616 $252 $159 $8,813 0% 820.2P Retail 200, ,000 sfgla (4) 1,000 sfgla G 2.77 S % S $402 $28,765 $944 $1,263 $5,318 $7,525 $369 $20,872 61% $12,665 $8,207 $22,366 $7,825 $6,345 $1,480 $234 $148 $8,207 0% 820.3P Retail 400, ,000 sfgla (4) 1,000 sfgla G 3.01 S % S $402 $28,582 $929 $1,243 $5,233 $7,405 $1,111 $20,066 61% $12,316 $7,750 $21,551 $7,389 $5,991 $1,398 $221 $140 $7,750 0% 820.4P Retail 600, ,000 sfgla (4) 1,000 sfgla G 3.26 S % S $401 $29,249 $946 $1,265 $5,327 $7,538 $1,111 $20,600 61% $12,605 $7,995 $22,120 $7,623 $6,201 $1,422 $228 $144 $7,995 0% 820.5P Retail greater than 800,000 sfgla (5) 1,000 sfgla G 3.51 S % S $400 $27,916 $898 $1,202 $5,060 $7,160 $1,111 $19,644 58% $11,316 $8,328 $21,095 $7,940 $6,476 $1,464 $238 $150 $8,328 0% Specialty Retail 1,000 sf H 3.54 C % C $400 $55,126 $1,772 $2,371 $9,984 $14,128 $351 $40,647 62% $25,207 $15,440 $43,512 $14,721 $12,007 $2,714 $441 $278 $15,440 0% 830.P n/a Non Veterinary Kennel 1,000 sf Y 2.13 C % C $406 $21,649 $740 $991 $4,171 $5,902 $351 $15,396 60% $9,305 $6,091 $16,520 $5,807 $4,667 $1,140 $174 $110 new n/a New/Used Auto Sales 1,000 sf B 4.83 C % C $398 $38,707 $1,219 $1,631 $6,868 $9,719 $233 $28,755 60% $17,271 $11,484 $30,767 $10,949 $8,986 $1,963 $328 $207 $11,484 0% Tire Store 1,000 sf B 3.80 T % T $400 $28,597 $913 $1,222 $5,145 $7,280 $351 $20,966 67% $14,038 $6,928 $22,452 $6,605 $5,387 $1,218 $198 $125 $6,928 0% Supermarket 1,000 sf B 2.18 C % C $406 $48,544 $1,629 $2,179 $9,176 $12,984 $195 $35,365 63% $22,283 $13,082 $37,887 $12,474 $10,026 $2,448 $373 $235 $13,082 0% Convenience Store w/gas Pumps 1,000 sf D 1.59 C % C $414 $81,173 $2,990 $4,001 $16,845 $23,836 $341 $56,996 54% $30,595 $26,401 $61,214 $25,173 $19,925 $5,248 $753 $475 $26,401 0% Home Improvement Superstore 1,000 sf B 2.52 U % U $404 $19,219 $635 $850 $3,580 $5,066 $369 $13,785 64% $8,868 $4,917 $14,783 $4,687 $3,785 $902 $141 $89 $4,917 0% Pharmacy/Drug Store with and without Drive Thru 1,000 sf D 2.18 C % C $406 $26,017 $873 $1,168 $4,918 $6,959 $351 $18,707 63% $11,810 $6,897 $20,059 $6,576 $5,286 $1,290 $197 $124 $6,897 0% Furniture Store 1,000 sf 6.30 B 6.39 C % C $396 $7,885 $245 $328 $1,380 $1,953 $351 $5,581 69% $3,839 $1,742 $5,991 $1,661 $1,371 $290 $50 $31 $1,742 0% Bank/Savings w/drive In 1,000 sf D 2.58 C % C $406 $33,619 $1,147 $1,534 $6,460 $9,141 $526 $23,952 35% $8,370 $15,582 $25,699 $14,857 $11,942 $2,915 $445 $280 $15,582 0% 929P n/a Breakfast and Lunch Restaurant 1,000 sf Y 3.33 C % C $404 $49,268 $1,628 $2,179 $9,172 $12,978 $263 $36,027 58% $21,055 $14,972 $38,587 $14,276 $11,531 $2,745 $427 $269 new n/a Fast Casual Restaurant 1,000 sf Y 3.33 C % C $404 $119,695 $3,955 $5,293 $22,283 $31,530 $263 $87,902 58% $51,369 $36,533 $94,121 $34,833 $28,134 $6,699 $1,042 $658 new n/a Quality Restaurant 1,000 sf D 3.30 C % C $401 $81,621 $2,635 $3,526 $14,846 $21,008 $263 $60,350 61% $36,615 $23,735 $64,591 $22,631 $18,409 $4,222 $677 $427 $23,735 0% High Turnover Restaurant 1,000 sf D 3.33 C % C $401 $96,249 $3,105 $4,155 $17,491 $24,750 $263 $71,236 59% $41,960 $29,276 $76,238 $27,914 $22,706 $5,208 $835 $527 $29,276 0% Fast Food Restaurant w/drive Thru 1,000 sf D 2.15 C % C $410 $175,666 $6,138 $8,213 $34,580 $48,931 $1,155 $125,581 59% $74,603 $50,978 $134,709 $48,607 $38,820 $9,787 $1,453 $918 $50,978 0% Quick Lube bays B 3.80 T % T $402 $30,687 $1,002 $1,341 $5,645 $7,987 $117 $22,583 50% $11,404 $11,179 $24,177 $10,659 $8,643 $2,016 $319 $201 $11,179 0% Auto Repair or Body Shop 1,000 sf H 3.80 T % T $400 $31,514 $1,006 $1,347 $5,670 $8,023 $233 $23,258 59% $13,741 $9,517 $24,896 $9,074 $7,401 $1,673 $272 $171 $9,517 0% Gasoline Station fuel pos B 2.00 C % C $410 $22,582 $800 $1,071 $4,508 $6,379 $85 $16,117 61% $9,759 $6,358 $17,291 $6,062 $4,841 $1,221 $182 $114 $6,358 0% Self Service Car Wash bays D 2.29 C % C $410 $19,528 $674 $902 $3,800 $5,377 $34 $14,117 13% $1,822 $12,295 $15,132 $11,723 $9,363 $2,360 $351 $221 $12,295 0% 913.P 913 Convenience/Gasoline/Fast Food Store 1,000 sf D 2.78 C % C $406 $248,042 $8,361 $11,188 $47,103 $66,652 $341 $181,049 62% $111,918 $69,131 $193,938 $65,916 $52,981 $12,935 $1,971 $1,244 $69,131 0% INDUSTRIAL: General Light Industrial 1,000 sf 4.96 B 5.41 N % N $398 $7,689 $243 $325 $1,369 $1,937 $325 $5, % $5,427 $0 $5,826 $0 $0 $0 $0 $0 $0 0% General Heavy Industrial 1,000 sf 1.50 B 5.41 N % N $398 $2,325 $73 $98 $414 $586 $325 $1, % $1,414 $0 $1,535 $0 $0 $0 $0 $0 $0 0% Industrial Park 1,000 sf 3.37 B 5.41 N % N $398 $5,224 $165 $221 $930 $1,316 $325 $3, % $3,583 $0 $3,854 $0 $0 $0 $0 $0 $0 0% Manufacturing 1,000 sf 3.93 B 5.41 N % N $398 $6,092 $192 $258 $1,085 $1,535 $325 $4, % $4,232 $0 $4,549 $0 $0 $0 $0 $0 $0 0% Passive Warehouse (Storage Warehouse) 1,000 sf 1.74 B 5.41 N % N $398 $2,697 $85 $114 $480 $679 $240 $1, % $1,778 $0 $1,918 $0 $0 $0 $0 $0 new n/a /156 Active Warehouse (Fulfillment Center/Parcel Hub) 1,000 sf 7.97 B 6.95 M % N $396 $15,804 $493 $659 $2,776 $3,928 $240 $11, % $11,636 $0 $12,457 $0 $0 $0 $0 $0 new n/a 160.P 153 Airport Hangar 1,000 sf 3.56 H 5.41 N % N $398 $5,519 $174 $233 $982 $1,390 $325 $3, % $3,803 $0 $4,090 $0 $0 $0 $0 $0 $0 0% OTHER: n/a n/a Mining 1,000 cy 0.01 H I % I $395 $88 $0 $2 $17 $19 $3 $66 15% $10 $56 $70 $53 $44 $9 $2 $1 $56 0% $$ Allocated for Net Mobility Full (1) Notes: (1) This value is the total value of transportation system consumed, less credits for revenues committed to transportation system expansion that are generated by the use itself. This value includes Interstate costs and "carrying costs", but not toll road costs. It does consider the proportion of trip length, varying system costs, and transportation system performance goals that vary by fee district. (2) Specific calculations for the "low income" category can be seen in Appendix B of the 2014 Mobility Update Study. (3) The statistical relationship between the trip generation rate for the age restricted single family, age restricted multi family, and congregate care facility was used to interpolate the trip length. (4) The trip generation rate recommended for the office and retail size categories used the end point of the range due to the nature of the ITE equation to be conservative for smaller developments. (5) The trip generation rate used for the office and retail open ended size categories used the size 200,000 s.f. larger than the beginning of the size range, as the size ranges increase in 200,000 s.f. increments. s of trip rate, percent new trips, and trip length are as follows: (A) National studies (NHTS, AHS, Census) (I) Independent Study (Collier County) (Q) Same as LUC 770 (Business Park) (Y) Other National Studies (B) ITE 10th Edition Trip Generation (J) Same as LUC 220 (R) Same as LUC 820 (<50k) (C) Florida Studies Database (K) Florida Schedules (S) FL Curve (D) Blend ITE 10th & FL Studies (L) Same as LUC 240 (T) Same as LUC 942 (Auto Care Center) (E) Blend ITE 6th & FL Studies (M) Same as LUC 210 (U) Same as LUC 820 (50k 200k) (F) ITE Regression Analysis (N) Same as LUC 710 (V) n/a (G) ITE 10th equation (O) Model Based Trip Length (W) Same as LUC 492 (Health Club) (H) Previous Pasco MMTIF Study (P) Same as LUC 630 (Clinic) (X) Same as LUC 595 (DayCare) F:\WEO PE\Projects\ AECOM Pasco Mobilty 2017\3. Analysis\ Schedule Spreadsheets\[Mobility Schedules 2018 v6.xlsm]urban (Incl Int) Interstate/ SIS (Excl Int) Transit Bike/Ped 2014 Mobility Percent change from 2014 to 2018 Net Mobility 4-21
46 County wide Parameters: Pasco County Land Use Code ITE LUC Table 4 11 Rural Mixed Use Trip Reduction Measures Schedule ( District C) Revenue period: 25 P4P Equivalent Pennies: 6.7 Include carrying cost?: No TOD Deduction: 0.00% Discount Rate: 3.30% 2nd LOFT County pennies to capacity: 5 Include Interstates?: Yes TND Deduction: 0.00% Fuel efficiency: Existing State pennies to capacity: MUTRM Deduction: 8.02% Days/yr: 365 Tax Inc Fin Millage Rate to capacity: Factor to convert VMT to PMT: 1.42 Existing County pennies to capital: 0 Toll.fwy discount: 1.7% Land Use Unit Trip Rate (veh trips) TGR Standard Trip Length TL Market Area Trip Length Adjustment Factor Chargeable Trip length (mi) Trip length for revenue (mi) % New Trips % NT Gross assessable pmt/day Weighted Capacity Addition Ratio Needed PMC Needed PMC After Fwy/Toll/ TOD/TND/ MUTRM Deduct Weighted Cost/PMC Impact Cost PV County Gas Tax ($$/yr): PV P4P Equivalent PV Federal/ State Gas Tax Revenue ($$/yr) PV Sub Countywide selfcredits: PV Tax Before Increment % Self RESIDENTIAL: Single Family (Detached) 210.1P Less than 1,500 s.f. & Annual Hh Income less than 80% SHIP Definition (2) du 4.10 A 7.61 C % V $395 $9,730 $ $ $1, $2,400 $305 $7,024 40% $2,829 $4,195 $7,530 $3,999 $3,307 $692 $120 $76 $4,195 0% 210.2P to 1,500 s.f. du 6.25 A 7.61 C % V $395 $14,832 $ $ $2, $3,659 $305 $10,868 52% $5,598 $5,270 $11,638 $5,024 $4,155 $869 $151 $95 $5,270 0% 210.3P ,501 to 2,499 s.f. du 7.81 A 7.61 C % V $395 $18,534 $ $ $3, $4,572 $305 $13,657 46% $6,307 $7,350 $14,620 $7,008 $5,796 $1,212 $210 $132 $7,350 0% 210.4P ,500 s.f. and greater du 9.20 A 7.61 C % V $395 $21,832 $ $ $3, $5,386 $305 $16,141 50% $8,099 $8,042 $17,276 $7,667 $6,340 $1,327 $230 $145 $8,042 0% 210.5P "Low Income" SHIP defined Multi Family (2) du 3.46 A 5.87 C % V $397 $6,356 $ $ $1, $1,586 $207 $4,563 40% $1,841 $2,722 $4,893 $2,595 $2,136 $459 $78 $49 $2,722 0% Multi Family Apartments du 6.60 B 5.87 C % V $397 $12,124 $ $ $2, $3,025 $616 $8,482 41% $3,461 $5,021 $9,112 $4,787 $3,941 $846 $144 $90 $5,021 0% Low Rise Condominium/Townhouse (1 to 2 stories) du 6.40 H 5.87 J % V $397 $11,756 $ $ $2, $2,933 $550 $8,273 39% $3,221 $5,052 $8,884 $4,817 $3,965 $852 $144 $91 $5,052 0% High Rise Condominium (3 or more stories) du 4.18 H 5.87 J % V $397 $7,678 $ $ $1, $1,916 $550 $5,212 25% $1,297 $3,915 $5,611 $3,733 $3,073 $660 $112 $70 $3,915 0% Mobile Home Park du 4.17 C 5.29 C % V $397 $6,911 $ $ $1, $1,735 $111 $5,066 45% $2,268 $2,798 $5,425 $2,668 $2,193 $475 $80 $50 $2,798 0% Age Restricted Single Family (3) du 3.62 D 6.23 C % V $396 $7,050 $ $ $1, $1,754 $558 $4,738 48% $2,278 $2,460 $5,104 $2,345 $1,933 $412 $71 $44 $2,460 0% Age Restricted Multi Family (3) du 3.45 D 3.77 C % V $400 $4,104 $ $ $ $1,052 $616 $2,436 46% $1,123 $1,313 $2,649 $1,251 $1,020 $231 $38 $24 $1,313 0% Congregate Care Facility (Attached) (3) du 2.02 B 3.54 C % C $401 $1,629 $52.57 $70.35 $ $419 $112 $1,098 33% $364 $734 $1,183 $700 $569 $131 $21 $13 $734 0% LODGING: Hotel room 8.36 D 7.20 C % C $395 $12,015 $ $ $2, $2,975 $214 $8, % $8,825 $0 $9,450 $0 $0 $0 $0 $0 $0 0% Motel room 3.35 D 4.99 C % C $398 $3,920 $ $ $ $987 $128 $2, % $2,804 $0 $3,008 $0 $0 $0 $0 $0 $0 0% Resort Hotel room 5.83 H 7.02 C % C $396 $10,282 $ $ $1, $2,548 $214 $7, % $7,520 $0 $8,054 $0 $0 $0 $0 $0 $0 0% RECREATION: General Recreation acre 2.28 H 5.37 K % K $398 $3,351 $ $ $ $841 $74 $2,436 68% $1,651 $785 $2,610 $748 $614 $134 $23 $14 $785 0% RV Park RV space 1.62 H 4.83 L % L $398 $2,383 $75.49 $ $ $602 $111 $1,670 50% $827 $843 $1,794 $803 $658 $145 $25 $15 $843 0% Marina berth 2.41 B 6.95 M % K $396 $4,563 $ $ $ $1,131 $117 $3,315 57% $1,875 $1,440 $3,552 $1,372 $1,132 $240 $42 $26 $1,440 0% Golf Course hole B 6.95 M % K $396 $57,517 $1, $2, $10, $14,260 $106 $43,151 59% $25,494 $17,657 $46,140 $16,835 $13,893 $2,942 $504 $318 $17,657 0% Miniature Golf Course hole 3.30 H 6.95 M % K $396 $6,248 $ $ $1, $1,549 $52 $4,646 72% $3,350 $1,296 $4,971 $1,236 $1,020 $216 $37 $23 $1,296 0% Bowling Alley 1,000 sf H 5.41 N % K $398 $49,344 $1, $2, $8, $12,375 $151 $36,818 68% $25,158 $11,660 $39,382 $11,117 $9,123 $1,994 $333 $210 $11,660 0% Movie Theater screen H 2.33 C % C $406 $67,940 $2, $3, $12, $18,257 $777 $48,907 67% $32,816 $16,091 $52,437 $15,342 $12,331 $3,011 $459 $290 $16,091 0% Racquet Club/Health Club/Spa/Dance Studio 1,000 sf H 5.41 N % W $398 $21,694 $ $ $3, $5,441 $151 $16,103 68% $10,995 $5,108 $17,230 $4,870 $3,997 $873 $146 $92 $5,108 0% Community Center/Gymnasium 1,000 sf B 7.06 K % K $396 $55,427 $1, $2, $9, $13,729 $151 $41,547 75% $31,080 $10,467 $44,427 $9,980 $8,236 $1,744 $299 $188 $10,467 0% 496P n/a Ice Skating Arena 1,000 sf 9.95 H 9.21 H % K $356 $22,431 $ $1, $4, $6,103 $151 $16,178 93% $15,090 $1,088 $17,343 $1,036 $887 $149 $32 $20 new n/a INSTITUTIONS: Elementary School student 1.89 B 4.52 O % K $399 $2,082 $66.19 $88.58 $ $528 $11 $1,543 57% $879 $664 $1,651 $633 $517 $116 $19 $12 $664 0% Middle School student 2.13 B 4.52 O % K $399 $2,639 $83.92 $ $ $669 $13 $1,957 52% $1,014 $943 $2,095 $899 $735 $164 $27 $17 $943 0% High School student 2.03 B 4.52 O % K $399 $2,516 $79.98 $ $ $638 $14 $1,864 47% $868 $996 $1,995 $949 $776 $173 $29 $18 $996 0% University/Jr College (7,500 or fewer students) (Private) student 1.74 B 6.95 M % K $396 $3,290 $ $ $ $816 $15 $2,459 25% $618 $1,841 $2,630 $1,755 $1,448 $307 $53 $33 $1,841 0% University/Jr College (more than 7,500 students) (Private) student 1.21 B 6.95 M % K $396 $2,290 $71.21 $95.29 $ $568 $15 $1,707 25% $429 $1,278 $1,826 $1,218 $1,005 $213 $37 $23 $1,376 7% Church 1,000 sf 6.95 B 4.10 K % K $400 $7,830 $ $ $1, $1,997 $0 $5,832 19% $1,137 $4,695 $6,239 $4,476 $3,651 $825 $134 $85 $4,700 0% Day Care student 4.09 B 2.13 C % C $406 $1,973 $67.47 $90.29 $ $538 $9 $1,426 62% $888 $538 $1,529 $512 $411 $101 $16 $10 $538 0% Cemetery acre 6.02 B 6.95 M % H $396 $12,010 $ $ $2, $2,978 $250 $8,782 47% $4,152 $4,630 $9,406 $4,415 $3,644 $771 $132 $83 $4,630 0% Hospital 1,000 sf B 6.95 M % K $396 $17,335 $ $ $3, $4,298 $233 $12,804 19% $2,482 $10,322 $13,704 $9,841 $8,121 $1,720 $295 $186 $10,350 0% Nursing Home bed 3.06 B 2.72 C % C $404 $2,285 $75.78 $ $ $604 $112 $1,569 46% $727 $842 $1,688 $803 $649 $154 $24 $15 $842 0% OFFICE: General Office 50,000 sf or less (4) 1,000 sf G 5.41 C % C $398 $16,367 $ $ $2, $4,105 $381 $11, % $11,881 $0 $12,731 $0 $0 $0 $0 $0 $0 0% 710.1P General Office 50, ,000 sf (4) 1,000 sf G 5.41 C % C $398 $16,031 $ $ $2, $4,021 $525 $11, % $11,485 $0 $12,318 $0 $0 $0 $0 $0 $0 0% 710.2P General Office 100, ,000 sf (4) 1,000 sf G 5.41 C % C $398 $15,701 $ $ $2, $3,938 $525 $11, % $11,238 $0 $12,054 $0 $0 $0 $0 $0 $0 0% 710.3P General Office 200, ,000 sf (4) 1,000 sf G 5.41 C % C $398 $15,378 $ $ $2, $3,857 $525 $10, % $10,996 $0 $11,795 $0 $0 $0 $0 $0 $0 0% 710.4P General Office greater than 400,000 sf (5) 1,000 sf 9.97 G 5.41 C % C $398 $15,061 $ $ $2, $3,778 $525 $10, % $10,759 $0 $11,541 $0 $0 $0 $0 $0 $0 0% Corporate Headquarters Building 1,000 sf 7.95 H 5.41 N % N $398 $12,011 $ $ $2, $3,013 $525 $8, % $8,474 $0 $9,098 $0 $0 $0 $0 $0 $0 0% Medical Office 1,000 sf B 5.83 C % C $397 $54,735 $1, $2, $9, $13,676 $525 $40, % $40,534 $0 $43,378 $0 $0 $0 $0 $0 $0 0% Office Park 1,000 sf D 7.47 C % Q $395 $23,485 $ $ $4, $5,805 $525 $17, % $17,156 $0 $18,376 $0 $0 $0 $0 $0 $0 0% Research and Development Center 1,000 sf D 5.65 Q % Q $397 $17,164 $ $ $3, $4,298 $525 $12, % $12,341 $0 $13,233 $0 $0 $0 $0 $0 $0 0% 770.P 640 Veterinarian Clinic 1,000 sf B 5.36 P % P $398 $32,532 $1, $1, $5, $8,165 $381 $23, % $23,986 $0 $25,676 $0 $0 $0 $0 $0 $0 0% $$ Allocated for Net Mobility Full (1) (Incl Int) Interstate/ SIS (Excl Int) Transit Bike/Ped 2014 Mobility Percent change from 2014 to 2018 Net Mobility 4-22
47 County wide Parameters: Pasco County Land Use Code ITE LUC Table 4 11 (continued) Rural Mixed Use Trip Reduction Measures Schedule ( District C) Revenue period: 25 P4P Equivalent Pennies: 6.7 Include carrying cost?: No TOD Deduction: 0.00% Discount Rate: 3.30% 2nd LOFT County pennies to capacity: 5 Include Interstates?: Yes TND Deduction: 0.00% Fuel efficiency: Existing State pennies to capacity: MUTRM Deduction: 8.02% Days/yr: 365 Tax Inc Fin Millage Rate to capacity: Factor to convert VMT to PMT: 1.42 Existing County pennies to capital: 0 Toll.fwy discount: 1.7% Land Use Unit Trip Rate (veh trips) TGR Standard Trip Length TL Market Area Trip Length Adjustment Factor Chargeable Trip length (mi) Trip length for revenue (mi) % New Trips % NT Gross assessable pmt/day Weighted Capacity Addition Ratio Needed PMC Needed PMC After Fwy/Toll/ TOD/TND/ MUTRM Deduct Weighted Cost/PMC Impact Cost PV County Gas Tax ($$/yr): PV P4P Equivalent PV Federal/ State Gas Tax Revenue ($$/yr) PV Sub Countywide selfcredits: PV Tax Before Increment % Self RETAIL: Mini Warehouse 1,000 sf 1.51 B 3.26 K % N $401 $1,531 $49.48 $66.22 $ $394 $74 $1,063 55% $586 $477 $1,142 $454 $369 $85 $14 $9 $477 0% Hardware/Paint 1,000 sf 9.14 B 1.96 R % R $406 $3,436 $ $ $ $934 $351 $2,151 65% $1,396 $755 $2,330 $719 $578 $141 $22 $14 $4,359 83% Retail 50,000 sfgla or less (4) 1,000 sfgla G 1.96 S % S $406 $28,216 $ $1, $5, $7,673 $351 $20,192 63% $12,798 $7,394 $21,658 $7,050 $5,667 $1,383 $211 $133 $7,394 0% 820.1P Retail 50, ,000 sfgla (4) 1,000 sfgla G 2.52 S % S $404 $27,696 $ $1, $5, $7,300 $369 $20,027 67% $13,417 $6,610 $21,466 $6,302 $5,090 $1,212 $189 $119 $6,610 0% 820.2P Retail 200, ,000 sfgla (4) 1,000 sfgla G 2.77 S % S $402 $26,458 $ $1, $4, $6,921 $369 $19,168 68% $13,013 $6,155 $20,543 $5,868 $4,758 $1,110 $176 $111 $6,155 0% 820.3P Retail 400, ,000 sfgla (4) 1,000 sfgla G 3.01 S % S $402 $26,290 $ $1, $4, $6,811 $1,111 $18,367 68% $12,554 $5,813 $19,734 $5,542 $4,494 $1,048 $166 $105 $5,813 0% 820.4P Retail 600, ,000 sfgla (4) 1,000 sfgla G 3.26 S % S $401 $26,903 $ $1, $4, $6,933 $1,111 $18,859 68% $12,863 $5,996 $20,257 $5,717 $4,650 $1,067 $171 $108 $5,996 0% 820.5P Retail greater than 800,000 sfgla (5) 1,000 sfgla G 3.51 S % S $400 $25,677 $ $1, $4, $6,586 $1,111 $17,980 65% $11,734 $6,246 $19,314 $5,955 $4,857 $1,098 $179 $112 $6,246 0% Specialty Retail 1,000 sf H 3.54 C % C $400 $50,705 $1, $2, $9, $12,995 $351 $37,359 69% $25,779 $11,580 $39,994 $11,041 $9,006 $2,035 $331 $208 $11,580 0% 830.P n/a Non Veterinary Kennel 1,000 sf Y 2.13 C % C $406 $19,912 $ $ $3, $5,429 $351 $14,133 68% $9,565 $4,568 $15,167 $4,355 $3,500 $855 $131 $82 new n/a New/Used Auto Sales 1,000 sf B 4.83 C % C $398 $35,603 $1, $1, $6, $8,939 $233 $26,430 67% $17,817 $8,613 $28,280 $8,212 $6,739 $1,473 $246 $155 $8,613 0% Tire Store 1,000 sf B 3.80 T % T $400 $26,303 $ $1, $4, $6,696 $351 $19,256 73% $14,060 $5,196 $20,623 $4,953 $4,040 $913 $149 $94 $5,196 0% Supermarket 1,000 sf B 2.18 C % C $406 $44,651 $1, $2, $8, $11,943 $195 $32,513 70% $22,701 $9,812 $34,833 $9,355 $7,519 $1,836 $280 $177 $9,812 0% Convenience Store w/gas Pumps 1,000 sf D 1.59 C % C $414 $74,663 $2, $3, $15, $21,924 $341 $52,397 62% $32,596 $19,801 $56,277 $18,880 $14,944 $3,936 $565 $356 $19,801 0% Home Improvement Superstore 1,000 sf B 2.52 U % U $404 $17,678 $ $ $3, $4,660 $369 $12,649 71% $8,961 $3,688 $13,568 $3,516 $2,840 $676 $106 $66 $3,688 0% Pharmacy/Drug Store with and without Drive Thru 1,000 sf D 2.18 C % C $406 $23,930 $ $1, $4, $6,401 $351 $17,179 70% $12,006 $5,173 $18,422 $4,932 $3,964 $968 $148 $93 $5,173 0% Furniture Store 1,000 sf 6.30 B 6.39 C % C $396 $7,253 $ $ $1, $1,797 $351 $5,105 74% $3,798 $1,307 $5,482 $1,245 $1,027 $218 $38 $24 $1,307 0% Bank/Savings w/drive In 1,000 sf D 2.58 C % C $406 $30,923 $1, $1, $5, $8,407 $526 $21,989 47% $10,302 $11,687 $23,596 $11,143 $8,956 $2,187 $334 $210 $11,687 0% 929P n/a Breakfast and Lunch Restaurant 1,000 sf Y 3.33 C % C $404 $45,317 $1, $2, $8, $11,938 $263 $33,116 66% $21,887 $11,229 $35,471 $10,706 $8,647 $2,059 $321 $202 new n/a Fast Casual Restaurant 1,000 sf Y 3.33 C % C $404 $110,095 $3, $4, $20, $29,002 $263 $80,831 66% $53,431 $27,400 $86,552 $26,126 $21,102 $5,024 $781 $493 new n/a Quality Restaurant 1,000 sf D 3.30 C % C $401 $75,075 $2, $3, $13, $19,323 $263 $55,488 68% $37,687 $17,801 $59,390 $16,973 $13,807 $3,166 $508 $320 $17,801 0% High Turnover Restaurant 1,000 sf D 3.33 C % C $401 $88,530 $2, $3, $16, $22,765 $263 $65,502 66% $43,545 $21,957 $70,102 $20,936 $17,030 $3,906 $626 $395 $21,957 0% Fast Food Restaurant w/drive Thru 1,000 sf D 2.15 C % C $410 $161,578 $5, $7, $31, $45,006 $1,155 $115,417 67% $77,183 $38,234 $123,813 $36,456 $29,116 $7,340 $1,090 $688 $38,234 0% Quick Lube bays B 3.80 T % T $402 $28,226 $ $1, $5, $7,347 $117 $20,762 60% $12,378 $8,384 $22,229 $7,994 $6,482 $1,512 $239 $151 $8,384 0% Auto Repair or Body Shop 1,000 sf H 3.80 T % T $400 $28,987 $ $1, $5, $7,380 $233 $21,374 67% $14,236 $7,138 $22,880 $6,806 $5,551 $1,255 $204 $128 $7,138 0% Gasoline Station fuel pos B 2.00 C % C $410 $20,771 $ $ $4, $5,867 $85 $14,818 68% $10,049 $4,769 $15,897 $4,547 $3,631 $916 $136 $86 $4,769 0% Self Service Car Wash bays D 2.29 C % C $410 $17,962 $ $ $3, $4,945 $34 $12,982 29% $3,761 $9,221 $13,915 $8,792 $7,022 $1,770 $263 $166 $9,221 0% 913.P 913 Convenience/Gasoline/Fast Food Store 1,000 sf D 2.78 C % C $406 $228,149 $7, $10, $43, $61,306 $341 $166,501 69% $114,653 $51,848 $178,357 $49,437 $39,736 $9,701 $1,478 $933 $51,848 0% INDUSTRIAL: General Light Industrial 1,000 sf 4.96 B 5.41 N % N $398 $7,072 $ $ $1, $1,781 $325 $4, % $4,965 $0 $5,333 $0 $0 $0 $0 $0 $0 0% General Heavy Industrial 1,000 sf 1.50 B 5.41 N % N $398 $2,139 $67.58 $90.43 $ $539 $325 $1, % $1,275 $0 $1,386 $0 $0 $0 $0 $0 $0 0% Industrial Park 1,000 sf 3.37 B 5.41 N % N $398 $4,805 $ $ $ $1,210 $325 $3, % $3,269 $0 $3,519 $0 $0 $0 $0 $0 $0 0% Manufacturing 1,000 sf 3.93 B 5.41 N % N $398 $5,604 $ $ $ $1,412 $325 $3, % $3,867 $0 $4,158 $0 $0 $0 $0 $0 $0 0% Passive Warehouse (Storage Warehouse) 1,000 sf 1.74 B 5.41 N % N $398 $2,481 $78.39 $ $ $625 $240 $1, % $1,616 $0 $1,745 $0 $0 $0 $0 $0 new n/a /156 Active Warehouse (Fulfillment Center/Parcel Hub) 1,000 sf 7.97 B 6.95 M % N $396 $14,537 $ $ $2, $3,613 $240 $10, % $10,683 $0 $11,439 $0 $0 $0 $0 $0 new n/a 160.P 153 Airport Hangar 1,000 sf 3.56 H 5.41 N % N $398 $5,076 $ $ $ $1,279 $325 $3, % $3,472 $0 $3,736 $0 $0 $0 $0 $0 $0 0% $$ Allocated for Net Mobility Full (1) (Incl Int) Interstate/ SIS (Excl Int) ######### $0 #DIV/0! Notes: (1) This value is the total value of transportation system consumed, less credits for revenues committed to transportation system expansion that are generated by the use itself. This value includes Interstate costs and "carrying costs", but not toll road costs. It does consider the proportion of trip length, varying system costs, and transportation system performance goals that vary by fee district. (2) Specific calculations for the "low income" category can be seen in Appendix B of the 2014 Mobility Update Study. (3) The statistical relationship between the trip generation rate for the age restricted single family, age restricted multi family, and congregate care facility was used to interpolate the trip length. (4) The trip generation rate recommended for the office and retail size categories used the end point of the range due to the nature of the ITE equation to be conservative for smaller developments. (5) The trip generation rate used for the office and retail open ended size categories used the size 200,000 s.f. larger than the beginning of the size range, as the size ranges increase in 200,000 s.f. increments. s of trip rate, percent new trips, and trip length are as follows: (A) National studies (NHTS, AHS, Census) (I) Independent Study (Collier County) (Q) Same as LUC 770 (Business Park) (Y) Other National Studies (B) ITE 10th Edition Trip Generation (J) Same as LUC 220 (R) Same as LUC 820 (<50k) (C) Florida Studies Database (K) Florida Schedules (S) FL Curve (D) Blend ITE 10th & FL Studies (L) Same as LUC 240 (T) Same as LUC 942 (Auto Care Center) (E) Blend ITE 6th & FL Studies (M) Same as LUC 210 (U) Same as LUC 820 (50k 200k) (F) ITE Regression Analysis (N) Same as LUC 710 (V) n/a (G) ITE 10th equation (O) Model Based Trip Length (W) Same as LUC 492 (Health Club) (H) Previous Pasco MMTIF Study (P) Same as LUC 630 (Clinic) (X) Same as LUC 595 (DayCare) F:\WEO PE\Projects\ AECOM Pasco Mobilty 2017\3. Analysis\ Schedule Spreadsheets\[Mobility Schedules 2018 v6.xlsm]urban Transit Bike/Ped 2014 Mobility Percent change from 2014 to 2018 Net Mobility 4-23
48 County wide Parameters: Pasco County Land Use Code ITE LUC Table 4 12 Rural Traditional Neighborhood Development Schedule ( District C) Revenue period: 25 P4P Equivalent Pennies: 6.7 Include carrying cost?: No TOD Deduction: 0.00% Discount Rate: 3.30% 2nd LOFT County pennies to capacity: 5 Include Interstates?: Yes TND Deduction: 11.36% Fuel efficiency: Existing State pennies to capacity: MUTRM Deduction: 0.00% Days/yr: 365 Tax Inc Fin Millage Rate to capacity: Factor to convert VMT to PMT: 1.42 Existing County pennies to capital: 0 Toll.fwy discount: 1.7% Land Use Unit Trip Rate (veh trips) TGR Standard Trip Length TL Market Area Trip Length Adjustment Factor Chargeable Trip length (mi) Trip length for revenue (mi) % New Trips % NT Gross assessable pmt/day Weighted Capacity Addition Ratio Needed PMC Needed PMC After Fwy/Toll/ TOD/TND/ MUTRM Deduct Weighted Cost/PMC Impact Cost PV County Gas Tax ($$/yr): PV P4P Equivalent PV Federal/ State Gas Tax Revenue ($$/yr) PV Sub Countywide selfcredits: PV Tax Before Increment % Self RESIDENTIAL: Single Family (Detached) 210.1P Less than 1,500 s.f. & Annual Hh Income less than 80% SHIP Definition (2) du 4.10 A 7.61 C % V $395 $9,376 $ $ $1, $2,313 $305 $6,758 59% $3,961 $2,797 $7,245 $2,667 $2,206 $461 $80 $50 $2,797 0% 210.2P to 1,500 s.f. du 6.25 A 7.61 C % V $395 $14,293 $ $ $2, $3,526 $305 $10,462 66% $6,949 $3,513 $11,205 $3,349 $2,770 $579 $101 $63 $3,513 0% 210.3P ,501 to 2,499 s.f. du 7.81 A 7.61 C % V $395 $17,861 $ $ $3, $4,406 $305 $13,150 63% $8,250 $4,900 $14,078 $4,672 $3,864 $808 $140 $88 $4,900 0% 210.4P ,500 s.f. and greater du 9.20 A 7.61 C % V $395 $21,039 $ $ $3, $5,190 $305 $15,544 66% $10,182 $5,362 $16,637 $5,112 $4,228 $884 $153 $97 $5,362 0% 210.5P "Low Income" SHIP defined Multi Family (2) du 3.46 A 5.87 C % V $397 $6,125 $ $ $1, $1,528 $207 $4,390 59% $2,575 $1,815 $4,708 $1,730 $1,424 $306 $52 $33 $1,815 0% Multi Family Apartments du 6.60 B 5.87 C % V $397 $11,683 $ $ $2, $2,915 $616 $8,152 59% $4,805 $3,347 $8,759 $3,191 $2,627 $564 $96 $60 $3,347 0% Low Rise Condominium/Townhouse (1 to 2 stories) du 6.40 H 5.87 J % V $397 $11,329 $ $ $1, $2,827 $550 $7,952 58% $4,584 $3,368 $8,541 $3,211 $2,643 $568 $96 $61 $3,368 0% High Rise Condominium (3 or more stories) du 4.18 H 5.87 J % V $397 $7,400 $ $ $1, $1,846 $550 $5,003 48% $2,393 $2,610 $5,388 $2,488 $2,048 $440 $75 $47 $2,610 0% Mobile Home Park du 4.17 C 5.29 C % V $397 $6,660 $ $ $1, $1,672 $111 $4,878 62% $3,012 $1,866 $5,224 $1,778 $1,461 $317 $54 $34 $1,866 0% Age Restricted Single Family (3) du 3.62 D 6.23 C % V $396 $6,794 $ $ $1, $1,691 $558 $4,545 64% $2,905 $1,640 $4,898 $1,563 $1,288 $275 $47 $30 $1,640 0% Age Restricted Multi Family (3) du 3.45 D 3.77 C % V $400 $3,955 $ $ $ $1,014 $616 $2,325 62% $1,450 $875 $2,530 $834 $680 $154 $25 $16 $875 0% Congregate Care Facility (Attached) (3) du 2.02 B 3.54 C % C $401 $1,570 $50.66 $67.80 $ $404 $112 $1,054 54% $565 $489 $1,136 $466 $379 $87 $14 $9 $489 0% LODGING: Hotel room 8.36 D 7.20 C % C $395 $11,578 $ $ $2, $2,867 $214 $8, % $8,497 $0 $9,099 $0 $0 $0 $0 $0 $0 0% Motel room 3.35 D 4.99 C % C $398 $3,778 $ $ $ $952 $128 $2, % $2,698 $0 $2,894 $0 $0 $0 $0 $0 $0 0% Resort Hotel room 5.83 H 7.02 C % C $396 $9,908 $ $ $1, $2,455 $214 $7, % $7,239 $0 $7,754 $0 $0 $0 $0 $0 $0 0% RECREATION: General Recreation acre 2.28 H 5.37 K % K $398 $3,229 $ $ $ $810 $74 $2,345 78% $1,821 $524 $2,512 $500 $410 $90 $15 $9 $524 0% RV Park RV space 1.62 H 4.83 L % L $398 $2,296 $72.75 $97.35 $ $580 $111 $1,605 65% $1,043 $562 $1,725 $535 $438 $97 $17 $10 $562 0% Marina berth 2.41 B 6.95 M % K $396 $4,397 $ $ $ $1,090 $117 $3,190 70% $2,230 $960 $3,419 $915 $755 $160 $28 $17 $960 0% Golf Course hole B 6.95 M % K $396 $55,428 $1, $2, $9, $13,742 $106 $41,580 72% $29,809 $11,771 $44,460 $11,223 $9,262 $1,961 $336 $212 $11,771 0% Miniature Golf Course hole 3.30 H 6.95 M % K $396 $6,021 $ $ $1, $1,493 $52 $4,476 81% $3,612 $864 $4,789 $823 $679 $144 $25 $16 $864 0% Bowling Alley 1,000 sf H 5.41 N % K $398 $47,552 $1, $2, $8, $11,926 $151 $35,476 78% $27,702 $7,774 $37,947 $7,412 $6,083 $1,329 $222 $140 $7,774 0% Movie Theater screen H 2.33 C % C $406 $65,473 $2, $2, $12, $17,594 $777 $47,102 77% $36,375 $10,727 $50,505 $10,228 $8,221 $2,007 $306 $193 $10,727 0% Racquet Club/Health Club/Spa/Dance Studio 1,000 sf H 5.41 N % W $398 $20,906 $ $ $3, $5,243 $151 $15,513 78% $12,107 $3,406 $16,599 $3,247 $2,665 $582 $98 $61 $3,406 0% Community Center/Gymnasium 1,000 sf B 7.06 K % K $396 $53,414 $1, $2, $9, $13,231 $151 $40,033 83% $33,055 $6,978 $42,808 $6,653 $5,490 $1,163 $199 $126 $6,978 0% 496P n/a Ice Skating Arena 1,000 sf 9.95 H 9.21 H % K $356 $21,616 $ $ $4, $5,881 $151 $15,585 95% $14,859 $726 $16,708 $692 $592 $100 $21 $13 new n/a INSTITUTIONS: Elementary School student 1.89 B 4.52 O % K $399 $2,006 $63.79 $85.36 $ $509 $11 $1,486 70% $1,043 $443 $1,590 $422 $345 $77 $13 $8 $443 0% Middle School student 2.13 B 4.52 O % K $399 $2,544 $80.88 $ $ $645 $13 $1,886 67% $1,257 $629 $2,018 $600 $491 $109 $18 $11 $629 0% High School student 2.03 B 4.52 O % K $399 $2,424 $77.08 $ $ $615 $14 $1,796 63% $1,132 $664 $1,922 $633 $517 $116 $19 $12 $664 0% University/Jr College (7,500 or fewer students) (Private) student 1.74 B 6.95 M % K $396 $3,170 $98.61 $ $ $786 $15 $2,369 48% $1,142 $1,227 $2,534 $1,170 $966 $204 $35 $22 $1,227 0% University/Jr College (more than 7,500 students) (Private) student 1.21 B 6.95 M % K $396 $2,206 $68.62 $91.83 $ $547 $15 $1,644 48% $792 $852 $1,759 $812 $670 $142 $25 $15 $918 7% Church 1,000 sf 6.95 B 4.10 K % K $400 $7,545 $ $ $1, $1,925 $0 $5,620 44% $2,490 $3,130 $6,012 $2,984 $2,434 $550 $90 $56 $3,134 0% Day Care student 4.09 B 2.13 C % C $406 $1,901 $65.02 $87.01 $ $518 $9 $1,374 74% $1,015 $359 $1,473 $342 $275 $67 $11 $6 $359 0% Cemetery acre 6.02 B 6.95 M % H $396 $11,574 $ $ $2, $2,870 $250 $8,454 63% $5,367 $3,087 $9,056 $2,943 $2,429 $514 $88 $56 $3,087 0% Hospital 1,000 sf B 6.95 M % K $396 $16,705 $ $ $2, $4,142 $233 $12,330 44% $5,448 $6,882 $13,198 $6,561 $5,414 $1,147 $197 $124 $6,900 0% Nursing Home bed 3.06 B 2.72 C % C $404 $2,202 $73.03 $97.73 $ $582 $112 $1,508 63% $946 $562 $1,623 $535 $432 $103 $17 $10 $562 0% OFFICE: General Office 50,000 sf or less (4) 1,000 sf G 5.41 C % C $398 $15,773 $ $ $2, $3,956 $381 $11, % $11,436 $0 $12,255 $0 $0 $0 $0 $0 $0 0% 710.1P General Office 50, ,000 sf (4) 1,000 sf G 5.41 C % C $398 $15,449 $ $ $2, $3,875 $525 $11, % $11,049 $0 $11,852 $0 $0 $0 $0 $0 $0 0% 710.2P General Office 100, ,000 sf (4) 1,000 sf G 5.41 C % C $398 $15,131 $ $ $2, $3,795 $525 $10, % $10,811 $0 $11,597 $0 $0 $0 $0 $0 $0 0% 710.3P General Office 200, ,000 sf (4) 1,000 sf G 5.41 C % C $398 $14,819 $ $ $2, $3,717 $525 $10, % $10,578 $0 $11,348 $0 $0 $0 $0 $0 $0 0% 710.4P General Office greater than 400,000 sf (5) 1,000 sf 9.97 G 5.41 C % C $398 $14,514 $ $ $2, $3,640 $525 $10, % $10,349 $0 $11,103 $0 $0 $0 $0 $0 $0 0% Corporate Headquarters Building 1,000 sf 7.95 H 5.41 N % N $398 $11,575 $ $ $2, $2,903 $525 $8, % $8,147 $0 $8,748 $0 $0 $0 $0 $0 $0 0% Medical Office 1,000 sf B 5.83 C % C $397 $52,748 $1, $2, $9, $13,180 $525 $39, % $39,043 $0 $41,784 $0 $0 $0 $0 $0 $0 0% Office Park 1,000 sf D 7.47 C % Q $395 $22,632 $ $ $3, $5,594 $525 $16, % $16,514 $0 $17,690 $0 $0 $0 $0 $0 $0 0% Research and Development Center 1,000 sf D 5.65 Q % Q $397 $16,540 $ $ $2, $4,142 $525 $11, % $11,874 $0 $12,733 $0 $0 $0 $0 $0 $0 0% 770.P 640 Veterinarian Clinic 1,000 sf B 5.36 P % P $398 $31,351 $ $1, $5, $7,869 $381 $23, % $23,101 $0 $24,730 $0 $0 $0 $0 $0 $0 0% $$ Allocated for Net Mobility Full (1) (Incl Int) Interstate/ SIS (Excl Int) Transit Bike/Ped 2014 Mobility Percent change from 2014 to 2018 Net Mobility 4-24
49 County wide Parameters: Pasco County Land Use Code ITE LUC Table 4 12 (continued) Rural Traditional Neighborhood Development Schedule ( District C) Revenue period: 25 P4P Equivalent Pennies: 6.7 Include carrying cost?: No TOD Deduction: 0.00% Discount Rate: 3.30% 2nd LOFT County pennies to capacity: 5 Include Interstates?: Yes TND Deduction: 11.36% Fuel efficiency: Existing State pennies to capacity: MUTRM Deduction: 0.00% Days/yr: 365 Tax Inc Fin Millage Rate to capacity: Factor to convert VMT to PMT: 1.42 Existing County pennies to capital: 0 Toll.fwy discount: 1.7% Land Use Unit Trip Rate (veh trips) TGR Standard Trip Length TL Market Area Trip Length Adjustment Factor Chargeable Trip length (mi) Trip length for revenue (mi) % New Trips % NT Gross assessable pmt/day Weighted Capacity Addition Ratio Needed PMC Needed PMC After Fwy/Toll/ TOD/TND/ MUTRM Deduct Weighted Cost/PMC Impact Cost PV County Gas Tax ($$/yr): PV P4P Equivalent PV Federal/ State Gas Tax Revenue ($$/yr) PV Sub Countywide selfcredits: PV Tax Before Increment % Self RETAIL: Mini Warehouse 1,000 sf 1.51 B 3.26 K % N $401 $1,475 $47.69 $63.81 $ $380 $74 $1,021 69% $703 $318 $1,098 $302 $245 $57 $10 $6 $318 0% Hardware/Paint 1,000 sf 9.14 B 1.96 R % R $406 $3,311 $ $ $ $900 $351 $2,060 76% $1,557 $503 $2,232 $479 $385 $94 $15 $9 $2,906 83% Retail 50,000 sfgla or less (4) 1,000 sfgla G 1.96 S % S $406 $27,191 $ $1, $5, $7,394 $351 $19,446 75% $14,517 $4,929 $20,859 $4,699 $3,777 $922 $141 $89 $4,929 0% 820.1P Retail 50, ,000 sfgla (4) 1,000 sfgla G 2.52 S % S $404 $26,690 $ $1, $4, $7,035 $369 $19,286 77% $14,879 $4,407 $20,673 $4,202 $3,394 $808 $126 $79 $4,407 0% 820.2P Retail 200, ,000 sfgla (4) 1,000 sfgla G 2.77 S % S $402 $25,497 $ $1, $4, $6,670 $369 $18,459 78% $14,355 $4,104 $19,784 $3,913 $3,173 $740 $117 $74 $4,104 0% 820.3P Retail 400, ,000 sfgla (4) 1,000 sfgla G 3.01 S % S $402 $25,335 $ $1, $4, $6,564 $1,111 $17,660 78% $13,785 $3,875 $18,977 $3,694 $2,995 $699 $111 $70 $3,875 0% 820.4P Retail 600, ,000 sfgla (4) 1,000 sfgla G 3.26 S % S $401 $25,926 $ $1, $4, $6,681 $1,111 $18,134 78% $14,136 $3,998 $19,481 $3,812 $3,101 $711 $114 $72 $3,998 0% 820.5P Retail greater than 800,000 sfgla (5) 1,000 sfgla G 3.51 S % S $400 $24,745 $ $1, $4, $6,347 $1,111 $17,286 76% $13,122 $4,164 $18,572 $3,970 $3,238 $732 $119 $75 $4,164 0% Specialty Retail 1,000 sf H 3.54 C % C $400 $48,863 $1, $2, $8, $12,523 $351 $35,990 79% $28,270 $7,720 $38,529 $7,360 $6,003 $1,357 $221 $139 $7,720 0% 830.P n/a Non Veterinary Kennel 1,000 sf Y 2.13 C % C $406 $19,189 $ $ $3, $5,232 $351 $13,607 78% $10,561 $3,046 $14,604 $2,904 $2,334 $570 $87 $55 new n/a New/Used Auto Sales 1,000 sf B 4.83 C % C $398 $34,310 $1, $1, $6, $8,615 $233 $25,462 77% $19,720 $5,742 $27,245 $5,475 $4,493 $982 $164 $103 $5,742 0% Tire Store 1,000 sf B 3.80 T % T $400 $25,348 $ $1, $4, $6,453 $351 $18,544 81% $15,080 $3,464 $19,861 $3,303 $2,694 $609 $99 $62 $3,464 0% Supermarket 1,000 sf B 2.18 C % C $406 $43,029 $1, $1, $8, $11,509 $195 $31,325 79% $24,784 $6,541 $33,561 $6,236 $5,012 $1,224 $187 $118 $6,541 0% Convenience Store w/gas Pumps 1,000 sf D 1.59 C % C $414 $71,952 $2, $3, $14, $21,128 $341 $50,482 74% $37,281 $13,201 $54,221 $12,586 $9,962 $2,624 $377 $238 $13,201 0% Home Improvement Superstore 1,000 sf B 2.52 U % U $404 $17,036 $ $ $3, $4,491 $369 $12,177 80% $9,718 $2,459 $13,062 $2,344 $1,893 $451 $71 $44 $2,459 0% Pharmacy/Drug Store with and without Drive Thru 1,000 sf D 2.18 C % C $406 $23,062 $ $1, $4, $6,168 $351 $16,542 79% $13,093 $3,449 $17,741 $3,288 $2,643 $645 $99 $62 $3,449 0% Furniture Store 1,000 sf 6.30 B 6.39 C % C $396 $6,989 $ $ $1, $1,732 $351 $4,907 82% $4,036 $871 $5,270 $830 $685 $145 $25 $16 $871 0% Bank/Savings w/drive In 1,000 sf D 2.58 C % C $406 $29,800 $1, $1, $5, $8,102 $526 $21,171 63% $13,380 $7,791 $22,720 $7,428 $5,970 $1,458 $223 $140 $7,791 0% 929P n/a Breakfast and Lunch Restaurant 1,000 sf Y 3.33 C % C $404 $43,671 $1, $1, $8, $11,504 $263 $31,904 77% $24,418 $7,486 $34,174 $7,137 $5,764 $1,373 $214 $135 new n/a Fast Casual Restaurant 1,000 sf Y 3.33 C % C $404 $106,098 $3, $4, $19, $27,949 $263 $77,886 77% $59,619 $18,267 $83,399 $17,417 $14,068 $3,349 $521 $329 new n/a Quality Restaurant 1,000 sf D 3.30 C % C $401 $72,348 $2, $3, $13, $18,621 $263 $53,464 78% $41,596 $11,868 $57,223 $11,315 $9,204 $2,111 $339 $214 $11,868 0% High Turnover Restaurant 1,000 sf D 3.33 C % C $401 $85,315 $2, $3, $15, $21,939 $263 $63,114 77% $48,476 $14,638 $67,547 $13,957 $11,353 $2,604 $418 $263 $14,638 0% Fast Food Restaurant w/drive Thru 1,000 sf D 2.15 C % C $410 $155,711 $5, $7, $30, $43,372 $1,155 $111,184 77% $85,695 $25,489 $119,275 $24,303 $19,410 $4,893 $727 $459 $25,489 0% Quick Lube bays B 3.80 T % T $402 $27,201 $ $1, $5, $7,080 $117 $20,004 72% $14,414 $5,590 $21,418 $5,329 $4,321 $1,008 $160 $101 $5,590 0% Auto Repair or Body Shop 1,000 sf H 3.80 T % T $400 $27,934 $ $1, $5, $7,112 $233 $20,589 77% $15,830 $4,759 $22,041 $4,537 $3,700 $837 $136 $86 $4,759 0% Gasoline Station fuel pos B 2.00 C % C $410 $20,017 $ $ $3, $5,654 $85 $14,277 78% $11,098 $3,179 $15,317 $3,031 $2,421 $610 $91 $57 $3,179 0% Self Service Car Wash bays D 2.29 C % C $410 $17,309 $ $ $3, $4,766 $34 $12,509 51% $6,361 $6,148 $13,409 $5,861 $4,681 $1,180 $176 $111 $6,148 0% 913.P 913 Convenience/Gasoline/Fast Food Store 1,000 sf D 2.78 C % C $406 $219,864 $7, $9, $41, $59,080 $341 $160,443 78% $125,877 $34,566 $171,868 $32,958 $26,490 $6,468 $986 $622 $34,566 0% INDUSTRIAL: General Light Industrial 1,000 sf 4.96 B 5.41 N % N $398 $6,815 $ $ $1, $1,717 $325 $4, % $4,773 $0 $5,127 $0 $0 $0 $0 $0 $0 0% General Heavy Industrial 1,000 sf 1.50 B 5.41 N % N $398 $2,061 $65.12 $87.15 $ $519 $325 $1, % $1,216 $0 $1,324 $0 $0 $0 $0 $0 $0 0% Industrial Park 1,000 sf 3.37 B 5.41 N % N $398 $4,631 $ $ $ $1,166 $325 $3, % $3,139 $0 $3,379 $0 $0 $0 $0 $0 $0 0% Manufacturing 1,000 sf 3.93 B 5.41 N % N $398 $5,400 $ $ $ $1,360 $325 $3, % $3,714 $0 $3,995 $0 $0 $0 $0 $0 $0 0% Passive Warehouse (Storage Warehouse) 1,000 sf 1.74 B 5.41 N % N $398 $2,391 $75.54 $ $ $602 $240 $1, % $1,548 $0 $1,673 $0 $0 $0 $0 $0 new n/a /156 Active Warehouse (Fulfillment Center/Parcel Hub) 1,000 sf 7.97 B 6.95 M % N $396 $14,009 $ $ $2, $3,482 $240 $10, % $10,287 $0 $11,015 $0 $0 $0 $0 $0 new n/a 160.P 153 Airport Hangar 1,000 sf 3.56 H 5.41 N % N $398 $4,892 $ $ $ $1,232 $325 $3, % $3,334 $0 $3,588 $0 $0 $0 $0 $0 $0 0% $$ Allocated for Net Mobility Full (1) (Incl Int) Interstate/ SIS (Excl Int) 0.01 H ######### $0 #DIV/0! $0 Notes: (1) This value is the total value of transportation system consumed, less credits for revenues committed to transportation system expansion that are generated by the use itself. This value includes Interstate costs and "carrying costs", but not toll road costs. It does consider the proportion of trip length, varying system costs, and transportation system performance goals that vary by fee district. (2) Specific calculations for the "low income" category can be seen in Appendix B of the 2014 Mobility Update Study. (3) The statistical relationship between the trip generation rate for the age restricted single family, age restricted multi family, and congregate care facility was used to interpolate the trip length. (4) The trip generation rate recommended for the office and retail size categories used the end point of the range due to the nature of the ITE equation to be conservative for smaller developments. (5) The trip generation rate used for the office and retail open ended size categories used the size 200,000 s.f. larger than the beginning of the size range, as the size ranges increase in 200,000 s.f. increments. s of trip rate, percent new trips, and trip length are as follows: (A) National studies (NHTS, AHS, Census) (I) Independent Study (Collier County) (Q) Same as LUC 770 (Business Park) (Y) Other National Studies (B) ITE 10th Edition Trip Generation (J) Same as LUC 220 (R) Same as LUC 820 (<50k) (C) Florida Studies Database (K) Florida Schedules (S) FL Curve (D) Blend ITE 10th & FL Studies (L) Same as LUC 240 (T) Same as LUC 942 (Auto Care Center) (E) Blend ITE 6th & FL Studies (M) Same as LUC 210 (U) Same as LUC 820 (50k 200k) (F) ITE Regression Analysis (N) Same as LUC 710 (V) n/a (G) ITE 10th equation (O) Model Based Trip Length (W) Same as LUC 492 (Health Club) (H) Previous Pasco MMTIF Study (P) Same as LUC 630 (Clinic) (X) Same as LUC 595 (DayCare) F:\WEO PE\Projects\ AECOM Pasco Mobilty 2017\3. Analysis\ Schedule Spreadsheets\[Mobility Schedules 2018 v6.xlsm]urban Transit Bike/Ped 2014 Mobility Percent change from 2014 to 2018 Net Mobility 4-25
50 4.1 Example Calculation It is useful to provide example calculations for the mobility fee for one of the land use categories. In the following examples, the net mobility fee is calculated for the Single Family Residential detached land use category (ITE LUC 210) using information from the proposed urban mobility fee schedule, and an example of the Impact Cost is also provided. A fee calculation example for the Mining land use, from the 2014 Study report appendix, is provided in Appendix G. While the principles and equations used are the same, certain input variables reflect aspects specific to trucks that differ from the standard fee calculations. For each land use category of the fee schedules, the same equations are used to calculate the net mobility fee: Net Mobility = Impact Cost Gas Tax, P4P Sales Tax, and Tax Increment Where: Impact Cost = ((Trip Rate Standard Trip Length x Market Area Trip Length Adjustment Factor % New Trips) (1 applicable MUTRM, TOD, or TND deduction) Factor to convert VMT to PMT / 2) (1 Toll deduction) (Weighted Cost per Person Mile of capacity) Gas Tax and P4P Sales Tax = Present Value of (Annual Gas Tax and Equivalent P4P Sales Tax ), at 3.3% interest rate and 25 year facility life, computed as: [(((Trip Rate Trip Length for Revenue % New Trips) / 2) Equivalent Pennies per Gallon x (1 applicable MUTRM, TND, or TOD reduction) Effective Days per Year $/Gallon to Capital) / Fuel Efficiency] where is the factor to convert 25 years of revenue to present value at 3.3 percent interest rate. Tax Increment = Present Value ([estimated tax value per unit of development millage rate x portion allocated to transportation system expansion / $1,000) at 3.3 percent for 25 years = is a reduction in the mobility fee, the magnitude of which is established by Board of County Commissioners direction, to incentivize and encourage development. Each of the inputs has been discussed previously in this document; however, for purposes of this example, brief definitions for each are provided below, along with the actual inputs for the Single Family Residential Detached, 1,501 to 2,499 s.f. category, in the Urban District. Trip Rate = the average daily trip generation rate, in vehicle trips/day (7.81). % New Trips = adjustment factor to account for trips that are already on the roadway (100%). Standard Trip Length = County wide average trip length for the type of land use, in miles (7.61). Market Area Trip Length Adjustment Factor = a factor which adjusts the county wide average trip W.E. Oliver, P.E., LLC Mobility Update Study December 3, 2018 Pasco County, Florida
51 length, and therefore person miles of travel, to reflect the geographic sub area of the county, or fee district, in which the new development is located (0.770). Chargeable Trip Length = the average trip length on arterial and collector roads for which the new development is assessed, in miles (5.86). It is the product of the Standard Trip Length and the Market Area Trip Length Adjustment Factor. This value includes toll road travel, which is deducted below. Trip Length for Revenue = trip length representing travel on all roads where the vehicle engine is running and burning gasoline and generating gas tax revenues. This occurs on all roads including freeways, toll roads, and local roads. A distance of 0.5 mile was added to the Chargeable Trip Length of each land use category to account for local street travel, and the Interstate/Toll road deduction applied to the Chargeable Trip Length is not applied to the Trip Length for Revenue. ( = 6.36). Factor to convert VMT to PMT = person trips per vehicle trip. 2 = the total daily miles of travel generated by a particular category (i.e., rate * length * % new trips) is divided by two to equally divide the responsibility for a trip to the land uses at each end of the trip. Deduct Toll/Fwy/MUTRM/TND/TOD = factor to account for travel occurring on interstate highways and/or toll facilities (1.7 percent in this case for travel on the Suncoast Parkway only, as no deduction is made for Interstate highway travel), and reduced travel demand for development following MUTRM, TND, or TOD development standards of Pasco County s Land Development Regulations. (0% deduction in this case, since this example is for the Standard fee rate). Weighted Cost per Person Mile of Capacity = unit cost to construct one person mile of transportation system capacity, in $/person mile ($352.29). An example of the calculation of this value is provided in section 2.6. Present Value = calculation of the present value of a uniform series of payments gas tax equivalents or tax increment credits in this case given an interest rate, i, and a number of periods, n; for 3.3% interest and a 25 year facility life. The uniform series present worth factor is Effective Days per Year = 365 days. $/Gallon to Capital = the amount of State and County gas tax revenue and equivalent pennies of sales tax revenue per gallon of fuel that is used for capital improvements, in $/gallon ($0.3956) Fuel Efficiency = average fuel efficiency of vehicles, in vehicle miles/gallon (19.00) Using these inputs, the following net mobility fee is calculated for the 1,501 to 2,499 s.f. Single Family Residential Detached land use in the urban district. Note that the exact dollar amounts may vary slightly from the values reported in Table 4 1 due to the spreadsheet carrying additional decimal places in its computations. Impact Cost: = (( x (1 0.00)) / 2) ( ) ($352.29) = $11,236 W.E. Oliver, P.E., LLC Mobility Update Study December 3, 2018 Pasco County, Florida
52 Present Value Sub of Gas Tax and Equivalent Sales Tax Self s: = [((7.81 (7.61 x ) 1.0) (1 0.00) / 2) 365 $ / 19.00] = $3,179 Present Value Tax Increment Self : = x $151,756 x x / 1,000 = $1,123 Allocated for Buy Down Discount= $1,074 (15.5 percent of fee before buy down) Net Mobility = $11,236 $3,179 $1,123 $1,074 = $5,860 The Full represents the full potential cost of providing transportation system capacity, and is used by Pasco County as an upper limit to proportionate share assessments. It s computation is similar to the standard mobility fee, except that the discretionary incentive/buy down is not applied. All other selfcredits, such as gasoline tax credits and the tax increment credit, remain applicable. An additional element of cost, the time value of funds used for design, right of way acquisition, and some elements Year Phase % of Cost Project Cost by Phase Adjusted for Time 6 Design 6.0% $3.49 $ Design 6.0% $3.49 $ ROW 10.0% $5.81 $ ROW 20.0% $11.63 $ ROW 20.0% $11.63 $ Const/CEI 55.0% $31.98 $ Const/CEI/Open 55.0% $31.98 $ % $ $ of the funded capacity becoming available to the public is added. This carrying cost computation is summarized in the table to the left, indicating the carrying costs of a hypothetical $100 improvement project over a six year period. A carrying cost of 5.2 percent of the total cost is indicated, based on a 3.3 percent per year interest rate. Thus, the Full calculation, borrowing from the previous example, is: Full = Impact Cost * Carrying Cost Present Value Sub of County wide Self s Tax Increment, or: Full = $11,236 * (1.052) $3,179 $1,123 $0 = $7,518 The Interstate/SIS share of the mobility fee was determined by calculating the difference between the mobility fees calculated in the normal method as described above and the fee calculated by deleting the portion of travel on I 75 and allocating a proportionate share of the self credits and incentive funds. These values and computations are as follows, with the numbers that change denoted in bold: Impact Cost = (( x (1 0.00)) / 2) ( ) ($340.68) = $9,694 Interstate/SIS = ($11,236 $9,694) x ($5,860 / $11,236) = $804. W.E. Oliver, P.E., LLC Mobility Update Study December 3, 2018 Pasco County, Florida
53 4.2 Indexing Historically, Pasco County has reviewed its mobility fees to adjust them to respond to cost trends every three years. While the County reserves the right to adjust mobility fees at any time, with this update the County proposes to lengthen the reviews to be undertaken no less frequently than every five years. s will not be automatically indexed, and Board of County Commissioner action is required to alter the fees. 4.3 Alternate s for Urban Apartments and Mini Warehouses During the adoption process, the Board of County Commissioners considered removing the incentives that are currently provided for apartments in the urban fee district, and for mini warehouse ( selfstorage ) facilities county wide. These adjustments were not agreed upon at the time of fee schedule adoption, but a possibility for adjustment in the future remains, as additional information regarding these land uses is developed and discussed. Possible adjusted fees were computed, and are as follows: Urban Apartments: Development Form Current /DU Zero /DU Change ($$) % Change Standard $3,971 $4,280 $489 +8% MUTRM $2,978 $3,210 $232 +8% TND $1,986 $2,140 $154 +8% TOD $993 $1,070 $77 +8% Mini Warehouse: District 2014 /ksf Zero /ksf Change ($$) % Change Urban $411 $512 $99 +25% Suburban $533 $652 $ % Rural $636 $1,162 $ % W.E. Oliver, P.E., LLC Mobility Update Study December 3, 2018 Pasco County, Florida
54 Appendix A Trip Characteristics Update
55 Appendix A Trip Generation Rate Update A potentially significant change to trip characteristics since the 2014 study was the issuance of the 10 th Edition ITE Trip Generation reference (November, 2017). Many of the trip generation rates on which Pasco County s mobility fee is based were at least partially dependent on earlier versions of this nationally recognized reference. Table A 1, following, provides a summary of the updated trip generation rates, indicating if the 2014 rate was kept, if the newer ITE 10 th edition rate was used, or if the Florida Studies trip rates were blended with 10 th Edition trip generation rates (rather than prior versions of this reference.) The Florida Studies database has been included in Appendix A of previous versions of the Mobility study. Trip characteristics (trip rate, trip length, and percent new trips) were developed for four new land uses included in the 2018 fee schedules, and how these variables were derived is described in the following paragraphs: 1. Ice Skating Arena: An ice skating arena has been developed in Pasco County s Urban fee district, and as a part of the development approval process a trip rate, trip length, and percent new trips variables were established. The trip rate, percent new trips, and trip length accepted by Pasco County for this development were 9.95 trip ends/1,000 s.f., 90 percent new trips, and 9.21 mile trip length. A 93 percent discount incentive was granted to the land use in view of the business it was expected to attract to Pasco County. 2. Non Veterinary Kennel: This land use is commonly known as a doggy day care, providing boarding and grooming services on a daily or extended time basis. Studies observing peak hour trip generation were found from such land uses being reviewed in California. The land use was considered similar in character to human child daycare operations, from which the relationship between peak hour and daily trip generation allowed extrapolation of the observed peak hour non Veterinary Kennel per dog trip rates to a daily rate (e.g. daily rate = 2.15 times sum of a.m. and p.m. peak hour rates). Publications on the internet giving advice on the needed number of square feet of boarding area per animal (62.5 s.f./animal) allowed the trip rate per animal to be connected to a trip rate per 1,000 s.f. Trip length and percent new trips values from child daycare sites were used for the non veterinary clinic use. 3. Breakfast and Lunch (only) Restaurant: The ITE 10 th Edition Trip Generation reference provides information regarding the percent of daily trips that occur during each hour of a day for highturnover, sit down restaurant and for a Fast Casual restaurant. The percentage of trips generated by these two restaurant categories between 4:00 a.m. and 2:00 p.m. was applied to their respective daily trip generation rates (to get and trip ends per 1,000 s.f., respectively). In addition, the consultant discussed typical operations with the manager of a popular breakfast/lunch restaurant, whose information suggested a daily trip generation rate of 37 trip ends per 1,000 s.f. These three values were averaged to yield a rate of 74 trip ends per 1,000 s.f. This rate was lower than the rate of the High Turnover Sit Down restaurant, and was judged reasonable. The percent new trips and trip length values from the High Turnover, Sit Down restaurant were judged to be appropriate and were applied to this land use. W.E. Oliver, P.E., LLC A Mobility Update Study
56 4. Fast Casual Restaurant: The website tripgeneration.org (accessed on 7/19/2018) provided a database of four studies of Fast Casual restaurants, yielding an average rate of trip ends per 1,000 s.f. The percent new trips and trip length values from the High Turnover, Sit Down restaurant were judged to be appropriate and were applied to this land use. 5. Warehousing: The 10 th Edition Trip Generation reference re defined Warehousing categories. Essentially, two types of warehousing activities are established passive warehousing where materials are stored and accessed when they are needed, and active warehousing which reflect newer activities such as parcel fulfilment centers or distribution centers. While the fees for all industrial land uses are by policy 100 percent subsidized (e.g. zero fee), the land use descriptions and fee calculations were updated to reflect current land use trends. The rate for passive warehouse uses were the average of the ITE land use categories 150 (Warehousing), 154 (Transload), and 157 (Cold Storage), while the active warehouse uses were the average of categories 155, Fulfilment Center, and 156, Parcel Hub. Trip length and percent new trips data were not changed. W.E. Oliver, P.E., LLC A Mobility Update Study
57 9/5/2018 W.E. Oliver, P.E., LLC 2018 Mobility Update Study A-3 Trip Generation Rate Update ITE LUC Land Use Unit 2014 TGR 2018 TGR % Change Trip Gen Notes Specific Study Rate Weight to Specific Study ITE 10 Rate Updated Blended Rate RESIDENTIAL: Single Family (Detached) Less than 1,500 s.f. & Annual Hh Income less than 80% of SHIP Definition du % FL Studies Keep prior, FL Studies 210 Less than 1,500 sf du % FL Studies Keep prior, FL Studies 1,500 to 2,499 sf du % FL Studies Keep prior, FL Studies 2,500 sf or larger du % FL Studies Keep prior, FL Studies 220 Multi-Family "Low Income"; less than 80% of SHIP definition du % FL Studies Keep prior, FL Studies Multi-Family (Apartment) du % FL Studies Keep prior, FL Studies 231 Low-Rise Condominium (1 to 2 Stories) du % FL Studies Keep prior, FL Studies 232 High-Rise Condominium (3 or more stories) du % FL Studies Keep prior, FL Studies 240 Mobile Home Park du % FL Studies Keep prior, FL Studies 251 Age-Restricted Single Family du % Blended FL & ITE10 Update Blended Rate % Age-Restricted Multi-Family du % Blended FL & ITE10 Update Blended Rate % Congregate Care Facility (Attached) du % ITE 10 LODGING: 310 Hotel room % ITE Motel room % ITE Resort Hotel room % Stay w/ current ITE 10 didn't have daily rate RECREATION: 412 General Recreation acre % Stay w/ current Not in ITE RV Park RV space % Stay w/ current Not in ITE Marina berth % ITE Golf Course hole % ITE Miniature Golf Course hole % Stay w/ current ITE 10 had only pk hr 437 Bowling Alley 1,000 sf % Stay w/ current ITE 10 had only pk hr 444 Movie Theater screen % Stay w/ current ITE 10 had only Friday % Racquet Club/Health Club/Spa/Dance Studio 1,000 sf % Stay w/ current ITE 10 had only pk hr 495 Community Center/Gymnasium 1,000 sf % ITE P Ice-Skating Arena 1,000 sf 9.95 new Pasco provided Data provided by Pasco County INSTITUTIONS: 520 Elementary School (Private) student % ITE Middle School (Private) student % ITE High School (Private) student % ITE University/Junior College (7,500 or fewer students) (Private) student % ITE sumed enrolment 550 University/Junior College (more than 7,500 students) (Private) student % ITE sumed enrolment 560 Church 1,000 sf % ITE 10 No daily rates for Synagogue or Mosque 565 Day Care student % ITE Cemetery acre % ITE Hospital 1,000 sf % ITE Nursing Home bed % ITE 10 OFFICE: 710 General Office 50,000 sf or less 1,000 sf % ITE 10 Eqn General Office 50, ,000 sf 1,000 sf % ITE 10 Eqn General Office 100, ,000 sf 1,000 sf % ITE 10 Eqn General Office 200, ,000 sf 1,000 sf % ITE 10 Eqn 400 : W.E. Oliver, P.E., LLC F:\WEO-PE\Projects\ AECOM-Pasco Mobilty 2017\3. Analysis\ Schedule Spreadsheets\Mobility Schedules 2018 v5.xlsm
58 9/5/2018 W.E. Oliver, P.E., LLC 2018 Mobility Update Study A-4 Trip Generation Rate Update ITE LUC Land Use Unit 2014 TGR 2018 TGR % Change Trip Gen Notes Specific Study Rate Weight to Specific Study ITE 10 Rate Updated Blended Rate 710 General Office greater than 400,000 sf 1,000 sf % ITE 10 Eqn Corporate Headquarters Building 1,000 sf % ITE 10 Eqn 720 Medical Office 1,000 sf % Blended FL & ITE % Office Park 1,000 sf % Blend FL & ITE 8th Dropped from ITE Research & Development Center 1,000 sf % ITE Veterinary Clinic 1,000 sf % ITE 10 RETAIL: 151 Mini-Warehouse 1,000 sf % ITE Hardware/Paint Store 1,000 sf % ITE Retail 50,000 sfgla or less 1,000 sfgla % ITE 10 Eqn Retail 50, ,000 sfgla 1,000 sfgla % ITE 10 Eqn Retail 200, ,000 sfgla 1,000 sfgla % ITE 10 Eqn Retail 400, ,000 sfgla 1,000 sfgla % ITE 10 Eqn Retail 600, ,000 sfgla 1,000 sfgla % ITE 10 Eqn Retail greater than 800,000 sfgla 1,000 sfgla % ITE 10 Eqn Specialty Retail 1,000 sf % Keep Old Not in ITE P Non Veterinary Kennel 1,000 sf new Derived from internet sources, see following worksheets 841 New/Used Auto Sales 1,000 sf % ITE 10 Mixed rate very close to ITE 10, go w/ ITE Tire Store 1,000 sf % ITE Supermarket 1,000 sf % ITE 10 Mixed rate very close to ITE 10, go w/ ITE Convenience Store w/gas Pumps 1,000 sf % Blended FL & ITE % Home Improvement Superstore 1,000 sf % ITE Pharmacy/Drug Store with and w/o Drive-Thru 1,000 sf % Blended FL & ITE % Furniture Store 1,000 sf % ITE Bank/Savings w/drive-in 1,000 sf % ITE 10 Went with lower rate due to internet banking 929P Breakfast and Lunch Restaurant 1,000 sf new ITE 10 Derived from similar uses, see following worksheets 930 Fast Casual Restaurant 1,000 sf new Spack Consulting Quality Restaurant 1,000 sf % Blended FL & ITE % High-Turnover Restaurant 1,000 sf % Blended FL & ITE % Fast Food Rest. w/drive-thru 1,000 sf % Blended FL & ITE % Quick Lube bays % ITE Auto Repair or Body Shop 1,000 sf % Keep Old ITE 10 doesn't have daily rate, keep prior. 944 Gasoline Station fuel pos % ITE Self-Service Car Wash bays % Blend ITE 10 & FL Studies n/a Convenience/Gasoline/Fast Food 1,000 sf % Florida Studies INDUSTRIAL: 110 General Light Industrial 1,000 sf % ITE General Heavy Industrial 1,000 sf % Keep Old Not in ITE 10, keep old rate 130 Industrial Park 1,000 sf % ITE Manufacturing 1,000 sf % ITE /154/157Passive Warehouse (Storage Warehouse) 1,000 sf % ITE 10 Transload Fulfillmt Ctr Parcel Hub Cold Stor 155/156 Active Warehouse (Fulfillment Center/Parcel Hub) 1,000 sf % ITE 10 New ITE definitions n/a Airport Hangar 1,000 sf % Keep Old Other: n/a Mining 1,000 cy Keep Old : W.E. Oliver, P.E., LLC F:\WEO-PE\Projects\ AECOM-Pasco Mobilty 2017\3. Analysis\ Schedule Spreadsheets\Mobility Schedules 2018 v5.xlsm
59 Appendix B Travel Demand of MUTRM, TND, TOD, Mining Uses and Residential Trip Rates by Size
60 Reproduced from 2014 Mobility Update Study Appendix B Travel Demand of Transit Oriented, Traditional Neighborhood, and Mixed Use Trip Reduction Measures Developments This appendix provides support for estimating the travel demand component of several land uses for which either no field studies are available, or for which additional stratification is desired that is not provided in the ITE Trip Generation reference or the Trip Characteristics database. The land uses specifically addressed herein include: Stratification of single family residential units by size Mixed Use Trip Reduction Measures development (MUTRM), Traditional Neighborhood Development (TND), and Transit Oriented Development (TOD), and Mining operations. Single Family Residential Trip Generation Rate Tiering As part of this study, an update to the tiering of the assessed impact fee for the single family residential (detached) land use, to ensure equity by size of home, is included. To facilitate this, an analysis was completed on the comparative relationship between housing size and household travel behavior. This analysis utilized data from the 2009 National Household Travel Survey (NHTS) and the 2011 American Housing Survey (AHS) to examine overall trip making characteristics of households in the United States. Table B 1 presents the existing trip characteristics being utilized in the current adopted impact fee schedule for the single family (detached) land use. The 2009 NHTS database was used to assess average annual household vehicle miles of travel (VMT) for various annual household income levels, including low income. In addition, the 2011 AHS database was used to compare median annual family/household incomes with housing unit size. It is important to recognize that the use of the income variable in each of these databases is completed simply to provide a convenient linking mechanism between household VMT from the NHTS and housing unit size from the AHS. Table B 1 Calculated Single Family Trip Characteristics Calculated Values Assessable Trip Rate Excluding Tiering Trip Length Daily VMT Ratio to Mean Single Family (Detached) : FL Studies for LUC 210, shown in Appendix A Tindale Oliver & Associates, Inc. Pasco County November 5, 2014 Page B 1 Transportation Mobility
61 Reproduced from 2014 Mobility Update Study The results of the NHTS and AHS analyses are included in Tables B 2 through B 4. First, the data shown in Table B 2 indicates that the average income in the U.S. for families/households living in the three housing size tiers. As shown, the average income for housing units between 1,500 and 2,499 square feet in size ($62,563) is slightly lower than the overall average income for the U.S. ($62,831). Next, a fourth tier, less than 1,500 sq. ft. and low income was also addressed. Data for this tier was developed by utilizing the Pasco County SHIP definitions for low income households (i.e., under 80% of the area county median income), as shown in Table D 3. Since the overall median income level for the County is $57,400, the SHIP low income designation applies to households with an annual median household income of less than $45,900. Table B 2 Annual Income by Housing Size 2011 AHS Average Income Annual Data by Housing Size Income (1) Less than 1,500 sf $42,156 1,500 to 2,499 sf $62,563 2,500 sf or more $79,443 Average of All Houses $62,831 : 2011 American Household Survey Table B 3 SHIP Low Income Designation Pasco County SHIP Definitions Median Income > $57,400 Low Income > $45,900 : 2011 American Household Survey The next step involved the use of the NHTS database to assess average annual household vehicle miles of travel (VMT) for the annual household income levels that were identified for the four tiers using the AHS and SHIP data. For example, as shown in Table B 4, households in the less than 1,500 sf tier have a median annual household income of approximately $42,156. Therefore, the NHTS data were used to estimate the annual VMT per household for those households with a median annual income of $42,156. This analysis resulted in an annual VMT per household of 19,241 miles, which translates to a daily VMT of miles. In the case of the less than 1,500 sf and lowincome tier, since the 80 percent SHIP low income definition results in a potential range of annual household incomes of up to approximately $45,900, a median annual household income of $22,950 was used for purposes of assessing average annual household VMT. The NHTS specific analysis is documented in Table B 4 for all four tiers. Tindale Oliver & Associates, Inc. Pasco County November 5, 2014 Page B 2 Transportation Mobility
62 Reproduced from 2014 Mobility Update Study Table B 4 NHTS VMT Annual VMT by Income Category 2009 NHTS Travel Data by Annual Ratio to Normalized Days Daily VMT Annual HH Income VMT/HH Mean to Median of $22,950 12, Median of $42,156 19, (All Homes) 24, Median of $62,563 24, Median of $79,443 28, : 2009 National Household Travel Survey Database, Federal Highway Administration To calculate a corresponding trip rate for the tiers it was necessary to rely on comparative ratios. As an example, consider the $42,156 annual income category. First, it was determined that the average annual household VMT for this income level is 19,241 miles. This figure was then compared to the overall average annual VMT per household in the U.S. and normalized to the average of the $62,563 (24,069 miles) category to derive a ratio of Next, the normalized ratio was applied to the daily VMT for the average single family housing unit size (Less than 1,500 sf) to generate a daily VMT of for the new tier, as shown in Table B 5. This daily VMT figure was then divided by the proposed assessable trip length of 7.61 miles to obtain a typical trip rate of 6.25 trips per day. Table B 5 Trip Generation Rate by Single Family Land Use Tier Assessable Daily Estimation of Trip Rate by Tier Trip Rate (1) Trip Length (2) VMT (3) Single Family (Detached) Less than 1,500 sf & Low Income Less than 1,500 sf ,500 to 2,499 sf ,500 sf or larger (1) Daily VMT (Item 3) divided by assessable trip length (Item 2) for each tiered single family land use category (2) : Table B 1 (3) Ratio to the mean (Item 4) divided by the total daily VMT for the 1,500 to 2,499 sf tier for each tiered sf single family land use category (4) : Table B 4 Multi Family Residential Trip Generation Rate Tiering Similar to the single family residential land use, a low income tier was developed for the multifamily residential land use in Pasco County. Due to a lack of available data to determine a link between housing unit size, income, and travel behavior for multi family properties, the tiering analysis was based on the single family relationships previously discussed. Ratio to Mean (4) Tindale Oliver & Associates, Inc. Pasco County November 5, 2014 Page B 3 Transportation Mobility
63 Reproduced from 2014 Mobility Update Study Table B 6 illustrates the ratio of VMT per household for median and low income tiers, similar to the analysis presented in Table B 4. As shown, the ratio of the low income multi family home to the average multi family home is This ratio is then applied to the daily VMT of miles for the currently proposed multi family category to generate a daily VMT of for the new low income category, as shown in Table B 7. This daily VMT figure is then divided by the recommended trip length of 5.87 miles to obtain a typical trip rate of 3.46 trips per day. 1 Table B 6 NHTS VMT Annual VMT by Income Category (Multi Family Analysis) 2009 NHTS Travel Data by Annual Ratio to Normalized Days Daily VMT Annual HH Income VMT/HH Mean to Median of $22,950 12, (All Homes) 24, Median of $62,563 24, : 2009 National Household Travel Survey Database, Federal Highway Administration Table B 7 Trip Generation Rate by Multi Family Land Use Tier Assessable Trip Rate (1) Trip Length (2) Estimation of Trip Rate by Tier Daily VMT (3) Ratio to Mean (4) Multi Family (Apartment) Multi Family & Low Income Multi Family (1) Daily VMT (Item 3) divided by assessable trip length (Item 2) for each tiered single family land use category (2) : FL Studies for LUC 220, shown in Appendix A (3) Ratio to the mean (Item 4) divided by the total daily VMT for the multi family tier for each the multi family & low income land use (4) : Table B 6 Mixed Use Trip Reduction Measures, Transit Oriented Development, and Traditional Neighborhood Development Vehicle Mile of Travel Reductions This section describes potential reductions experience in vehicle mile of travel (VMT) that can be experienced as a result of developing communities according to mixed use trip reduction measures (MUTRM), transit oriented development (TOD) and traditional neighborhood development (TND) principles and guidelines. The methodology applied to estimate VMT reductions followed the guidelines implemented in URBEMIS 9.2 software. This software package was designed to estimate air emissions from land use development projects and, to be able to estimate emissions, VMT needs to be estimated. URBEMIS 9.2 is based on the guidance and funding supplied by several California air districts: 1 Recommended trip length is assumed to remain constant at 5.87 miles since the NHTS data show that average trip length characteristics are relatively uniform across the annual household income levels; only average daily trip rates are significantly different. Tindale Oliver & Associates, Inc. Pasco County November 5, 2014 Page B 4 Transportation Mobility
64 Reproduced from 2014 Mobility Update Study Bay Area Air Pollution Control District; Feather River Air Quality Management District; Imperial County Air Pollution Control District; Mendocino County Air Pollution Control District; Monterey Bay Unified Air Pollution Control District; Placer County Air Quality Management District; Sacramento Metropolitan Air Quality Management District; San Joaquin Valley Air Pollution Control District; San Luis Obispo County Air Pollution Control District; Santa Barbara Air Pollution Control District; South Coast Air Quality Management District; and Yolo Solano Air Quality Management District. Of all the variables used by the software to estimate VMT, only the ones applicable to the Pasco County MUTRM, TOD, and TND development characteristics were evaluated. These development characteristics are the following: Residential Development Density Mix of Land Uses Local Serving Retail Transit Use Bikes and Pedestrians As part of its Land Development Code (LDC), Pasco County has adopted MUTRM development standards. In addition, Pasco County has adopted in its Comprehensive Plan eight different TOD Transit Stations typologies and it has developed a TND ordinance. To evaluate reduction in VMT to be observed in these developments when compared to non MUTRM, non TOD, and non TND developments, typical requirements included in the County s regulations were used. In addition to the MUTRM form of development, the eight TOD station typologies are: Regional Commercial Regional Professional Service Regional Mixed Use Community Commercial Community Professional Service Community Mixed Use New Town/Villages Community Business Commerce Park Neighborhood Even though all of the station types include a mix of land uses and will be served by transit, the land use mix requirements vary from station type to station type. TND VMT reductions were assumed to be similar to TOD Neighborhood station less the VMT reduction expected due to the presence of transit use. Tindale Oliver & Associates, Inc. Pasco County November 5, 2014 Page B 5 Transportation Mobility
65 Reproduced from 2014 Mobility Update Study It is the County s desire to have only one VMT reduction factor to be applied to all the transit stations; therefore, VMT reductions expected to be observed at each of the eight TOD station types were computed and averaged. Residential Development Density Even though URBEMIS 9.2 uses an elasticity formula to estimate residential trip generation reductions as a result of residential development density, Pasco County s Mobility Schedule includes different residential land uses based on density. Therefore, reductions in VMT as a result of density increases are already taken into consideration in the VMT by land use computation Mix of Land Uses A procedure adapted from Criterion and Fehr & Peers, 2001 is used: Trip reduction = (1 (ABS(1.5*h e)/(1.5*h+e)) 0.25)/0.25*0.03 Where: h = study area households (or housing units) e = study area employment This formula assumes an ideal housing balance of 1.5 jobs per household, based on Messenger & Ewing (1996), and a baseline diversity of The maximum possible reduction using this formula is 9%. The application of this formula resulted in the VMT reductions summarized in Table B 8. Table B 8. Residential and Non Residential VMT Reduction as a result of Mix of Land Uses Development Type Area Residents [per acre] Employees [per acre] VMT Reduction MUTRM % TOD Regional Commercial % Regional Professional Service % Regional Mixed Use % Community Commercial % Community Professional Service % Community Mixed Use New Town/Villages % Community Business Commerce Park % Neighborhood % TND % Local Serving Retail The presence of local serving retail is expected to provide additional VMT generation reductions. URBEMIS recommends an additional 2% VMT reduction due to local serving retail. Table B 9 summarizes the VMT reductions applied to reflect the presence of local serving retail. Tindale Oliver & Associates, Inc. Pasco County November 5, 2014 Page B 6 Transportation Mobility
66 Reproduced from 2014 Mobility Update Study Table B 9. Residential and Non Residential VMT Reduction as a result of Local Serving Retail MUTRM 2.00% TOD Regional Commercial 2.00% Regional Professional Service 2.00% Regional Mixed Use 2.00% Community Commercial 2.00% Community Professional Service 2.00% Community Mixed Use New Town/Villages 2.00% Community Business Commerce Park 2.00% Neighborhood 2.00% TND 2.00% Transit Use Transit use reductions are based on two variables, transit use and the presence of facilities that allow for non motorized access to transit (pedestrian/bicycle friendliness score). The transit use component is based on default transit service index scores assigned to different transit modes and frequencies. Based on planned transit services to be provided at each station, the transit use component was estimated. The second component of the transit use reduction was based on the pedestrian/bike score explained in the next section. The formula applied to estimate this reduction is the following: Where: t = transit service index Development Type VMT Reduction Trip reduction = t * t * ped/bike score * As can be seen in the formula, a maximum of 15 percent reduction in VMT can be accomplished by transit use. No reductions due to the presence of transit use were applied to MUTRM and/or TND development. Table B 10 summarizes the VMT reductions obtained as a result of applying this methodology. Bike and Pedestrian Facilities Reductions in VMT to account for the presence of bike and pedestrian facilities take into consideration the following two factors: Street connectivity, with traditional ( grid ) street networks as opposed to the loops, lollipops and cul de sacs of recent subdivisions Human scale streetscapes with adequate pedestrian amenities, access to shopping and other amenities, and higher densities (Lund et. al., 2004) Tindale Oliver & Associates, Inc. Pasco County November 5, 2014 Page B 7 Transportation Mobility
67 Reproduced from 2014 Mobility Update Study Table B 10. Residential and Non Residential VMT Reduction as a result of Transit Use Development Type Transit Use VMT Redution Ped/Bike MUTRM 0.00% 0.00% 0.00% TOD Regional Commercial 2.93% 4.24% 7.17% Regional Professional Service 2.63% 4.24% 6.87% Regional Mixed Use 3.08% 5.48% 8.56% Community Commercial 2.93% 6.97% 9.90% Community Professional Service 2.48% 6.97% 9.45% Community Mixed Use New Town/Villages 1.28% 6.97% 8.25% Community Business Commerce Park 2.48% 6.97% 9.45% Neighborhood 1.43% 6.97% 8.40% TND 0.00% 0.00% 0.00% URBEMIS 9.2 recommends the use of network density plus sidewalk completeness and bicycle network completeness to keep data requirements to a minimum. The pedestrian/bicycle factor is calculated as follows: Ped/bike factor = (network density + sidewalk completeness + bike lane completeness) / 3 Where: Network density = intersections per square mile / 1300 (or 1.0, whichever is less) Table B 11 summarizes the VMT reductions obtained as a result of applying this methodology. Table B 11. Residential and Non Residential VMT Reduction as a result of shift to Bikes and Pedestrians Development Type VMT Reduction MUTRM 4.08% TOD Regional Commercial 5.09% Regional Professional Service 5.09% Regional Mixed Use 6.58% Community Commercial 8.36% Community Professional Service 8.36% Community Mixed Use New Town/Villages 8.36% Community Business Commerce Park 8.36% Neighborhood 8.36% TND 8.36% Tindale Oliver & Associates, Inc. Pasco County November 5, 2014 Page B 8 Transportation Mobility
68 Reproduced from 2014 Mobility Update Study VMT Reductions After obtaining the reductions due to the presence of each individual characteristic, the reduction percentages were added and the total VMT reduction factor was obtained. This is documented in Table B 12. For TOD, the average VMT reduction to be applied to this type of development was computed, as also reflected in Table B 12. In addition, and as noted above, reductions to be applied to TND were assumed to be similar to TOD Neighborhood station, less the 8.40 percent VMT reduction expected due to the presence of transit service. Development Type Table B 12. VMT Reduction Percentage Mix of Uses Local Serving Retail VMT Reduction Transit Use Bike and Pedestrian MUTRM 1.94% 2.00% 0.00% 4.08% 8.02% TOD Regional Commercial 2.14% 2.00% 7.17% 5.09% 16.40% Regional Professional Service 2.14% 2.00% 6.87% 5.09% 16.10% Regional Mixed Use 1.17% 2.00% 8.56% 6.58% 18.31% Community Commercial 5.26% 2.00% 9.90% 8.36% 25.52% Community Professional Service 1.41% 2.00% 9.45% 8.36% 21.22% Community Mixed Use New Town/Villages 6.00% 2.00% 8.25% 8.36% 24.61% Community Business Commerce Park 1.97% 2.00% 9.45% 8.36% 21.78% Neighborhood 1.00% 2.00% 8.40% 8.36% 19.76% TOD Average 20.46% TND 1.00% 2.00% 0.00% 8.36% 11.36% Mining Land Use Trip characteristics variables for the Mining land use were developed based on the 2009 Collier County Mine Land Use Study, conducted by Tindale Oliver & Associates (TOA). This study reviewed three mining sites in Collier County for trip length and percent new trips, and several additional analyses that were conducted for trip generation purposes for mining and excavation permits in southwest Florida. Trip Generation Rate To determine the trip generation rate associated with mining operations, TOA considered several variables, including the size of the mine (in acres), depth of excavation (in feet), volume of mine (in cubic yards), anticipated duration of mine (in years), truck hauling capacity per load, days of hauling per week, and a truck to passenger car equivalency factor. With these variables in mind, the following material was reviewed: Tindale Oliver & Associates, Inc. Pasco County November 5, 2014 Page B 9 Transportation Mobility
69 Reproduced from 2014 Mobility Update Study Lee County Truck Impact Evaluation Report (David Douglas and Associates, July 2008), which was used as the basis for the calculation of the mine land use transportation impact fee in Lee County; Four mining traffic impact statements, including: o Gardiner Earth Mine Hendry County o Hogan Island Mine Collier County o SR 846 Land Trust Mine Collier County o Good Grove Mine Manatee County Permitting Information for the existing mines in Collier County Annual reports from the three existing mines in Collier County In addition, TOA interviewed the operators of the three mines where trip characteristics surveys were conducted to obtain additional information. Based on this review, it became apparent that trip activity to and from mines is very volatile and depends heavily on demand for material extracted. In addition, the amount of material leaving a mine is limited by the loading rates and truck weighing rates across the scales, measured in trucks per minute. Information provided by the representatives of the three mines where the trip characteristics studies were conducted indicated that these mines have the capability to load 18, 40 and 50 trucks per hour, which results in an average loading capacity of 36 trucks per hour, or 1.7 minutes per truck, with a range of 1.2 minutes to 3.3 minutes per truck. To develop an average daily trip generation rate for mining operations, the following assumptions for a typical mine were made: 40 year life span 8 hour work days 6 day work weeks These assumptions resulted in an average loading time of 3 minutes per truck for the largest of the three mines surveyed (with a capacity of approximately 33.6 million cubic yards of material). For the smaller mines, the same assumptions resulted in an average loading time of 6.5 minutes (for the mine with a capacity of 15 million cubic yards), and 12 minutes (mine with a capacity of 7.8 million cubic yards). As presented, these loading times are well within the capabilities of each mine, and the assumptions result in more conservative results as the mine capacity decreases. Many of the traffic impact statements distributed an anticipated mining volume over an estimated duration of mining activities. This method is reasonable for determining level of service impacts for local network improvements. As explained above, for this impact fee analysis the time period or life of the mine is assumed to be 40 years to develop the needed trip generation rate that goes into the impact fee calculation. Tindale Oliver & Associates, Inc. Pasco County November 5, 2014 Page B 10 Transportation Mobility
70 Reproduced from 2014 Mobility Update Study The total 40 year annualized trip rate is trips per 1,000 cubic yards (including an equivalent truck to car factor of 2.0) for trucks. While some agencies have applied a more conservative factor of 1.0, an equivalency factor of 2.0 is identified in the Highway Capacity Manual for heavily loaded trucks to reflect their effect on roadway capacity consumption. Based on mining and excavation permitting analyses submitted to Pasco County, the trip generation from light vehicles (employees, etc.) was found to be approximately 11.5% of the total daily trip generation. The trip generation rate used for gas tax credit calculation does not use the conversion to cars factor for capacity since the fuel efficiency for gas tax calculations is adjusted for trucks. As such, the necessary figure for this calculation is the number of trucks, and not the equivalent number of cars. Trip Length The first variable obtained from the trip characteristics study is trip length. To calculate the weighted average trip length from the data collected in Collier County, the average trip length for each site is weighted by the number of assessable trip ends obtained from the surveys collected at the study site. Looking at these surveys, the mine land use trip lengths ranged from 8.07 miles to miles. The resulting weighted average trip length for the mine land use is miles. Percent New Trips The percentage of new trips computed from the survey data collected. The weighted average percent new trips was obtained by weighting the percent new trips of each site by the number of surveys used. For each site, the percent new trips is calculated by first classifying all trips as either a captured trip, primary trip, diverted trip, or secondary trip. The percentage of the combined primary, diverted, and secondary trips of the total trips classified is the percent new trips. This methodology for classifying trips was published by Bill Oliver in the ITE Journal article Measuring Travel Characteristics for Transportation Impact s, (ITE Journal, April, 1991). The results indicated that the percent new trips to the mine land use ranged from 90 percent to 100 percent. The resulting weighted average percent new trips is 97 percent for the mine land use. Fuel Efficiency The fuel efficiency level is used to calculate the gas tax credit component of the transportation impact fee. The fuel efficiency figure used calculated a combined fuel efficiency for cars and trucks (11.5% at mpg and 88.5% at 6.40 mpg), and resulted in a weighted mix of 7.78 miles per gallon. This rate Tindale Oliver & Associates, Inc. Pasco County November 5, 2014 Page B 11 Transportation Mobility
71 Reproduced from 2014 Mobility Update Study was applied to the state gasoline tax, but not the second local option gasoline tax, since that tax is not levied on diesel fuel. Calculation An example fee calculation for the mining use is provided in Appendix G. Tindale Oliver & Associates, Inc. Pasco County November 5, 2014 Page B 12 Transportation Mobility
72 Appendix C Cost Component Calculations
73 Appendix C Cost Component Calculations This appendix examines the costs to provide roadway, bicycle, pedestrian, and transit facilities. way Facility Costs Three sources were consulted to determine an appropriate roadway construction cost per lane mile, Florida DOT (FDOT) and Pasco County recent road cost experience and transportation cost indices published by FDOT, FHWA, and National Construction Cost Index. Recent and scheduled road improvement project costs ( ) were identified and costs confirmed with Florida DOT. These projects, comprising 108 lane miles of road construction in the urban and suburban fee districts are summarized in Table C 1. The road projects indicate a weighted average total cost of $4.62 million per lane mile and, discarding the lowest cost and highest cost projects, an average of $4.72 million per lane mile. Design costs for these projects averaged 8.4 percent, and right of way averaged 35.4 percent of construction costs. These recent costs were compared to the arterial (non Interstate) cost per lane mile from the 2014 Mobility Update study (average Urban and Suburban of $4.14 million per lane mile) and found to be 12 percent higher. Similarly, Pasco County provided a summary of their recent and expected roadway construction costs, summarized in Table C 2. These projects comprised 45.6 lane miles of new roadway, with a weighted average cost of $4.18 million per lane mile. Similarly, discarding the highest and lowest cost projects resulted in a cost per lane mile of $4.20 million per lane mile. These costs were found to be 29 percent greater than the costs used in Vehicle capacity cost per vehicle mile of capacity was also computed for the identified improvements. The capacity added was derived from the Florida DOT s Generalized Annual Average Daily Volumes for Florida s Urbanized Areas tables published by the Florida DOT (December, 2013). The changes in service volumes were multiplied by the length of each road improvement to develop the increase in vehicle miles of service volume delivered by each improvement. The increase in vehicle miles of service volume was divided by the total cost of the improvements to estimate the cost per vehicle mile of capacity. The cost per vehicle mile of capacity for State and County roads was similar $460/vehiclemile. This value was compared to the value used in the 2014 study ($ and $ in Urban and Suburban, respectively) and found to be 5.9 percent higher. Both summaries above justify an increase in the construction costs. But, a 12 and 29 percent increase over the past four years was judged to be high. Given that the above tables represent a partial sample of roadways that will be funded over the coming 25 years, and considering that Pasco County was embarking on a Long Range Transportation Plan update study at the time this study was undertaken, other indicators of construction costs were also consulted. The Florida DOT publishes advice on changes in Florida transportation costs which indicates an increase from 2014 to 2017 of five percent (extrapolated to 2018 would indicate 6.7 percent). The National Highway Construction Cost Index indicates a more modest four percent increase over four recent years ( ). In light of these indicators, a 6.7 percent increase in costs from 2014 was selected, resulting in roadway unit costs of W.E. Oliver, P.E., LLC C Mobility Update Study
74 W.E. Oliver, P.E., LLC 2018 Mobility Update Study C Expenditures from FDOT Work Program Website FPID # ADD LANES & RECONSTRUCT ADD LANES & RECONSTRUCT SR 52(SCHRADER HWY) FROM W OF CR 581 (BELLAMY BRO)TO E OF OLD PASCO RD SR 52 (SCHRADER HWY) FROM W OF SUNCOAST PKWY TO E OF US 41 (SR 45) District Length (Mi) ERT IRT Urb UR 4DU & 4DR Pasco County Capacity Addition Projects Project Name On Street/From/To Length Const District (Mi) Year Sub UR 6DU & 6DR Addded Ln Mi Exist Cap ERT IRT Added Ex Cap Imp Cap Ln Mi Added VMC PE Cost Env'm't Mitigation Cost ROW Cost Const Cost CEI Cost Unusual Item Description Project Cost $$/ Ln Mi $$/VMC Clinton Avenue Phase I 1,000 feet west of Fort King to US 301 Sub FY13 2US 4DS ,900 35,800 27,124 $894,828 $12,920,215 $7,258,401 $871,008 $21,944,452 $8,050,056 $ Chancey Double Branch Elementary School to Foxwood Blvd Urb FY15 N/A 2UR , $25,102 $235,333 $260,435 $3,028,314 $ Interlaken Community Drive to Gunn Highway Urb 1.5 FY16 N/A 2UR ,900 23,850 $292,571 $3,158,000 $2,373,000 $5,823,571 $1,941,190 $ Shady Hills and Softwind Bryan Court to Crews Lake Drive Urb 0.25 FY17 N/A 2UR ,900 3,975 $106,257 $173,250 $2,078,750 $2,358,257 $4,716,514 $ Lane Realignment Lake Patience Phase IV Gap West of Marchmont Blvd for 650' Urb 0.12 FY18 N/A 2US ,900 1,908 $30,300 $370,881 $44,506 $445,687 $1,857,028 $ Asbel Extension East US 41 to Central Blvd Sub 0.44 FY19 N/A 2UR ,900 6,996 $155,377 $767,228 $83,698 $1,006,303 $1,143,526 $ Asbel Extension West Litzau Lane to New London Ave Sub 0.13 FY19 N/A 2UR ,900 2,067 $62,635 $465,399 $50,771 $578,805 $2,226,172 $ Ridge Extension Moon Lake to Suncoast Parkway Sub 4.22 FY19 N/A 4DS , ,076 $6,754,355 $6,000,000 $2,600,000 $67,869,800 $83,224,155 $4,930,341 $ CR 54 (Wesley Chapel Blvd) North of SR 54/56 to North of Magnolia Urb 2.5 FY22 2UR 6DS ,900 53,900 95,000 $2,376,999 $12,983,400 $29,347,600 $2,218,568 Bridge included. $46,926,567 $4,692,657 $ Decubellis Phase II West of Starkey Blvd to South of Town Center Sub 1.35 FY22 2US 4DS ,900 35,800 26,865 $215,814 $7,918,384 $863,824 $8,998,022 $3,332,601 $ Decubellis Phase III East of Little to West of Starkey Blvd Urb 1.36 FY22 2US 4DS ,900 35,800 27,064 $250,000 $7,996,228 $872,315 $9,118,543 $3,352,405 $ CR 54 (Wesley Chapel Blvd) North of Magnolia Blvd to Oakley Blvd Urb 1.5 FY22 4DU 6DU ,800 53,900 27,150 $1,252,661 $136,654 $1,389,315 $463,105 $51.17 Collier Parkway Phase I South of Parkway Blvd to South of Hale Sub 1.3 FY23 2US 4DS ,900 35,800 25,870 $426,016 $7,425,068 $810,007 $8,661,092 $3,331,189 $ : ,628 $11,124,440 $6,000,000 $32,300,679 $135,358,733 $5,951,350 $190,735,203 $ % 22.9% 4.2% Wtd Avg $$/Ln Mi: $4,183,523 Suburban Sub s: ,998 Suburban Sub s: $124,412,828 $4,776,658 $ Urban Sub s: ,631 Urban Sub s: $66,322,375 $3,393,143 $ Lane mi excluding High and Low: ,355 Cost discarding High and Low: $167,401,435 Notes: Wtd Average $$/Ln Mi discarding High and Low: $4,199,103 $ ERT=Existing Type: format #lanes, div/undiv, section (Urban, Suburban, Rural) example "4DU" is 4 lanes, divided, urban section. "2UR" is 2 lanes, undivided, rural section. IRT=Improved Type: same coding as above. Unusual Items could include aspects that contribute to a high cost, such as an overpass, a long bridge, grade separation, etc. Imp Cap VMC Added Cap/ Lane PE ENV ROW CST/CEI RRU $$/ Ln MI $$/ VMC ,700 39,800 33,327 11,050 $1,545,638 $287,501 $5,544,610 $15,808,648 $616,699 $23,803,096 $7,892,273 $ ,000 56, ,373 9,800 $6,712,528 $2,340,037 $39,127,048 $51,193,538 $3,355,000 $119,728,151 $8,016,079 $ ADD LANES & RECONSTRUCT US 41 (SR 45) FROM TOWER RD TO RIDGE RD Sub UR 4DS ,700 39,800 62,786 11,050 $3,248,135 $347,566 $7,491,211 $15,939,281 $72,431 $27,098,624 $4,769,205 $ ADD LANES & RECONSTRUCT US 41 (SR 45) FROM N OF CONNERTON BLVD TO S OF SR 52 Sub UR 4DR ,700 39,800 49,305 11,050 $2,389,162 $822,786 $4,955,396 $19,596,046 $0 $27,763,390 $6,222,185 $ SR 54 FROM CR 577/CURLEY RD TO CR ADD LANES & REHABILITATE PVMNT Urb UR 4DU & 579/MORRIS BRIDGE RD 6DU ,700 47, ,819 10,776 $7,405,901 $322,777 $36,263,967 $38,315,539 $7,675,611 $89,983,795 $7,246,239 $ NEW ROAD CONSTRUCTION SR 56 FROM MEADOW POINTE BLVD TO US 301 Urb N/A 4DR , ,446 9,950 $136,278 $10,000 $4,998,354 $63,020,548 $68,185,180 $2,517,917 $ NEW ROAD CONSTRUCTION SR 52 REALIGNMENT FROM URADCO Sub 6.96 N/A 4DU & PLACE TO W OF FORT KING ROAD 4DS , ,008 9,950 $3,992,993 $335,506 $9,217,400 $81,120,967 $94,666,866 $3,400,390 $ ADD LANES & RECONSTRUCT CR 54/ WESLEY CHAPEL BLVD FROM N OF Urb UR 6DU & SR 54/SR 56 TO N OF MAGNOLIA BLVD 6DS ,930 53, ,523 9,495 $0 $0 $11,718,400 $36,645,282 $48,363,682 $3,842,047 $ ,091,587 $25,430,635 $4,466,173 $119,316,386 $333,359,590 : $499,592,784 Capacity/Ln Mi: 10, % 35.7% Wtd Avg: $4,624,917 $458 Average: $5,488,292 $525 Suburban: ,472 Suburban Average $269,257,031 $5,088,001 $503 Urban: ,115 Urban Average $230,335,753 $4,180,170 $414 Min: $2,517,917 $253 Max: $8,016,079 $818 Discard Min and Max: ,768 Discard Min and Max: $311,679,453 $4,721,987 $461 Table C 1: State Unit Cost Table C 2: County Unit Cost
75 $462.52, $477.94, and $ per vehicle mile of capacity for the urban, suburban, and rural districts, respectively. Applying a vehicle occupancy rate of 1.418, these costs are $333.23, $337.05, and $ per person mile of capacity. Transit Capital Costs A model for transit service and cost was developed to establish both the capital cost per person mile of capacity and the system operating cost for revenue budget planning purposes. This model considered changes to the quality of transit service provided in terms of system coverage, hours of service, and headways. Based on a proposed commitment of 15 percent of tax increment revenues earmarked for transportation purposes, this fee update proposes a 2.7 fold increase in service by 2043, increasing daily bus miles of service from 6,200 to 16,650. Table C 3 summarizes the current service and planned service. The proposed increase in service has an associated capital cost of $109.8 million, of which $77.2 million is the value of road system consumed. The increase in person miles of capacity is 106,545, yielding a county wide capital cost per person mile of capacity of $1,030. The calculations are based on the planning and cost parameters provided in Table C 4, which are the same as used for the 2014 study because the values used fall within the ranges indicated in the Florida DOT s Transit Costs report (2015) for the anticipated fleet size. Transit capital costs were computed as the cost of capital features needed to expand the transit system, as follows: Transit Capital Cost = Vehicle Cost + Bus Stops Cost + Park n Ride Lots Cost + Capacity Cost where the bus cost is based on the number of buses needed during peak hours, including a 20 percent fleet margin, three bus stops per mile (one in ten with a shelter), and park n ride lots as identified in the transit service plan. The capital costs were based on service increases that can be funded with 15 percent of the transportation earmark of the property tax increment revenue program. The value of road capacity consumed by the transit service was computed as the vehicle miles of travel by the bus fleet, weighted by the dwell time at three bus stops per mile, multiplied by the cost per vehicle mile of roadway capacity and a capacity utilization factor. The capacity utilization factor is a measure of the extent to which transit capacity is utilized. Under 2016 conditions, annual passenger miles are estimated at 5.1 million per year, or 16,800 per day. Daily capacity of the system, assuming an average vehicle capacity of 34 persons per bus, is 210,860. Thus the capacity utilization (daily passenger miles divided by daily capacity of system) in Pasco County is estimated as less than ten percent. This means that less than ten percent of the total daily capacity of the transit system is used. A lower load factor results in a higher cost per person mile of transit capacity because there are fewer bus riders across which to distribute the costs. Since transit service is intended to serve as an alternative to more heavily congested roads in the future, the assumption of a load factor that reflects current conditions would not be realistic. A higher load factor of 0.30 was used for this study, reflecting the intended, improved future service, particularly on routes where travel demands are high and the roads are most heavily congested. W.E. Oliver, P.E., LLC C Mobility Update Study
76 Table C 3: Transit System Expansion Cost Analysis 2018 Service Urban Suburban Rural County E Miles in District: X % s Covered: 43.9% 24.9% 0% 29.1% I Miles of Coverage: S Operating days/year: T Speed: I Cycles/day: N Minimum Headway (mins): G Park n Ride Lots: E Route-miles: X Route coverage (mi): I Buses needed: S Vehicle-miles/day: ,202 T Vehicle-hours/day: I Capital Cost: $25,775,036 $14,900,747 $0 40,675,783 N Bus Stop Capital Cost: $2,492,361 $1,096,158 $0 3,588,519 G Person-Miles of Capacity: 44,346 18, ,258 Transit Capital Cost: $36,477,963 $19,453,984 $0 $55,931,947 Fixed Route Operating Cost: $8,928,123 $3,947,746 $0 $12,875,869 Paratransit Multiplier: Annual Transit Operating Cost: $11,219,079 $4,960,738 $0 $16,179,817 Local of Capital Cost: $36,477,963 $19,453,984 $0 $55,931,947 Future Service: Level of Service Funded by Increase in O&M Funding from 15% of TIF F Horizon Year -Miles in District: U % Major s Covered: 117.3% 82.5% 48.9% 84.4% T Miles of Coverage: U Operating days/year: R Speed (mph): E Cycles/day: Minimum Headway (mins): Park n Ride Lots: F Route-miles: U Route coverage (mi): T Buses needed: U Vehicle-miles/day: 8,567 5,792 2,288 16,647 R Vehicle-hours/day: ,387 E Capital Cost: 50,790,136 46,550,191 20,513, ,853,357 Bus Stop Capital Cost: 3,314,263 2,816,849 1,193,529 7,324,641 Person-Miles of Capacity: 87,385 59,081 23, ,803 Transit Capital Cost: $74,629,568 $64,167,042 $26,892,179 $165,688,789 Fixed Route Operating Cost: $15,776,990 $10,666,947 $4,213,463 $30,657,400 Paratransit Multiplier: Annual Transit Operating Cost $21,661,808 $10,666,947 $4,213,463 $36,542,218 Local of Capital Cost: $74,629,568 $64,167,042 $26,892,179 $165,688,789 Change: Increase in miles of coverage: Increase in Cycles per day: Reduction in Minimum Headway (minutes): Park 'n' Ride Lots: Capital Cost: $25,015,100 $31,649,445 $20,513,030 $77,177,574 Bus Stop Capital Cost: $821,902 $1,720,691 $1,193,529 $3,736,122 Increase in Fleet Size: Increase in Bus-Miles per Day: 4,219 3,938 2,288 10,446 Increase in Person-Miles of Capacity: 43,039 40,169 23, ,545 Transit Capital Cost: $38,151,605 $44,713,058 $26,892,179 $109,756,842 Annual Transit Operating Cost: $10,442,729 $5,706,209 $4,213,463 $20,362,401 Capital Cost per Person-Mile of Capacity: $886 $1,113 $1,152 $1,030 Non- Capital Cost: $32,579,267 Federal/State (%): 80% Federal/State ($): $26,063,414 Present value of 25 years of one penny of gas tax: $42,208,878 W.E. Oliver, P.E., LLC Equivalent pennies of gas tax: Mobility Update Study C-4


77 Table C 4: Transit System Planning Unit Costs QOS Load Factor: 0.3 Fleet margin: 1.2 Seats / bus: 34 Bus Stops/Mile: 3 % Cadillac Stops: 10% Seconds per stop: 14.4 Transfer Station: $1,280,400 Park n Ride Facility: $107,412 Cost/Basic Stop: $800 Cost/Enhanced Stop: $25,732 Cost/Bus: $432,135 Daily ridership/pk hr ridership: 10 Local of Capital: 100% Operating Cost/veh-hr: $72.22 Bicycle and Pedestrian Facilities The costs of bicycle and pedestrian facilities are included in the costs of roadway facilities discussed above; however, it is necessary to estimate the magnitude of the costs of these facilities within the roadway cost for purposes of allowing the County to recognize an appropriate level of mobility fee credits for developers who build bicycle facilities and to allocate an appropriate portion of mobility fees to fund bicycle and pedestrian facilities. For this purpose, the Florida DOT District 7 s June, 2017 Transportation Costs publication was used, to identify a cost of $491,044 per mile for a 12 foot wide multi use trail, and $257,512 per mile for a 5 foot wide sidewalk. These costs include costs for design, contingencies, mobilization, and other incidentals as indicated in the Transportation Costs document. Table C 5, below, summarizes the computation of the mixed mode unit cost by fee district. The proportions of roadway costs to transit costs in this calculation are based on the capacity addition ratios and transit service expansion levels incorporated into this update. Table C 5: Mixed Mode Cost per Person Mile Calculation network capacity: Person-Miles Capacity Added: 5,933,837 5,107,977 2,059,080 Cost per Person-Mile: $ $ $ Cost: $1,977,340,707 $1,721,641,920 $648,754,343 Transit network capacity: Person-Miles Transit Capacity Added: 43,039 40,169 23,337 Cost per Person-Mile: $ $1, $1, Transit Cost: $38,151,605 44,713,058 26,892,179 Mixed Mode Capacity, Costs: Person-Miles of Capacity Added: 5,976,876 5,148,146 2,082,417 Cost: $2,015,492,313 $1,766,354,977 $675,646,522 Cost/PMC: $ $ $ Modal s: : $ $ $ Transit: $13.09 $7.15 $7.61 Bike/Ped: $10.54 $4.39 $3.86 : $ $ $ Transit : 1.18% 1.76% 2.89% Bike-Ped : 3.2% 1.3% 1.2% : 96.12% 97.92% 97.66% W.E. Oliver, P.E., LLC C Mobility Update Study
78 Appendix D Cross District Travel Analysis
79 Reproduced from 2014 Mobility Report Appendix D Cross District Travel Analysis It is appropriate to recognize that travel generated in one district does not always stay within that district. If travel from a development extends into an adjacent district, it is appropriate to recognize the capacity costs and quality of service standard of the adjacent district in the fee charged to that development. Short trips are less likely to use the transportation systems in neighboring fee districts, but longer trips are likely to make more use of the transportation system in adjacent districts. This appendix documents development of estimates of travel in the home and adjacent districts as a function of development trip length. These estimates are incorporated into the computation of the cost of a person mile of travel, weighted to consider the different system costs and quality of service/capacity addition ratio established for each fee district. Pasco County was divided into three regions, or fee districts urban, suburban, and rural. The urban region is generally located in the west and south parts of the county. The suburban region is generally located in the central and east parts of the county. The rural region is generally located in the north part of the county. This analysis was undertaken using Geographic Information Systems (GIS) buffer zone analysis tools, and person trip generation by traffic analysis zone. The Tampa Bay Regional Planning Model 7.0 (TBRPM) was run for the base 2007 scenario and the future 2035 scenario. The number of net new person trips generated between these two scenarios was assigned to the corresponding traffic analysis zones (TAZs), as represented in a GIS shapefile. The acreage of each TAZ was determined and then the number of net new person trips per acre for each TAZ was calculated. The TAZs were then assigned to their mobility fee district: urban, suburban, or rural. TAZs that overlapped regions were split and the trips within the TAZ were proportionally allocated to the split portions based on their respective areas. The analysis built estimates of the amount of travel in the home and adjacent fee districts using average trip lengths from 0.5 to 8.0 miles, in half mile increments. Two buffer zones were created for each incremental trip length one zone was defined by being far enough away from adjacent zones that no trips were likely to leave the home district, and the second zone was close enough to the fee district boundary that it was likely that some travel would leave the home zone. Based on a review of the trip length distributions for the various trip purposes found in the TBRPM, the approximate buffer distance was determined based on 2.5 times the average trip length for trip lengths less than or equal to 3 miles and 2.0 times the average trip Tindale Oliver & Associates, Inc. Pasco County November 5, 2014 D 1 Transportation Mobility
80 Reproduced from 2014 Mobility Report length for trip lengths greater than 3 miles. These distances were adequate to address 90 to 95 percent of the destinations for trips generated by a land use. The boundary for each region that borders another region within Pasco County was buffered for each of the sixteen trip length buffers, as described above, three separate times (once for each region). Each region was therefore divided into two sub regions; the portion of the region that was outside of the buffer, sub region A, and the portion of the region that fell within the buffer, sub region B, as shown in Figure D 1. A portion of sub region B also extended into the adjacent regions. The acreage for each portion of TAZ within each buffer was determined. The number of person trips per acre was then multiplied by the acreage within each portion of TAZ. The total person trips within each portion of each TAZ within each buffer, each sub region, and each region were totaled. This allowed the table to be populated where as the buffer distance increases, the number of person trips in sub region A decreases while at the same time the number of person trips in sub region B (both in the same and in adjacent regions) increases. Therefore, as the average trip length increases, represented by the buffer distance, the number of person trips within its vicinity, whether in the same region or an adjacent region will increase. These analyses provided an estimate of the number of trips generated by a land use that might be destined to an adjacent fee district, or remain in the home fee district. The results are indicated in Tables D 1 through D 3. The next step was to then determine, for trips travelling into the adjacent fee districts, what proportion of the trip length made use of transportation system in the home district as opposed to those in the adjacent district. These proportions were manually estimated by reviewing maps, the district boundaries, and existing and planned roadway facilities. The final estimates were then smoothed to eliminate sudden changes in proportions. The final cross district travel estimates by trip length are provided in Table D 4. Tindale Oliver & Associates, Inc. Pasco County November 5, 2014 D 2 Transportation Mobility
81 Reproduced from 2014 Mobility Report Figure D 1 Example of Trip Proportioning Buffer Zone Tindale Oliver & Associates, Inc. Pasco County November 5, 2014 D 3 Transportation Mobility
82 Reproduced from 2014 Mobility Report Table D-1 Estimate of Cross-District Travel for Urban District Avg Trip Length Buffer Zone Area A Trips % A trips to Urban % TL in Urban Area B Trips % Area B trips to Urban %Area B trips to Suburban % B to Suburban TL in Urban % B to Suburban TL in Suburban % B to Suburban TL in Rural % Area B trips to Rural % B to Rural TL in Urban % B to Rur TL in Suburban , % 100% 941,946 71% 26% 50% 50% 0% 3% 33% 33% 33% 91.8% 7.6% 0.5% , % 100% 1,315,803 65% 33% 50% 50% 0% 3% 33% 33% 33% 86.3% 13.1% 0.7% , % 100% 1,673,969 60% 37% 50% 50% 0% 3% 33% 33% 33% 80.3% 18.8% 1.0% , % 100% 1,714,496 58% 39% 50% 50% 0% 4% 0% 50% 50% 77.4% 20.8% 1.8% , % 100% 1,718,726 56% 40% 50% 50% 0% 4% 0% 50% 50% 75.9% 21.9% 2.2% , % 100% 1,726,156 54% 41% 50% 50% 0% 5% 0% 50% 50% 74.9% 22.6% 2.5% , % 100% 1,729,732 54% 41% 50% 50% 0% 5% 0% 50% 50% 74.6% 22.8% 2.6% , % 100% 1,734,090 54% 40% 50% 50% 0% 6% 0% 50% 50% 74.1% 23.0% 2.9% , % 100% 1,737,207 54% 41% 50% 50% 0% 6% 0% 50% 50% 73.9% 23.2% 2.9% , % 100% 1,738,327 53% 41% 50% 50% 0% 6% 0% 50% 50% 73.8% 23.3% 2.9% , % 100% 1,738,327 53% 41% 50% 50% 0% 6% 0% 50% 50% 73.8% 23.3% 3.0% , % 100% 1,738,594 53% 41% 50% 50% 0% 6% 0% 50% 50% 73.7% 23.3% 3.0% % 100% 1,740,636 53% 41% 50% 50% 0% 6% 0% 50% 50% 73.7% 23.3% 3.0% % 100% 1,740,636 53% 41% 0% 100% 0% 6% 0% 50% 50% 53.4% 43.6% 3.0% % 100% 1,740,636 53% 41% 0% 100% 0% 6% 0% 50% 50% 53.4% 43.6% 3.0% % 100% 1,740,636 53% 41% 0% 100% 0% 6% 0% 50% 50% 53.4% 43.6% 3.0% % 100% 1,740,636 53% 41% 0% 100% 0% 6% 0% 50% 50% 53.4% 43.6% 3.0% % 100% 1,740,636 53% 41% 0% 100% 0% 6% 0% 50% 50% 53.4% 43.6% 3.0% % 100% 1,740,636 53% 41% 0% 100% 0% 6% 0% 50% 50% 53.4% 43.6% 3.0% % B to Rural TL in Rural %TL in Urban %TL in Suburban % TL in Rural Table D-2 Estimate of Cross-District Travel for Suburban District Avg Trip Length Buffer Zone Area A Trips % A trips to Suburban % TL in Suburban Area B Trips % Area B trips to Suburban %Area B trips to Urban % B to Urban TL in Urban % B to Urban TL in Suburban % B to Urban TL in Rural % Area B trips to Rural % B to Rural TL in Urban % B to Rural TL in Suburban % B to Rural TL in Rural %TL in Urban %TL in Suburban % TL in Rural , % 100% 639,359 55% 39% 100% 0% 0% 6% 0% 40% 60% 18.6% 79.6% 1.8% , % 100% 1,086,425 51% 44% 100% 0% 0% 5% 0% 40% 60% 35.7% 61.8% 2.5% , % 100% 1,305,366 53% 42% 100% 0% 0% 5% 0% 40% 60% 41.3% 55.8% 2.9% , % 100% 1,318,877 53% 41% 100% 0% 0% 5% 0% 40% 60% 41.1% 55.7% 3.3% , % 100% 1,322,929 53% 41% 100% 0% 0% 6% 0% 40% 60% 40.9% 55.5% 3.6% , % 100% 1,324,414 53% 41% 100% 0% 0% 6% 0% 40% 60% 40.8% 55.6% 3.6% % 100% 1,325,169 53% 41% 100% 0% 0% 6% 0% 40% 60% 40.7% 55.7% 3.6% % 100% 1,325,724 53% 41% 100% 0% 0% 6% 0% 40% 60% 40.7% 55.7% 3.6% % 100% 1,326,027 53% 41% 100% 0% 0% 6% 0% 40% 60% 40.7% 55.7% 3.6% % 100% 1,326,042 53% 41% 100% 0% 0% 6% 0% 40% 60% 40.7% 55.7% 3.6% % 100% 1,326,042 53% 41% 100% 0% 0% 6% 0% 40% 60% 40.7% 55.7% 3.6% % 100% 1,326,042 53% 41% 100% 0% 0% 6% 0% 40% 60% 40.7% 55.7% 3.6% % 100% 1,326,042 53% 41% 100% 0% 0% 6% 0% 40% 60% 40.7% 55.8% 3.6% % 100% 1,326,042 53% 41% 100% 0% 0% 6% 0% 40% 60% 40.7% 55.8% 3.6% % 100% 1,326,042 53% 41% 100% 0% 0% 6% 0% 40% 60% 40.7% 55.8% 3.6% % 100% 1,326,042 53% 41% 100% 0% 0% 6% 0% 40% 60% 40.7% 55.8% 3.6% % 100% 1,326,042 53% 41% 100% 0% 0% 6% 0% 40% 60% 40.7% 55.8% 3.6% % 100% 1,326,042 53% 41% 100% 0% 0% 6% 0% 40% 60% 40.7% 55.8% 3.6% % 100% 1,326,042 53% 41% 100% 0% 0% 6% 0% 40% 60% 40.7% 55.8% 3.6% Table D-3 Estimate of Cross-District Travel for Rural District Avg Trip Length Buffer Zone Area A Trips % A trips to Rural % TL in Rural Area B Trips % Area B trips to Rural %Area B trips to Urban % B to Urban TL in Urban % B to Urban TL in Suburban % B to Urban TL in Rural % Area B trips to Suburban % B to Suburban TL in Urban % B to Suburban TL in Suburban % B to Suburban TL in Rural %TL in Urban %TL in Suburban % TL in Rural , % 100% 122,836 22% 20% 50% 0% 50% 59% 2% 49% 49% 6.9% 18.2% 75.0% , % 100% 141,174 17% 18% 50% 0% 50% 65% 0% 50% 50% 6.6% 23.3% 70.1% , % 100% 162,135 14% 15% 41% 41% 19% 71% 0% 50% 50% 5.1% 34.5% 60.4% , % 100% 180,519 13% 16% 42% 42% 15% 71% 0% 50% 50% 6.2% 39.0% 54.8% % 100% 195,108 12% 18% 44% 44% 13% 70% 0% 50% 50% 8.1% 43.0% 48.9% % 100% 195,136 9% 31% 45% 45% 10% 60% 0% 50% 50% 13.9% 43.8% 42.3% % 100% 195,136 9% 34% 45% 45% 9% 57% 0% 50% 50% 15.3% 44.0% 40.7% % 100% 195,136 8% 36% 46% 46% 9% 55% 0% 50% 50% 16.6% 44.2% 39.3% % 100% 195,136 8% 42% 46% 46% 8% 51% 0% 50% 50% 19.1% 44.4% 36.5% % 100% 195,136 6% 51% 46% 46% 8% 43% 0% 50% 50% 23.4% 44.9% 31.7% % 100% 195,136 6% 53% 47% 47% 7% 41% 0% 50% 50% 24.8% 45.2% 30.0% % 100% 195,136 6% 53% 47% 47% 6% 41% 0% 50% 50% 24.9% 45.3% 29.8% % 100% 195,136 6% 53% 47% 47% 6% 41% 0% 50% 50% 25.1% 45.5% 29.5% % 100% 195,136 6% 53% 47% 47% 5% 41% 0% 50% 50% 25.2% 45.6% 29.2% % 100% 195,136 6% 53% 47% 47% 5% 41% 0% 50% 50% 25.3% 45.7% 29.0% % 100% 195,136 6% 53% 47% 47% 5% 41% 0% 50% 50% 25.3% 45.7% 29.0% % 100% 195,136 6% 53% 47% 47% 5% 41% 0% 50% 50% 25.3% 45.7% 29.0% % 100% 195,136 6% 53% 47% 47% 5% 41% 0% 50% 50% 25.3% 45.7% 29.0% % 100% 195,136 6% 53% 47% 47% 5% 41% 0% 50% 50% 25.3% 45.7% 29.0% Tindale Oliver & Associates, Inc. Pasco County November 5, 2014 D 4 Transportation Mobility
83 Reproduced from 2014 Mobility Report Table D 4 Percent of Travel in Home and Adjacent Districts by Development Average Trip Length Average Trip "Urban" Home District "Suburban" Home District "Rural" Home District Length (Miles) Urban Suburban Rural Urban Suburban Rural Urban Suburban Rural % 5.00% 2.00% 23.20% 73.00% 3.80% 6.00% 14.00% 80.00% % 10.07% 3.85% 27.01% 67.86% 5.13% 9.00% 20.00% 71.00% % 13.90% 4.77% 29.72% 64.42% 5.86% 11.36% 23.64% 65.00% % 16.14% 5.19% 31.31% 62.49% 6.20% 14.87% 26.55% 58.58% % 17.73% 5.43% 32.43% 61.16% 6.41% 19.10% 28.61% 52.29% % 18.97% 5.59% 33.30% 60.14% 6.56% 21.91% 30.21% 47.88% % 19.98% 5.70% 34.02% 59.32% 6.66% 23.93% 31.52% 44.55% % 20.83% 5.78% 34.62% 58.64% 6.74% 25.46% 32.62% 41.92% % 21.57% 5.84% 35.14% 58.06% 6.80% 26.65% 33.58% 39.77% % 22.22% 5.89% 35.60% 57.55% 6.85% 27.62% 34.42% 37.96% % 22.80% 5.93% 36.01% 57.09% 6.89% 28.41% 35.18% 36.41% % 23.33% 5.95% 36.39% 56.69% 6.93% 29.07% 35.86% 35.07% % 23.81% 5.97% 36.73% 56.32% 6.95% 29.63% 36.49% 33.88% % 24.25% 5.99% 37.04% 55.98% 6.98% 30.11% 37.06% 32.83% % 24.66% 6.00% 37.33% 55.67% 7.00% 30.53% 37.59% 31.88% % 25.04% 6.01% 37.60% 55.38% 7.02% 30.89% 38.09% 31.02% % 25.40% 6.02% 37.85% 55.12% 7.03% 31.21% 38.55% 30.24% % 25.73% 6.03% 38.09% 54.87% 7.04% 31.49% 38.98% 29.53% % 26.05% 6.03% 38.31% 54.63% 7.06% 31.74% 39.39% 28.87% % 26.35% 6.03% 38.52% 54.41% 7.07% 31.96% 39.78% 28.26% Notes: *An average trip length of 6.53 miles in the Urban home district was used in the example in section Cross District Travel Analysis Tindale Oliver & Associates, Inc. Pasco County November 5, 2014 D 5 Transportation Mobility
84 Appendix E Component Calculations and s Revenue Estimates
85 Appendix E Transportation Revenues Estimates and Component Calculations This appendix presents the revenue estimates for the credit component. In addition to the capital funding from State and Federal fuel tax revenues, Pasco County s transportation system is financially supported by several local funding sources. There are two purposes for reviewing the mobility finance revenue program to estimate the level of revenues generated by a proposed development that should be recognized as a self credit, and to estimate revenues that would be available to fund policy based incentives. Projections of revenue for transportation system expansion from all of these sources, and how they are converted to revenues generated by each land use as a self credit, are discussed below, along with a few pertinent characteristics of each source. State/Federal Fuel Tax During the required five year update to the Long Range Transportation Plan (LRTP), the Florida DOT publishes a statement of anticipated improvements in each County. While the initial steps of the next LRTP had commenced at the time of this study, the forecast of state and federal revenues had not yet been issued. Thus, for this 2018 Update study, the forecast of State and Federal revenues was based on a review of the Florida DOT s past six years and upcoming five years construction program, as well as considerations from the previous (2014) Mobility Update study. State and Federal motor fuel revenues are made up of three components arterial roads 9including bike and pedestrian facilities), Interstate highways, and transit capital funding. Table E 1 presents the summary of the recent and expected State/Federal arterial highway (non Interstate) expenditures to expand the mobility system. This program indicates equivalent pennies of motor fuel taxes for arterial road construction. In the 2014 Mobility Update study, expenditures to widen I 75 were recognized as an infrequent and disproportionately large infusion (for the five year program) of capital funds that does not occur on a recurring annual basis, so the Interstate related funding was distributed over a 50 year planning horizon. Interstate widening is essentially complete, so Interstate expenditures are not included in Table E 1, but the same number of pennies per gallon attributed to I 75 improvements in 2014 (3.72 pennies) were also recognized in this update study. The third component of State and Federal funding of capital needs is in the transit system, where the capital costs of expanding a transit system are largely funded by State and Federal sources. 80 percent of the capital costs of expanding the transit system was also converted to an equivalent of 0.62 pennies of gasoline tax. This calculation is provided in Appendix Table C 3. Thus, the total equivalent number of State and Federal motor fuel taxes is E-1

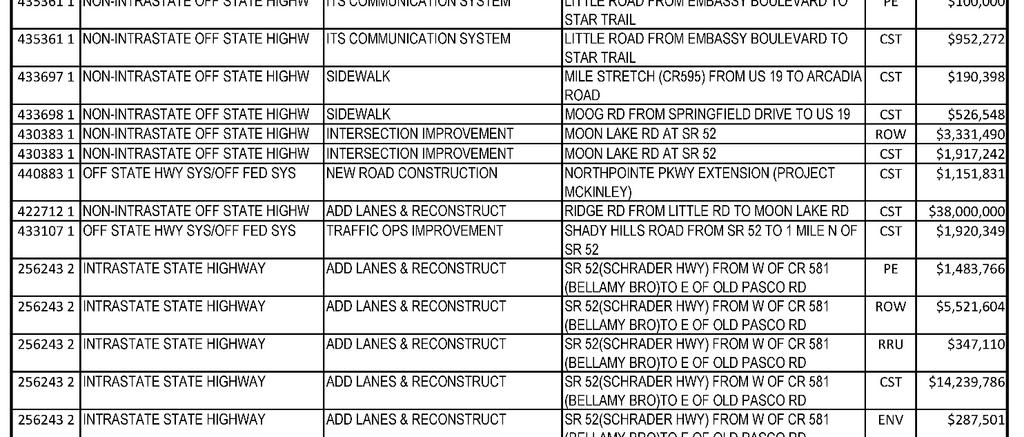
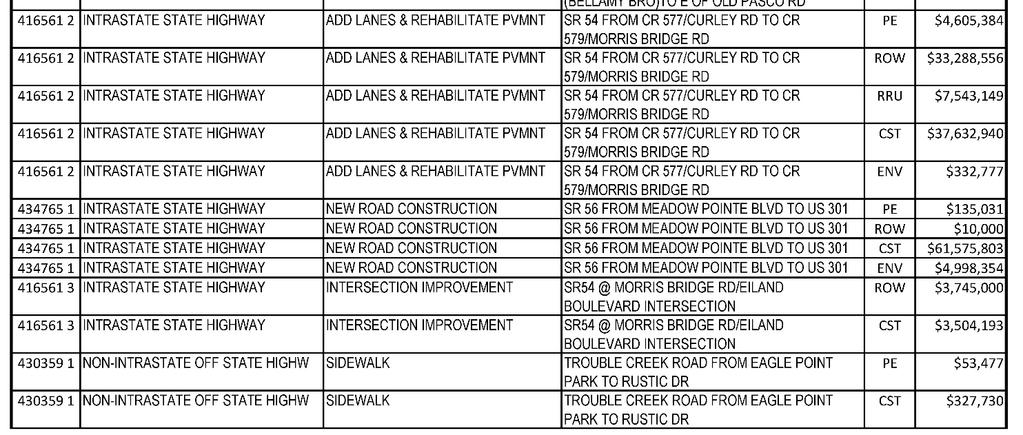
86 Table E 1: State/Federal Arterial Expenditures E-2
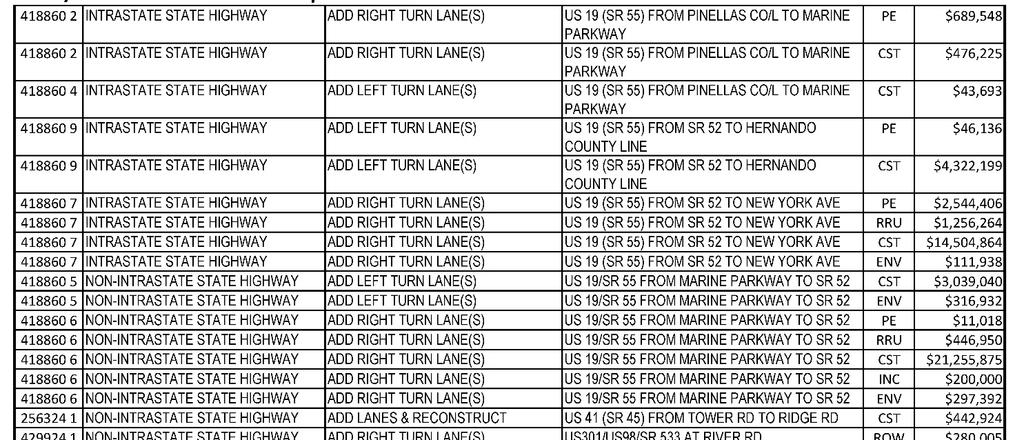
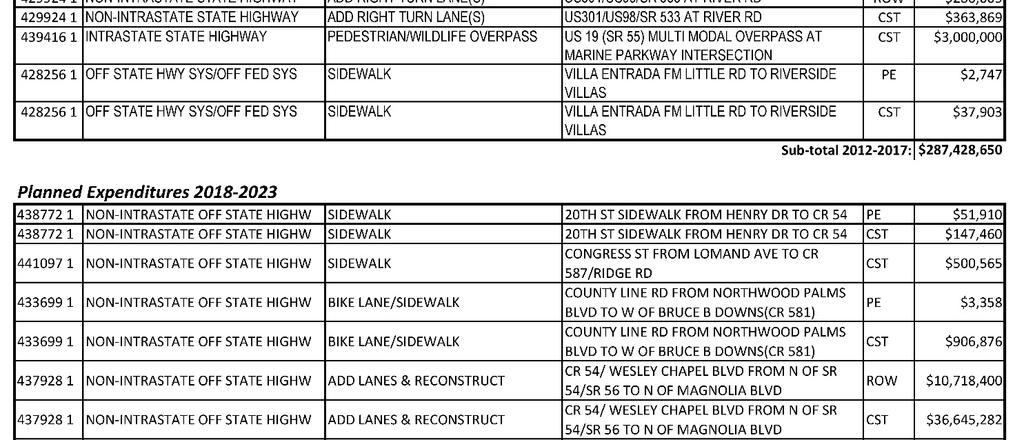
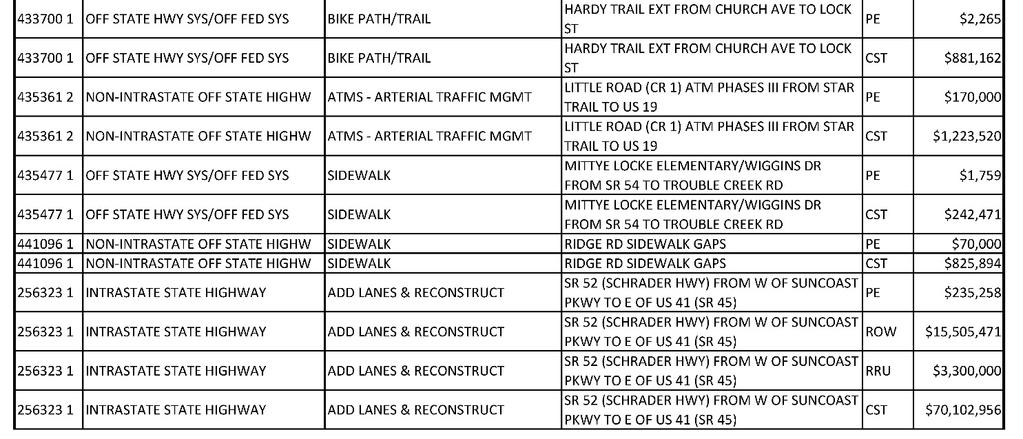
87 Table E 1: State/Federal Arterial Expenditures (continued) E-3


88 Table E 1: State/Federal Arterial Expenditures (continued) E-4
89 County Fuel Taxes Constitutional Fuel Tax (2 /gallon) This tax applies to every gallon of motor and diesel fuel sold within a county. Collected in accordance with Article XII, Section 9 (c) of the Florida Constitution, the State allocates 80 percent of this tax to Counties after first withholding amounts pledged for debt service on bonds issued pursuant to provisions of the State Constitution for road and bridge purposes. The 20 percent surplus can be used to support the road construction program within the county. Pasco County currently allocates these revenues to roadway operations and maintenance. County Fuel Tax (1 /gallon) Tax applies to every gallon of motor and diesel fuel sold within a county. The primary purpose of these funds, as stated in the enabling legislation, is to help reduce a County s reliance on ad valorem taxes. Proceeds are to be used for transportation related expenses, including the reduction of bond indebtedness incurred for transportation purposes. Authorized uses include acquisition of rights of way; the construction, reconstruction, operation, maintenance, and repair of transportation facilities, roads, bridges, bicycle paths, and pedestrian pathways; or the reduction of bond indebtedness incurred for transportation purposes. Pasco County currently allocates these revenues to roadway operations and maintenance. 1st Local Option Tax (6 /gallon) This tax applies to every net gallon of motor and diesel fuel sold within a county. Proceeds may be used to fund transportation expenditures. To accommodate statewide equalization, all six cents are automatically levied on diesel fuel in every county, regardless of whether a County is levying the tax on motor fuel at all or at the maximum rate. Proceeds are distributed to a county and its municipalities according to a mutually agreed upon distribution scheme, or by using a formula contained in the Florida Statutes. Pasco County currently levies this tax, and applies it for non capital (e.g. operations and maintenance) purposes. 2nd Local Option Tax (5 /gallon) This tax applies to every gallon of gasoline only (e.g. not diesel) sold within a county. Proceeds may be used to fund transportation expenditures needed to meet the requirements of the capital improvements element of an adopted Local Government Comprehensive Plan. Proceeds are distributed to a county and its municipalities according to a mutually agreed upon distribution scheme, or by using a formula contained in the Florida Statutes. In September, 2014, the Pasco County Board of County Commissioners voted to begin collecting all five pennies of the 2nd Local Option Fuel Tax, starting on January 1, 2015, for purposes of funding expansion of the County s mobility system. Ninth Cent Fuel Tax (1 /gallon) This tax is levied on every net gallon of motor fuel (gasoline and diesel) sold within a county. Proceeds may be used to fund transportation expenditures. To accommodate statewide equalization, this tax is automatically levied on diesel fuel in every county, regardless of whether a County is levying the tax on motor fuel at all. Counties are not required to share the E-5
90 proceeds of this tax with their municipalities. Pasco County applies these revenues to operations and maintenance of the road system, and not expansion. Each year, the Florida Legislative Committee on Intergovernmental Relations (LCIR) produces the Local Government Financial Information Handbook (LGFI), which details the estimated local government revenues for the upcoming fiscal year. Included in this document are the estimated distributions of the various fuel tax revenues for each county in the state. The LGFI issued in December, 2017, was used in this mobility fee update study. Since the Second Local Option Fuel Tax is the only motor fuel tax that Pasco County applies towards mobility system expansion, the projected fuel tax distributions to Pasco County for the upcoming fiscal year, provided in a table named Local Option Fuel Tax Levies on Motor Fuel in Florida's Counties Local Fiscal Year Ending September 30, 2018, on page 215 of the LGFI was used as a basis for projecting the total revenues anticipated from this source over the coming 25 years. The projection is based on estimates of future population and travel growth, and estimates of improving vehicle fleet fuel efficiency. Table E 2 shows the revenue per penny of Second Local Option Fuel Tax, and accounts for the locally agreed upon distribution formula. The Board of County Commissioners receive just under 94 percent of the revenues, which results in a 25 year forecast of $198.3 million. For purposes of estimating what share of this revenue might be eligible to fund policy incentives, it was assumed that any development that existed more than 25 years ago was generating motor fuel taxes that can help with the needs of growth. Motor fuel taxes generated by development occurring within the past 25 years would still be viewed as funding the capacity needs of that development. Population growth was used as a basis for estimating the proportion of motor fuel taxed generated by the immediately preceding rolling 25 year period (from 2019 through 2043), and was estimated to be 70.1 percent. This calculation is also shown in Table E 2. Sales Tax In addition to the gas tax credit, Pasco County collects a one cent Penny for Pasco sales tax. The revenue generated from this tax is used to finance specific transportation capacity expansion needs throughout the County. In 2013, this tax was re adopted and extended through percent of the BoCC s 45 percent share is allocated for transportation capital purposes. This study assumed the sales tax would continue in effect and fund transportation needs through In 2018, the sales tax generated $62.8 million, with $8.5 million allocated to transportation. At $1,885,209 per year per penny of gasoline tax, the sales tax converts to 6.69 pennies of gasoline tax per gallon for mobility fee self credit purposes. Similarly to the motor fuel tax, the proportion of sales taxes generated by development existing for more than 25 years was considered available for policy incentives, which in the case of sales tax revenues was estimated to be 64 percent of the total revenue forecast. Table E 3 summarizes the sales tax revenue analysis. E-6
91 E-7 Gasoline Tax Revenue: 2nd LOGT Effective Year: 2015 Annual Imp in MPG: 0.5% y = E-33x E+01 From SREC and FHWA VM-1 data. Annual VMT Growth Rate: 2.07% From TBRPM 8.4 data 2nd LOGT (1-5 Cents) s Annual Revenue to Capital: $8,855,224 $8,855,224 Number of Pennies Levied: 5 15 Effective Pennies: Yield per Penny to County for Capital: $1,771,045 to Capital: 100% to County: % Est yield of 1 Penny in 2018 (-LGFI 2017): $1,885,209 Calibration Adjustment Factor: PV $$ of 1 Penny: $42,208, % 29.9% YOC $$ ( ): $290,735,866 $203,837,779 $86,898,087 PV $$ ( ): $138,886,909 $59,377,043 Year VMT/Day Fuel Eff (mpg) Gals/yr 1 5 Cents Non State/ Federal YOC $$ YOC $$ From Base YOC $$ From Growth FDOT Inflation Factor Conv't from YOC to PV Present Value $$ from Base Present Value $$ from Growth ,142, ,322,472 $9,465,349 $9,465,349 $5,565,442 $3,899, $5,749,102 $4,028, ,434, ,517,492 $9,611,925 $9,611,925 $5,836,569 $3,775, $5,836,569 $3,775, ,732, ,761,990 $9,760,771 $9,760,771 $6,120,904 $3,639, $5,965,794 $3,547, ,037, ,056,730 $9,911,922 $9,911,922 $6,419,091 $3,492, $6,109,784 $3,324, ,347, ,402,492 $10,065,414 $10,065,414 $6,781,258 $3,284, $6,260,355 $3,031, ,664, ,800,064 $10,221,283 $10,221,283 $7,020,340 $3,200, $6,286,164 $2,866, ,988, ,250,250 $10,379,565 $10,379,565 $7,366,433 $3,013, $6,385,287 $2,611, ,319, ,753,864 $10,540,299 $10,540,299 $7,748,992 $2,791, $6,489,659 $2,337, ,656, ,311,733 $10,703,521 $10,703,521 $8,187,599 $2,515, $6,612,199 $2,031, ,000, ,924,698 $10,869,271 $10,869,271 $7,882,832 $2,986, $6,126,955 $2,321, ,351, ,593,612 $11,037,588 $11,037,588 $8,239,430 $2,798, $6,151,688 $2,089, ,710, ,319,341 $11,208,511 $11,208,511 $8,544,653 $2,663, $6,175,772 $1,925, ,076, ,102,765 $11,382,082 $11,382,082 $8,811,513 $2,570, $6,165,197 $1,798, ,449, ,944,777 $11,558,340 $11,558,340 $8,778,914 $2,779, $5,946,164 $1,882, ,831, ,846,285 $11,737,327 $11,737,327 $8,785,994 $2,951, $5,760,852 $1,935, ,220, ,808,211 $11,919,086 $11,919,086 $8,637,171 $3,281, $5,482,353 $2,083, ,617, ,831,489 $12,103,660 $12,103,660 $8,524,148 $3,579, $5,237,767 $2,199, ,022, ,917,069 $12,291,092 $12,291,092 $8,717,299 $3,573, $5,185,335 $2,125, ,436, ,065,918 $12,481,427 $12,481,427 $8,424,569 $4,056, $4,851,122 $2,336, ,858, ,279,013 $12,674,709 $12,674,709 $8,290,470 $4,384, $4,621,398 $2,443, ,289, ,557,351 $12,870,984 $12,870,984 $8,775,096 $4,095, $4,735,281 $2,210, ,729, ,901,941 $13,070,298 $13,070,298 $9,214,874 $3,855, $4,813,744 $2,014, ,178, ,313,810 $13,272,699 $13,272,699 $8,898,183 $4,374, $4,499,814 $2,212, ,637, ,793,999 $13,478,235 $13,478,235 $9,045,088 $4,433, $4,427,981 $2,170, ,104, ,343,566 $13,686,953 $13,686,953 $9,321,008 $4,365, $4,417,286 $2,069, ,582, ,963,586 $13,898,903 $13,898,903 $9,465,349 $4,433, $4,342,391 $2,033,969 Table E 2: County Second Local Option Gasoline Tax Revenue Analysis
92 E-8 Penny for Pasco Sales Tax Revenue: 2018 Revenue Estimate 1 %: $ 64,207,845 : LGFI 2017 to BoCC: 45% $$ to BoCC: $28,893,530 Proportion to transportation Capital: 40% Proportion to transportation O&M: 0% Income Inflation Rate: % : Florida Office of Demographic and Economic Research 2018 Sales tax rate: 1.00% Sales tax 1% equivalent gas tax pennies: 6.69 pennies Years of Sales Tax ed: 25 Year Sales Tax Started: % 36.0% Equiv Pennies/Gal: PV P4P FY : $180,623,129 $101,795,950 $282,419,079 Year Population "New Growth" Population Since Incep of P4P "Non Growth" Population Annual Sales 1% Sales Tax Proceeds YOC Revenue from Base for Transpo Capital (40% of 45%) YOC Revenue from Growth for Transportation Capital Discount Factor to PV PV Revenue from Base for Capital PV Revenue from Growth for Capital PV of P4P Sales Tax $$ to Transpo , , ,776 $ $62,844,842 $8,548,865 $2,763, $8,830,977 $2,854,393 $11,685, , , ,776 $ $64,749,160 $8,636,377 $3,018, $8,636,377 $3,018,472 $11,654, , , ,776 $ $66,711,183 $8,724,785 $3,283, $8,446,065 $3,178,343 $11,624, , , ,776 $ $68,732,658 $8,814,098 $3,557, $8,259,946 $3,334,099 $11,594, , , ,776 $ $70,815,388 $8,904,325 $3,842, $8,077,929 $3,485,834 $11,563, , , ,776 $ $72,961,229 $8,995,476 $4,137, $7,899,923 $3,633,636 $11,533, , , ,776 $ $75,172,093 $9,087,560 $4,443, $7,725,839 $3,777,595 $11,503, , , ,776 $ $77,449,950 $9,180,587 $4,760, $7,555,592 $3,917,797 $11,473, , , ,776 $ $79,796,831 $9,274,565 $5,088, $7,389,096 $4,054,325 $11,443, , , ,776 $ $82,214,826 $9,369,506 $5,429, $7,226,269 $4,187,263 $11,413, , , ,776 $ $84,706,092 $9,465,419 $5,781, $7,067,030 $4,316,691 $11,383, , , ,776 $ $87,272,847 $9,562,314 $6,146, $6,911,301 $4,442,688 $11,353, , , ,776 $ $89,917,380 $9,660,200 $6,524, $6,759,002 $4,565,330 $11,324, , , ,898 $ $92,642,048 $10,187,784 $6,487, $6,900,426 $4,394,329 $11,294, , , ,355 $ $95,449,278 $10,733,631 $6,447, $7,037,890 $4,227,364 $11,265, , , ,425 $ $98,341,572 $11,100,826 $6,600, $7,046,132 $4,189,698 $11,235, , , ,668 $ $101,321,509 $11,323,992 $6,913, $6,958,165 $4,248,318 $11,206, , , ,786 $ $104,391,743 $11,469,069 $7,321, $6,822,177 $4,355,035 $11,177, , , ,697 $ $107,555,011 $12,242,772 $7,117, $7,049,759 $4,098,259 $11,148, , , ,533 $ $110,814,132 $12,416,963 $7,529, $6,921,650 $4,197,251 $11,118, , , ,562 $ $114,172,011 $12,598,628 $7,952, $6,798,563 $4,291,296 $11,089, , , ,566 $ $117,631,640 $12,863,520 $8,310, $6,719,754 $4,341,139 $11,060, , , ,340 $ $121,196,102 $13,153,645 $8,661, $6,651,803 $4,380,201 $11,032, , , ,588 $ $124,868,574 $13,516,947 $8,959, $6,617,158 $4,386,031 $11,003, , , ,868 $ $128,652,329 $13,887,204 $9,270, $6,581,235 $4,393,214 $10,974, , , ,717 $ $132,550,739 $14,308,013 $9,551, $6,564,046 $4,381,740 $10,945,786 Table E 3: Penny for Pasco Sales Tax Revenue Analysis
93 Tax Increment Self The Pasco County BCC established a property tax increment finance district on the entire unincorporated county to fund transportation needs. These funds are first be applied to meet bond indebtednesss, then to fund mobility fee policy incentives, then to fund transit operations, and then to be applied to transportation capital needs. In 2014, it was envisioned that very little of these funds would be applied to mobility system capital expansion so (as a conservative measure) a small credit was issued amounting to an equivalent 0.25 mills over a 25 year life of the development. However, in 2018, it is anticipated that an average of 55 percent of the tax increment district funds might be applied for mobility system expansion, so the County determined it would be appropriate to recognize the increased mobility system funding from this revenue source. Tax increment revenues are based on the increase in taxable value of property over time. In the year established, no revenue is generated, but as the property tax base appreciates, the value of the proceeds is based on the increase in property value. Thus, this revenue source does not produce large amounts of income in its early years, but the future revenues can be substantial as property values rise. The share of property taxes that would be identified as the tax increment self credit was based on the contribution of new development to the total property tax proceeds. Over the coming 25 years, it was estimated that the portion of property taxes generated by new growth that would be allocated for mobility system expansion would be percent to the total property tax revenues. To estimate the magnitude of this credit for individual land uses, the taxable value of the various land use categories of the impact fee were researched in Pasco County s property tax records, current as of May, 2018, and the results are indicated in Table E 5. The table also provides the calculation of the present value of percent of the 2018 millage rate applied to the taxable property value, at a 3.3 percent per year discount rate. In this analysis, an assumption that property values would appreciate by a minimum of two percent per year was incorporated based on guidance of Pasco County s Office of Management and Budget. This rate was higher in the early years of the revenue forecast. Fuel Efficiency for Calculations To recognize credits for motor fuel taxes, it is necessary to convert vehicle miles of travel to gallons of fuel consumed. For this purpose, information published by the U.S. Department of Transportation, Federal Highway Administration was used. Table E 6 presents the FHWA fuel efficiency information, and the calculation of the 19.0 miles per gallon fuel efficiency applied in this study is provided at the bottom of the table. Because the national tabulations of the Federal form include a much more substantial representation of Interstate mileage than occurs in Pasco County, the calculations for the 19.0 miles per gallon exclude the interstate highway portions of the federal numbers. E-9
94 10/22/2018 Property Tax Increment (Excludes CRA's): Budgeting allowed collection rate: 0.97 E-10 Assessed Year Millage Rate % to Transportation Homestead Exemption Effect Yearly % Yearly PT Increase Valuation from Increase from Revaluation Revaluation Accumulative Increment Increase from Revaluation YOC $$ for Transport from Revaluation (Applies Millage and 33.3%) Yearly % Increase from Growth Yearly Valuation Increase from Growth Accumulative Increase from Growth YOC $$ for Transport from Growth (Applies Millage and 33.3%) YOC Increment- Generated Revenue (Applies 97%) "End-of-Year" Valuation (Excludes CRA's) % 3.70% $768,704,284 3,987,802,476 $10,111, % $789,480,075 $2,584,812,367 $6,554,084 $16,165,640 $22,333,975, $6,357,462 $16,165,640 45% $4,413,680 $2,860,858 $164,810, % $6,344, % 4.60% $1,027,362,887 5,015,165,363 $12,716, % $1,027,362,887 $3,612,175,254 $9,159,079 $21,219,330 $24,388,701, $8,600,490 $20,541,462 45% $5,373,437 $3,870,221 $174,223, % $8,061, $1,667,968,459 -$969,607,903 4,045,557,460 -$698,360,556 $2,913,814,698 $22,720,733, % 3.80% $863,387,859 4,908,945,319 $12,447, % $863,387,859 $3,777,202,556 $9,577,524 $21,363,969 $24,447,508, $8,706,114 $20,020,794 45% $5,091,606 $3,917,751 $169,064, % $7,857, % 3.80% $929,005,336 5,837,950,654 $14,802, % $929,005,336 $4,706,207,892 $11,933,122 $25,933,829 $26,305,519, $10,500,860 $23,526,953 45% $5,861,742 $4,725,387 $176,102, % $9,233, % 3.50% $920,693,183 6,758,643,837 $17,137, % $946,998,702 $5,653,206,594 $14,334,345 $30,527,501 $28,173,211, $12,210,917 $26,809,577 45% $6,569,397 $5,494,913 $182,580, % $10,521, % 3.50% $986,062,399 7,744,706,236 $19,637, % $1,014,235,610 $6,667,442,205 $16,906,054 $35,447,323 $30,173,509, $13,941,592 $30,135,738 60% $9,716,488 $8,364,955 $189,296, % $15,768, % 3.00% $905,205,282 8,649,911,518 $21,932, % $905,205,282 $7,572,647,487 $19,201,304 $39,900,109 $31,983,919, $15,328,531 $32,837,656 60% $10,505,475 $9,197,118 $194,244, % $17,182, % 2.50% $799,597,999 9,449,509,517 $23,960, % $959,517,599 $8,532,165,086 $21,634,269 $44,226,732 $33,743,035, $16,719,055 $35,235,675 60% $11,109,973 $10,031,433 $198,381, % $18,437, % 2.50% $843,575,889 10,293,085,406 $26,099, % $843,575,889 $9,375,740,975 $23,773,251 $48,376,357 $35,430,187, $17,785,159 $37,310,459 60% $11,715,180 $10,671,095 $201,646, % $19,523, % 2.00% $708,603,747 11,001,689,153 $27,896, % $885,754,684 $10,261,495,659 $26,019,183 $52,297,753 $37,024,545, $18,843,540 $39,046,323 60% $12,121,670 $11,306,124 $203,988, % $20,431, % 2.00% $740,490,915 11,742,180,069 $29,773, % $925,613,644 $11,187,109,303 $28,366,181 $56,395,612 $38,690,650, $19,887,005 $40,760,744 60% $12,524,243 $11,932,203 $206,358, % $21,328, % 2.00% $773,813,007 12,515,993,076 $31,735, % $967,266,258 $12,154,375,561 $30,818,794 $60,677,874 $40,431,729, $20,916,250 $42,454,802 60% $12,923,131 $12,549,750 $208,755, % $22,215, % 2.00% $808,634,592 13,324,627,668 $33,786, % $1,010,793,240 $13,165,168,801 $33,381,774 $65,152,838 $42,251,157, $21,931,952 $44,129,548 60% $13,318,558 $13,159,171 $211,180, % $23,091, % 2.00% $845,023,149 14,169,650,816 $35,928, % $1,056,278,936 $14,221,447,737 $36,060,089 $69,829,176 $44,152,459, $22,934,768 $45,786,003 60% $13,710,741 $13,760,861 $213,633, % $23,958, % 2.00% $883,049,190 15,052,700,007 $38,167, % $1,103,811,488 $15,325,259,225 $38,858,928 $74,715,948 $46,139,320, $23,925,336 $47,425,161 60% $14,099,895 $14,355,202 $216,115, % $24,815, % 2.00% $922,786,404 15,975,486,410 $40,507, % $1,153,483,005 $16,478,742,230 $41,783,714 $79,822,626 $48,215,589, $24,904,278 $49,047,987 55% $13,279,040 $13,697,353 $218,626, % $23,526, % 2.00% $964,311,792 16,939,798,202 $42,952, % $1,205,389,740 $17,684,131,970 $44,840,116 $85,159,104 $50,385,291, $25,872,198 $50,655,422 55% $13,630,773 $14,229,709 $221,165, % $24,297, % 2.00% $1,007,705,823 17,947,504,025 $45,507, % $1,259,632,278 $18,943,764,248 $48,034,056 $90,735,723 $52,652,629, $26,829,682 $52,248,381 55% $13,980,284 $14,756,325 $223,735, % $25,061, % 2.00% $1,053,052,585 19,000,556,610 $48,178, % $1,316,315,731 $20,260,079,979 $51,371,724 $96,563,290 $55,021,997, $27,777,304 $53,827,755 55% $14,327,748 $15,277,517 $226,334, % $25,818, % 2.00% $1,100,439,951 20,100,996,561 $50,968, % $1,375,549,939 $21,635,629,918 $54,859,586 $102,653,098 $57,497,987, $28,715,617 $55,394,411 55% $14,673,337 $15,793,589 $228,963, % $26,570, % 2.00% $1,149,959,749 21,250,956,310 $53,884, % $1,437,449,686 $23,073,079,604 $58,504,402 $109,016,947 $60,085,396, $29,645,164 $56,949,194 55% $15,017,217 $16,304,840 $231,623, % $27,316, % 2.00% $1,201,707,938 22,452,664,247 $56,931, % $1,502,134,922 $24,575,214,526 $62,313,235 $115,667,169 $62,789,239, $30,566,470 $58,492,927 55% $15,359,552 $16,811,558 $234,313, % $28,056, % 2.00% $1,255,784,795 23,708,449,042 $60,115, % $1,569,730,993 $26,144,945,519 $66,293,466 $122,616,652 $65,614,755, $31,480,048 $60,026,411 55% $15,700,500 $17,314,026 $237,035, % $28,792, % 2.00% $1,312,295,110 25,020,744,153 $63,442, % $1,640,368,888 $27,785,314,408 $70,452,807 $129,878,861 $68,567,419, $32,386,397 $61,550,428 55% $16,040,217 $17,812,518 $239,789, % $29,523, % 2.00% $1,371,348,390 26,392,092,543 $66,920, % $1,714,185,488 $29,499,499,896 $74,799,318 $137,467,869 $71,652,953, $33,286,004 $63,065,738 55% $16,378,854 $18,307,302 $242,574, % $30,249, % 2.00% $1,433,059,068 27,825,151,611 $70,553, % $1,791,323,835 $31,290,823,731 $79,341,422 $145,398,383 $74,877,336, $34,179,340 $64,573,086 55% $16,716,560 $18,798,637 $245,392, % $30,972,987 s: $564,231,531 $1,128,018,275 $314,159,297 $315,300,417 $5,459,938,944 $548,955,078 Note: "YOC"=Year of Collection" % of Property Tax Revenues from Capital from Growth: 5.775% Allowance for Tax Inc "Self-": $80,504,636 Tax Inc Revenues available for s: $548,955,078 PV Discount Factor Present Value Revenue from Growth: Present Value Revenue to Transportation % to Capital PV $$ to Capital from Base PV $$ to Capital from Growth PV Property Tax Yield % of Yield by Growth PV Property Tax Inc "Self- " Allowance F:\WEO-PE\Projects\ AECOM-Pasco Mobilty 2017\3. Analysis\Strategic Planning\StrPln 2018 Under Const v5.xls : W.E. Oliver, P.E., LLC

95 Table E 5: Property Tax Increment Self Analysis E-11

96 Table E 5: Property Tax Increment Self Analysis (continued) E-12
Mobility Plans and Fees: The Future of Transportation Funding
 Mobility Plans and Fees: The Future of Transportation Funding Mobility Plans and Fees: The Future of Transportation Funding Growth & Infrastructure Consortium November 4, 2010 Tampa, Florida Bob Wallace,
MOBILITY FEES IN PASCO COUNTY
 MOBILITY FEES IN PASCO COUNTY History Objectives Today Overview of Pasco County Mobility Fees Overcoming Objections to Mobility Fees 2 Motivating Factors 48% of Pasco County workers employed outside of
Chapter 6: Financial Resources
 Chapter 6: Financial Resources Introduction This chapter presents the project cost estimates, revenue assumptions and projected revenues for the Lake~Sumter MPO. The analysis reflects a multi-modal transportation
Chapter 5: Cost and Revenues Assumptions
 Chapter 5: Cost and Revenues Assumptions Chapter 5: Cost and Revenues Assumptions INTRODUCTION This chapter documents the assumptions that were used to develop unit costs and revenue estimates for the
Mobility Plans and Fees in Florida
 Mobility Plans and Fees in Florida Mobility Plans and Fees in Florida GIC Conference November 13, 2014 Bradenton, Florida Bob Wallace, P.E., AICP Tindale-Oliver Alex DavisShaw, P.E., PTOE, City Engineer,
Technical Report No. 4. Revenue and Costs
 Technical Report No. 4 Revenue and Costs Technical Report No. 4 REVENUE AND COSTS PASCO COUNTY METROPOLITAN PLANNING ORGANIZATION 8731 Citizens Drive New Port Richey, FL 34654 Ph (727) 847-8140, fax (727)
University Link LRT Extension
 (November 2007) The Central Puget Sound Regional Transit Authority, commonly known as Sound Transit, is proposing to implement an extension of the Central Link light rail transit (LRT) Initial Segment
TEX Rail Fort Worth, Texas Project Development (Rating Assigned November 2012)
") TEX Rail Fort Worth, Texas Project Development (Rating Assigned November 2012) Summary Description Proposed Project: Commuter Rail 37.6 Miles, 14 Stations (12 new, two existing) Total Capital Cost ($YOE):
TEX Rail Fort Worth, Texas Project Development (Rating Assigned November 2012) Summary Description Proposed Project: Commuter Rail 37.6 Miles, 14 Stations (12 new, two existing) Total Capital Cost ($YOE):
System Development Charge Methodology
 City of Springfield System Development Charge Methodology Stormwater Local Wastewater Transportation Prepared By City of Springfield Public Works Department 225 Fifth Street Springfield, OR 97477 November
sources for FY , only a portion of the statedistributed revenue would be available for new capital projects.
 6 REVENUE PROJECTIONS, SARASOTA/MANATEE 2040 LRTP The purpose of this analysis is to begin to document the financial resources and revenues available for consideration in developing the Financially Feasible
How did we get here?
 MOBILITY FEES How did we get here? ULI Report (2008): The County should conduct long-range concurrency studies for each of the five market areas linked to a defined concurrency fee schedule specific to
Policy CIE The following are the minimum acceptable LOS standards to be utilized in planning for capital improvement needs:
 Vision Statement: Provide high quality public facilities that meet and exceed the minimum level of service standards. Goals, Objectives and Policies: Goal CIE-1. The City shall provide for facilities and
1. identifies the required capacity of capital improvements to serve existing and future development based on level-of-service (LOS) standards;
 standards;") DIVISION 4.200 CAPITAL IMPROVEMENTS ELEMENT SECTION 4.201 INTRODUCTION The purpose of the Capital Improvements Element (CIE) is to tie the capital improvement needs identified in the other elements to
DIVISION 4.200 CAPITAL IMPROVEMENTS ELEMENT SECTION 4.201 INTRODUCTION The purpose of the Capital Improvements Element (CIE) is to tie the capital improvement needs identified in the other elements to
Hillsborough County Population and Employment Projections and Allocations DECEMBER 2017
 Hillsborough County Population and Employment Projections and Allocations DECEMBER 2017 Presentation Overview Overview of the Allocation Process Population and Employment Projections Trend Analysis 2045
INVESTING STRATEGICALLY
 11 INVESTING STRATEGICALLY Federal transportation legislation (Fixing America s Surface Transportation Act FAST Act) requires that the 2040 RTP be based on a financial plan that demonstrates how the program
Transportation Package HB 2017
 Transportation Package HB 2017 Increases in Rates and Revenue Raised Some traditional, and some new and innovative Commonly considered increases: Gas Tax and use fuel increase (Total 10 cents increase)
Attachment B. Project Cost Estimates. Ridge Road Extension Alternatives Analysis
 Attachment B Project Cost Estimates for: Ridge Road Extension Alternatives Analysis PREPARED FOR: Pasco County Engineering Services Department PREPARED BY: NV5, INC. 6989 E. FOWLER AVENUE TAMPA, FLORIDA
Sec Transportation management special use permits Purpose and intent.
 Sec. 11-700 Transportation management special use permits. 11-701 Purpose and intent. There are certain uses of land which, by their location, nature, size and/or density, or by the accessory uses permitted
Economic Growth Initiatives. November 14, 2014
 Economic Growth Initiatives November 14, 2014 Key Concepts Creating Jobs Increased Revenue (type of jobs) Reduced Cost (location) Productive vs. New Revenues A Plan Land Use / Regulations / Finance / Services
Wake County. People love to be connected. In our cyberspace. transit plan CONNECTING PEOPLE, CONNECTING THE COUNTY
 Wake County transit plan CONNECTING PEOPLE, CONNECTING THE COUNTY EXECUTIVE SUMMARY People love to be connected. In our cyberspace driven world, people can stay connected pretty much all of the time. Connecting
Georgetown Planning Department Plan Annual Update: Background
 2030 Plan Annual Update: 2014 Background The 2030 Comprehensive Plan was unanimously adopted by City Council on February 26, 2008. The Plan was an update from Georgetown s 1988 Century Plan. One of the
TABLE OF CONTENTS LIST OF TABLES
 TABLE OF CONTENTS A. GOALS, OBJECTIVES, AND POLICIES... 3 B. SUMMARY... 17 LIST OF TABLES Table IX 1: City of Winter Springs Five-Year Schedule of Capital Improvements (SCI) FY 2013/14-2017/18... 11 Table
CAPITAL IMPROVEMENTS ELEMENT
 [COMPREHENSIVE PLAN] 2025 INTRODUCTION EXHIBIT F CAPITAL IMPROVEMENTS ELEMENT A primary purpose of the Capital Improvements Element (CIE) is to assess and demonstrate the financial feasibility of the Clay
Chapter 4: Available Funds and Financial Scenarios
 Funding the Plan Federal and State requirements say that a Long Range Transportation Plan (LRTP) must include a financial plan. The financial plan must indicate resources from public and private sources
STAFF REPORT Regional Transportation Plan/Sustainable Communities Strategy (RTP/SCS) Scenario Performance Update for Board Direction
 Scenario Performance Update for Board Direction") November 2017 Board of Directors STAFF REPORT SUBJECT: RECOMMENDED ACTION: 2018 Regional Transportation Plan/Sustainable Communities Strategy (RTP/SCS) Scenario Performance Update for Board Direction Support
November 2017 Board of Directors STAFF REPORT SUBJECT: RECOMMENDED ACTION: 2018 Regional Transportation Plan/Sustainable Communities Strategy (RTP/SCS) Scenario Performance Update for Board Direction Support
Draft Environmental Impact Statement. Appendix G Economic Analysis Report
 Draft Environmental Impact Statement Appendix G Economic Analysis Report Appendix G Economic Analysis Report Economic Analyses in Support of Environmental Impact Statement Carolina Crossroads I-20/26/126
MEMORANDUM. For the purpose of this analysis, a No Build Alternative and a Build Alternative were under consideration.
 SRF No. 0158856 MEMORANDUM TO: FROM: Libby Ogard, President, Prime Focus Ryan Loos, PE, Senior Engineer Nick Semeja, EIT, Engineer DATE: May 26, 2015 SUBJECT: NORTHWOODS RAIL TRANSIT COMMISSION GREAT LAKES
HEMSON C o n s u l t i n g L t d
 DEVELOPMENT CHARGES BACKGROUND STUDY Town of Gravenhurst C o n s u l t i n g L t d April, 2014 TABLE OF CONTENTS EXECUTIVE SUMMARY... 1 I INTRODUCTION... 7 II A TOWN-WIDE UNIFORM CHARGE APPROACH TO ALIGN
CAPITAL IMPROVEMENTS ELEMENT
 Goals, Objectives and Policies CAPITAL IMPROVEMENTS ELEMENT GOAL 9.1.: USE SOUND FISCAL POLICIES TO PROVIDE ADEQUATE PUBLIC FACILITIES TO ALL RESIDENTS WITHIN THE CITY. FISCAL POLICIES MUST PROTECT INVESTMENTS
Financial Resources Report BAY COUNTY DIRECTION 2035 SHAPING OUR FUTURE LONG RANGE TRANSPORTATION PLAN. Prepared for
 Financial Resources Report BAY COUNTY DIRECTION 2035 SHAPING OUR FUTURE LONG RANGE TRANSPORTATION PLAN Prepared for Bay County Transportation Planning Organization and The Florida Department of Transportation,
Chapter 3: Regional Transportation Finance
 Chapter 3: Regional Transportation Finance This chapter examines the sources of funding for transportation investments in the coming years. It describes recent legislative actions that have changed the
Technical Report #2: Financial Resources Final Adopted Plan January 2016
 2040 Long Range Transportation Plan Technical Report #2: Financial Resources Final Adopted Plan January 2016 250 South Orange Avenue, Suite 200, Orlando, FL 32801 407-481-5672 www.metroplanorlando.com
TESTIMONY. The Texas Transportation Challenge. Testimony Before the Study Commission on Transportation Financing
 TESTIMONY The Texas Transportation Challenge Testimony Before the Study Commission on Transportation Financing Ric Williamson Chairman Texas Transportation Commission April 19, 2006 Texas Department of
MINNESOTA. Jurisdictional Realignment Project Phase 1 Report
 MINNESOTA Jurisdictional Realignment Project Phase 1 Report January 2013 Table of Contents Executive Summary... 1 Objective... 1 Approach... 1 Prior studies... 2 Phase 1 Assigning the right roads to the
2035 Long Range Transportation Plan
 Hillsborough County City-County Planning Commission 2035 Long Range Transportation Plan Socioeconomic Projections technical memorandum November 2008 601 E. Kennedy, 18th Floor P.O. Box 1110 Tampa, FL 33601-1110
Traffic Impact Analysis Guidelines Methodology
 York County Government Traffic Impact Analysis Guidelines Methodology Implementation Guide for Section 154.037 Traffic Impact Analysis of the York County Code of Ordinances 11/1/2017 TABLE OF CONTENTS
TRANSPORTATION-SPECIFIC SALES TAX REVENUE 23% Visitors Generate Roughly 23 Percent of Taxable Retail Sales
 EXECUTIVE SUMMARY Applied Analysis was retained by the Las Vegas Convention and Visitors Authority ( LVCVA ) to review and analyze the economic impacts associated with its various operations and the overall
Review and Update of Year 2035 Regional Transportation Plan
 Review and Update of Year 2035 Regional Transportation Plan #217752 1 Background Every four years, the Year 2035 Plan is reviewed Elements of review Validity of Plan Year 2035 forecasts Transportation
GLOSSARY. At-Grade Crossing: Intersection of two roadways or a highway and a railroad at the same grade.
 Glossary GLOSSARY Advanced Construction (AC): Authorization of Advanced Construction (AC) is a procedure that allows the State to designate a project as eligible for future federal funds while proceeding
Transportation Funding
 Transportation Funding TABLE OF CONTENTS Introduction... 3 Background... 3 Current Transportation Funding... 4 Funding Sources... 4 Expenditures... 5 Case Studies... 6 Washington, D.C... 6 Chicago... 8
Tampa Bay Express Planning Level Traffic and Revenue (T&R) Study
 Study") Tampa Bay Express Planning Level Traffic and Revenue (T&R) Study Project Report FPN: 437289-1-22-01 Prepared for: FDOT District 7 February 2017 Table of Contents Executive Summary... E-1 E.1 Project Description...
Tampa Bay Express Planning Level Traffic and Revenue (T&R) Study Project Report FPN: 437289-1-22-01 Prepared for: FDOT District 7 February 2017 Table of Contents Executive Summary... E-1 E.1 Project Description...
CHAPTER 4 FINANCIAL STRATEGIES: PAYING OUR WAY
 The financial analysis of the recommended transportation improvements in the 2030 San Diego Regional Transportation Plan: Pathways for the Future (RTP or the Plan ) focuses on four components: Systems
This page intentionally blank. Capital Facilities Chapter Relationship to Vision. Capital Facilities Chapter Concepts
 This page intentionally blank. Capital Facilities Chapter Relationship to Vision Vision County Government. County government that is accountable and accessible; encourages citizen participation; seeks
PLEASANT GROVE, UTAH TRANSPORTATION IMPACT FEE FACILITIES PLAN AND ANALYSIS
 PLEASANT GROVE, UTAH TRANSPORTATION IMPACT FEE FACILITIES PLAN AND OCTOBER 2012 PREPARED BY: LEWIS YOUNG ROBERTSON & BURNINGHAM IMPACT FEE CERTIFICATION Impact Fee Facilities Plan (IFFP) Certification
Subdivision Staging Policy (SSP) By Dan Wilhelm, As of 11/15/2016
 By Dan Wilhelm, As of 11/15/2016") Subdivision Staging Policy (SSP) By Dan Wilhelm, As of 11/15/2016 The SSP is intended to be the primary tool the County uses to pace new development with the provision of adequate public facilities. The
Subdivision Staging Policy (SSP) By Dan Wilhelm, As of 11/15/2016 The SSP is intended to be the primary tool the County uses to pace new development with the provision of adequate public facilities. The
CHAPTER 5 INVESTMENT PLAN
 CHAPTER 5 INVESTMENT PLAN This chapter of the 2014 RTP/SCS plan illustrates the transportation investments for the Stanislaus region. Funding for transportation improvements is limited and has generally
INVESTMENT STRATEGIES
 3 INVESTMENT STRATEGIES 70 INVESTMENT STRATEGIES 71 A key role of Mobilizing Tomorrow is to outline a strategy for how the region will invest in transportation infrastructure over the next 35 years. This
WASATCH FRONT REGIONAL TRANSPORTATION PLAN FINANCIAL PLAN. Technical Report 47 May 2007 DAVIS MORGAN SALT LAKE TOOELE WEBER
 WASATCH FRONT REGIONAL TRANSPORTATION PLAN 2007-2030 FINANCIAL PLAN Technical Report 47 May 2007 DAVIS MORGAN SALT LAKE TOOELE WEBER 2030 RTP Financial Plan WASATCH FRONT REGIONAL TRANSPORTATION PLAN
YEAR 2035 LONG RANGE TRANSPORTATION PLAN FINAL TECHNICAL REPORT NO. 2: DATA COLLECTION, MAPPING AND DATA DEVELOPMENT
 YEAR 2035 LONG RANGE TRANSPORTATION PLAN FINAL TECHNICAL REPORT NO. 2: DATA COLLECTION, MAPPING AND DATA DEVELOPMENT Prepared for: METROPOLITAN TRANSPORTATION PLANNING ORGANIZATION FOR THE GAINESVILLE
MPO Staff Report MPO EXECUTIVE BOARD: August 16, 2017
 MPO Staff Report MPO EXECUTIVE BOARD: August 16, 2017 RECOMMENDED ACTION: August 30 th Open House Matter of Kick-off for 2045 Street/Highway Element Background: The UPWP identifies that the major undertaking
Strengthening Vermont s Economy by Integrating Transportation and Smart Growth Policy
 Strengthening Vermont s Economy by Integrating Transportation and Smart Growth Policy Technical Memorandum #4: Short List of Recommended Alternatives May 21, 2013 Tech Memo #4: Short List of Recommended
2012 TIGER Grant Application Benefit Cost Analysis Technical Memo March 19, 2012
 Improved US 70 with Railroad Grade Separation (Highway Overpass) Valliant, Oklahoma 2012 TIGER Grant Application Benefit Cost Analysis Technical Memo March 19, 2012 Project Summary The Improved US 70 with
Understanding H.B. 170: The Transportation Funding Act of 2015
 Understanding H.B. 170: The Transportation Funding Act of Recent History in Transportation Funding 2007 Joint Study Committee on Transportation Funding 2009 S.B. 200: Transportation Governance 2010 H.B.
NORTHERN VIRGINIA TRANSPORTATION AUTHORITY MEMORANDUM
 XVI NORTHERN VIRGINIA TRANSPORTATION AUTHORITY MEMORANDUM FOR: FROM: Chairman Martin E. Nohe and Members Northern Virginia Transportation Authority Monica Backmon, Executive Director DATE: December 8,
FY 2011 Continuing Appropriations Act. TIGER Discretionary Grant Program
 FY 2011 Continuing Appropriations Act TIGER Discretionary Grant Program Highway 167 Improvement Project Appendices A Benefit Cost Analysis B Federal Wage Rate Certifications Submitted by Arkansas State
DEVELOPMENT CHARGES BACKGROUND STUDY
 DEVELOPMENT CHARGES BACKGROUND STUDY Town of Innisfil C o n s u l t i n g L t d. July 19, 2018 TABLE OF CONTENTS EXECUTIVE SUMMARY... 1 I PURPOSE OF THE DEVELOPMENT CHARGES BACKGROUND STUDY... 6 A. INTRODUCTION
Economic Impacts of Road Project Timing Shifts in Sarasota County
 Economic Impacts of Road Project Timing Shifts in Sarasota County Prepared for: Prepared by: Economic Analysis Program Featuring REMI Policy Insight and IMPLAN October 22 Introduction Improving traffic
CHAPTER 2 BACKGROUND. Update of Previous Planning Work. Plan Development Process. Public Involvement and Review Process
 CHAPTER 2 BACKGROUND What Is the 2030 TSP? Update of Previous Planning Work Plan Development Process Public Involvement and Review Process Hennepin County Transportation Systems Plan (HC-TSP) Chapter 2
VOLUSIA COUNTY COUNCIL IMPACT FEE DISCUSSION
 VOLUSIA COUNTY COUNCIL IMPACT FEE DISCUSSION J U N E 5, 2 0 1 8 05-2 CRITICAL POINTS May 1, 2018, the County Council directed staff to bring forward a discussion on the county thoroughfare road impact
GRASS VALLEY TRANSPORTATION IMPACT FEE PROGRAM NEXUS STUDY
 HEARING REPORT GRASS VALLEY TRANSPORTATION IMPACT FEE PROGRAM NEXUS STUDY Prepared for: City of Grass Valley Prepared by: Economic & Planning Systems, Inc. March 2008 EPS #17525 S A C R A M E N T O 2150
Honolulu High-Capacity Transit Corridor Project Alternatives Analysis
 Alternatives Analysis Financial Feasibility Report November 30, 2006 Prepared for: City and County of Honolulu Prepared by: PB Consult Inc. Under Subcontract to: Parsons Brinckerhoff Quade & Douglas, Inc.
Economic Impact of Public Transportation Investment 2014 UPDATE
 Economic Impact of Public Transportation Investment 2014 UPDATE May 2014 Acknowledgements This study was conducted for the American Public Transportation Association (APTA) by Economic Development Research
Mobility Fee Legislation
 Mobility Fee Legislation The Joint Report contains three recommended legislative options for mobility fees: 1. Require mobility fees statewide by a date certain 2. Require mobility fees in DULA counties
TABLE OF CONTENTS. Project Analysis... A-1 Project Summary Background Issues Conclusion. Findings... F-1 CEQA Findings Charter Findings
 CPC-2008-3470-SP-GPA-ZC-SUD-BL-M3 TABLE OF CONTENTS Project Analysis... A-1 Project Summary Background Issues Conclusion Findings... F-1 CEQA Findings Charter Findings Public Hearing and Communications...
Analysis of the Alameda County Transportation Expenditure Plan Prepared by Alameda County Transportation Commission
 Analysis of the Alameda County Transportation Expenditure Plan Prepared by Alameda County Transportation Commission Discussion: In 1986, voters approved Measure B, a 1/2 cent sales tax, to fund transportation
CHAPTER 9 FINANCIAL CONSIDERATIONS
 CHAPTER 9 FINANCIAL CONSIDERATIONS 9.1 INTRODUCTION This chapter presents anticipated costs, revenues, and funding for the Berryessa Extension Project (BEP) Alternative and the Silicon Valley Rapid Transit
CHAPTER 11: Economic Development and Sustainability
 AGLE AREA COMMUNITY Plan CHAPTER 11 CHAPTER 11: Economic Development and Sustainability Economic Development and Sustainability The overall economy of the Town and the Town government s finances are inextricably
2040 Long Range Transportation Plan - Needs Assessment: System Preservation Pavement, Bridges, and Transit Costs and Benefits
 2040 Long Range Transportation Plan - Needs Assessment: System Preservation Pavement, Bridges, and Transit Costs and Benefits Prepared For: 601 East Kennedy Boulevard Tampa, FL 33602 Prepared by: Jacobs
8. FINANCIAL ANALYSIS
 8. FINANCIAL ANALYSIS This chapter presents the financial analysis conducted for the Locally Preferred Alternative (LPA) selected by the Metropolitan Transit Authority of Harris County (METRO) for the.
Minimum Elements of a Local Comprehensive Plan
 Minimum Elements of a Local Comprehensive Plan Background OKI is an association of local governments, business organizations and community groups serving more than 180 cities, villages, and townships in
Capital Improvements
 Capital Improvements CAPITAL IMPROVEMENT ELEMENT GOAL 7-1: PROVIDE & MAINTAIN PUBLIC FACILITIES AND SERVICES Provide and maintain public facilities and services which protect and promote the public health,
Transportation Funding in the Charlotte Region
 Transportation Funding in the Charlotte Region Andy Grzymski, Charlotte DOT August 21, 2007 Charlotte Region HOV/HOT/ Managed Lanes Study Workshop Background The Charlotte Region One of the South s s
CHAPTER 3: GROWTH OF THE REGION
 CHAPTER OVERVIEW Introduction Introduction... 1 Population, household, and employment growth are invariably Residential... 2 expected continue grow in both the incorporated cities Non-Residential (Employment)
TAX INCREMENTAL PROJECT PLAN
 TAX INCREMENTAL PROJECT PLAN TAX INCREMENT DISTRICT #77 RUSHMORE GATEWAY CORRIDOR CITY OF RAPID CITY Prepared by the Rapid City Community Planning and Development Services Department April 2016 INTRODUCTION
DEVELOPMENT CHARGES BACKGROUND STUDY. City of Woodstock. HEMSON C o n s u l t i n g L t d
 DEVELOPMENT CHARGES BACKGROUND STUDY City of Woodstock C o n s u l t i n g L t d April 6, 2018 TABLE OF CONTENTS Executive Summary... 1 I Introduction... 10 II A CityWide Methodology Aligns DevelopmentRelated
A New Tool for Tracking Home and Rental Values in TODs
 A New Tool for Tracking Home and Rental Values in TODs John L. Renne, Ph.D., AICP Florida Atlantic University & University of Oxford Founder: TOD Group TOD Group Consulting TOD Index Denver TOD Fund Why
APPENDIX B TECHNICAL MEMORANDUM #2 TRANSPORTATION FUNDING
 APPENDIX B TECHNICAL MEMORANDUM #2 TRANSPORTATION FUNDING CONTENTS Purpose... B1 Summary of Transportation Funding Sources... B1 Figure B-1: Average Annual Transportation Revenue Breakdown by Source (2011-2015)...B1
Commercial Tax Objectives and Options. January 2018 Bruce Fisher and Andre MacNeil (Finance)
") Commercial Tax Objectives and Options January 2018 Bruce Fisher and Andre MacNeil (Finance) Outline Introduction What is and is not allowed under property tax law Four critical success factors: Hypothetical
Commercial Tax Objectives and Options January 2018 Bruce Fisher and Andre MacNeil (Finance) Outline Introduction What is and is not allowed under property tax law Four critical success factors: Hypothetical
Loudoun 2040 Fiscal Impact Analysis Report Loudoun County, Virginia
 Loudoun 2040 Fiscal Impact Analysis Report Loudoun County, Virginia Submitted to: Loudoun County, Virginia July 6, 2018 4701 Sangamore Road Suite S240 Bethesda, Maryland 20816 800.424.4318 www.tischlerbise.com
15,790. Bryan Waco Region. Do you own or lease a personal vehicle? What is your primary means of transportation?
 Bryan Waco Region 1 Houston 2 Dallas 3 Fort Worth 4 San Antonio 5 Austin 6 Laredo Pharr 7 Corpus Christi Yoakum 8 Bryan Waco 9 Atlanta Beaumont Lufkin Paris Tyler 10 Amarillo Childress Lubbock Wichita
17,321 13,351. Overall Statewide Results. How was the survey taken? Do you own or lease a personal vehicle?
 10 Overall Statewide Results 3 2 How was the survey taken? 1 Houston 2 Dallas 3 Fort Worth 4 San Antonio 5 Austin 6 Laredo / Pharr 7 Corpus Christi / Yoakum 12 11 5 4 7 8 1 9 Internet Mail Phone 35% 61%
LEGEND Bridges Parks Fire Stations Project Locations Libraries Schools A
 LEGEND Bridges Parks Fire Stations Project Locations Libraries Schools A Aid to Construction Fund The Aid to Construction Fund (Water) are funds received from customers for requested water service and
City Services Appendix
 Technical vices 1.0 Introduction... 1 1.1 The Capital Facilities Plan... 1 1.2 Utilities Plan... 2 1.3 Key Principles Guiding Bremerton s Capital Investments... 3 1.4 Capital Facilities and Utilities Addressed
Washington Metropolitan Area Transit Authority Metro Budget Overview
 Washington Metropolitan Area Transit Authority Metro Budget Overview February 2011 Metro 10,877 Employees (10,974 budgeted) 1,491 Buses 588 Escalators and 237 Elevators 106 Miles of Track 92 Traction Power
Transportation Finance Overview. Presentation Contents
 Transportation Finance Overview Matt Burress House Research Department matt.burress@house.mn Andy Lee House Fiscal Analysis andrew.lee@house.mn January 5 th & 10 th, 2017 Presentation Contents 2 Part 1:
Introduction and Participation Horizon 2030 Comprehensive Plan (Prepared 2010)
") HORIZON 2030 : UTILIZING THE VISION TO UPDATE THE COMPREHENSIVE PLAN Plan Purpose: Achieving a New Community Planning Vision for the City of West Melbourne The City of West Melbourne Horizon 2030 Comprehensive
HORIZON 2030 : UTILIZING THE VISION TO UPDATE THE COMPREHENSIVE PLAN Plan Purpose: Achieving a New Community Planning Vision for the City of West Melbourne The City of West Melbourne Horizon 2030 Comprehensive
FY 2011 Continuing Appropriations Act. TIGER Discretionary Grant Program
 FY 2011 Continuing Appropriations Act TIGER Discretionary Grant Program Highway 92 Bridge Improvement Project Appendices A Benefit Cost Analysis B Federal Wage Rate Certification Submitted by Arkansas
TRANSIT ORIENTED DEVELOPMENT IN THE PORTLAND METRO REGION
 TRANSIT ORIENTED DEVELOPMENT IN THE PORTLAND METRO REGION Presented by: Megan Gibb What is Metro Directly elected regional government Serves more than 1.4 million residents in Clackamas, Multnomah and
FY 2011 Continuing Appropriations Act. TIGER Discretionary Grant Program
 FY 2011 Continuing Appropriations Act TIGER Discretionary Grant Program Highway 150 Resurfacing Project Appendices A Benefit Cost Analysis B Federal Wage Rate Certifications Submitted by Arkansas State
REPORT TO THE CAPITAL REGIONAL DISTRICT BOARD MEETING OF WEDNESDAY, SEPTEMBER 8, 2010
 REPORT TO THE CAPITAL REGIONAL DISTRICT BOARD MEETING OF WEDNESDAY, SEPTEMBER 8, 2010 SUBJECT City of Victoria Request for General Strategic Priorities Funding Application Support Johnson Street Bridge
CHAPTER 4 1 Transportation Financial Analysis
 CHAPTER 4 1 Transportation Financial Analysis COMPASS commissioned a financial analysis, finalized in 2012, to support the CIM 2040 update. The analysis, Financial Forecast for the Funding of Transportation
CAPITAL IMPROVEMENTS ELEMENT GOALS, OBJECTIVES AND POLICIES. Goal 1: [CI] (EFF. 7/16/90)
![CAPITAL IMPROVEMENTS ELEMENT GOALS, OBJECTIVES AND POLICIES. Goal 1: [CI] (EFF. 7/16/90)](/thumbs/93/114312533.jpg "CAPITAL IMPROVEMENTS ELEMENT GOALS, OBJECTIVES AND POLICIES. Goal 1: [CI] (EFF. 7/16/90)") CAPITAL IMPROVEMENTS ELEMENT GOALS, OBJECTIVES AND POLICIES Goal 1: [CI] (EFF. 7/16/90) To use sound fiscal policies to provide adequate public facilities concurrent with, or prior to development in order
CAPITAL IMPROVEMENTS ELEMENT GOALS, OBJECTIVES AND POLICIES Goal 1: [CI] (EFF. 7/16/90) To use sound fiscal policies to provide adequate public facilities concurrent with, or prior to development in order
2017 UNIFIED TRANSPORTATION PROGRAM AND HB 20 IMPLEMENTATION
 2017 UNIFIED TRANSPORTATION PROGRAM AND HB 20 IMPLEMENTATION TEMPO Meeting July 21, 2016 Current Initiatives On-going efforts to address performance-based planning and programming processes as required
DRAFT 04/08/ Plan Post Referendum Analysis. Technical Memorandum Two: FUNDING ALTERNATIVE STRATEGIES. Prepared For: Prepared By:
 DRAFT 04/08/2011 2035 Plan Post Referendum Analysis Prepared For: 601 East Kennedy Boulevard Tampa, FL 33602 Prepared By: Table of Contents Introduction 1.0 Federal Funding Sources... i 1.1 Federal Transit
APPENDIX - TRANSPORTATION IMPACT TAX. Basis and General Purpose for the Tax
 APPENDIX - TRANSPORTATION IMPACT TAX Basis and General Purpose for the Tax The authority to impose a Transportation Impact Tax on new development is in Chapter 52 (Article VII Development Impact Tax for
Transportation Funding and Improving Roadway Services Delivery
 Transportation Funding and Improving Roadway Services Delivery Transportation Advisory Commission October 5, 2010 1 STUDY PROGRESS Finalize project scope, perform initial data collection, and gather input
Measure I Strategic Plan, April 1, 2009 Glossary Administrative Committee Advance Expenditure Agreement (AEA) Advance Expenditure Process
 Advance Expenditure Process") Glossary Administrative Committee This committee makes recommendations to the Board of Directors and provides general policy oversight that spans the multiple program responsibilities of the organization
Glossary Administrative Committee This committee makes recommendations to the Board of Directors and provides general policy oversight that spans the multiple program responsibilities of the organization
THE TRANSPORTATION COSTS OF NEW DEVELOPMENT
 THE TRANSPORTATION COSTS OF NEW DEVELOPMENT A New NCHRP Model to Calculate Local Costs/Revenues of New Development Robert W. Burchell, Ph.D. Rutgers University Arthur C. Nelson, Ph.D. University of Utah
Interested Parties William E. Hamilton Transportation Needs and Revenue Distribution
 MEMORANDUM DATE: December 3, 2010 TO: FROM: RE: Interested Parties William E. Hamilton Transportation Needs and Revenue Distribution Introduction Michigan residents rely on a safe efficient transportation
2017 TRANSIT DEVELOPMENT PLAN PROGRESS REPORT
 LAKE COUNTY TRANSIT DIVISION P.O. Box 7800, Tavares, Florida 32778 2440 U.S. Highway 441/27, Fruitland Park, Florida 34731 Telephone: 352.323.5733; Facsimile: 352.323.5755 www.ridelakexpress.com 2017 TRANSIT