Owens Corning Positioned for Growth
|
|
|
- Lynn Hood
- 5 years ago
- Views:
Transcription
1 Owens Corning Positioned for Growth Q This presentation shared at the following events: 3/17/15 Owens Corning Roadshow New York Thierry Denis, Vice President Investor Relations 3/12/15 OC Roadshow Hosted by Longbow Boston Brian Chambers, President Roofing & Asphalt Business 2/26/15 Barclay s Symposium New York Michael McMurray, Chief Financial Officer 2/24/15 OC Roadshow Hosted by SunTrust Dallas & Houston Michael McMurray, Chief Financial Officer 2/18/15 OC Roadshow Hosted by JP Morgan Paris, Frankfurt & Zurich Arnaud Genis, President Composites Business
2 Forward-Looking Statements and Non-GAAP Measures This presentation consists of this slide deck and the associated remarks and comments, all of which are integrally related and are intended to be presented and understood together. This presentation contains forward-looking statements within the meaning of the Private Securities Litigation Reform Act of These forward-looking statements can be identified by words such as anticipate, appear, assume, believe, estimate, expect, forecast, intend, may, plan, should, seek, will, and other terms of similar meaning or import in connection with any discussion of future operating, financial or other performance that reference future periods. We caution you against relying on these statements as they involve risks and uncertainties that are difficult to predict and the Company s actual results may differ materially from those projected in these statements. Our future performance may be affected by risks and uncertainties including, without limitation, levels of residential and commercial construction activity; competitive and pricing factors; levels of global industrial production; demand for our products; relationships with key customers; industry and economic conditions that affect the market and operating conditions of our customers, suppliers or lenders; our level of indebtedness; weather conditions; availability and cost of credit; availability and cost of energy and raw materials; issues involving implementation and protection of information technology systems; international economic and political conditions, including new legislation or other governmental actions; our ability to utilize our net operating loss carry-forwards; research and development activities and intellectual property protection; foreign exchange and commodity price fluctuations; interest rate movements; labor disputes and litigation; uninsured losses; issues related to acquisitions, divestitures and joint ventures; achievement of expected synergies, cost reductions and/or productivity improvements; defined benefit plan funding obligations; and, factors detailed from time to time in the Company s U.S. Securities and Exchange Commission ( SEC ) filings. For purposes of this presentation, any discussion referring to year to date or last twelve months ( LTM ) refers to the period ended on the last calendar day of the quarter preceding the date of the investor event referred to on the first page of this document. Otherwise the information in this presentation speaks as of the date of the investor event, and is subject to change. The Company does not undertake any obligation to update or revise any forward-looking statements, whether as a result of new information, future events or otherwise except as required by federal securities laws. Any distribution of this presentation after the date of the investor event is not intended and should not be construed as updating or confirming such information. This presentation contains references to certain "non-gaap financial measures" as defined by the SEC. Management uses non-gaap measures for various purposes, including reporting results of operations to the Board of Directors, analysis of performance and related employee compensation measures. Although management believes these measures, and exclusions from GAAP therein, provide a useful representation of performance, non-gaap measures should not be considered in isolation or as a substitute for GAAP measures. A reconciliation of these non-gaap financial measures to their most directly comparable financial measures calculated and presented in accordance with generally accepted accounting principles can be found in Appendix A. Adjusted EBIT is earnings before interest, taxes and other items that management does not allocate to our segment results because it believes they are not a result of the Company s current operations. 2


3 Owens Corning at a Glance Founded in 1938, an industry leader in glass fiber insulation, roofing and glass fiber reinforcements 2014 net sales: $5.3 billion 14,000 employees in 25 countries Fortune 500 company for 60 consecutive years Component of Dow Jones Sustainability World Index for five consecutive years 3
4 Investment Highlights Composites Roofing Market-leading business with improving economic conditions and higher utilization rates Strong market position in consolidated industry Insulation Progress supports confidence in return to historical profitability Three Market-Leading Businesses 4
5 Full-Year 2014 Highlights and Outlook Maintained a very high level of safety performance in 2014 Board declared 6% dividend increase Delivered adjusted EBIT of $412 million Insulation delivered 14 th consecutive quarter of EBIT growth; increased full-year EBIT by $68 million Composites delivered 6 th consecutive quarter of EBIT improvement; grew 2014 earnings by 50% Roofing achieved commercial objectives for the second half Anticipate continued growth in U.S. housing starts and global industrial production in
6 Strong Portfolio Positioned for Growth Insulation Roofing Composites Margin >= 10% 0%<= Margin < 10% Margin < 0% Sources: Owens Corning s SEC filings since For comparability purposes, prior years have been provided based on Owens Corning s SEC filings, internal management reports, and management estimates. 6
7 Insulation Business Q4 & Full-Year 2014 Highlights Delivered full-year EBIT of $108 million, a $68 million increase versus last year Achieved operating leverage of over 50% in 2014 Expect 2015 results to benefit from growth in U.S. new construction, pricing, and operating leverage $ (in millions) Q Q Net sales* $490 $466 $1,746 $1,642 EBIT $46 $39 $108 $40 EBIT as % of sales 9% 8% 6% 2% D&A $25 $25 $101 $104 * before inter-segment eliminations 2014 Revenue by End Market* U.S. & Canada Commercial & Industrial 24% $2,000 $1,500 Five-Year Financial Performance 10% 5% U.S.& Canada Residential Repair & Remodeling 20% U.S. & Canada New Residential Construction 40% $1,000 $500 0% -5% International 16% *Owens Corning management estimates; estimated error margin below 5% $ Sales* EBIT as % of sales *In millions -10% Source: Owens Corning management estimates and Owens Corning SEC filings; comparability may differ over time 7
8 Owens Corning Insulation EBIT Progress $40 Q1 Q2 Q3 Q of Dollars $20 $ EBIT in Millions -$20 -$40 -$ $ Actual 2012 Actual 2013 Actual 2014 Actual Consistent Quarterly EBIT Progression Since 2011 Source: Owens Corning quarterly and annual SEC filings 8
9 Owens Corning Insulation Well Positioned to Return to Historical Margins 30% EBIT Margin Avg EBIT Margin '85-'08 (15%) 20% 10% 0% -10% '84 '86 '88 '90 '92 '94 '96 '98 '00 '02 '04 '06 '08 '10 '12 '14 Historically Delivered 15% EBIT Margins at 1.5 Million Housing Starts Source: Owens Corning management estimates and Owens Corning SEC filings, comparability may differ over time; 9
10 Insulation Industry North American Fiberglass 100% 80% 2015 Industry Capacity Utilization 90% 80% 70% 60% 40% 20% 0% Total Capacity Operating Plants Operating Lines Capacity Utilization Tightening as U.S. Housing Recovers Source: Owens Corning management estimates as of February 2015 rounded to nearest 5%. Products sold primarily to North American residential market. Excludes heavy density and loosefill products. Based on 2015 estimate of 1.1MM unlagged U.S. housing starts and other macro assumptions. 10


11 Owens Corning Insulation North American Fiberglass Network Edmonton Candiac Toronto Delmar Santa Clara Nephi Kansas City Mt. Vernon Newark Eloy 2015 Estimated Average Utilization: Near full capacity Below full capacity Not in operation Waxahachie Fairburn Lakeland Continued Discipline in OC Capacity Management Capacity utilization based as on estimated average 2015 total insulation production using melter capacity Source: Owens Corning management estimates 11
12 Positioned to Grow with Our Markets Insulation End-Use Markets % of Full-Year 2014 Revenue U.S. and Canada Residential New Construction 40% Expected Market Growth Drivers Housing starts Building energy code adoption Household formation Mid-Term Growth U.S. and Canada Repair and Remodel 20% U.S. and Canada Commercial and Industrial 24% Aging housing stock Energy efficiency policies Code and green specification driven Owner/operator focus Latin America and Asia Pacific 16% Growing middle class Infrastructure improvements Urbanization of China Targeting Double-Digit Revenue Growth as Market Recovers Source: Owens Corning management estimates. 12
13 Roofing Business Q4 & Full-Year 2014 Highlights Full-year margins declined 7% on lower volumes and prices Achieved commercial objectives for the second half Market dynamics in the first half of 2015 will largely determine how the Roofing business performs versus last year $ (in millions) Q Q Net sales* $340 $381 $1,748 $1,967 EBIT $32 $55 $232 $386 EBIT as % of sales 9% 14% 13% 20% D&A $9 $10 $39 $38 * before inter-segment eliminations 2014 Revenue by End Market* $2,400 Five-Year Financial Performance 30% U.S. & Canada Residential Repair & Remodeling 73% U.S. & Canada Commercial & Industrial 16% U.S. & Canada New Residential Construction 10% International 1% *Owens Corning management estimates; estimated error margin below 5% $2,000 $1,600 $1,200 $800 $400 $ Sales* EBIT as % of sales *In millions 25% 20% 15% 10% 5% 0% Source: Owens Corning management estimates and Owens Corning SEC filings; comparability may differ over time 13
14 U.S. Asphalt Shingle Industry Consolidation 70s 80s 90s Current OC FRY GAF ELK CERTAINTEED TAMKO CELOTEX MANVILLE IKO BIRD ATLAS GEORGIA PACIFIC FLINTKOTE GLOBE PABCO MALARKEY LUNDAY THAGARD CUSTOM ROOFING BIG CHIEF BEAR PHILIP CAREY OC GAF ELK CERTAINTEED TAMKO CELOTEX MANVILLE IKO BIRD ATLAS GEORGIA PACIFIC GENSTAR GLOBE PABCO MALARKEY LUNDAY THAGARD CUSTOM ROOFING OC GAF ELK CERTAINTEED TAMKO CELOTEX IKO ATLAS GEORGIA PACIFIC GS ROOFING GLOBE PABCO MALARKEY OC GAF/ELK CERTAINTEED TAMKO IKO ATLAS PABCO MALARKEY Top 90% Total Favorable Industry Structure for the Future Source: Owens Corning management estimates and various industry sources and publications 14
15 U.S. Asphalt Shingle Market MM Sq. Major Storms MM Re-roof Demand New construction Total Existing Home Sales '99 '00 '01 '02 '03 '04 '05 '06 '07 '08 '09 '10 '11 '12 '13 ' Total Source: Asphalt Roofing Manufacturers Association, Summary of Asphalt Roofing Industry Shipments. National Association of Realtors existing home sales and Owens Corning management estimates 15
16 Strong Market Position in Consolidated Industry Track record of strong financial performance Delivered average operating margins in excess of 20% during period Re-roof demand over the last few years has been sluggish Housing activity forecasts support some demand growth Glass fiber mat and laminate advancements in the 1980s and 1990s could be extending replacement cycle Soft demand and competitive activity put pressure on margins in 2014 Strong market position; outlook for 2015 largely determined by competitive pricing dynamics, asphalt cost deflation, and market demand 16
17 Composites Business Q4 & Full-Year 2014 Highlights Achieved $149 million of EBIT in 2014; grew earnings by 50% versus last year Delivered $32 million of price benefit in 2014, with six consecutive quarters of improvement In 2015, expect price to drive majority of EBIT improvement $ (in millions) Q Q Net sales* $464 $461 $1,935 $1,845 EBIT $53 $36 $149 $98 EBIT as % of sales 11% 8% 8% 5% D&A $30 $31 $129 $130 * before inter-segment eliminations U.S. & Canada Commercial & Industrial 28% 2014 Revenue by End Market* U.S. & Canada New Residential Construction 3% $2,400 $1,800 Five-Year Financial Performance 15% 10% U.S. & Canada Residential Repair & Remodeling 8% International 61% *Owens Corning management estimates; estimated error margin below 5% $1,200 $600 $ Sales* EBIT as % of sales *In millions 5% 0% -5% Source: Owens Corning management estimates and Owens Corning SEC filings; comparability may differ over time 17
18 Glass Fiber A $7.5 Billion Global Market Appliances Electronics Recreation Wind 9% Residential Commercial Water transportation & storage Consumer 16% Construction 34% Factories Mining Offshore platforms Industrial 13% Transportation 28% Cars Trucks, buses, trains Marine A Key Material Enabling Solutions Essential to Everyday Life Glass reinforcements market defined as glass fiber reinforcements and direct conversion products as consumed, excluding yarns Source: Owens Corning management estimates as of Feb

19 Owens Corning Composites Global megatrends, continued growth in industrial production, and material substitution support glass fiber market growth at a 5-7% CAGR Strategic focus on core building material markets with sustainable solutions Cost Leadership Price Realization Product Leadership Capital Efficiency Clear agenda to deliver improved returns Leader in an Industry Entering a Phase of Supply Tension Source: Owens Corning management estimates as of February
20 Owens Corning Composites Positioned to Win #1 Position Emerging Position 25% Europe 30% 26% China 10% % Market Revenue % OC Revenue % Market Revenue % OC Revenue #1 Position Americas 34% 46% OC glass fiber manufacturing site OC downstream fabrication site #1 Position Rest of World 15% 14% % Market Revenue % OC Revenue % Market Revenue % OC Revenue Leading Market Positions and an Unrivaled Supply Network Sources: Owens Corning management estimates % Market Revenue = market revenue in region as % of 2014 global market size % OC Revenue = OC revenue in region as % of OC Composites global 2014 sales Glass reinforcements market defined as glass fiber reinforcements and direct conversion products as consumed, excluding yarns 20
21 Glass Fiber Market Demand 5,000 4,000 Glass Fiber Demand Has Grown at 1.6 Multiple of Industrial Production Growth Glass Fibe er K Tons 3,000 2,000 1, Historical Glass Fiber Market Growth Averaging 5% Glass fiber market demand excludes E-glass yarns Sources: Fiber Economics Bureau, Glass Fiber Europe, Global Trade Information Services, Inc. and Owens Corning management estimates 21
22 Glass Fiber Industry Estimated Capacity China Emergence Capacity Overbuild Macro Adjustment Excess Inventory Supply Tension Improved Returns 100% Estimated Capacity Utilization 90% 80% 70% 60% % Threshold (high probability additions) Change in global demand (MM T) Change in global capacity (MM T) 50% 0.1/ yr 0.3/ yr 0.4/ yr 0.1/ yr 0.2/ yr 0.1/ yr Tighter Capacity Environment Expected in the Near Term Glass fiber market demand excludes E-glass yarns Sources: Fiber Economics Bureau, Glass Fiber Europe, Global Trade Information Services, Inc. and Owens Corning management estimates as of February
23 Owens Corning Composites Focused on Creating Shareholder Value Significant actions, including capital and cash restructuring, to achieve goal of 75% low-delivered cost Extensive restructuring of high-cost assets in Europe, Japan and Canada Successful sale and closure of a high-cost facility in China Constructed several new low-cost production lines, while essentially maintaining flat overall capacity Entered into creative alliances with China-based manufacturers Suspended melting capacity investments since 2012 Delivered six consecutive quarters of price improvement Business Actions Have Contributed to ROC Improvement 23
24 Sustaining a Strong Balance Sheet Maintaining investment-grade financial strength is a pillar of Owens Corning s strategy Maintained investment-grade credit ratings from Standard & Poor's and Fitch $800 million revolving credit facility maturing in 2018 $250 million accounts receivable securitization facility maturing in 2018 $1.8 billion senior notes outstanding with 2016, 2019, 2022, 2024 and 2036 maturities Ample liquidity to support growth Capital markets remain open to Owens Corning 24
25 Tax Position is a Significant Asset Benefit from $2.2 billion NOL with estimated present value of approximately $5 per share Delivering cash tax savings of about $60 million per year Expect long-term book tax rate of 30% to 32% based on geographic mix of earnings and tax planning Cash tax rate of 10% to 12% over the next few years Source: Owens Corning management estimates 25
26 Disciplined Capital Allocation Strategy Drive shareholder returns by enabling organic and inorganic growth and supporting the balance sheet Maintain investment grade Capital allocation strategy Investing in attractive organic growth Returning excess cash to shareholders Pursuing value-creating acquisitions Quarterly dividend initiated in 2014 conveys confidence in long-term financial outlook and cash flow generation; 6% dividend increase announced in 2015 As of December 31, 2014, 7.7 million shares remain available for repurchase under existing authorization 26
27 Key Financial Data ($ in millions, except per share data) Q Q Net sales $5,276 $5,295 $1,261 $1,278 Net earnings attributable to Owens Corning $226 $204 $33 $82 Diluted earnings per share attributable to Owens Corning common stockholders $1.91 $1.71 $0.28 $0.69 Earnings before interest and taxes (EBIT) $392 $385 $104 $104 Adjusted EBIT $412 $416 $107 $96 Adjusted Earnings $208 $221 $55 $52 Adjusted EPS (diluted) $1.76 $1.86 $0.47 $0.44 Adjusted EBIT as a % of sales 8% 8% 8% 8% Marketing and administrative expenses $487 $530 $115 $135 Depreciation and amortization $304 $332 $75 $97 Cash flow from operating activities $441 $407 $379 $249 Total debt (excluding rate swap), net of cash $1,950 $1,955 $1,950 $1,955 27

28 2015 Corporate Environment & Guidance Macro Environment Continued growth in U.S. housing starts; generally forecasted in 1,100,000-1,200,000 range Moderate global industrial production growth Primary Guidance Insulation: should continue to benefit from growth in U.S. residential new construction, improved pricing and operating leverage Composites: expect majority of EBIT improvement to come from price Roofing: market dynamics in the first half of the year will largely determine how the business performs relative to 2014 Other Guidance Items Corporate expenses of $120-$130MM Interest expenses about $110MM Capital expenditures about $355MM, including about $55 million for the completion of construction of a non-woven facility Depreciation & amortization about $310MM Cash tax rate of 10-12% and book tax rate of 30-32%* on adjusted pre-tax earnings * Excluding significant tax reserve reversals Source: Owens Corning management estimates as of February

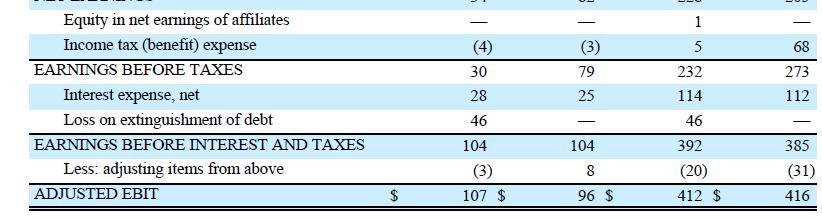
29 Appendix A Non-GAAP Reconciliations 29

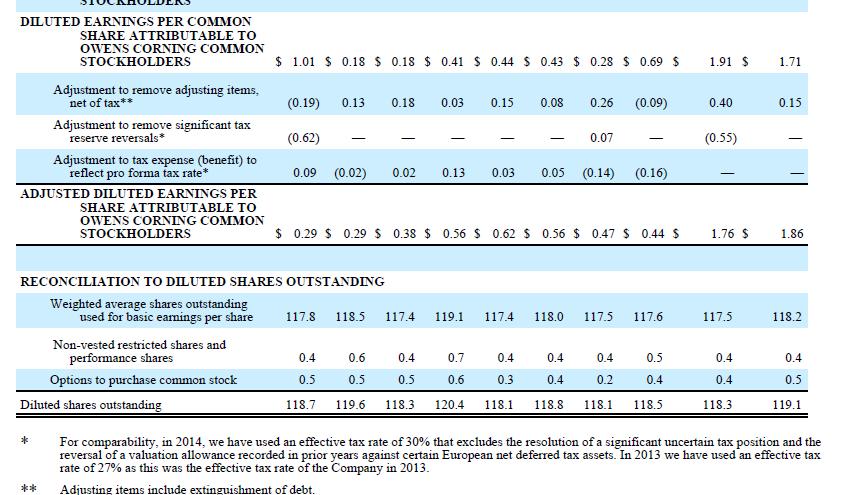
30 Appendix A Non-GAAP Reconciliations 30
Owens Corning Positioned for Growth
 Owens Corning Positioned for Growth Q3 2014 This presentation shared at the following event: 09/22/2014 Owens Corning Roadshow Milwaukee/Chicago Thierry Denis, Director IR 09/19/2014 Zelman Housing Summit
Owens Corning Focused on Shareholder Value
 Owens Corning Focused on Shareholder Value Q3 2016 This presentation shared at the following event(s): 9/23/16 Zelman Housing Summit Boston Mike Thaman, Chief Executive Officer Forward-Looking Statements
Owens Corning Focused on Shareholder Value
 Owens Corning Focused on Shareholder Value Q3 2017 This presentation shared at the following event(s): 8/29/17 OC Roadshow Hosted by KeyBanc West Coast Michael McMurray, Chief Financial Officer Forward-Looking
Company Delivers Record Quarterly Net Sales of $1.7 Billion, up 12% over the Prior Year
 Company Delivers Record Quarterly Net Sales of $1.7 Billion, up 12% over the Prior Year Mike Thaman Chairman & Chief Executive Officer Michael C. McMurray Chief Financial Officer Third-Quarter Results
Company Delivers Strong Operating Cash Flow; Board of Directors Approves Additional Share Repurchase Authorization for up to 10 Million Shares
 Third-Quarter 2016 Results Company Delivers Strong Operating Cash Flow; Board of Directors Approves Additional Share Repurchase Authorization for up to 10 Million Shares Mike Thaman Chairman & Chief Executive
Owens Corning Reports Fourth-Quarter and Full-Year 2018 Results
 Owens Corning Reports Fourth-Quarter and Full-Year 2018 Results Company Delivered Record Revenue of $7.1 Billion in 2018; Generated Net Earnings of $545 Million and Record Adjusted EBIT of $861 Million
Owens Corning. Investor Meetings in London May 9 & 10, 2007
 Owens Corning Investor Meetings in London May 9 & 10, 2007 Forward-looking Statement and Non-GAAP Measures This presentation contains forward-looking statements within the meaning of Section 27A of the
Welcome to Investor Day November 11, 2010
 Welcome to Investor Day 2010 November 11, 2010 1 Investor Day 2010 Michael McMurray Vice President, Investor Relations & Treasurer November 11, 2010 2 Forward-Looking Statements and Non-GAAP Measures This
Composite Solutions. Arnaud Genis. Group President, Composite Solutions Marcio Sandri. Vice President and Managing Director, Glass Reinforcements
 Composite Solutions Arnaud Genis Group President, Composite Solutions Marcio Sandri Vice President and Managing Director, Glass Reinforcements 1 Composites Highlights The business has been transformed
Owens Corning. Investor Presentation. Week of January 15, 2007
 Owens Corning Investor Presentation Week of January 15, 2007 Forward-looking Statement and Non-GAAP Measures This presentation contains forward-looking statements within the meaning of Section 27A of the
Second Quarter 2008 Business Results
 Second Quarter 2008 Business Results Performance Marked by Continued Growth in Composites and Return to Profitability of Roofing & Asphalt Mike Thaman, Chairman & CEO Duncan Palmer, CFO July 30, 2008 Forward-Looking
Disciplined Financial Strategy Focused on Shareholder Value Creation. Michael McMurray Chief Financial Officer
 Disciplined Financial Strategy Focused on Shareholder Value Creation Michael McMurray Chief Financial Officer 1 Sustained Focus on Shareholder Value Grow earnings and drive free cash flow Sustain a strong
Longbow Research Construction Materials Conference
 Longbow Research Construction Materials Conference Mike Thaman Chairman of the Board and CFO May 30, 2007 Forward-looking Statement and Non-GAAP Measures This presentation contains forward-looking statements
Q Investors Presentation
 Q2 2017 Investors Presentation Forward Looking Statements and Non-GAAP Measures This presentation contains information about management's view of the Company's future expectations, plans and prospects
Builders FirstSource Reports Fourth Quarter and Full Year 2018 Results
 Builders FirstSource Reports Fourth Quarter and Full Year 2018 Results February 28, 2019 Disciplined execution and ongoing initiatives result in record profit, strong cash flow and significant debt reduction
IBM 1Q 2018 Earnings. April 17, ibm.com/investor
 IBM 1Q 2018 Earnings April 17, 2018 ibm.com/investor Forward Looking Statements and Non-GAAP Information 2 Certain comments made in this presentation may be characterized as forward looking under the Private
2016 THIRD-QUARTER EARNINGS REVIEW October 25, 2016
 2016 THIRD-QUARTER EARNINGS REVIEW October 25, 2016 0 THIRD-QUARTER EARNINGS PRESENTATION WHIRLPOOL CORPORATION ADDITIONAL INFORMATION This presentation contains forward-looking statements about Whirlpool
2018 Raymond James Conference
 Richard McPhail Senior Vice President, Finance December 6, 2017 2018 Raymond James Conference 1 Forward Looking Statements and Non- GAAP Financial Measurements Certain statements contained in today s presentations
Johnson Controls reports fiscal Q3 earnings with strong organic growth and underlying margin expansion
 FOR IMMEDIATE RELEASE CONTACT: Investors: Antonella Franzen (609) 720-4665 Ryan Edelman (609) 720-4545 Media: Fraser Engerman (414) 524-2733 Johnson Controls reports fiscal Q3 earnings with strong organic
Q Investor Highlights. May 8, 2018
 Q1 2018 Investor Highlights May 8, 2018 Forward Looking Statements This document contains, and our other public communications may contain, forward-looking statements, that is, information related to future,
Fourth Quarter 2018 Financial Results
 Fourth Quarter 2018 Financial Results Michael H. McGarry, Chairman and Chief Executive Officer Vincent J. Morales, Senior Vice President and Chief Financial Officer John Bruno, Director, Investor Relations
News. PPG reports second quarter 2016 financial results
 News PPG Media Contact: Mark Silvey Corporate Communications +1-412-434-3046 silvey@ppg.com PPG Investor Contact: Scott Minder Investor Relations +1-412-434-3466 sminder@ppg.com www.ppg.com/investor PPG
2018 FOURTH QUARTER EARNINGS CALL
 NORTH AMERICA S LEADING BUILDING MATERIALS DISTRIBUTOR RESIDENTIAL COMMERCIAL INTERIOR SOLAR 2018 FOURTH QUARTER EARNINGS CALL Forward Looking Statements / Non-GAAP Measures This presentation contains
Third Quarter Earnings November 8, 2018
 Third Quarter Earnings November 8, 2018 Forward Looking Statements & Disclosures Forward Looking Statement: With the exception of the historical information contained in this presentation, the matters
Second Quarter 2011 Financial Results
 Second Quarter 2011 Financial Results August 4, 2011 Agenda Company Highlights and Second Quarter 2011 Production Second Quarter 2011 Financial Results, 2011 Outlook and Sales Backlog Update Summary Q
2Q 2017 Highlights and Operating Results
 2Q 2017 Highlights and Operating Results July 25, 2017 1 2Q 2017 Highlights and Operating Results Table of Contents Page(s) 1 Sales Overview and Highlights 4-5 2 NSS Overview 6-7 3 EES Overview 8-9 4 UPS
Investor Presentation. Second Quarter 2018 NASDAQ: BECN BECN
 Investor Presentation Second Quarter 2018 BECN 1 Disclosures Forward Looking Statements and Non-GAAP Measures This presentation contains forward-looking statements within the meaning of the Private Securities
Q4 FY15 Results. November 5, Steve Voorhees Chief Executive Officer. Ward Dickson Chief Financial Officer. Jim Porter President, Paper Solutions
 November 5, 2015 Q4 FY15 Results Steve Voorhees Chief Executive Officer Ward Dickson Chief Financial Officer Jim Porter President, Paper Solutions Bob Beckler President, Packaging Solutions Forward-looking
FINANCIAL OVERVIEW AL MISTYSYN SENIOR VICE PRESIDENT, FINANCE & CHIEF FINANCIAL OFFICER FINANCIAL COMMUNITY PRESENTATION OCTOBER 3, 2017
 FINANCIAL OVERVIEW AL MISTYSYN SENIOR VICE PRESIDENT, FINANCE & CHIEF FINANCIAL OFFICER FINANCIAL COMMUNITY PRESENTATION OCTOBER 3, 2017 Forward Looking Statement The presentations today will contain certain
FINANCIAL OVERVIEW AL M I S T Y S Y N
 FINANCIAL OVERVIEW AL MISTYSYN SENIOR VICE PRESIDENT, FINANCE & CHIEF FINANCIAL OFFICER Forward-Looking Statement The presentations today will contain certain forward-looking statements," within the meaning
2018 Second Quarter Earnings Call. May 8, 2018
 2018 Second Quarter Earnings Call May 8, 2018 Forward Looking Statements / Non-GAAP Measures This presentation contains information about management's view of the Company's future expectations, plans and
PPG Industries, Inc. Second 2016 Financial Results Earnings Brief July 21, 2016
 PPG Industries, Inc. Second 2016 Financial Results Earnings Brief July 21, 2016 Second Quarter 2016 Financial Highlights PPG net sales for the second quarter 2016 were $4.1 billion, down less than one
First Quarter 2019 Financial Results
 First Quarter 2019 Financial Results Michael H. McGarry, Chairman and Chief Executive Officer Vincent J. Morales, Senior Vice President and Chief Financial Officer John Bruno, Director, Investor Relations
PPG Industries, Inc. Fourth 2016 Financial Results Earnings Brief January 19, 2017
 PPG Industries, Inc. Fourth 2016 Financial Results Earnings Brief January 19, 2017 Fourth Quarter Financial Highlights PPG fourth quarter net sales from continuing operations of $3.5 billion were down
IBM. Mark Loughridge Senior Vice President and Chief Financial Officer, Finance and Enterprise Transformation
 IBM Mark Loughridge Senior Vice President and Chief Financial Officer, Finance and Enterprise Transformation J.P. Morgan Global Technology, Media and Telecom Conference The Westin Boston Waterfront, Boston,
Second Quarter 2018 Earnings Teleconference. July 31, 2018
 Second Quarter 2018 Earnings Teleconference July 31, 2018 CONTENTS Q2 2018 Summary 2018 Guidance Q2 2018 Supplemental Information Appendix 2 Disclosure Regarding Forward-Looking Statements Information
MTS REPORTS FISCAL YEAR 2017 FOURTH QUARTER AND FULL YEAR FINANCIAL RESULTS
 MTS Systems Corporation 14000 Technology Drive Eden Prairie, MN 55344-2290 Telephone 952-937-4000 Fax 952-937-4515 News Release FOR IMMEDIATE RELEASE November 27, 2017 MTS REPORTS FISCAL YEAR 2017 FOURTH
Bank of America Merrill Lynch Leverage Finance Conference November 30, 2017
 Bank of America Merrill Lynch Leverage Finance Conference November 30, 2017 Mark Olson Executive Vice President and Chief Financial Officer Safe Harbor Caution Regarding Forward Looking Statements This
Fourth Quarter 2015 Earnings Teleconference. February 4, 2016
 Fourth Quarter 205 Earnings Teleconference February 4, 206 Participants Tom Linebarger Pat Ward Rich Freeland Mark Smith Chairman and Chief Executive Officer Vice President and Chief Financial Officer
EMERSON REPORTS STRONG SECOND QUARTER 2018 RESULTS AND RAISES FULL-YEAR GUIDANCE
 Investor Contact: Tim Reeves (314) 553-2197 Media Contact: Pat Kane (314) 982-8726 EMERSON REPORTS STRONG SECOND QUARTER 2018 RESULTS AND RAISES FULL-YEAR GUIDANCE Net sales of $4.2 billion increased 19
3Q 2018 Highlights and Operating Results. Products. Technology. Services. Delivered Globally.
 3Q 2018 Highlights and Operating Results Products. Technology. Services. Delivered Globally. Table of Contents Page 3 Safe Harbor Statement and Non-GAAP Financial Measures 4 Sales Overview 9 Overview of
PPG Industries, Inc. Third 2016 Financial Results Earnings Brief October 20, 2016
 PPG Industries, Inc. Third 2016 Financial Results Earnings Brief October 20, 2016 Third Quarter 2016 Financial Highlights PPG net sales for the third quarter 2016 were $3.8 billion, up almost 2 percent
FOUNDATION. TRANSFORMATION. VALUE. Basic Materials Conference Longbow Research. March 1, 2016 New York, NY
 FOUNDATION. TRANSFORMATION. VALUE. Basic Materials Conference Longbow Research March 1, 2016 New York, NY www.martinmarietta.com Disclaimer Statement Regarding Safe Harbor for Forward-Looking Statements
Third Quarter 2018 Results November 8, 2018
 Third Quarter 2018 Results November 8, 2018 Safe Harbor Caution Regarding Forward Looking Statements This presentation any other oral or written statements made by us or on our behalf may include forward-looking
Third Quarter 2017 Earnings Call October 24, 2017
 Third Quarter 2017 Earnings Call October 24, 2017 Michael P. Doss President and Chief Executive Officer Stephen R. Scherger Senior Vice President and Chief Financial Officer Forward Looking Statements
MTS REPORTS FISCAL 2018 THIRD QUARTER FINANCIAL RESULTS
 MTS Systems Corporation 14000 Technology Drive Eden Prairie, MN 55344-2290 Telephone 952-937-4000 Fax 952-937-4515 News Release FOR IMMEDIATE RELEASE August 6, 2018 MTS REPORTS FISCAL 2018 THIRD QUARTER
Second Quarter 2018 Results July 31, 2018
 Second Quarter 2018 Results July 31, 2018 Eddie Edwards President and Chief Executive Officer Alex Pease Executive Vice President and Chief Financial Officer Safe harbor Caution Regarding Forward Looking
GCP Applied Technologies
 GCP Applied Technologies Q3 2017 Investor Highlights November 2, 2017 Forward Looking Statements This document contains, and our other public communications may contain, forward-looking statements, that
Investor Deck December 2018
 Investor Deck December 2018 Safe Harbor This presentation includes forward-looking statements which are statements that are not historical facts, including statements that relate to the mix of and demand
IBM 2Q 2018 Earnings. July 18, ibm.com/investor
 IBM 2Q 2018 Earnings July 18, 2018 ibm.com/investor Forward Looking Statements and Non-GAAP Information 2 Certain comments made in this presentation may be characterized as forward looking under the Private
Cautionary Statement Regarding Forward-Looking Information
 Ecolab 1 Fourth Quarter 2011 Teleconference Supplemental Data Cautionary Statement Cautionary Statement Regarding Forward-Looking Information This communication contains various "Forward-Looking Statements"
IBM 4Q 2017 Earnings. January 18, ibm.com/investor
 IBM 4Q 2017 Earnings January 18, 2018 ibm.com/investor Forward Looking Statements and Non-GAAP Information 2 Certain comments made in this presentation may be characterized as forward looking under the
Johnson Controls reports solid fiscal Q2 earnings with stronger orders and free cash flow
 FOR IMMEDIATE RELEASE CONTACT: Investors: Antonella Franzen (609) 720-4665 Ryan Edelman (609) 720-4545 Media: Fraser Engerman (414) 524-2733 Johnson Controls reports solid fiscal Q2 earnings with stronger
Q Investor Highlights. August 8, 2018
 Q2 2018 Investor Highlights August 8, 2018 Forward Looking Statements This document contains forward-looking statements, that is, information related to future, not past, events. Such statements generally
Investor Overview Presentation. August 2018
 Investor Overview Presentation August 2018 Forward-Looking Statements Statements about future results made in this presentation constitute forward-looking statements within the meaning of the Private Securities
PPG Fourth Quarter and Full Year 2017 Financial Results
 PPG Fourth Quarter and Full Year 2017 Financial Results Michael H. McGarry, Chairman and Chief Executive Officer Vincent J. Morales, Senior Vice President and Chief Financial Officer John Bruno, Director,
2016 INVESTOR MEETINGS FIRST QUARTER 2016 WHIRLPOOL CORPORATION
 2016 INVESTOR MEETINGS FIRST QUARTER 0 FIRST-QUARTER INVESTOR MEETINGS WHIRLPOOL CORPORATION ADDITIONAL INFORMATION This Presentation contains forward-looking statements about Whirlpool Corporation and
Investors: Antonella Franzen (609) CONTACT: Ryan Edelman (609) Media: Fraser Engerman (414) FOR IMMEDIATE RELEASE
 CONTACT: Ryan Edelman (609) Media: Fraser Engerman (414) FOR IMMEDIATE RELEASE") FOR IMMEDIATE RELEASE CONTACT: Investors: Antonella Franzen (609) 720-4665 Ryan Edelman (609) 720-4545 Media: Fraser Engerman (414) 524-2733 Johnson Controls reports fiscal and full year earnings with
FOR IMMEDIATE RELEASE CONTACT: Investors: Antonella Franzen (609) 720-4665 Ryan Edelman (609) 720-4545 Media: Fraser Engerman (414) 524-2733 Johnson Controls reports fiscal and full year earnings with
4Q 2017 Presentation. February 27, 2018
 4Q 2017 Presentation February 27, 2018 SAFE HARBOR Statements contained in this presentation that are not historical and reflect our views about future periods and events, including our future performance,
Overview Presentation to Investors. February 2016
 Overview Presentation to Investors February 2016 Forward-Looking Statements Statements about future results made in this presentation constitute forward-looking statements within the meaning of the Private
Avery Dennison Jefferies Industrials Conference
 Avery Dennison Jefferies Industrials Conference August 9, 2016 Anne Bramman SVP and Chief Financial Officer 1 Avery Dennison Investor Presentation Forward-Looking Statements Certain statements contained
Newell Rubbermaid Announces Strong First Quarter Results
 Newell Rubbermaid Announces Strong First Quarter Results» 4.7% Core Sales Growth and Normalized EPS of $0.36» 4.1% Net Sales Growth and Reported EPS of $0.20» Affirms 2015 Full Year Guidance» Expands Project
First Quarter 2018 Earnings Conference Call
 First Quarter 2018 Earnings Conference Call NYSE: CVA Cautionary Statements All information included in this earnings presentation is based on continuing operations, unless otherwise noted. Forward-Looking
BARNES GROUP INC. REPORTS SECOND QUARTER 2018 FINANCIAL RESULTS
 Barnes Group Inc. 123 Main Street Bristol, CT 06010 NEWS RELEASE REPORTS SECOND QUARTER 2018 FINANCIAL RESULTS Sales of $375 million, up 3%; Organic Sales up 1% Operating Margin of 17.0%; Up 120 bps from
BANK OF AMERICA MERRILL LYNCH CONSUMER & RETAIL CONFERENCE. March 4, 2015
 2015 BANK OF AMERICA MERRILL LYNCH CONSUMER & RETAIL CONFERENCE March 4, 2015 Whirlpool Corporation Additional Information This document contains forward-looking statements about Whirlpool Corporation
Third Quarter 2017 Earnings Teleconference. October 31, 2017
 Third Quarter 2017 Earnings Teleconference October 31, 2017 1 Participants Tom Linebarger Rich Freeland Pat Ward Mark Smith Chairman and Chief Executive Officer President and Chief Operating Officer Vice
2013 INVESTOR MEETINGS May 2013
 2013 May 2013 INVESTOR MEETINGS WHIRLPOOL CORPORATION ADDITIONAL INFORMATION This document contains forward-looking statements about Whirlpool Corporation and its consolidated subsidiaries ( Whirlpool
Credit Suisse 6 th Annual Industrials Conference November 2018
 Credit Suisse 6 th Annual Industrials Conference November 2018 Safe Harbor This presentation includes forward-looking statements which are statements that are not historical facts, including statements
Investor Relations Hologic
 Investor Relations Hologic Hologic Announces Financial Results for Second Quarter of Fiscal 2017 -- GAAP Diluted EPS of $1.84 Increases 666.7%, Non-GAAP Diluted EPS of $0.50 Increases 6.4% -- -- Revenue
Investor Update September / October 2017
 Investor Update September / October 2017 [Beacon logo] Forward Looking Statements and Non-GAAP Measures This presentation contains forward-looking statements within the meaning of the Private Securities
productivity results support our confidence in raising the full-year earnings outlook.
 April 21, 2011 Media Contact: Anthony Farina WILMINGTON, Del. 302-773-4418 anthony.r.farina@usa.dupont.com Investor Contact: 302-774-4994 DuPont Reports 1Q 2011 Earnings of $1.52 per Share, Raises 2011
Q Earnings. October 31, 2018
 Q4 2018 Earnings October 31, 2018 Forward-Looking Statements and Non-GAAP Financial Measures Forward-Looking Statements This presentation contains certain forward-looking statements within the meaning
CommScope Reports Fourth Quarter and Full Year 2018 Results
 CommScope Reports Fourth Quarter and Full Year 2018 Results February 21, 2019 Fourth Quarter 2018 Performance Sales of $1.06 billion GAAP operating income of $49 million Non-GAAP adjusted operating income
Fourth Quarter 2016 Results
 Fourth Quarter 2016 Results February 23, 2017 Eddie Edwards President and Chief Executive Officer Mark Olson Executive Vice President and Chief Financial Officer 1 Safe Harbor Caution Regarding Forward
Gardner Denver Reports Strong Third Quarter 2018 Results
 Gardner Denver Reports Strong Third Quarter 2018 Results October 25, 2018 Revenues of $689 million increased 6% over the prior year Reported net income of $72 million compared to prior year of $28 million
Forward-Looking Statements
 Fourth Quarter 2015 Conference Call February 9, 2016 Forward-Looking Statements Certain information contained in this presentation constitutes forward-looking statements for purposes of the safe harbor
OWENS CORNING FORM 10-K. (Annual Report) Filed 02/12/14 for the Period Ending 12/31/13
 Filed 02/12/14 for the Period Ending 12/31/13") OWENS CORNING FORM 10-K (Annual Report) Filed 02/12/14 for the Period Ending 12/31/13 Address ONE OWENS CORNING PARKWAY TOLEDO, OH 43659 Telephone 419-248-8000 CIK 0001370946 Symbol OC SIC Code 3290 -
OWENS CORNING FORM 10-K (Annual Report) Filed 02/12/14 for the Period Ending 12/31/13 Address ONE OWENS CORNING PARKWAY TOLEDO, OH 43659 Telephone 419-248-8000 CIK 0001370946 Symbol OC SIC Code 3290 -
Investor Presentation. August 2014
 Investor Presentation August 2014 1 Important Disclosures NOTE ON FORWARD-LOOKING STATEMENTS: This presentation and related discussions may contain forward-looking statements about such matters as: our
Second-Quarter Earnings Review
 Second-Quarter 2018 Earnings Review GLOBAL OVERVIEW Marc Bitzer President and Chief Executive Officer 2 2018 SECOND-QUARTER HIGHLIGHTS Ongoing EBIT margin expansion despite challenging cost environment
We Distribute Products That Deliver Energy to the World. NOW Inc., Fourth Quarter and Full-Year 2017 Review & Key Takeaways
 We Distribute Products That Deliver Energy to the World NOW Inc., Fourth Quarter and Full-Year 2017 Review & Key Takeaways Forward Looking Statements Statements made in the course of this presentation
Investor Presentation
 Investor Presentation 2017 www.gerdau.com 1 Outlook Gerdau Highlights 2 Region / Country (in Mt and %) 2017f 17/16 18/17 World 1,622 7.0% 1.6% European Union 162 2.5% 1.4% Better outlook for steel consumption
WestRock KeyBanc's Basic Materials and Packaging Conference. September 14, 2016
 WestRock KeyBanc's Basic Materials and Packaging Conference September 14, 2016 Forward-looking Statements This presentation contains forward-looking statements within the meaning of the Private Securities
Third Quarter 2018 Earnings Conference Call
 Third Quarter 2018 Earnings Conference Call NYSE: CVA Cautionary Statements All information included in this earnings presentation is based on continuing operations, unless otherwise noted. Forward-Looking
JOHNSON CONTROLS INTERNATIONAL PLC
 UNITED STATES SECURITIES AND EXCHANGE COMMISSION WASHINGTON, D.C. 20549 FORM 8-K CURRENT REPORT Pursuant to Section 13 or 15(d) of the Securities Exchange Act of 1934 Date of Report (Date of Earliest Event
IBM 4Q 2018 Earnings. January 22, ibm.com/investor
 IBM 4Q 2018 Earnings January 22, 2019 ibm.com/investor Forward Looking Statements and Non-GAAP Information 2 Certain comments made in this presentation may be characterized as forward looking under the
Auto Conference. August 8, Jonathan Collins Executive Vice President & Chief Financial Officer. June 22, Dana
 J.P. TM4 Morgan Acquisition Auto Conference August 8, 2017 Jonathan Collins Executive Vice President & Chief Financial Officer June 22, 2018 Dana 2018 1 Safe Harbor Statement Certain statements and projections
Bank of America Merrill Lynch Global Industrials Conference 2018 March 2018
 Bank of America Merrill Lynch Global Industrials Conference 2018 March 2018 Safe Harbor This presentation includes forward-looking statements which are statements that are not historical facts, including
Johnson Controls reports 2016 fiscal fourth quarter and full year earnings. Company completes multi-industrial transformation
 FOR IMMEDIATE RELEASE CONTACT: Investors: Antonella Franzen (609) 720-4665 Ryan Edelman (609) 720-4545 Media: Fraser Engerman (414) 524-2733 Johnson Controls reports 2016 fiscal fourth quarter and full
PPG Industries, Inc. Third Quarter 2015 Financial Results Earnings Brief October 15, 2015
 PPG Industries, Inc. Third Quarter 2015 Financial Results Earnings Brief October 15, 2015 Third Quarter Financial Highlights PPG net sales for the third quarter of 2015 were $3.87 billion versus the prior
Q Earnings. January 23, 2019
 Q1 2019 Earnings January 23, 2019 Forward-Looking Statements and Non-GAAP Financial Measures Forward-Looking Statements This presentation contains certain forward-looking statements within the meaning
GRAINGER REPORTS RESULTS FOR THE 2018 THIRD QUARTER Revenue grows 7.4%; 8.2% excluding foreign exchange and impact of hurricanes
 News Release GRAINGER REPORTS RESULTS FOR THE 2018 THIRD QUARTER Revenue grows 7.4%; 8.2% excluding foreign exchange and impact of hurricanes Quarterly Summary Reported operating earnings of $189 million,
1Q 2018 Highlights and Operating Results
 1Q 2018 Highlights and Operating Results April 26, 2018 1 Table of Contents Page(s) 4 Announced Agreements to Acquire Australia and New Zealand Security Businesses 5-9 Sales Overview 10-17 Financial Performance
PPG Industries, Inc. Second Quarter 2017 Financial Results Earnings Brief July 20, 2017
 PPG Industries, Inc. Second Quarter 2017 Financial Results Earnings Brief July 20, 2017 Second Quarter Financial Highlights Net sales for the second quarter 2017 were $3.8 billion, increasing about 1 percent
BMC STOCK HOLDINGS, INC. Second Quarter 2018 Earnings Presentation July 30, BMC. All Rights Reserved.
 BMC STOCK HOLDINGS, INC. Second Quarter 2018 Earnings Presentation July 30, 2018 2018 BMC. All Rights Reserved. CLICK Disclaimer TO EDIT TITLE This presentation contains "forward-looking statements" within
Fourth Quarter & Full Year 2018 Earnings Release Supplement
 Fourth Quarter & Full Year 2018 February 22, 2019 The data in this package should be read in conjunction with Barnes Group Inc. s earnings release and periodic filings with the SEC. Safe Harbor Statement
4Q 2017 Highlights and Operating Results
 4Q 2017 Highlights and Operating Results January 30, 2018 1 4Q 2017 Highlights and Operating Results Table of Contents Page(s) 1 Sales Overview 4-8 2 Financial Performance Trends 9-16 3 Leverage Metrics
ROTH Capital Partners 30 th Annual Conference. Monday, March 12, 2018
 Monday, March 12, 2018 1 Forward-Looking Statements This presentation may contain "forward-looking statements" as defined in the Private Securities Litigation Reform Act of 1995. Forward-looking statements
Third Quarter 2008 Earnings Teleconference. October 31, 2008
 Third Quarter 2008 Earnings Teleconference October 31, 2008 Participants Tim Solso Chairman and Chief Executive Officer Joe Loughrey Vice Chairman Pat Ward Chief Financial Officer Tom Linebarger President
BARNES GROUP INC. REPORTS FOURTH QUARTER AND FULL YEAR 2018 FINANCIAL RESULTS
 Barnes Group Inc. 123 Main Street Bristol, CT 06010 NEWS RELEASE Fourth Quarter 2018: REPORTS FOURTH QUARTER AND FULL YEAR 2018 FINANCIAL RESULTS Record Quarterly Sales of $384 million, up 3% from last
SENSATA FOURTH QUARTER AND FULL YEAR 2017 EARNINGS PRESENTATION FEBRUARY 1, 2018
 SENSATA FOURTH QUARTER AND FULL YEAR 2017 EARNINGS PRESENTATION FEBRUARY 1, 2018 Forward-Looking Statements This earnings presentation contains "forward-looking statements" within the meaning of Section