Financial Year 2011 Results. Frankfurt. Schaeffler Group March 20, 2012
|
|
|
- Beverly Wheeler
- 5 years ago
- Views:
Transcription


1 Financial Year 2011 Results Schaeffler Group March 20, 2012 Frankfurt Page 1
2 Agenda Overview 2011 Results 2011 Senior Refinancing Outlook Page 2
3 1 Overview 2011 Targets overachieved Growth Profitability Target 2011 Actual 2011 Target 2011 Actual 2011 Sales growth 8-10 % 12.6 % ü EBIT Margin > 13 % 15.8 % ü CAPEX 6-8 % of Sales 7.2 % of Sales ü Free Cash Flow Sustainably positive 319 mn ü Quality Innovation Target 2011 Actual 2011 Target 2011 Actual 2011 Quality policy Zero defect principle 6 ppm ü R&D expenses ~ 5 % of Sales 4.6 % of Sales ü Employees Education for new employees ~ 6,500 new jobs created ü Innovation management Increase patent registrations TOP ranking in Germany¹ ü 1) Actual ranking expected end of March 2012 Page 3
4 1 Overview Another year of above average growth and margins Sales ¹ in EUR bn EBIT in EUR bn Sales growth 3.0% -0.1% 7.2% 8.7% 4.7% 8.4% -1.2% -17.6% 29.4% 12.6% EBIT margin 6.9% 9.8% 10.8% 12.2% 12.9% 12.6% 11.7% 6.1% 15.9% 15.8% 1) according to German Commercial Code (HGB), according to IFRS Page 4
5 1 Overview 2011 Why we are successful Five key success factors Our vision 1 Operational excellence and quality Market leadership and diversification Customer proximity and systems know-how Innovation and creativity 'Together we move the world' 5 Employee development and commitment Page 5


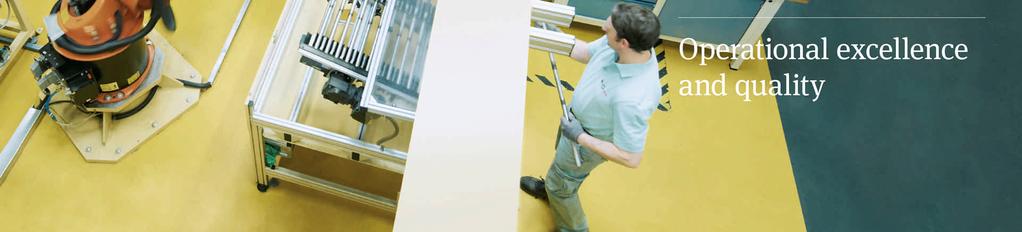
6 Operational Excellence Page 6
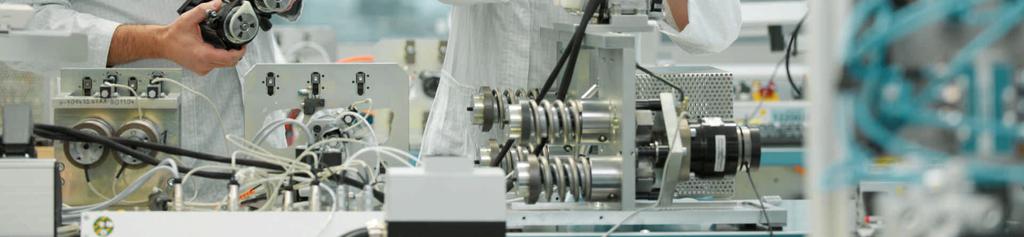
7 1 Overview Superior global production setup 70 plants worldwide Quality index¹ 155% Integrated manufacturing platform with 70 plants worldwide 115% Manufacturing and production technology excellence as main competitive advantages for customer specific solutions 100% 90% Continuous improvement through holistic MOVE program with global roll-out Strict application of zero-defect principle throughout the Schaeffler world 1) Global production output per year / number of customer complaints Numerous awards emphasize Schaeffler's leadership position in terms of engineering and quality Page 7


8 Page 8
9 1 Overview Industrial division Top 3 positions in all major business areas Sales Industrial Sales growth of 15% in 2011 due to strong growth in Power Transmission, Production Machinery and Aftermarket 3, % vs. FY ,002 3,462 Very broad product spectrum of 225,000 products serving about 60 market sectors EBIT EBIT Margin 2, % 6.5% 17.3% 17.8% Cage guided needle bearing: Schaeffler innovation more than 60 years ago today production of more than 15,000 variants of needle roller bearings Adding more functions to roller bearings: improved friction properties, longer operating life and higher operational safety Competence in large size bearings operating the world's largest and most modern large-size bearing rig Page 9


10 Page 10
11 1 Overview Automotive division At the forefront of technology Sales Automotive Sales growth of 13% in 2011 due to Transmission Systems and Aftermarket +51% vs. FY ,325 7,160 Understanding of the customer's entire systems to tailor our components to the customer's requirements 5,476 4,743 Continuous improvement of drive train with modern engine and transmission systems EBIT EBIT Margin , % 6.0% 15.7% 15.0% Dry double clutch: key element for efficient transmission; production of more than 150,000 dry double clutches p.m. Variable valve-control systems, thermal management, wheel bearings solutions etc. Page 11


12 Page 12
13 1 Overview Innovation powerhouse Engineering excellence Number of patent applications¹ 1,641 Around 6,000 employees at 40 R&D centers worldwide operating in close cooperation with customers ,146 Further investments planned in the fields of surface coating, materials research and tools for simulations Schaeffler is again ranked as one of the most innovative companies in Germany in #7 #5 #5 #4 Bundling our comprehensive electric mobility expertise in "emobility system division" (automotive and industrial) 1) Source: German Patent and Trademark Office, patent registrations in 2011 will be published end of March 2012 Electric mobility: start-stop solutions, hybrid technologies, edifferential and ewheel Drive Page 13


14 Page 14
15 1 Overview Forming a world-class workforce 6,500 new jobs created Employees at year end +20% vs. FY ,031 Around 6,500 new jobs created thereof 1,500 in Germany 66,034 67,509 61,536 Around 1,000 new trainees worldwide per year training centers worldwide Employees per region North America South America 9% 7% Germany Taicang (China), Irapuato (Mexico) and Brasov (Romania) use the German training system Asia/ Pacific 14% 40% Europe (w/o Germany) 30% Schaeffler Academy in Irapuato (Mexico) founded Page 15
16 Agenda Overview 2011 Results 2011 Senior Refinancing Outlook Page 16
17 2 Results 2011 Strong results on all levels FY 2011 FY 2010 / % Q Q / % Sales EBITDA EBITDA margin EBIT EBIT margin Net Income Free Cash-Flow Leverage ratio ROCE 10,694 9, % 2,612 2, % 2,243 2, % 22.1% -1.1% pts. 18.1% 20.8% -2.7% pts. 1,689 1, % 15.9% -0.1% pts. 13.0% 15.0% -2.0% pts x 2.7x +0.3x 3.0x 2.7x +0.3x 27.2% 25.1% +2.1% pts. 27.2% 25.1% +2.1% pts. Page 17
18 2 Results 2011 Crossing the 10 billion Euro sales threshold Sales Sales by region share in % / vs in % 1,876 1,971 1,721 1,768 2,160 2,402 2,452 2, % vs. FY ,697 2,682 2,703 2,612 Asia / Pacific +16% (Q4: +16%) South America +4% (Q4: -7%) 6% 22% 13% 27% Germany +11% (Q4: +2%) North America +12% (Q4: +12%) 32% Europe (w/o Germany) +14% (Q4: +0%) Gross profit margin 7,336 9,495 Q1 Q2 Q3 Q4 Q1 Q2 Q3 Q4 Q % 22% 27% 25% 31% 32% 33% 30% 32% 10,694 Q2 Q3 Q % 31% 28% Sales by division FY 2010 FY 2011 D Automotive 6,325 7, % Industrial 3,002 3, % Other % Total 9,495 10, % 1) The amount consists mainly of scrap sales and materials provided to subcontractors 2) The amount consists mainly of materials provided to subcontractors Page 18
19 2 Results 2011 EBIT margin 15.8% EBIT EBIT 1, % vs. FY , , EBIT FY 2010 Sales COGS R&D Selling Admin & Other EBIT FY EBIT margin 15.9% 15.8% ,509 1,689 Q1 Q2 Q3 Q4 Q1 Q2 Q3 Q4 Q1 Q2 Q3 Q EBIT 2.1% 4.0% 10.0% 7.7% 15.5% 16.8% 16.2% 15.0% 17.5% 15.3% 17.2% 13.0% margin EBIT by division FY 2010 EBIT FY 2011 EBIT D FY 2010 margin FY 2011 margin Automotive 990 1, % 15.7% 15.0% Industrial % 17.3% 17.8% Total 1,509 1, % 15.9% 15.8% Page 19
20 2 Results 2011 Net Income 889 million Euro Net Income¹ FY 2011 Net Income¹ ,694-1, , , One-off dilution loss of -396 Mio. EUR Q1 Q2 Q3 Q4 Q1 Q2 Q3 Q4 Q1 Q2 Q3 Q4 Sales Cost EBIT Interest Investment Taxes/ Result Result Minorities Net Income ) Net income attributable to the shareholders of the parent company Page 20
21 2 Results Net interest expense reduced Interest Result¹ Composition of interest result Q1 Q2 Q3 Q4 Q1 Q2 Q3 Q4 Q1 Q2 Q3 Q4 Non-Cash Cash GuV Q1 Q2 Q3 Mark-to-market interest rate derivatives Q4 Other Δ Cash Interest Other / expenses interest rate financial hedging debt 1) For presentation purposes, results are shown as positive figures 2) Inludes amortized transaction cost and interest for pension accruals Page 21
22 2 Results At equity result Continental 324 million Euro Net Income Continental At equity result Schaeffler Group , , Net Income Continental Conti shares (per 31/12/2011: 36,14%) Q1 Q2 Q3 Q4 FY Q1 Q2 Q3 Q4 FY , PPA ,039 Dilution Loss/ Other Q1 Q2 Q3 Q4 Q1 Q2 Q3 Q4 Q1 Q2 Q3 Q4 At Equity Result Sales 4,302 4,761 5,337 5,696 5,997 6,658 6,490 6,903 7,346 7,533 7,714 7,912 EBIT Page 22
23 2 Results Tax rate impacted by non-deductible interest expense Taxes¹ Tax rate reconciliation FY 2011 FY 2010 Net income before tax 1, Expected tax expense Addition / reduction due to deviating local tax bases Q1 Q2 Q3 Q4 Q1 Q2 Q3 Q4 Q1 Q2 Q3 Q EBT² Tax rate² EBT² Tax rate² EBT² Tax rate² -483 n/a % % Foreign / domestic tax rate differences -4-1 Non-recognition of deferred tax assets 4 7 Change in tax rate and law 0-5 Non-deductible expenses Result from associated company accounted for at equity Taxes for previous years 2-1 Other Reported tax expense ) For presentation purposes, results are shown as positive figures 2) Excluding result from associated companies accounted for at equity Page 23
24 2 Results 2011 Continuous free cash flow generation Free Cash Flow Free Cash Flow FY , , ¹ ,019 Q1 Q2 Q3 Q4 Q1 Q2 Q3 Q4 Q1 Q2 Q3 Q4 EBITDA Δ Net Working Capital Capex Interest Taxes/ Other Free Cash Flow Q ) Including one-off close-out payments for certain interest derivatives and cash interest paid in January 2011 for December 2010 Page 24
25 2 Results 2011 Working capital further improved Capex significantly increased Working Capital CAPEX 2,463 2,280 2,181 1,993 2,424 2,268 2,405 2,325 2,547 2,562 2,667 2, Q1 Q2 Q3 Q4 Q1 Q2 Q3 Q4 Q1 Q2 Q3 Q4 Q1 Q2 Q3 Q4 Q1 Q2 Q3 Q4 Q1 Q2 Q3 Q in % of sales 1 in % of sales % 3.8% 7.2% 1) Calculation based on LTM sales Page 25
26 2 Results 2011 Leverage ratio at 3.0x Net financial debt / Leverage ratio Development of net financial debt 6,104 6,098 6,131 5, x 5.0x 4.9x 4.2x 6,124 6,020 5,930 5,763 5, x 3.5x 3.0x 2.7x 2.8x 7,145² 7, , x 2.9x¹ 3.0x¹ , Debt Push Down Junior Facility (07/2011) -6 Other net changes in financial debt Bank loans +600 Additional Shareholder loan from special dividend in 09/ Partial repayment shareholder loans Shareholder loans +336 Net change in cash position 7, Q1 Q2 Q3 Q4 Q1 Q2 Q3 Q4 Q1 Q2 Q3 Q4 Actual Actual /12/ /12/2011 Gross debt 6,298 6,321 6,322 6,481 6,468 6,514 6,503 6,477 6,482 6,422 7,645 7,485 Leverage ratio 2.7x 3.0x¹ Cash position Cash position Leverage Ratio (Net Financial Debt / LTM EBITDA) 1) Excluding shareholder loans 2) Including shareholder loans of EUR 600 mn as of 30 September ) Including shareholder loans of EUR 420 mn as of 31 December 2011 Page 26
27 2 Results 2011 Equity ratio improved Strong ROCE level maintained Equity ratio 1 in % ROCE in % Q1 Q2 Q3 Q4 Q1 Q2 Q3 Q4 Q1 Q2 Q3 Q4 Q1 Q2 Q3 Q4 Q1 Q2 Q3 Q4 Q1 Q2 Q3 Q Total Equity 1 3,554 3,500 3,162 2,852 2,755 3,023 3,022 3,341 3,288 2,719 1,498 1,714 Capital Employed 6,503 6,229 6,007 5,740 5,995 6,131 5,967 5,941 6,105 6,157 6,320 6,210 1) Including minorities Page 27
28 Agenda Overview 2011 Results 2011 Senior Refinancing Outlook Page 28
29 3 Senior Refinancing Milestones Schaeffler refinancing Three major steps 20 November 2009 Initial refinancing of acquisition debt Step 1 28 June 2010 Separating total debt into 'Upper Deck' debt (Junior) and 'Lower Deck' debt (Senior) 27 March 2011 Refinancing of Junior debt on 'Upper Deck' Step 2 13 October 2011 Conversion of Schaeffler GmbH into Schaeffler AG Step 3 27 January /14 February 2012 Refinancing of Senior debt on 'Lower Deck' Placement of 2.0 bn of bonds and 1.4 bn of institutional loans bank syndication to come Page 29
30 3 Senior Refinancing All key objectives achieved Six key success factors Pre-refinancing Post-refinancing 1 Improve current financing costs > 8% ~ 7.5% ü 2 Extend debt maturity profile Duration: Ø 1.5 years Duration: Ø 4.4 years ü 3 Diversify funding sources Banks Banks + Institutional bond and loan investors ü 4 Expand banking consortium 4 Banks 8 banks + bank syndication ü 5 Establish Schaeffler credit rating No rating S&P: B (positive) Moody's: B2 (stabil) ü 6 Enhance financial flexibility ü Restrictive terms Improved terms Page 30
31 3 Senior Refinancing Maturity profile extended Capital sources diversified Maturity profile after refinancing¹ in EUR bn Capital sources new¹ as of 29 Feb 2012 Facility Amount in EUR Initial margins / cash interest Maturity Source 8,000 7,000 6,000 5,000 Senior Term Loan B 3.0 bn 3 years Senior Term Loan B 3,000 mn EURIBOR +4.25% Jan Banks Senior Term Loan C1 600 mn EURIBOR +4.75% Jan Banks Institutional Loan C2 450 mn EURIBOR +5.00% Jan Investors Institutional Loan C2 ~975 mn LIBOR +4.75% Jan Investors Bond 2017 (EUR) 800 mn 7.75% Feb Investors 4,000 3,000 2,000 1,000 Senior Term Loan C1 0.6 bn 5 years Institutional Loan C2 (EUR/USD) ~ 1.4 bn 5 years High-Yield-Bond 2017 (EUR/USD) ~ 1.2 bn 5 years High Yield-Bond 2019 (EUR/USD) ~ 0.8 bn 7 years HY1 HY2 HY1 HY2 HY1 HY2 HY1 HY2 HY1 HY2 HY1 HY2 HY1 HY2 HY Bond 2017 (USD) ~460 mn 7.75% Feb Investors Bond 2019 (EUR) 400 mn 8.75% Feb Investors Bond 2019 (USD) ~380 mn 8.50% Feb Investors Total ~7,065 mn ~ 7.5% Capital sources old as of 21 Dec 2011 Senior Term Loan 2 EURIBOR +4.25% 2 Jun Bank 6,950 mn (+5.25%) (Jun. 2014) consortium = Maturity profile pre refinancing: June 2013 plus 1 year extension option to June 2014 adding 1% financing costs 1) Without revolving facility of about EUR 1.0 bn 2) Variable rate of EURIBOR +4.25% was swapped into fixed rate in 2009 resulting in cash interest of ~ 8.5% Page 31
32 3 Senior Refinancing New financing structure Financing structure 1 Holding (Upper Deck) 1 Junior Revolver Schaeffler Holding GmbH & Co. KG 100% 1 2 Junior Revolver (EUR 250 mn) - Not drawn; maturing in June Euribor +4.5% p.a. cash interest Chart simplified for illustration purposes Junior Term Loan (EUR 3,029 mn) 4 - Bullet structure maturing in June Euribor +1.7% p.a. cash interest plus 6% p.a. PIK interest 2 3 Junior Term Loan Junior Bond Schaeffler Verwaltungs GmbH ITP 2 3 Junior Bond (EUR 1,855 mn) 5 -Zero-coupon bond maturing in March % p.a. PIK interest Schaeffler Group (Lower Deck) Senior Revolver Senior Term Loan Bonds 100% 100% Schaeffler AG 100% 13.8% 36.1% 10.4% Free float 39.7% 1 2 Senior Revolver new (EUR 1,000 mn) - Not drawn; maturing in June Euribor +4.25% p.a. cash interest Senior Term Loan new (EUR 5,000 mn) - Several tranches (B, C1, C2); maturing 2015 and Banks and institutional investors - Euribor/Libor plus margin (4,75-5,00%) cash interest with margin step-down Schaeffler Finance B.V. Schaeffler Technologies AG & Co. KG Continental AG 3 Bonds (EUR 2,000 mn) - 2 EUR (5y/7y) and 2 USD (5y/7y) tranches % and 8.75% p.a. cash interest 1) As of 31 December ) ITP - Independent Third Parties: M.M. Warburg and Bankhaus Metzler 3) Extended by 18 months as part of Senior refinancing 4) Nominal value as of Dec. 31, ) Carrying value as of Dec. 31, ) Incl. 2x1 year extension option Page 32
33 Agenda Overview 2011 Results 2011 Senior Refinancing Outlook Page 33
34 4 Outlook Key operational focus areas in the next years Maintain and expand our technology and quality leadership Further expand in attractive regions and business areas Focus on innovative components and systems to drive global industry trends Leverage our technology leadership Further enhance "Zero-defect" principle Maintain outstanding operational excellence Focus on rapidly growing regions like Asia Expand on attractive business areas Further grow aftermarket business Maintain leading position in patent applications Focus on energy efficiency and renewable energies Excel in mechatronic systems and hybrid technologies 4 Increase cooperation with Continental Target leading systems offering in mechatronics Expand existing procurement cooperation Page 34
35 4 Outlook Ongoing regional diversification In the region, for the region Global footprint with five dedicated regions Planned greenfield sites and plant extentions for Irapuato, Mexico 6 2 Kysuce, Slovakia Skalica, Slovakia Szombathely, Hungary Brasov, Romania Germany Europe w/o Germany North & South America Asia / Pacific Plants R&D centers Total Nanjing, China Yinchuan, China Taicang 5, China Taicang 6, China Suzhou, China Savli, India Pune, India Hosur, India BienHoa City, Vietnam Page 35
36 4 Outlook Our targets for 2012 Growth Profitability Actual 2011 Target 2012 Actual 2011 Target 2012 Sales growth 12.6 % > 5 % EBIT Margin 15.8 % > 13 % CAPEX 7.2 % of Sales 6-8 % of Sales Free Cash Flow 319 mn Sustainably positive Quality Innovation Actual 2011 Target 2012 Actual 2011 Target 2012 Quality policy 6 ppm Further improve R&D expenses 4.6 % of Sales ~ 5 % of Sales Employees ~ 6,500 new jobs > 3,500 new jobs Innovation management TOP ranking in Germany¹ Maintain 1) Actual ranking expected end of March 2012 Page 36


37 Contact Investor Relations Financial Calendar 2012 phone: FY 2011 results: March 20 fax: Q results: May 29 ir@schaeffler.com Q results: August 28 Q results: November 20 Page 37
38 Backup Sales growth in both divisions above market growth Sales Automotive Sales Industrial +13.2% vs. FY ,130 1,008 1,351 1,254 1,6081,598 1,628 1,491 1,822 1,7691,814 1, % vs. FY ,743 6,325 7,160 2,513 3,002 3,462 Q1 Q2 Q3 Q4 Q1 Q2 Q3 Q4 Q1 Q2 Q3 Q4 Q1 Q2 Q3 Q4 Q1 Q2 Q3 Q4 Q1 Q2 Q3 Q Gross profit margin 17% 20% 27% 24% 29% 29% 31% 27% 29% 27% 28% 25% gross profit margin 32% 26% 29% 28% 37% 39% 39% 37% 39% 36% 38% 34% Page 38
39 Backup Industrial and Automotive EBIT with record profitability EBIT Automotive EBIT Industrial +8.5% vs. FY Q1 Q2 Q3 Q4 Q1 Q2 Q3 Q4 Q ,074 Q2 Q3 Q % vs. FY Q1 Q2 Q3 Q4 Q1 Q2 Q3 Q4 Q Q2 Q3 Q4 EBIT margin -4.1% 3.5% 12.0% 9.8% 16.0% 17.0% 15.6% 14.1% 16.6% 14.8% 16.2% 12.4% EBIT 11.1% 5.0% 6.0% 3.1% 15.0% 17.5% 18.4% 17.8% 19.9% 17.1% 19.6% 14.4% margin 6.0% 15.7% 15.0% 6.5% 17.3% 17.8% Page 39
40 Backup Bond data Issuer Schaeffler Finance B.V. Schaeffler Finance B.V. Schaeffler Finance B.V. Schaeffler Finance B.V. Issue Senior Secured Notes Senior Secured Notes Senior Secured Notes Senior Secured Notes Principal Amount 800 mn $600 mn 400 mn $500 mn Offering Price % % % % Rating B1 (Moody's) B (S&P) B1 (Moody's) B (S&P) B1 (Moody's) B (S&P) B1 (Moody's) B (S&P) Coupon 7.75% 7.75% 8.75% 8.50% Issue Date February 9, 2012 February 9, 2012 February 9, 2012 February 9, 2012 Maturity February 15, 2017 February 15, 2017 February 15, 2019 February 15, 2019 Interest Payment Feb. 15 / Aug. 15 Feb. 15 / Aug. 15 Feb. 15 / Aug. 15 Feb. 15 / Aug. 15 WKN A1G0J3 A1G0K6 A1G0J5 ISIN XS USN77608AB82 XS USN77608AA00 Denomination 1,000 with minimum tradable amount 100,000 $2,000 with minimum tradable amount $200,000 1,000 with minimum tradable amount 100,000 $2,000 with minimum tradable amount $200,000 Page 40
41 Disclaimer This presentation contains forward-looking statements. The words "anticipate", "assume", "believe", "estimate", "expect", "intend", "may", "plan", "project", "should" and similar expressions are used to identify forward-looking statements. Forward-looking statements are statements that are not historical facts; they include statements about Schaeffler Group's beliefs and expectations and the assumptions underlying them. These statements are based on plans, estimates and projections as they are currently available to the management of Schaeffler AG. Forward-looking statements therefore speak only as of the date they are made, and Schaeffler Group undertakes no obligation to update any of them in light of new information or future events. By their very nature, forward-looking statements involve risks and uncertainties. These statements are based on Schaeffler AG management's current expectations and are subject to a number of factors and uncertainties that could cause actual results to differ materially from those described in the forward-looking statements. Actual results may differ from those set forth in the forwardlooking statements as a result of various factors (including, but not limited to, future global economic conditions, changed market conditions affecting the automotive industry, intense competition in the markets in which we operate and costs of compliance with applicable laws, regulations and standards, diverse political, legal, economic and other conditions affecting our markets, and other factors beyond our control). This presentation is intended to provide a general overview of Schaeffler Group s business and does not purport to deal with all aspects and details regarding Schaeffler Group. Accordingly, neither Schaeffler Group nor any of its directors, officers, employees or advisers nor any other person makes any representation or warranty, express or implied, as to, and accordingly no reliance should be placed on, the accuracy or completeness of the information contained in the presentation or of the views given or implied. Neither Schaeffler Group nor any of its directors, officers, employees or advisors nor any other person shall have any liability whatsoever for any errors or omissions or any loss howsoever arising, directly or indirectly, from any use of this information or its contents or otherwise arising in connection therewith. The material contained in this presentation reflects current legislation and the business and financial affairs of Schaeffler Group which are subject to change and audit. Page 41
Schaeffler Group back to profitable growth
 Schaeffler Group back to profitable growth Full Year Results 2010 Analyst Conference March 29 th, 2011 Disclaimer This presentation contains forward-looking statements. The words "anticipate", "assume",
Schaeffler Group. BNP Paribas High Yield and Leveraged Finance Conference London January 14, 2014
 Schaeffler Group BNP Paribas High Yield and Leveraged Finance Conference London January 14, 2014 Disclaimer This presentation contains forward-looking statements. The words "anticipate", "assume", "believe",
Results 9M 2016 Schaeffler AG. Conference Call November 9, 2016 Herzogenaurach
 Results 9M 2016 Schaeffler AG Conference Call Herzogenaurach Disclaimer This presentation contains forward-looking statements. The words "anticipate", "assume", "believe", "estimate", "expect", "intend",
Results FY 2017 Schaeffler AG. Conference Call March 7, 2018 Munich
 Results FY 2017 Schaeffler AG Conference Call Munich Disclaimer This presentation contains forward-looking statements. The words "anticipate", "assume", "believe", "estimate", "expect", "intend", "may",
Schaeffler AG Results H Conference Call August 11, 2016 Herzogenaurach
 Conference Call August 11, 2016 Herzogenaurach Disclaimer This presentation contains forward-looking statements. The words "anticipate", "assume", "believe", "estimate", "expect", "intend", "may", "plan",
Results Q Schaeffler AG. Conference Call November 8, 2017 Herzogenaurach
 Results 2017 Schaeffler AG Conference Call Herzogenaurach Disclaimer This presentation contains forward-looking statements. The words "anticipate", "assume", "believe", "estimate", "expect", "intend",
2.4 Financial position and finance management
 49 2.4 Financial position and finance management Cash flow and liquidity Capital expenditures by region (Capex) No. 049 Europe in millions 657 556 18.2 The Schaeffler Group generated free cash flow of
Part 1 Executing our strategy
 Entwurf 19.09.018 15h00 Part 1 Executing our strategy Klaus Rosenfeld Chief Executive Officer Capital Markets Day 018 Berlin Disclaimer This presentation contains forward-looking statements. The words
Schaeffler Capital Market Presentation. September 2015
 Schaeffler Capital Market Presentation September 2015 Agenda 1 2 3 Schaeffler at a glance Mobility for tomorrow Financial Results H1 2015 2 Disclaimer This presentation contains forward-looking statements.
Schaeffler AG 17 th GCC Kepler Cheuvreux. Jan 17, 2018 Frankfurt
 Schaeffler AG 17 th GCC Kepler Cheuvreux Jan 17, 2018 Frankfurt Disclaimer This presentation contains forward-looking statements. The words "anticipate", "assume", "believe", "estimate", "expect", "intend",
Schaeffler AG Global Industrials & EU Autos Conference 2017 Bank of America Merrill Lynch. March 22, 2017 London
 Schaeffler AG Global Industrials & EU Autos Conference 2017 Bank of America Merrill Lynch March 22, 2017 London Disclaimer This presentation contains forward-looking statements. The words "anticipate",
Investor Presentation. Schaeffler India Limited February 09, 2018
 Schaeffler India Limited February 09, 2018 Agenda 1 2 3 4 Economy & Market Financial update Q4 / 12M - 2017 Transaction update Key takeaways 2 1 Economy & Market Macroeconomic Performance GDP Growth %
Schaeffler AG Deutsche Bank dbaccess IAA Cars Conference
 Schaeffler AG Deutsche Bank dbaccess IAA Cars Conference September 12, 2017 Disclaimer This presentation contains forward-looking statements. The words "anticipate", "assume", "believe", "estimate", "expect",
Schaeffler Group Mobility for tomorrow Klaus Rosenfeld Chief Executive Officer
 Schaeffler Group Mobility for tomorrow Klaus Rosenfeld Chief Executive Officer Capital Markets Day July 20 th, 2016 London Agenda 1 Overview 2 Our Strategy 3 Our Action Plan 4 Our Financial Ambitions 5
Results 9M 2018 Schaeffler AG. Conference Call November 7, 2018 Herzogenaurach
 Results 9M 2018 Schaeffler AG Conference Call Herzogenaurach Disclaimer This presentation contains forward-looking statements. The words "anticipate", "assume", "believe", "estimate", "expect", "intend",
SMART STEEL. Q Results. Detlef Borghardt, CEO Dr. Matthias Heiden, CFO. August 14, 2018
 SMART STEEL Q2 218 Results Detlef Borghardt, CEO Dr. Matthias Heiden, CFO August 14, 218 Agenda Business Summary Guidance adjustment FY 218 Market update Regional trends: Status and profitability trend
Results Q Schaeffler AG. Conference Call May 8, 2018 Herzogenaurach
 Results Q1 2018 Schaeffler AG Conference Call Herzogenaurach Disclaimer This presentation contains forward-looking statements. The words "anticipate", "assume", "believe", "estimate", "expect", "intend",
Investor Call Half-Year Results 2016
 Investor Call Half-Year Results 2016 September 22th, 2016 Philipp Kuckuck, Vice President Corporate Finance Disclaimer This presentation was prepared with reasonable care. However, no responsibility can
Investor Conference Call. Financial Year April 2014
 Investor Conference Call Financial Year 2013 24 April 2014 Agenda Presenter 1 2 Business Profile Regulatory Developments Dr. Jörg Bergmann Chief Financial Officer Open Grid Europe GmbH 3 Refinancing 4
TI Fluid Systems plc Results Presentation for TI Fluid Systems plc 20 March 2018
 2017 Results Presentation for 20 March 2018 Disclaimer This presentation contains certain forward-looking statements with respect to the financial condition, results of operations and business of (the
FY 2017 Presentation
 FY 2017 Presentation 1 2 At a glance Overview FY 2017 YoY revenue growth of 2.2% to EUR 82.5 mn (FY 2016: EUR 80.7 mn) in a challenging year after 13.5% decline at the end of H1/17 (compared YoY) New order
Investor Call Half-Year Results 2015
 Investor Call Half-Year Results 2015 November 2, 2015 Michael Frick, Corporate EVP and CFO Philipp Kuckuck, Director Corporate Finance Highlights Successful business development in H1 2015 with above market
Schaeffler Group at a glance
 Facts and figures 9M 2016 Schaeffler Group at a glance Key figures 1 st nine months Income statement (in millions) 2016 2015 Revenue 9,977 9,958 0.2 % at constant currency 2.7 % EBIT 1,276 1,251 2.0 %
Zumtobel Group AG Q1 2018/19 & Strategic Outlook. September 2018
 Zumtobel Group AG Q1 2018/19 & Strategic Outlook September 2018 AGENDA Q1 2018/19 financial results Corporate Strategy Outlook ) Q1 2018/19 results & strategic outlook 04.09.2018 2 Stabilisation measures
FUCHS GROUP. Setting Standards - Worldwide. Company Presentation, March 2017 Dagmar Steinert, CFO Thomas Altmann, Head of Investor Relations
 FUCHS GROUP Setting Standards - Worldwide Company Presentation, March 2017 Dagmar Steinert, CFO Thomas Altmann, Head of Investor Relations Agenda 01 The Leading Independent Lubricants Company 02 FY 2016
HELLA Investor Update Q1 2015/16
 HELLA Investor Update Q1 2015/16 Conference Call on September 25th, 2015 Dr. Wolfgang Ollig, Chief Financial Officer Carl Pohlschmidt, Finance Director HF-7761DE_C (2012-12) Disclaimer This document was
FUCHS PETROLUB SE The leading independent lubricants manufacturer of the world
 FUCHS PETROLUB SE The leading independent lubricants manufacturer of the world Dr. Alexander Selent, Vice Chairman & CFO Reiner Schmidt, GMC-Member Warburg Highlights - Handout June 2015 The leading independent
FUCHS GROUP. In Motion. Company Presentation, May 2017 Dagmar Steinert, CFO Thomas Altmann, Head of Investor Relations
 FUCHS GROUP In Motion Company Presentation, May 2017 Dagmar Steinert, CFO Thomas Altmann, Head of Investor Relations Agenda 01 The Leading Independent Lubricants Company 02 Q1 2017 03 Shares 04 Appendix
FUCHS GROUP. In Motion. Investor Presentation, June 2017 Stefan Fuchs, CEO Thomas Altmann, Head of Investor Relations
 FUCHS GROUP In Motion Investor Presentation, June 2017 Stefan Fuchs, CEO Thomas Altmann, Head of Investor Relations Agenda 01 The Leading Independent Lubricants Company 02 Q1 2017 03 Shares 04 Appendix
SMART STEEL. Q Results. Detlef Borghardt, CEO Dr. Matthias Heiden, CFO. November 8, 2018
 SMART STEEL Q3 218 Results Detlef Borghardt, CEO Dr. Matthias Heiden, CFO November 8, 218 Agenda Business Summary Preliminaries confirmed Market update Segments: Status and profitability trend in the regions
Oerlikon reports strong operating performance in Q2 2012
 Oerlikon reports strong operating performance in Q2 2012 Dr. Michael Buscher, CEO Jürg Fedier, CFO Oerlikon Q2 and H1 Results 2012 August 3, 2012 Agenda 1 Business Update Q2 2012 2 Financials Q2 2012 and
FY 2014 Results Presentation. Uwe Röhrhoff, CEO Rainer Beaujean, CFO Duesseldorf, February 11, 2015
 FY 2014 Results Presentation Uwe Röhrhoff, CEO Rainer Beaujean, CFO Duesseldorf, February 11, 2015 Disclaimer 1. This presentation may contain certain forward-looking statements, including assumptions,
Bilfinger Berger: Entering new growth phase
 Bilfinger Berger: Entering new growth phase Roadshow London, Roland Koch, CEO Andreas Müller, Head of Corporate Accounting and Investor Relations Agenda 1. Bilfinger Berger Overview 2. Preliminary figures
Q Results. Lars Brorsen (CEO) Christoph Hobo (CFO) November 22, 2018
 Christoph Hobo (CFO) November 22, 2018") Q3 2018 Results Lars Brorsen (CEO) Christoph Hobo (CFO) November 22, 2018 Agenda 1. Highlights Q3 2018 2. Market outlook 3. Detailed results review 4. Company outlook 5. Q&A Appendix 1 Business summary
Q3 2018 Results Lars Brorsen (CEO) Christoph Hobo (CFO) November 22, 2018 Agenda 1. Highlights Q3 2018 2. Market outlook 3. Detailed results review 4. Company outlook 5. Q&A Appendix 1 Business summary
Q Conference Call Presentation. Dr. Christoph von Plotho, CEO Rainer Irle, CFO July 31, 2015
 Q2 2015 Conference Call Presentation Dr. Christoph von Plotho, CEO Rainer Irle, CFO Disclaimer The information contained in this presentation is for background purposes only and is subject to amendment,
Results First Quarter 2012/13
 Results First Quarter 2012/13 Investor Call Mannheim, 27 th June 2012 Dr. Michael Majerus CFO Disclaimer 2012 PHOENIX Pharmahandel GmbH & Co KG This document has been prepared by PHOENIX Pharmahandel GmbH
FUCHS GROUP. Setting Standards - Worldwide. Company Presentation, January 2017 Dagmar Steinert, CFO Thomas Altmann, Head of Investor Relations
 FUCHS GROUP Setting Standards - Worldwide Company Presentation, January 2017 Dagmar Steinert, CFO Thomas Altmann, Head of Investor Relations Agenda 01 The Leading Independent Lubricants Company 02 Q1-3
Financial Results FY 2009 VTG AG On a safe track to a sustainable future
 Financial Results FY 2009 VTG AG On a safe track to a sustainable future Hamburg, April 20 th 2010 Speakers: Dr. Heiko Fischer, CEO Dr. Kai Kleeberg, CFO Table of content 1 Executive Summary 2 Top Priorities
Investor Presentation. FY 2017 Results
 Investor Presentation FY 2017 Results April 4, 2018 Disclaimer This presentation provides general information about Compañía Sud Americana de Vapores S.A. ( CSAV ). It consists of summary information and
Scout24 AG Interim Results Q Conference Call November 11, 2015
 www.scout24.com Scout24 AG Interim Results Q3 2015 Conference Call November 11, 2015 Disclaimer This document has been issued by Scout24 AG (the Company and, together with its direct and indirect subsidiaries,
Refresco world s largest independent bottler for retailers and A-brands
 Corporate story Refresco world s largest independent bottler for retailers and A-brands J.P. Morgan 2018 European High Yield & Leveraged Finance Conference I London, September 7, 2018 Presentation disclaimer
in cooperation with FCF MANZ AG STRUCTURED FINANCE WORKSHOP NOVEMBER 2014
 in cooperation with FCF MANZ AG STRUCTURED FINANCE WORKSHOP NOVEMBER 2014 1 AGENDA 1. INTRODUCTION HOSTS 8 MIN 2. CASE STUDY MANZ EIB JUNIOR FINANCING 12 MIN 3. GROUP WORK 15 MIN i. GROUP 1: What financing
Gerresheimer Capital Markets Day: Update on financial performance. October 23+24, Hans-Jürgen Wiecha, CFO
 Gerresheimer Capital Markets Day: Update on financial performance October 23+24, 2008 Hans-Jürgen Wiecha, CFO 0 Disclaimer This presentation may contain certain forward-looking statements, including assumptions,
FUCHS GROUP. Setting Standards - Worldwide
 FUCHS GROUP Setting Standards - Worldwide dbaccess German, Swiss & Austrian Conference, 8 th June 2016, Berlin Stefan Fuchs, CEO Thomas Altmann, Investor Relations Agenda 01 The Leading Independent Lubricants
Fiscal year 2011 off to a strong start
 Fiscal year 2011 off to a strong start Peter Löscher, President and CEO Joe Kaeser, CFO Q1 FY 11 Analyst call January 25, 2011 Copyright Siemens AG 2011. All rights reserved. Safe Harbour Statement This
Q Earnings Presentation. Rainer Beaujean, Speaker of the Management Board and CFO April 12, 2018
 Q1 2018 Earnings Presentation Rainer Beaujean, Speaker of the Management Board and CFO April 12, 2018 Disclaimer This presentation may contain certain forward-looking statements, including assumptions,
FUCHS GROUP. In Motion. Investor Presentation, September 2017 Dagmar Steinert, CFO Thomas Altmann, Head of Investor Relations
 FUCHS GROUP In Motion Investor Presentation, September 2017 Dagmar Steinert, CFO Thomas Altmann, Head of Investor Relations Agenda 01 02 The Leading Independent Lubricants Company H1 2017 03 Shares 04
July 26, 2017 LafargeHolcim Ltd 2015
 Second Quarter 2017 Results Beat Hess, Chairman and Interim CEO Roland Köhler, Interim COO and Regional Head of Europe, Australia/NZ & Trading Ron Wirahadiraksa, CFO July 26, 2017 LafargeHolcim Ltd 2015
FUCHS GROUP. In Motion. Investor Presentation, November 2017 Dagmar Steinert, CFO Thomas Altmann, Head of Investor Relations
 FUCHS GROUP In Motion Investor Presentation, November 2017 Dagmar Steinert, CFO Thomas Altmann, Head of Investor Relations Agenda 01 02 03 04 The Leading Independent Lubricants Company Q1-3 2017 Shares
Rieter - Investor Update 2017
 Rieter - Investor Update 2017 Baader Swiss Equities Conference January 2018 Rieter Group Key Messages Order intake up on previous year Third quarter with order growth in all business groups Rieter confirms
Kuehne + Nagel International AG
 Kuehne + Nagel International AG Analyst Conference Call 1 st Half-Year 2011 Results July 18, 2011 (CET 14.00) Schindellegi, Switzerland Agenda Welcome & Highlights 1st Half Year 2011 Gerard van Kesteren
Puma Energy : Fourth quarter & full year 2018 results Thursday 28 th March Puma Energy
 Puma Energy : Fourth quarter & full year 2018 results Thursday 28 th March 2019 Puma Energy The opportunity for Puma Energy Unique footprint, great people & strong business fundamentals in high potential
technicolor.com 7 JUNE 2018
 technicolor.com 7 JUNE 2018 COUNTRIES SITES REVENUES Connected Home 57% 57% 2017 2016 16% 1% 26% Production Services 18% DVD Services 24% North America 53% 2017 2016 25% 16% 52% 7% Europe, Middle-East
9M 2017 results innogy SE 13 November 2017 Bernhard Günther CFO
 9M 2017 results innogy SE 13 November 2017 Bernhard Günther CFO Notice This document contains forward-looking statements. These statements are based on the current views, expectations, assumptions and
ehi Car Services Limited 2016 fourth quarter and full year results
 ehi Car Services Limited 2016 fourth quarter and full year results March 23, 2017 Disclaimer Certain statements in this presentation are forward-looking statements, which are statements relating to future
Investor Call Results H1 2017
 Investor Call Results H1 2017 September 22nd, 2017 Michael Frick Corporate EVP and CFO Philipp Kuckuck VP Corporate Finance 1 Disclaimer This presentation was prepared with reasonable care. However, no
Hapag-Lloyd Analyst Event Financial Structure and Path to de-leveraging Hamburg, 21 November 2017
 Hapag-Lloyd Analyst Event Financial Structure and Path to de-leveraging Hamburg, 21 November 2017 Management summary Integration Financial Debt of UASC Strong Deleveraging Maintain Adequate Liquidity Reserve
H results. innogy SE 11 August 2017 Bernhard Günther CFO
 H1 2017 results innogy SE 11 August 2017 Bernhard Günther CFO Notice This document contains forward-looking statements. These statements are based on the current views, expectations, assumptions and information
Zumtobel Group AG FY 2014/15 results
 Zumtobel Group AG FY 2014/15 results June 24, 2015 1 24 June 2015 Annual Results 2014/15 Improvement in revenues and earnings, restructuring measures on track Financials FY 2014/15 at a glance Group revenues
Morgan Stanley Financial Services Conference
 Morgan Stanley Financial Services Conference Glenn Youngkin, Managing Director and Chief Operating Officer June 2012 Important Information This presentation has been prepared by The Carlyle Group L.P.
TI Fluid Systems plc Half Year Results Presentation for TI Fluid Systems plc. 8 August 2018
 2018 Half Year Results Presentation for 8 August 2018 Disclaimer This presentation contains certain forward-looking statements with respect to the financial condition, results of operations and business
FUCHS GROUP. In Motion. Investor Presentation, January 2018 Dagmar Steinert, CFO Thomas Altmann, Head of Investor Relations
 FUCHS GROUP In Motion Investor Presentation, January 2018 Dagmar Steinert, CFO Thomas Altmann, Head of Investor Relations Agenda 01 02 03 04 The Leading Independent Lubricants Company Q1-3 2017 Shares
FUCHS GROUP. Setting Standards - Worldwide
 FUCHS GROUP Setting Standards - Worldwide Commerzbank Sector Conference, 30 th August 2016, Frankfurt Dagmar Steinert, CFO Thomas Altmann, Investor Relations Agenda 01 The Leading Independent Lubricants
Scout24 AG FY 2016 Results Conference Call
 www.scout24.com Scout24 AG FY 2016 Results Conference Call March 29, 2017 Disclaimer This document has been issued by Scout24 AG (the Company and, together with its direct and indirect subsidiaries, the
Interim Report Q1 FY 18
 Interim Report Q1 FY 18 Quarter 1 / Fiscal Year 2018 Continued positive development extends into the new fiscal year Sivantos delivered 3.5% organic growth 1) in Q1 2018 with negative Fx translation effects
SEMPERIT GROUP Q INVESTOR PRESENTATION. Dr Martin Füllenbach, CEO Frank Gumbinger, CFO 25 May 2018
 SEMPERIT GROUP Q1 2018 INVESTOR PRESENTATION Dr Martin Füllenbach, CEO Frank Gumbinger, CFO 25 May 2018 1 Agenda State of restructuring (p. 3) Operational highlights (p. 7) Financial performance (p. 1
Announcement of Q Results
 Announcement of Q3 2008 Results Conference Call October 15, 2008 2:00 p.m. CEST Dr. Axel Herberg, CEO Hans-Jürgen Wiecha, CFO 0 Disclaimer This presentation may contain certain forward-looking statements,
Fixed Income Investor Presentation August 2016
 InterContinental O2, London Fixed Income Investor Presentation August 2016 Table of contents 1. Introduction to IHG p3 2. Our Strategy p7 3. Financial Performance p13 DISCLAIMER RECIPIENTS ATTENTION IS
Weʼ re ConnectingChemistry DELIVERING SERVICE EXCELLENCE
 Weʼ re ConnectingChemistry DELIVERING SERVICE EXCELLENCE INTERIM REPORT JANUARY SEPTEMBER 2017 KEY FINANCIAL FIGURES AT A GLANCE CONSOLIDATED INCOME STATEMENT Q3 2017 Q3 2016 Sales EUR m 2,892.5 2,619.2
PORR 1H 2014 Update Investor Presentation September 2014
 PORR 1H 2014 Update Investor Presentation September 2014 Disclaimer This presentation was prepared by PORR AG (the "Company") solely for use at investors meetings and is furnished to you solely for informational
CREATING VALUE GLOBAL THROUGH
 CREATING VALUE GLOBAL THROUGH REACH INTERIM REPORT JANUARY JUNE 2018 KEY FINANCIAL FIGURES AT A GLANCE CONSOLIDATED INCOME STATEMENT Q2 2018 Q2 2017 Sales EUR m 3,215.0 3,001.4 Operating gross profit EUR
PROTELINDO PT. SARANA MENARA NUSANTARA, Tbk. (TOWR) Indonesia s Premier Tower Company 2Q 2014 Results Presentation
 Indonesia s Premier Tower Company 2Q 2014 Results Presentation") PROTELINDO PT. SARANA MENARA NUSANTARA, Tbk. (TOWR) Indonesia s Premier Tower Company 2Q 2014 Results Presentation Disclaimer These materials have been prepared by PT Sarana Menara Nusantara, Tbk. (the
PROTELINDO PT. SARANA MENARA NUSANTARA, Tbk. (TOWR) Indonesia s Premier Tower Company 2Q 2014 Results Presentation Disclaimer These materials have been prepared by PT Sarana Menara Nusantara, Tbk. (the
Corral Q August 2017
 Corral Q2 2017 August 2017 Disclaimer This presentation has been prepared by Corral Petroleum Holdings AB (publ) and/or its subsidiaries and affiliates ( Corral ). The information contained in this presentation
KION UPDATE CALL Q Gordon Riske, CEO Thomas Toepfer, CFO Wiesbaden, 7 May 2015
 KION UPDATE CALL 2015 Gordon Riske, CEO Thomas Toepfer, CFO Wiesbaden, 7 May 2015 AGENDA 1 Highlights Gordon Riske 2 Market update Gordon Riske 3 Financial update Thomas Toepfer 4 Outlook Gordon Riske
Full-year 2008 Results. February 19, 2009
 Full-year 2008 Results February 19, 2009 Disclaimer All forward-looking statements are Schneider Electric management s present expectations of future events and are subject to a number of factors and uncertainties
t e c h n i c o l o r. c o m
 2017 t e c h n i c o l o r. c o m Forward looking statements THIS PRESENTATION contains certain statements that constitute "forward-looking statements", including but not limited to statements that are
SEMPERIT GROUP H1 2018/Q INVESTOR PRESENTATION. Dr Martin Füllenbach, CEO Frank Gumbinger, CFO 23 August 2018
 SEMPERIT GROUP H1 2018/Q2 2018 INVESTOR PRESENTATION Dr Martin Füllenbach, CEO Frank Gumbinger, CFO 23 August 2018 Agenda Business and transformation update (p. 3) Operational highlights (p. 7) Financial
Siltronic AG Preliminary Financial Figures FY February 1, 2018
 Siltronic AG Preliminary Financial Figures FY 2017 Siltronic AG 2018 Highlights 2017: Preliminary Financial Figures Sales EUR 1,177m (2016: EUR 933.4m) EBITDA EUR 353m (2016: EUR 146.0m) EBITDA margin
Zumtobel Group AG H1 2018/19. 4 December 2018
 Zumtobel Group AG H1 2018/19 4 December 2018 Improvement of profitability despite challenging market environment Financials H1 2018/19 at a glance Group revenues 4.7% below prior year, UK (minus 15%) and
New York Presentation
 September 2017 New York Presentation Tanja Nagel / IR Florian Fuchs / IR Disclaimer This document has been prepared by Fraport solely for use in this presentation. The information contained in this document
February 27, technicolor.com
 February 27, 2019 technicolor.com contains certain statements that constitute "forward-looking statements", including but not limited to statements that are predictions of or indicate future events, trends,
Siemens Gamesa Renewable Energy Q Results
 Siemens Gamesa Renewable Energy Q2 208 Results 04 May 208 Disclaimer This material has been prepared by Siemens Gamesa Renewable Energy, and is disclosed solely for information purposes. This document
KION GROUP AG Q Update Call. Gordon Riske (CEO), Anke Groth (CFO) Frankfurt, 26 July 2018
, Anke Groth (CFO) Frankfurt, 26 July 2018") KION GROUP AG Q2 Update Call Gordon Riske (CEO), Anke Groth (CFO) Frankfurt, 26 July Agenda 1. Highlights 2. Market Update 3. Financial Update 4. Outlook 2 KION GROUP AG Q2 Update Call 26 July Q2 Strategic
KION GROUP AG Q2 Update Call Gordon Riske (CEO), Anke Groth (CFO) Frankfurt, 26 July Agenda 1. Highlights 2. Market Update 3. Financial Update 4. Outlook 2 KION GROUP AG Q2 Update Call 26 July Q2 Strategic
Interim Report Q2 FY 18
 Interim Report Q2 FY 18 Quarter 2 / Fiscal Year 2018 Strong revenue growth driven by Signia Nx Sivantos delivered a strong organic growth 1) of 9.8% in Q2 2018 while nominal growth at 3.6% accounted negative
Interim Report 6m Investors and Analysts Conference Call on August 13, 2009 Herbert Bodner, CEO
 Interim Report 6m 2009 Investors and Analysts Conference Call on August 13, 2009 Herbert Bodner, CEO 6m 2009: Highlights Growth in output volume and orders received Strong increase in earnings Solid financial
Mobile Bank. Countries. Year-on-year profit growth. Frankfurt Prime Standard
 2 Consumer loans Business loans Mobile Bank years of profitable growth Active & former customers Countries Q1 2018 revenue Year-on-year revenue growth Year-on-year profit growth Founded Helsinki 2005 EU
Interim Report Q4 FY 17
 Interim Report Q4 FY 17 Quarter 4 / Fiscal Year 2017 Sustained positive development Sivantos delivered 3.1% organic growth 1) in Q4 FY2017. The moderate growth rate compared to previous quarters was a
HELLA Investor Update May 2017
 HELLA Investor Update May 2017 HF-7761EN_C (2013-01) Disclaimer This document was prepared with reasonable care. However, no responsibility can be assumed for the correctness of the provided information.
2008 Annual Shareholders Meeting Dürr Aktiengesellschaft
 2008 Annual Shareholders Meeting Dürr Aktiengesellschaft Stuttgart, May 2, 2008 Report of the Board of Management Agenda Business development 2007 and Q1 2008 Dürr-Campus Dürr 2010 strategy and mid-term
Capital Market Press Conference 2013 / Frankfurt, 5 December 2013
 Capital Market Press Conference 2013 / 2014 Frankfurt, 5 December 2013 Key financial figures of KfW Group (IFRS) 2013: Solid business performance, decreasing profit, very sound capital basis 2011 2012
Oerlikon reports strong operating performance in Q2 2012
 Oerlikon reports strong operating performance in Q2 2012 Investor Presentation Oerlikon Q2 and H1 Results 2012 September 2012 Agenda 1 Business Overview 2 Business Update and Financials Q2 2012 / H1 2012
Wind Tre First Half 2018 Results. 1 August 2018
 Wind Tre First Half 2018 Results 1 August 2018 H1 2018 highlights External environment Market Persistent and intense competition in both mobile and fixed markets Pricing pressure led by new entrant, main
Debt Investor Update Call. E.ON Cleaner & better energy. Dr. Marcus Schenck, CFO 24 November 2011
 Debt Investor Update Call E.ON Cleaner & better energy Dr. Marcus Schenck, CFO 24 November 2011 Agenda Update on strategy & operations Financial highlights 2 E.ON s strategy to address key challenges Investor
Interim Report 9m Investors and Analysts Conference Call on November 10, 2009 Herbert Bodner, CEO
 Interim Report 9m 2009 Investors and Analysts Conference Call on November 10, 2009 Herbert Bodner, CEO 9m 2009: Highlights Increased earnings in services business Risk provision in Civil Outlook confirmed
Investor Update Investor presentation, October 27, Dr. Norbert Klapper, Group CEO. Joris. Gröflin,.. Group. CFO...
 Investor Update 2017 Investor presentation, October 27, 2017 Dr. Norbert Klapper, Group CEO. Joris. Gröflin,.. Group. CFO Rieter Group Key Messages Order intake up on previous year Third quarter with order
Siltronic Full Year Results March 5, 2018
 Siltronic AG 2018 Financial year 2017: Highlights Sales EUR 1,177.3m (2016: EUR 933.4m) EBITDA EUR 353.1m (2016: EUR 146.0m) EBITDA margin 30.0% (2016: 15.6%) EBIT & EBIT margin EUR 235.7m (2016: EUR 27.0m)
Annual General Meeting Fiscal Year 2012
 Annual General Meeting Fiscal Year 2012 Oberhausen, April 18, 2013 Check against delivery. GEA Group Aktiengesellschaft Niels Graugaard Member of the Executive Board since August 1, 2007 Previously, President
Zumtobel Group AG Q1 2017/ September 2017
 Zumtobel Group AG Q1 2017/18 05 September 2017 Despite stalling growth momentum Group adj. EBIT only slightly below prior year Financials Q1 FY 2017/18 at a glance Group revenues fx-adjusted 0.7% below
Siltronic AG Roadshow Presentation. January, 2018
 Siltronic AG Roadshow Presentation MARKET OVERVIEW & CAPEX STRATEGY Capabilities, automation and incremental invest to keep stable market share without providing excess capacity to the market.. Increasing
FUCHS PETROLUB SE. manufacturer of the world. Dr. Alexander Selent, Vice Chairman & CFO. April 2015
 The leading independent lubricants manufacturer of the world Dr. Alexander Selent, Vice Chairman & CFO DagmarSteinert Steinert, Headof Investor Relations April 2015 The leading independent lubricants manufacturer