Annual General Meeting Fiscal Year 2012
|
|
|
- Gerald Kelly
- 5 years ago
- Views:
Transcription

1 Annual General Meeting Fiscal Year 2012 Oberhausen, April 18, 2013 Check against delivery. GEA Group Aktiengesellschaft

2 Niels Graugaard Member of the Executive Board since August 1, 2007 Previously, President of the former GEA Process Engineering Division since Annual General Meeting Fiscal Year 2012
3 Performance of GEA Group 3 Annual General Meeting Fiscal Year 2012
4 Highlights GEA Group 2012 Operating Results Risk management Forward-looking Record order intake: EUR 5.9 billion Record revenue: EUR 5.7 billion Operating cash flow: EUR 286 million Net debt reduced by EUR 61 million Acquisitions - Aseptomag and Milfos Conclusion of award proceedings that started in 1999 & ensuing capital increase Final agreement with the buyer of Lurgi Rollout of important new innovations Winner of various innovation awards 4 Annual General Meeting Fiscal Year 2012
5 Segment highlights GEA Food Solutions New management Working Capital Improvement in 2012 Rollout of important innovations Decision in favor of major investments, incl. R&D projects GEA Farm Technologies 2 award-winning innovations at the EuroTier trade fair New record levels in terms of order intake and revenue Strong EBIT margin improvement Highest ROCE since record year 2008 GEA Heat Exchangers Reorganization measures are visibly bearing fruit EBIT margin rose from 7.5% to 8.4% despite the slight decline in revenue and the difficult situation in the energy end market which remains difficult Reduction in absolute working capital 5 Annual General Meeting Fiscal Year 2012
6 Segment highlights GEA Mechanical Equipment Plant at the new production site in Oelde started operations Preparation of production in China Innovation award at the ACHEMA 2012 for new ecoforce line decanter New record EBIT margin of 20.2% GEA Process Engineering Order for world s largest spray dryer (will process more than 4.4 million liters of milk per day) New record order intake, revenue and EBIT margin (9.5%) ROCE at 55.9% GEA Refrigeration Technologies Strong organic growth in terms of order intake New record EBIT margin (8.1%) New record ROCE of 21.2% 6 Annual General Meeting Fiscal Year 2012


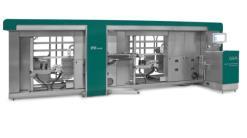
7 GEA builds milk powder plant for Fonterra in New Zealand Order volume exceeding EUR 70 million Only utilization of GEA process technology to cover milk reception, standardization, evaporation, drying, powder transport and packaging Capacity of 30 tons of whole milk powder per hour = more than 4.4. million liters of milk per day Seventh greenfield plant in New Zealand supplied by GEA over the past five years 7 Annual General Meeting Fiscal Year 2012
8 Segment highlights GEA Mechanical Equipment Plant at the new production site in Oelde started operations Preparation of production in China Innovation award at the ACHEMA 2012 for new ecoforce line decanter New record EBIT margin of 20.2% GEA Process Engineering Order for world s largest spray dryer (will process more than 4.4 million liters of milk per day) New record order intake, revenue and EBIT margin (9.5%) ROCE at 55.9% GEA Refrigeration Technologies Strong organic growth in terms of order intake New record EBIT margin (8.1%) New record ROCE of 21.2% 8 Annual General Meeting Fiscal Year 2012

9 Order intake 2012 (EUR million) +5% 5, % +11% 5, GEA Food Solutions GEA Farm Technologies 1,653-9% 1,510 GEA Heat Exchangers % 972 GEA Mechanical Equipment 1,710 +8% 1,850 GEA Process Engineering +16% GEA Refrigeration Technologies 9 Annual General Meeting Fiscal Year 2012


10 Order intake by customer industry Other end markets 30% 6% 3% 4% 25% Food & Beverages 55% Dairy Beverages Solid food 11% 6% 6% Order intake 2012 EUR 5,901 million + 5% 11% Power Oil & Gas Climate & Environment Chemical 15% 8% 19% Pharma Marine Energy Others 10 Annual General Meeting Fiscal Year 2012

11 Revenue 2012 (EUR million) +6% 5, % +14% 5, GEA Food Solutions GEA Farm Technologies 1,617 0% 1,609 GEA Heat Exchangers % 934 GEA Mechanical Equipment +9% 1,577 1,716 +7% GEA Process Engineering GEA Refrigeration Technologies 11 Annual General Meeting Fiscal Year 2012


")

 abs.")


 abs.")
 * Dow Jones")
12 Revenue by region 2012 (2011) Latin America abs.: +7% Eastern Europe & CIS abs.: +2% Africa abs.: +2% 10% (10%) 7% (7%) Middle East abs.: -4% 5% (5%) 5% (5%) 2012: EUR 5,720 million + 6% 35% (37%) Western Europe abs.: -1% Top 3 Countries USA 14% (12%) abs.: +24% Germany 10% (11%) abs.: -5% China 10% (11%) abs.: -2% North America abs.: +22% 15% (13%) 23% (22%) Asia/Pacific abs.: +11% Emerging markets* exposure: 33% (34%) abs.: +2% (average of Dow Jones and MSCI definition*) * Dow Jones Emerging Markets Index consists of 35 countries whereof 20 are GEA relevant; MSCI defines 21 countries as emerging markets whereof 17 are GEA relevant 12 Annual General Meeting Fiscal Year 2012
13 Service business Growth in service sales FY 2012: +14% to a total of EUR million Share of service sales FY 2012: 21.3% (FY 2011: 19.7%) +14% +14% % +14% -2% % % % 33% % % 28% 20% 11% 13% 13% 14% 30% 38% 22% 24% GEA Group GEA FS* GEA FT GEA HX GEA ME GEA PE GEA RT (EUR million) % Service business as % of revenue * Calculated without one-time POC-related accounting adjustments of EUR 42m (in the denominator) 13 Annual General Meeting Fiscal Year 2012
14 Operating EBIT* (before PPA and non-recurring items) (EUR million) +7% % +11% +16% +10% % GEA Food Solutions GEA Farm Technologies GEA Heat Exchangers GEA Mechanical Equipment GEA Process Engineering GEA Refrigeration Technologies * Before effects of purchase price allocations (PPA) from revalued assets and liabilities (EUR 40 million) and, in 2012, before non-recurring items from GEA Food Solutions (EUR 66.5 million). 14 Annual General Meeting Fiscal Year 2012

15 Focus on operating EBIT margin improvement (EUR million) 7, , , , % 6.9% 8.3% 9.9% 7.8% 8.3% 9.7% 10.0% % 10.7% 9.8% 10% 332 8% 6% 3, , ,059 3,391 4,346 4,856 5,179 4,411 4,418 5,071 5,388 4% 1, % 2% % 15 Revenue w/o GEA FS EBIT margin w/o GEA FS bef. PPA. and restr. Annual General Meeting Fiscal Year 2012 Revenue GEA FS EBIT margin incl. GEA FS bef. PPA., restr. and one-offs GEA FS
) 16 Annual General Meeting Fiscal Year")
16 Earnings per share (EUR) % increase in average number of GEA shares due to award proceedings : : 183.8m shares 2012: 185.8m shares Proposed dividend: 0.55 EUR per share (paid from the tax contribution account (section 27 of the Körperschaftsteuergesetz (KStG German Corporate Income Tax Act)) 16 Annual General Meeting Fiscal Year 2012
17 Further reduction in net debt (EUR million) Net debt (as of December 31, 2011) EBITDA Working Capital 61.4 Capex Operating cash flow Interests/Taxes Other Net debt before M&A, dividend and one-offs Cash out restructuring Discontinued operations Effect from acquisitions Dividend Net debt (as of December 31, 2012) Annual General Meeting Fiscal Year 2012
18 Development of cash flow drivers (EUR million) Jan 12 Feb 12 Mar 12 Apr 12 May 12 Jun 12 Jul 12 Aug 12 Sep 12 Oct 12 Nov 12 Dec 12 10% 9% 8% 7% 6% 5% 4% 3% 2% 1% 0% 18 Annual General Meeting Fiscal Year 2012 Cash flow drivers L12M Cash flow driver margin
 Latin America (3%) Eastern Europe &")
 Western Europe 14.837 14.974 2% Asia/Pacific 3.")
 61% Eastern Europe & CIS 1.")

 * Full-time equivalents (FTE)")
19 Worldwide employees* of GEA Group North America (10%) Asia/Pacific (14%) Latin America (3%) Eastern Europe & CIS (8%) 9% 16% Africa (2%) Middle East % (1%) Western Europe % Asia/Pacific % 3% North America Employees 2012 (2011) 61% Eastern Europe & CIS Latin America Africa Middle East Total Western Europe (62%) * Full-time equivalents (FTE) excluding vocational trainees and inactive employment contracts 19 Annual General Meeting Fiscal Year 2012


20 Worldwide employees of GEA Group 20 Annual General Meeting Fiscal Year 2012


21 Worldwide employees of GEA Group 21 Annual General Meeting Fiscal Year 2012


22 Worldwide employees of GEA Group 22 Annual General Meeting Fiscal Year 2012

23 Overview consolidated balance sheet Assets (EUR million) Goodwill 1, ,846.1 Property, plant, and equipment Other noncurrent assets Noncurrent assets 3, ,480.0 Cash and cash equivalents Other current assets 2, ,187.5 Current assets 2, ,931.0 Assets held for sale Total assets 6, ,429.5 Equity and liabilities Equity 2, ,166.3 Noncurrent liabilities 1, ,003.4 Current liabilities 2, ,259.8 Total equity and liabilities 6, , Annual General Meeting Fiscal Year 2012 Rise in cash and cash equivalents relating to the increase in borrowing Equity ratio decreased from 34.8% to 33.7%
24 Sound financial position GEA cash credit lines (EUR million) Maturity 12/31/2012 committed 12/31/2012 used 12/31/2011 unused Total cash credit lines (incl. bilateral) 1,846 1, of which: Borrower s loan note 08/ Syndicated credit line 06/ Bond 04/ KfW I Amortization loan KfW II Amortization loan 05/ / European Investment Bank 07/ Borrower s loan note (New) 09/ Annual General Meeting Fiscal Year 2012

25 Financial liabilities - Cash credit lines (EUR million) , , , , , , Cash credit lines per 12/31/ Successful placement of a borrower s loan note of EUR 300 million with a maturity of five years in September 2012 leading to the further optimization of GEA Group s financing structure Extension of the maturity profile of GEA Group s financial liabilities GEA s financial liabilities will not become due before 2016 more than 80 percent of 25 Annual General Meeting Fiscal Year 2012
26 Credit rating Agency Rating Outlook Rating Outlook Moody s Baa3 stable Baa3 stable Fitch BBB- stable BBB- stable 26 Annual General Meeting Fiscal Year 2012
27 GEA share price performance 160% GEA Group MDAX STOXX Europe TMI Industrial Engineering 140% 120% 100% 80% 60% Jan Feb Mar Apr May Jun Jul Aug Sep Oct Nov Dec Jan Feb Mar Settlement of award proceedings Dairy technology prize at ANUGA FoodTec Acquisition of Aseptomag Innovation award at ACHEMA Borrower s loan note of EUR 300 million Innovation awards at EuroTier Acquisition of Milfos Release of preliminary key figures for FY Annual General Meeting Fiscal Year 2012
28 Conclusion of award proceedings Tranche Issuance Amount 1 July 16, ,093,945 shares 2 September 3, ,967,361 shares 3 December 3, ,626,325 shares Total 8,687,631 shares April 24, 2012 AGM approval of capital increase Issuance of about 8.7 million new shares Subscribed capital increased by around EUR 23.5 million (4.7%) December 31, 2012: 192,495,476 no-par value bearer shares 28 Annual General Meeting Fiscal Year 2012
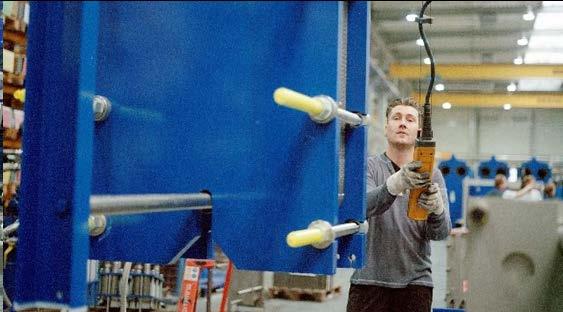
29 Technology leadership and innovation 29 Annual General Meeting Fiscal Year 2012


30 Innovation culture at GEA engineering for a better world 30 Annual General Meeting Fiscal Year 2012
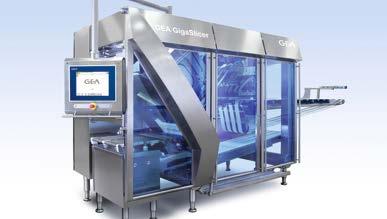
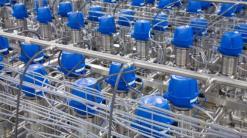
31 GEA innovation 2012 double-seat 24/7 PMO Valve 24/7 PMO Valve 24/7 PMO Valve % less cleaning losses 40% less weight First supplier with authorization of U.S. Food and Drug Administration Cleaning during simultaneous operation 31 Annual General Meeting Fiscal Year 2012

32 GEA innovation 2013 tablet manufacturing facility Precision dosing of powdery substances Continuous and thorough blending Online measurement of homogeneity and concentration of active ingredients Final compression of the tablet 32 Annual General Meeting Fiscal Year 2012


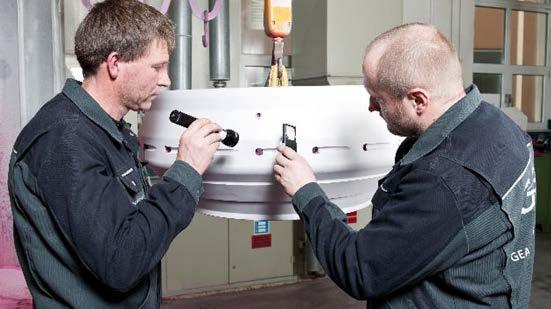
33 GEA is a leading driver of innovation 33 Annual General Meeting Fiscal Year 2012


34 GEA will continue to attend leading international trade fairs in Annual General Meeting Fiscal Year 2012
35 Outlook 35 Annual General Meeting Fiscal Year 2012
36 1st Quarter 2012 preliminary order intake (EUR million) Of which more than EUR 70 million from the major order for a milk powder plant in New Zealand booked in Q ,545 1,447 Q Currency Effects Structural Change Organic Development Q Hauptversammlung Geschäftsjahr 2012
 Revenue 37 Annual General Meeting Fiscal Year")
37 Outlook for fiscal year 2013 Assuming worldwide sustainable economic growth, we seek to achieve the following targets in fiscal year 2013: Cash flow driver margin: at least 8% Revenue: moderate growth EBITDA: around EUR 700 million Calculation Cash Flow Driver Margin: EBITDA Capex +/- Working Capital (LTM) Revenue 37 Annual General Meeting Fiscal Year 2012
38 Financial Calendar 2013 May 8, 2013 July 30, 2013 October 31, 2013 Interim Report Q1 Interim Report Q2 Interim Report Q3 38 Annual General Meeting Fiscal Year 2012
39 Disclaimer Forward-looking statements are based on our current assumptions and forecasts. These statements naturally entail risks and uncertainties, which may cause the actual results of operations, financial position or performance to diverge significantly from the estimates given here. Factors that could cause such a divergence include changes in the economic and business environment, fluctuations in exchange rates and interest rates, launches of competing products, poor acceptance of new products or services, and changes in business strategy. We are under no obligation to update forward-looking statements. 39 Annual General Meeting Fiscal Year 2012

40
Annual General Meeting Fiscal Year 2013
 Annual General Meeting Fiscal Year 2013 Oberhausen, April 16, 2014 Check against delivery. GEA Group Aktiengesellschaft Performance of GEA Group 2 Annual General Meeting Fiscal Year 2013 Highlights of
Annual General Meeting Fiscal Year 2016
 Annual General Meeting Fiscal Year 2016 Oberhausen, Germany, JÜRG OLEAS, CEO CHECK AGAINST DELIVERY. Agenda 1 Fiscal Year 2016 2 Focus on the Future 3 Outlook for Fiscal Year 2017 2 Order intake* (EUR
GEA announces figures for the third quarter
 Quarterly Statement July 1 to September 30, GEA announces figures for the third quarter GEA s order intake in the third quarter of was EUR 1,084 million. The development was impacted by delays in the awarding
Annual Report engineering for a better world
 Annual Report 2012 engineering for a better world GEA Group: Key IFRS figures All figures as of the reporting dates from 2011 onwards include the acquisitions of CFS and Bock. The figures for the reporting
Interim Results 9-month figures FY 11
 Interim Results 9-month figures FY 11 Bernhard Schreier, CEO Dirk Kaliebe, CFO Robin Karpp, Head of Investor Relations Heidelberger Druckmaschinen AG February 09, 2011 Highlights FY 11 Order intake increased
FULL YEAR REPORT, 2017 TELEPHONE/AUDIO CONFERENCE 8 FEBRUARY 2018, AT CET TOMMY ANDERSSON, PRESIDENT AND CEO HELENA WENNERSTRÖM, EVP AND CFO
 TELEPHONE/AUDIO CONFERENCE 8 FEBRUARY 2018, AT 15.30 CET TOMMY ANDERSSON, PRESIDENT AND CEO HELENA WENNERSTRÖM, EVP AND CFO DIRECT LINK AUDIOCAST: HTTPS://TV.STREAMFABRIKEN.COM/BULTEN Q4 2017 TELECONFERENCE:
FY 2017 Presentation
 FY 2017 Presentation 1 2 At a glance Overview FY 2017 YoY revenue growth of 2.2% to EUR 82.5 mn (FY 2016: EUR 80.7 mn) in a challenging year after 13.5% decline at the end of H1/17 (compared YoY) New order
Annual General Meeting Print is more. Dr. Gerold Linzbach, CEO
 Annual General Meeting 2013 Print is more. Dr. Gerold Linzbach, CEO Heidelberger Druckmaschinen AG, July 23, 2013 Agenda 1. Where are we coming from? 2. Where are we today? 3. Where do we want to go? 2
Huhtamaki roadshow presentation. Investor Relations Q1 2009
 Huhtamaki roadshow presentation Investor Relations 2009 Huhtamaki in brief A leading manufacturer of consumer and specialty packaging with head office in Espoo, Finland Net sales EUR 2.3 billion in 65
GEA announces figures for the first quarter
 Quarterly Statement January 1 to March 31, GEA announces figures for the first quarter Thanks to robust growth in small and mid-sized orders, GEA s order intake in the first quarter of almost matched the
Analyst Presentation Q May 8, 2014 Dr Matthias Zieschang, CFO
 Analyst Presentation Q1 2014 May 8, 2014 Dr Matthias Zieschang, CFO Slide 2 Disclaimer This document has been prepared by Fraport solely for use in this presentation. The information contained in this
RHI Group >> Quarterly Report III/2006
 RHI Group >> Key Figures RHI Group Q1 - Q3 Change in million 2006 2005 in % Revenue 998.6 893.9 11.7 EBITDA 130.5 108.1 20.7 EBITDA margin 13.1% 12.1% 8.1 EBIT 97.5 78.3 24.5 EBIT margin 9.8% 8.8% 11.5
Analystsʼ Conference 2017
 Analystsʼ Conference 2017 Metzingen March 9, 2017 Mark Langer Ingo Wilts Bernd Hake Chief Executive Officer Chief Brand Officer Chief Sales Officer HUGO BOSS Analysts' Conference 2017 HUGO BOSS March 9,
Siemens Gamesa Renewable Energy Q3 18 Results
 Siemens Gamesa Renewable Energy Q3 18 Results 27 July 2018 Disclaimer This material has been prepared by Siemens Gamesa Renewable Energy, and is disclosed solely for information purposes. This document
euromicron AG 2006 EUR m EUR m.
 Condensed Annual Report 2007 euromicron Group Key Figures as of December 31, 2007 2007 EUR m. 2006 EUR m. EBIT (consolidated) 12.0 7.7 EBIT (operating) 16.3 * 12.9 * EBITDA 15.2 9.6 Income before income
NKT Holding. Interim Report Q Audiocast presentation 8 November 2012 at 10:00 am CET
 NKT Holding Interim Report Q3 2012 Audiocast presentation 8 November 2012 at 10:00 am CET Agenda Page Page 2 2 NKT Group Highlights Q3 2012 Financial results Q3 2012 Companies NKT Cables Nilfisk-Advance
Interim Report Q4 FY 17
 Interim Report Q4 FY 17 Quarter 4 / Fiscal Year 2017 Sustained positive development Sivantos delivered 3.1% organic growth 1) in Q4 FY2017. The moderate growth rate compared to previous quarters was a
Siemens Gamesa Renewable Energy Q Results
 Siemens Gamesa Renewable Energy Q2 208 Results 04 May 208 Disclaimer This material has been prepared by Siemens Gamesa Renewable Energy, and is disclosed solely for information purposes. This document
ANNOUNCEMENT OF PRELIMINARY RESULTS
 The leading high service distributor to engineers worldwide ANNOUNCEMENT OF PRELIMINARY RESULTS YEAR ENDED 31 MARCH 2009 29 May 2009 Agenda Overview and current trading Ian Mason Financial performance
Huhtamaki roadshow presentation. Investor Relations Copenhagen Jan 8, 2010
 Huhtamaki roadshow presentation Investor Relations Copenhagen Jan 8, 2010 Huhtamaki in brief A leading manufacturer of consumer and specialty packaging with head office in Espoo, Finland Net sales EUR
Interim Report. First Quarter of Fiscal siemens.com. Energy efficiency. Intelligent infrastructure solutions. Next-generation healthcare
 Energy efficiency Next-generation healthcare Industrial productivity Intelligent infrastructure solutions Interim Report First Quarter of Fiscal 2014 siemens.com Key to references REFERENCE WITHIN THE
Improved margin and cash flow in Q1 2013
 2013-06-04 BofA Merrill Lynch Global Telecom & Media conference June 4, 2013 Per-Arne Blomquist President and CEO 1 Improved margin and cash flow in Q1 2013 Revenue growth impacted by reduced mobile interconnect
Alfa Laval 04/02/2009
 Alfa Laval 04/02/2009 Report for Q4 and full year 2008 - Orders received and margins - Highlights - Development per segment - Geographical development - Financials - Outlook Mr. Lars Renström President
Financial & Business Highlights For the Year Ended June 30, 2017
 Financial & Business Highlights For the Year Ended June, 17 17 16 15 14 13 12 Profit and Loss Account Operating Revenue 858 590 648 415 172 174 Investment gains net 5 162 909 825 322 516 Other 262 146
Fiscal year 2011 off to a strong start
 Fiscal year 2011 off to a strong start Peter Löscher, President and CEO Joe Kaeser, CFO Q1 FY 11 Analyst call January 25, 2011 Copyright Siemens AG 2011. All rights reserved. Safe Harbour Statement This
REPORT FOR THE FIRST THREE QUARTERS MAYR-MELNHOF KARTON AG
 1 3Q REPORT FOR THE FIRST THREE QUARTERS MAYR-MELNHOF KARTON AG Results close to last year s high level Solid sales and volumes Acquisition of cosmetics packaging site in Poland Expectations for intact
Results FY 2017 Schaeffler AG. Conference Call March 7, 2018 Munich
 Results FY 2017 Schaeffler AG Conference Call Munich Disclaimer This presentation contains forward-looking statements. The words "anticipate", "assume", "believe", "estimate", "expect", "intend", "may",
Digital in the box. Interim statement Q / 2018
 Digital in the box. Interim statement 2017 / 2018 Heidelberg Group INTERIM STATEMENT FOR THE FIRST QUARTER OF 2017/2018 Figures Incoming orders total 629 million Net sales up year-on-year at 495 million
Year-end Report January-December, 2012
 Year-end Report January-December, 20 Lars Nyberg President and CEO Record-high Free cash flow during 20 Net sales SEK 4,898 million (4,804) Increased 1.2% in local currencies EBITDA* SEK 36,059 million
Singapore Exchange Limited Building Tomorrow s Market, Today
 Singapore Exchange Limited Building Tomorrow s Market, Today Singapore Exchange SGX: Building Tomorrow s Market, Today SGX: Our Fundamentals FY2002 Half Year Results Going Forward SGX: Building Tomorrow
XML Publisher Balance Sheet Vision Operations (USA) Feb-02
 Feb-02") Page:1 Apr-01 May-01 Jun-01 Jul-01 ASSETS Current Assets Cash and Short Term Investments 15,862,304 51,998,607 9,198,226 Accounts Receivable - Net of Allowance 2,560,786
Page:1 Apr-01 May-01 Jun-01 Jul-01 ASSETS Current Assets Cash and Short Term Investments 15,862,304 51,998,607 9,198,226 Accounts Receivable - Net of Allowance 2,560,786
Allianz Group Fiscal Year 2012
 Allianz Group Fiscal Year 2012 Michael Diekmann CEO Allianz SE Financial press conference February 21, 2013 Based on preliminary figures Overview 2012 EUR 106.4bn Total revenues EUR 9.5bn Operating profit
Availability, Reliability, Ease. 11 September 2018
 Availability, Reliability, Ease 11 September 2018 LEGAL NOTICE This presentation has been prepared to inform investors and prospective investors in the secondary markets about the Group and does not constitute
Annual Shareholder Meeting. Joachim Kreuzburg Chairman of the Board and CEO 03. April 2018
 Annual Shareholder Meeting Joachim Kreuzburg Chairman of the Board and CEO 03. April 2018 Disclaimer This presentation contains statements concerning Sartorius Stedim Biotech Group s future performance.
April 6, Roadshow Luxembourg. Tanja Nagel / IR Florian Fuchs / IR
 April 6, 2018 Roadshow Luxembourg Tanja Nagel / IR Florian Fuchs / IR Disclaimer This document has been prepared by Fraport solely for use in this presentation. The information contained in this document
Media and Financial Analysts Meeting 2017 Carlo Gavazzi Holding AG
 Media and Financial Analysts Meeting 2017 Carlo Gavazzi Holding AG Media and Financial Analysts Meeting 2017 June 22, 2017 Media and Financial Analysts Meeting 2017 AGENDA FOR TODAY WELCOME & OVERVIEW
Interim Report Best ever half-year results. Scheduled downtime adjusted cartonboard production to decrease in market demand
 Interim Report 2001 Best ever half-year results Scheduled downtime adjusted cartonboard production to decrease in market demand Satisfactory capacity utilization in the Packaging Division Demand in Q3
Financial Results H1/2013
 Financial Results H1/ August 6, SHW AG pleasing Q2 results Highlights Q2/ Group sales*: 91.8m (+7.3%) Adj. EBITDA*: 11.0m (+17.1%) Adj. EBIT*: 7.7m (+19.4%) Net income from continued operations*: 4.7m
Interim Results 2019 March 2019
 Interim Results 2019 March 2019 Disclaimer This presentation may contain forward-looking statements and projections. There can be no certainty of outcome in relation to the matters to which the forward-looking
Q Results. Strong start in May 3, 2016
 Q1 2016 Results Strong start in 2016 May 3, 2016 Legal Disclaimer Information in this presentation may involve guidance, expectations, beliefs, plans, intentions or strategies regarding the future. These
ANNUAL PRESS CONFERENCE FOR 2015
 CREATING TOMORROW S SOLUTIONS ANNUAL PRESS CONFERENCE FOR 215 Dr. Rudolf Staudigl, President & CEO, March 17, 216 March 17, 216 Economic Output Increases across Every Region in 215 Worldwide GDP Trend
Conference Call FY 2017 Results. 08 March 2018
 Conference Call FY Results 08 March 2018 Disclaimer Forward-looking Statements This discussion may contain forward-looking statements about Linde and its businesses, including statements concerning its
Media and Financial Analysts Meeting 2018 Carlo Gavazzi Holding AG
 Media and Financial Analysts Meeting 2018 Carlo Gavazzi Holding AG Media and Financial Analysts Meeting 2018 June 28, 2018 Media and Financial Analysts Meeting 2018 AGENDA FOR TODAY WELCOME & OVERVIEW
HELLA Investor Update Q1 2015/16
 HELLA Investor Update Q1 2015/16 Conference Call on September 25th, 2015 Dr. Wolfgang Ollig, Chief Financial Officer Carl Pohlschmidt, Finance Director HF-7761DE_C (2012-12) Disclaimer This document was
Fourth Quarter 2016 Performance Summary
 Fourth Quarter 2016 Performance Summary Operational and Financial Highlights - 2016 Net profit rises by +2.5% to Euros 545.5 million Recurring sales (excluding Raw Materials and Others) rise by +4.5% (+4.6%
2008 Annual Shareholders Meeting Dürr Aktiengesellschaft
 2008 Annual Shareholders Meeting Dürr Aktiengesellschaft Stuttgart, May 2, 2008 Report of the Board of Management Agenda Business development 2007 and Q1 2008 Dürr-Campus Dürr 2010 strategy and mid-term
Capital Market Press Conference 2013 / Frankfurt, 5 December 2013
 Capital Market Press Conference 2013 / 2014 Frankfurt, 5 December 2013 Key financial figures of KfW Group (IFRS) 2013: Solid business performance, decreasing profit, very sound capital basis 2011 2012
Three-speed recovery. GDP growth. Percent Emerging and developing economies. World
 Three-speed recovery GDP growth Percent 1 8 6 4 2-2 -4-6 198 1985 199 1995 2 25 21 215 Source: IMF WEO; Milken Institute. Emerging and developing economies Advanced economies World Output is still below
Interim announcement 1st to 3rd quarter 2015
 Interim announcement 1st to 3rd quarter 2015 Danfoss at a glance Danfoss engineers technologies that enable the world of tomorrow to do more with less. We meet the growing need for infrastructure, food
Linde Group. Full Year Results 2005
 Full Year Results 2005 Disclaimer This presentation has been prepared independently by Linde AG ( Linde ). The presentation contains statements which address such key issues as Linde s growth strategy,
FY 2012 Financial Results. 28 February 2013
 FY 20 Financial Results 28 February 2013 1 Table of Contents I. Income Statement II. III. Assets & Restructuring Liabilities, Liquidity & Capitalisation 2 Highlights during 20 Many significant milestones
Kepler Cheuvreux European Infrastructure Tour September, Stefan J. Rüter Head of Finance & IR
 September, 2016 Stefan J. Rüter Head of Finance & IR 2 Disclaimer This document has been prepared by Fraport solely for use in this presentation. The information contained in this document has not been
FUCHS PETROLUB AG The leading independent lubricants manufacturer of the world
 The leading independent lubricants manufacturer of the world Dr. Alexander Selent, Vice Chairman & CFO Dagmar Steinert, Head of Investor Relations April 2013 FUCHS the leading independent lubricants manufacturer
Bertelsmann Interim Results 2015
 Bertelsmann Interim Results 2015 Investor Conference Call August 31, 2015 Roger Schweitzer, Executive Vice President Corporate Treasury and Finance of Bertelsmann Summary and highlights Interim Results
Financial Data Report ROGERS AND COMPANY LIMITED (THE GROUP) for the period ending 31.Dec.2017
 for the period ending 31.Dec.2017") Financial Data Report ROGERS AND COMPANY LIMITED (THE GROUP) for the period ending 31.Dec.2017 Equity Statistics Particulars Units 29-Dec-17 Current Market Price MUR 31.30 52 week H/L* MUR 33.00 / 27.00
Financial Data Report ROGERS AND COMPANY LIMITED (THE GROUP) for the period ending 31.Dec.2017 Equity Statistics Particulars Units 29-Dec-17 Current Market Price MUR 31.30 52 week H/L* MUR 33.00 / 27.00
FUCHS GROUP. Setting Standards - Worldwide
 FUCHS GROUP Setting Standards - Worldwide dbaccess German, Swiss & Austrian Conference, 8 th June 2016, Berlin Stefan Fuchs, CEO Thomas Altmann, Investor Relations Agenda 01 The Leading Independent Lubricants
1H 2016 EP Energy Results Call
 1H 2016 EP Energy Results Call Prague, August 26, 2016 Filip Bělák Chief Financial Officer of EP Energy, a.s. Disclaimer Forward-looking statements This Report contains forward-looking statements within
CREATING VALUE GLOBAL THROUGH
 CREATING VALUE GLOBAL THROUGH REACH INTERIM REPORT JANUARY JUNE 2018 KEY FINANCIAL FIGURES AT A GLANCE CONSOLIDATED INCOME STATEMENT Q2 2018 Q2 2017 Sales EUR m 3,215.0 3,001.4 Operating gross profit EUR
Interim Results 6-month figures FY 11
 Interim Results 6-month figures FY 11 Bernhard Schreier, CEO Dirk Kaliebe, CFO Andreas Trösch, Head of Investor Relations Heidelberger Druckmaschinen AG November 10, 2010 Highlights Q2 FY 11 650 million
Eng US. 9 February Q4 Presentation 2017
 Eng US 9 February 2018 Q4 Presentation 2017 Eng US Disclaimer This presentation has been prepared by Duni AB (the Company ) solely for use at this investor presentation and is furnished to you solely for
Interim Report Q3 2008
 Interim Report Q3 2008 - Orders received and margins - Highlights - Development per segment - Geographical development - Financials - Outlook Mr. Lars Renström President and CEO Alfa Laval Group Key figures
January March Conference Call. Georg Denoke Member of the Executive Board & CFO 4 May 2011
 January March 2011 Conference Call Georg Denoke Member of the Executive Board & CFO 4 May 2011 Disclaimer This presentation contains forward-looking statements about Linde AG ( Linde ) and their respective
Interim Report January September 2014
 Interim Report January September 2014 Johan Dennelind President & CEO Capital Markets Day summary 2018 2013 2014 2015 2016 2017 The New TeliaSonera Big changes Stabilize & shape Transform & perform Transform
FY 2014 Results Presentation. Uwe Röhrhoff, CEO Rainer Beaujean, CFO Duesseldorf, February 11, 2015
 FY 2014 Results Presentation Uwe Röhrhoff, CEO Rainer Beaujean, CFO Duesseldorf, February 11, 2015 Disclaimer 1. This presentation may contain certain forward-looking statements, including assumptions,
P R E S S R E L E A S E
 P R E S S R E L E A S E from ASSA ABLOY AB (publ) 27 April 2004 No. 5/04 ASSA ABLOY Q1: ORGANIC GROWTH AND IMPROVED MARGINS IN ALL DIVISIONS Sales in the first quarter increased organically by 3% to SEK
Interim Report January-June, 2014
 Interim Report January-June, 2014 Johan Dennelind President and CEO All regions contribute to stable margin Group service revenues flat - net sales negatively impacted by Spain Underlying EBITDA maintained
Bertelsmann Interim Results 2009 Investor Conference Call
 Bertelsmann Interim Results 2009 Investor Conference Call August 31, 2009 Dr. Thomas Rabe, Member of the Executive Board and Chief Financial Officer, Bertelsmann AG Highlights HY 2009 Solid performance
The Multi Service Group: Dedicated to creating value
 The Multi Service Group: Dedicated to creating value Roadshow Frankfurt, Dr. Jürgen M. Schneider, CFO Joachim Müller, Member of the Executive Board Bettina Schneider, Senior Manager Investor Relations
Statkraft Investor Update. March 2014
 Statkraft Investor Update March 2014 Disclaimer This presentation has been prepared by, and the information contained herein (unless otherwise indicated) has been provided by Statkraft AS (the "Company").
Looking to the medium term
 Looking to the medium term Issued: 4 September 2013 Legal notice This presentation has been prepared to inform investors and prospective investors in the secondary markets about the Group and does not
Klöckner & Co SE. Annual General Meeting Düsseldorf, May 16, 2018 Gisbert Rühl CEO
 Klöckner & Co SE Annual General Meeting 2018 Düsseldorf, May 16, 2018 Gisbert Rühl CEO 1 Disclaimer This presentation contains forward-looking statements which reflect the current views of the management
Q Earnings Presentation. Rainer Beaujean, Speaker of the Management Board and CFO April 12, 2018
 Q1 2018 Earnings Presentation Rainer Beaujean, Speaker of the Management Board and CFO April 12, 2018 Disclaimer This presentation may contain certain forward-looking statements, including assumptions,
November Roadshow London. Dr. Matthias Zieschang / CFO Tanja Nagel / IR. Fraport AG
 November 2017 Roadshow London Dr. Matthias Zieschang / CFO Tanja Nagel / IR Disclaimer This document has been prepared by Fraport solely for use in this presentation. The information contained in this
PUMA AG Rudolf Dassler Sport
 PUMA AG Rudolf Dassler Sport INTERIM REPORT 3 rd Quarter and First Nine Months of INTERIM REPORT 3 rd Quarter and First Nine Months of Highlights Q3: Another record quarter in sales and earnings Branded
Financial Year 2011 Results. Frankfurt. Schaeffler Group March 20, 2012
 Financial Year 2011 Results Schaeffler Group March 20, 2012 Frankfurt Page 1 Agenda Overview 2011 Results 2011 Senior Refinancing Outlook Page 2 1 Overview 2011 Targets overachieved Growth Profitability
Market and Economic Charts. Retail Fund Management Team Investec Asset Management
 Market and Economic Charts Retail Fund Management Team Investec Asset Management 30 April 2010 Looking at Markets Global SA Economics Major Index Performance Major Index Performance Market Drivers Inflation
Interim statement Q / Digital in the box.
 Interim statement Q3 2017 / 2018 Digital in the box. Heidelberg Group Interim statement for the third quarter of 2017 / 2018 Figures Incoming orders after nine months on par with previous year at 1,912
Cembrit Group Q Unaudited interim report
 Cembrit Group Q4 2017 Unaudited interim report 2017 main events COMMENTARY Strong demand across both markets and product categories resulted in revenue growth of 7.9% YoY 2017 EBITDA showed solid underlying
AUDITED RESULTS FOR THE YEAR ENDED 31 DECEMBER 2016
 AUDITED RESULTS FOR THE YEAR ENDED 31 DECEMBER 2016 AGENDA 2 1 Opening remarks / market update 2 Financial results 3 Operational review 4 Strategy update 5 Outlook 1 2 3 4 5 OPENING REMARKS / MARKET UPDATE
Financial Data Report ROGERS AND COMPANY LIMITED (THE GROUP) for the period ending 31.Dec.2015
 for the period ending 31.Dec.2015") Financial Data Report (THE GROUP) for the period ending 31.Dec.2015 INVESTMENT Equity Statistics Particulars Units 31-Mar-16 Current Market Price MUR 27.75 52 week H/L* MUR 32.50 / 26.90 Market Capitalisation
Financial Data Report (THE GROUP) for the period ending 31.Dec.2015 INVESTMENT Equity Statistics Particulars Units 31-Mar-16 Current Market Price MUR 27.75 52 week H/L* MUR 32.50 / 26.90 Market Capitalisation
Preliminary Figures FY February 2017 Ströer SE & Co. KGaA
 Preliminary Figures FY 2016 22 February 2017 Ströer SE & Co. KGaA Preliminary Results FY 2016 EURm FY 2016 Q4 2016 Revenues Reported (1) 1,123.3 +36% 357.6 +32% Organic (2) +7.2% +6.9% Operational EBITDA
Bilfinger Berger: Entering new growth phase
 Bilfinger Berger: Entering new growth phase Roadshow London, Roland Koch, CEO Andreas Müller, Head of Corporate Accounting and Investor Relations Agenda 1. Bilfinger Berger Overview 2. Preliminary figures
I N T E R I M R E P O R T 2nd Quarter 2001 M
 I N T E R I M R E P O R T M 2 nd quarter 2001 2 Organic growth, driven by the pharmaceuticals and laboratory distribution divisions, resulted in: Sales + 16 % to EUR 1,949 million. 2 Indicators of earnings
Q4 Presentation February, 2013
 Q4 Presentation 2012 14 February, 2013 Disclaimer This presentation has been prepared by Duni AB (the Company ) solely for use at this investor presentation and is furnished to you solely for your information
Interim Results 6-month figures FY 13
 Interim Results 6-month figures FY 13 Gerold Linzbach, CEO Dirk Kaliebe, CFO Robin Karpp, Head of IR HEIDELBERG, NOVEMBER 7TH, 2012 Review FY 2012/2013 Order intake of 668m in on par with previous year
PT Ultrajaya Milk Industry & Trading Company Tbk. FY 2013 results update
 PT Ultrajaya Milk Industry & Trading Company Tbk. FY 2013 results update April 2014 0 Disclaimer These materials are not intended to be a public offering document under Law of the Republic of Indonesia
Business Update. USPP Conference Miami. Luis Damasceno Group CFO Michael Williams Group Finance Director & Treasurer January 2019
 Business Update USPP Conference Miami Luis Damasceno Group CFO Michael Williams Group Finance Director & Treasurer 23-25 January 2019 www.alsglobal.com IMPORTANT NOTICE AND DISCLAIMER This presentation
NKT. Annual Report 2010 Live presentation 1 March 2011 at 11:00 am. NKT Holding A/S / IR presentation / Annual Report
 NKT Annual Report 2010 Live presentation 1 March 2011 at 11:00 am NKT Holding A/S / IR presentation / Annual Report 2010 1 Agenda NKT Group 2010 in headlines Expectations 2011 Financial results 2010 NKT
Availability, Reliability, Ease. 11 December 2018
 Availability, Reliability, Ease 11 December 2018 LEGAL NOTICE This presentation has been prepared to inform investors and prospective investors in the secondary markets about the Group and does not constitute
ANNUAL GENERAL MEETING METRO AG. 15 February 2019
 ANNUAL GENERAL MEETING METRO AG 15 February 2019 DISCLAIMER AND NOTES To the extent that statements in this presentation do not relate to historical or current facts, they constitute forward-looking statements.
Presentation to Investors. July 24, 2014, interim report as of June 30, 2014
 Presentation to Investors July 24, 2014, interim report as of June 30, 2014 Disclaimer Note: This presentation contains statements concerning the future business trend of the Vossloh Group which are based
November Roadshow Brussles. Florian Fuchs / IR Maximilian Schultheis / IR. Fraport AG
 November 2017 Roadshow Brussles Florian Fuchs / IR Maximilian Schultheis / IR Disclaimer This document has been prepared by Fraport solely for use in this presentation. The information contained in this
Analyst/Investor Presentation Q Results 20 November 2013
 Analyst/Investor Presentation Q3 2013 Results 20 November 2013 1 CONTENT 2 1 BUSINESS REVIEW Q3 2013: Johannes Nonn, CEO 2 RESULTS OF STRATEGIC REVIEW: Johannes Nonn, CEO 3 CAPITAL INCREASE AND BOD S COMPOSITION:
Orders received increased in Services focus continues to be on profitability improvement
 Orders received increased in Services focus continues to be on profitability improvement Interim Review, January March 215 April 29, 215 Pasi Laine, President and CEO Markku Honkasalo, CFO Agenda Interim
Interim announcement 1 st Half-year 2015
 Interim announcement 1 st Half-year 2015 Danfoss at a glance Danfoss engineers technologies that enable the world of tomorrow to do more with less. We meet the growing need for infrastructure, food supply,
FONTERRA INTERIM RESULTS 2014
 FONTERRA INTERIM RESULTS 2014 Market Briefing FONTERRA CO-OPERATIVE GROUP LIMITED Overview John Wilson Chairman 2 Working Area Safee Copy Frame. This denotes working area and must be deleted before final
Eng US. 14 July 2017
 Eng US 14 July 2017 Presentation 2017 Eng US Disclaimer This presentation has been prepared by Duni AB (the Company ) solely for use at this investor presentation and is furnished to you solely for your
BUILDING THE FUTURE TOGETHER HALF YEAR REPORT AS OF JUNE 30, 2017
 HALF YEAR REPORT AS OF JUNE 30, 2017 BUILDING THE FUTURE TOGETHER To our shareholders Patrik Heider, Spokesman of the Executive Board and CFOO The Nemetschek Group has continued on its course of dynamic
January March 2010 Conference Call. Georg Denoke Member of the Executive Board & CFO 4 May 2010
 January March 2010 Conference Call Georg Denoke Member of the Executive Board & CFO 4 May 2010 Disclaimer This presentation contains forward-looking statements about Linde AG ( Linde ) and their respective
FY 2016 Financial Results. Milan March 1st 2017
 FY 2016 Financial Results Milan March 1st 2017 Agenda FY 2016 Highlights o o Group overview Results by business Financial results Appendix FY 2016 Financial Results 2 FY 2016 Highlights Adj. EBITDA at