What is an efficient market? What does it imply for investment and valuation
|
|
|
- Arleen Rose
- 5 years ago
- Views:
Transcription
1 ch06_p111_153.qxp 12/2/11 2:07 PM Page 111 CHAPTER 6 Market Efficiency Definition, Tests, and Evidence What is an efficient market? What does it imply for investment and valuation models? Clearly, market efficiency is a concept that is controversial and attracts strong views, pro and con, partly because of differences between individuals about what it really means, and partly because it is a core belief that in large part determines how an investor approaches investing. This chapter provides a definition of market efficiency, considers the implications of an efficient market for investors, and summarizes some of the basic approaches that are used to test investment schemes, thereby proving or disproving market efficiency. It also provides a summary of the voluminous research on whether markets are efficient. MARKET EFFICIENCY AND INVESTMENT VALUATION The question of whether markets are efficient, and, if not, where the inefficiencies lie, is central to investment valuation. If markets are in fact efficient, the market price provides the best estimate of value, and the process of valuation becomes one of justifying the market price. If markets are not efficient, the market price may deviate from the true value, and the process of valuation is directed toward obtaining a reasonable estimate of this value. Those who do valuation well, then, will then be able to make higher returns than other investors because of their capacity to spot under- and overvalued firms. To make these higher returns, though, markets have to correct their mistakes (i.e., become efficient) over time. Whether these corrections occur over six months or over five years can have a profound impact on which valuation approach an investor chooses to use and the time horizon that is needed for it to succeed. There is also much that can be learned from studies of market efficiency, which highlight segments where the market seems to be inefficient. These inefficiencies can provide the basis for screening the universe of stocks to come up with a subsample that is more likely to contain undervalued stocks. Given the size of the universe of stocks, this not only saves time for the analyst, but it increases the odds significantly of finding under- and overvalued stocks. For instance, some efficiency studies suggest that stocks that are neglected by institutional investors are more likely to be undervalued and earn excess returns. A strategy that screens firms for low institutional investment (as a percentage of the outstanding stock) may yield a subsample of neglected firms, which can then be valued using valuation models to arrive at a portfolio of undervalued firms. If the research is correct, the odds of finding undervalued firms should increase in this subsample. 111
2 ch06_p111_153.qxp 12/2/11 2:07 PM Page MARKET EFFICIENCY DEFINITION,TESTS, AND EVIDENCE WHAT IS AN EFFICIENT MARKET? An efficient market is one where the market price is an unbiased estimate of the true value of the investment. Implicit in this derivation are several key concepts: Contrary to popular view, market efficiency does not require that the market price be equal to true value at every point in time. All it requires is that errors in the market price be unbiased; prices can be greater than or less than true value, as long as these deviations are random. The fact that the deviations from true value are random implies, in a rough sense, that there is an equal chance that any stock is under- or overvalued at any point in time, and that these deviations are uncorrelated with any observable variable. For instance, in an efficient market, stocks with lower PE ratios should be no more or no less likely to be undervalued than stocks with high PE ratios. If the deviations of market price from true value are random, it follows that no group of investors should be able to consistently find under- or overvalued stocks using any investment strategy. Definitions of market efficiency have to be specific not only about the market that is being considered but also the investor group that is covered. It is extremely unlikely that all markets are efficient to all investors, but it is entirely possible that a particular market (for instance, the New York Stock Exchange) is efficient with respect to the average investor. It is also possible that some markets are efficient while others are not, and that a market is efficient with respect to some investors and not to others. This is a direct consequence of differential tax rates and transactions costs, which confer advantages on some investors relative to others. Definitions of market efficiency are also linked up with assumptions about what information is available to investors and reflected in the price. For instance, a strict definition of market efficiency that assumes that all information, public as well as private, is reflected in market prices would imply that even investors with precise inside information will be unable to beat the market. One of the earliest classifications of levels of market efficiency was provided by Fama (1971), who argued that markets could be efficient at three levels, based on what information was reflected in prices. Under weak form efficiency, the current price reflects the information contained in all past prices, suggesting that charts and technical analyses that use past prices alone would not be useful in finding undervalued stocks. Under semi-strong form efficiency, the current price reflects the information contained not only in past prices but all public information (including financial statements and news reports) and no approach that is predicated on using and massaging this information would be useful in finding undervalued stocks. Under strong form efficiency, the current price reflects all information, public as well as private, and no investors will be able to find undervalued stocks consistently. IMPLICATIONS OF MARKET EFFICIENCY An immediate and direct implication of an efficient market is that no group of investors should be able to beat the market consistently using a common investment
3 ch06_p111_153.qxp 12/2/11 2:07 PM Page 113 Implications of Market Efficiency 113 strategy. An efficient market would also carry negative implications for many investment strategies: In an efficient market, equity research and valuation would be a costly task that would provide no benefits. The odds of finding an undervalued stock would always be 50 50, reflecting the randomness of pricing errors. At best, the benefits from information collection and equity research would cover the costs of doing the research. In an efficient market, a strategy of randomly diversifying across stocks or indexing to the market, carrying little or no information cost and minimal execution costs, would be superior to any other strategy that created larger information and execution costs. There would be no value added by portfolio managers and investment strategists. In an efficient market, a strategy of minimizing trading (i.e., creating a portfolio and not trading unless cash was needed) would be superior to a strategy that required frequent trading. It is therefore no wonder that the concept of market efficiency evokes such strong reactions on the part of portfolio managers and analysts, who view it, quite rightly, as a challenge to their existence. It is also important that there be clarity about what market efficiency does not imply. An efficient market does not imply that: Stock prices cannot deviate from true value; in fact, there can be large deviations from true value. The only requirement is that the deviations be random. No investor will beat the market in any time period. To the contrary, approximately half of all investors, prior to transactions costs, should beat the market in any period. 1 No group of investors will beat the market in the long term. Given the number of investors in financial markets, the laws of probability would suggest that a fairly large number are going to beat the market consistently over long periods, not because of their investment strategies but because they are lucky. It would not, however, be consistent if a disproportionately large number 2 of these investors used the same investment strategy. In an efficient market, the expected returns from any investment will be consistent with the risk of that investment over the long term, though there may be deviations from these expected returns in the short term. 1 Since returns are positively skewed that is, large positive returns are more likely than large negative returns (since this is bounded at 100%) less than half of all investors will probably beat the market. 2 One of the enduring pieces of evidence against market efficiency lies in the performance records posted by many of the investors who learned their lessons from Benjamin Graham in the 1950s. No probability statistics could ever explain the consistency and superiority of their records.
4 ch06_p111_153.qxp 12/2/11 2:07 PM Page MARKET EFFICIENCY DEFINITION,TESTS, AND EVIDENCE NECESSARY CONDITIONS FOR MARKET EFFICIENCY Markets do not become efficient automatically. It is the actions of investors, sensing bargains and putting into effect schemes to beat the market, that make markets efficient. The necessary conditions for a market inefficiency to be eliminated are: The market inefficiency should provide the basis for a scheme to beat the market and earn excess returns. For this to hold true: The asset or assets that are the source of the inefficiency have to be traded. The transaction costs of executing the scheme have to be smaller than the expected profits from the scheme. There should be profit-maximizing investors who: Recognize the potential for excess return. Can replicate the beat-the-market scheme that earns the excess return. Have the resources to trade on the stock(s) until the inefficiency disappears. The internal contradiction of claiming that there is no possibility of beating the market in an efficient market and requiring profit-maximizing investors to constantly seek out ways of beating the market and thus making it efficient has been explored by many. If markets were in fact efficient, investors would stop looking for inefficiencies, which would lead to markets becoming inefficient again. It makes sense to think about an efficient market as a self-correcting mechanism, where inefficiencies appear at regular intervals but disappear almost instantaneously as investors find them and trade on them. PROPOSITIONS ABOUT MARKET EFFICIENCY A reading of the conditions under which markets become efficient leads to general propositions about where investors are most likely to find inefficiencies in financial markets. Proposition 1: The probability of finding inefficiencies in an asset market decreases as the ease of trading on the asset increases. To the extent that investors have difficulty trading on an asset, either because open markets do not exist or there are significant barriers to trading, inefficiencies in pricing can continue for long periods. This proposition can be used to shed light on the differences between different asset markets. For instance, it is far easier to trade on stocks than it is on real estate, since markets are much more open, prices are in smaller units (reducing the barriers to entry for new traders), and the asset itself does not vary from transaction to transaction (one share of IBM is identical to another share, whereas one piece of real estate can be very different from another piece that is a stone s throw away). Based on these differences, there should be a greater likelihood of finding inefficiencies (both under- and overvaluation) in the real estate market. Proposition 2: The probability of finding an inefficiency in an asset market increases as the transactions and information cost of exploiting the inefficiency increases. The cost of collecting information and trading varies widely across markets and even across investments in the same markets. As these costs increase, it pays less and less to try to exploit these inefficiencies.
5 ch06_p111_153.qxp 12/2/11 2:07 PM Page 115 Propositions about Market Efficiency 115 Consider, for instance, the perceived wisdom that investing in loser stocks (i.e., stocks that have done very badly in some prior time period) should yield excess returns. This may be true in terms of raw returns, but transaction costs are likely to be much higher for these stocks since: They tend to be low-priced stocks, leading to higher brokerage commissions and expenses. The bid-ask spread, a transaction cost paid at the time of purchase, becomes a much higher fraction of the total price paid. Trading is often thin on these stocks, and small trades can cause prices to change, resulting in a higher buy price and a lower sell price. Corollary 1: Investors who can estabish a cost advantage (either in information collection or transactions costs) will be more able to exploit small inefficiencies than other investors who do not possess this advantage. There are a number of studies that look at the effect of block trades on prices and conclude that while block trades do affect prices, investors will not exploit these inefficiencies because of the number of times they will have to trade and their associated transaction costs. These concerns are unlikely to hold for a specialist on the floor of the exchange, who can trade quickly, often and at no or very low costs. It should be pointed out, however, that if the market for specialists is efficient, the value of a seat on the exchange should reflect the present value of potential benefits from being a specialist. This corollary also suggests that investors who work at establishing a cost advantage, especially in relation to information, may be able to generate excess returns on the basis of these advantages. Thus John Templeton, who started investing in Japanese and the Asian markets well before other portfolio managers, might have been able to exploit the informational advantages he had over his peers to make excess returns on his portfolio. Proposition 3: The speed with which an inefficiency is resolved will be directly related to how easily the scheme to exploit the inefficiency can be replicated by other investors. The ease with which a scheme can be replicated is related to the time, resources, and information needed to execute it. Since very few investors single-handedly possess the resources to eliminate an inefficiency through trading, it is much more likely that an inefficiency will disappear quickly if the scheme used to exploit the inefficiency is transparent and can be copied by other investors. To illustrate this point, assume that stocks are consistently found to earn excess returns in the month following a stock split. Since firms announce stock splits publicly and any investor can buy stocks right after these splits, it would be surprising if this inefficiency persisted over time. This can be contrasted with the excess returns made by some arbitrage funds in index arbitrage, where index futures are bought (sold), and stocks in the index are sold short (bought). This strategy requires that investors be able to obtain information on the index and spot prices instantaneously, have the capacity (in terms of margin requirements and resources) to trade index futures and to sell short on stocks, and to have the resources to take and hold very large positions until the arbitrage unwinds. Consequently, inefficiencies in index futures pricing are likely to persist at least for the most efficient arbitrageurs, with the lowest execution costs and the speediest execution times.
6 ch06_p111_153.qxp 12/2/11 2:07 PM Page MARKET EFFICIENCY DEFINITION,TESTS, AND EVIDENCE TESTING MARKET EFFICIENCY Tests of market efficiency look at the whether specific investment strategies earn excess returns. Some tests also account for transactions costs and execution feasibility. Since an excess return on an investment is the difference between the actual and expected return on that investment, there is implicit in every test of market efficiency a model for this expected return. In some cases, this expected return adjusts for risk using the capital asset pricing model or the arbitrage pricing model, and in others the expected return is based on returns on similar or equivalent investments. In every case, a test of market efficiency is a joint test of market efficiency and the efficacy of the model used for expected returns. When there is evidence of excess returns in a test of market efficiency, it can indicate that markets are inefficient or that the model used to compute expected returns is wrong or both. Although this may seem to present an insoluble dilemma, if the conclusions of the study are insensitive to different model specifications, it is much more likely that the results are being driven by true market inefficiencies and not just by model misspecifications. There are a number of different ways of testing for market efficiency, and the approach used will depend in great part on the investment scheme being tested. A scheme based on trading on information events (stock splits, earnings announcements, or acquisition announcements) is likely to be tested using an event study where returns around the event are scrutinized for evidence of excess returns. A scheme based on trading on an observable characteristic of a firm (price-earnings ratios, price book value ratios, or dividend yields) is likely to be tested using a portfolio approach, where portfolios of stocks with these characteristics are created and tracked over time to see whether in fact they make excess returns. The following pages summarize the key steps involved in each of these approaches, and some potential pitfalls to watch out for when conducting or using these tests. Event Study An event study is designed to examine market reactions to and excess returns around specific information events. The information events can be marketwide, such as macroeconomic announcements, or firm-specifc, such as earnings or dividend announcements. The five steps in an event study are: 1. The event to be studied is clearly identified, and the date on which the event was announced pinpointed. The presumption in event studies is that the timing of the event is known with a fair degree of certainty. Since financial markets react to the information about an event rather than the event itself, most event studies are centered around the announcement date for the event. 3 Announcement Date 2. Once the event dates are known, returns are collected around these dates for each of the firms in the sample. In doing so, two decisions have to be made. First, 3 In most financial transactions, the announcement date tends to precede the event date by several days and, sometimes, weeks.
7 ch06_p111_153.qxp 12/2/11 2:07 PM Page 117 Testing Market Efficiency 117 the analyst has to decide whether to collect weekly, daily, or shorter-interval returns around the event. This will be decided in part by how precisely the event date is known (the more precise, the more likely it is that shorter return intervals can be used) and by how quickly information is reflected in prices (the faster the adjustment, the shorter the return interval to use). Second, the analyst has to determine how many periods of returns before and after the announcement date will be considered as part of the event window. That decision also will be determined by the precision of the event date, since more imprecise dates will require longer windows. R jn Rj0 R+ jn Return window: n to + n where R jt = Returns on firm j for period t(t = n,..., 0,..., +n) 3. The returns, by period, around the announcement date, are adjusted for market performance and risk to arrive at excess returns for each firm in the sample. For instance, if the capital asset pricing model is used to control for risk: Excess return on period t = Return on day t (Risk-free rate + Beta Return on market on day t) ER jn ERj0 ER+ jn Return window: n to + n where ER jt = Excess returns on firm j for period t(t = n,..., 0,..., +n) = R jt E(R jt ) 4. The excess returns, by period, are averaged across all firms in the sample, and a standard error is computed. Average excess return on day t = where N = Number of events (firms) in the event study 5. The question of whether the excess returns around the announcement are different from zero is answered by estimating the t statistic for each period, by dividing the average excess return by the standard error: T statistic for excess return on day t = Average excess return/standard error If the t statistics are statistically significant, 4 the event affects returns; the sign of the excess return determines whether the effect is positive or negative. j= N ER N ER dt Average ER Standard error in excess return on day t = ( ) ( N 1) j= 1 d= N d= 1 jt 2 4 The standard levels of significance for t statistics are: Level One-Tailed Two-Tailed 1% %
8 ch06_p111_153.qxp 12/2/11 2:07 PM Page MARKET EFFICIENCY DEFINITION,TESTS, AND EVIDENCE ILLUSTRATION 6.1: Example of an Event Study Effects of Option Listing on Stock Prices Academics and practitioners have long argued about the consequences of option listing for stock price volatility. On the one hand, there are those who argue that options attract speculators and hence increase stock price volatility. On the other hand, there are others who argue that options increase the available choices for investors and increase the flow of information to financial markets, and thus lead to lower stock price volatility and higher stock prices. One way to test these alternative hypotheses is to do an event study, examining the effects of listing options on the underlying stocks prices. Conrad (1989) did such a study, following these steps: Step 1: The date of the announcement that options on a particular stock would be listed on the Chicago Board Options Exchange was collected. Step 2: The prices of the underlying stock (j) were collected for each of the 10 days prior to the option listing announcement date, for the day of the announcement, and for each of the 10 days after. Step 3: The returns on the stock (R jt ) were computed for each of these trading days. Step 4: The beta for the stock (β j ) was estimated using the returns from a time period outside the event window (using 100 trading days from before the event and 100 trading days after the event). Step 5: The returns on the market index (R mt ) were computed for each of the 21 trading days. Step 6: The excess returns were computed for each of the 21 trading days: ER jt = R jt β j R mt t = 10, 9, 8,..., +8, +9, +10 The excess returns are cumulated for each trading day. Step 7: The average and standard error of excess returns across all stocks with option listings were computed for each of the 21 trading days. The t statistics are computed using the averages and standard errors for each trading day. The following table summarizes the average excess returns and t statistics around option listing announcement dates: Trading Day Average Excess Return Cumulative Excess Return T Statistic % 0.17% % 0.65% % 0.41% % 0.69% % 0.73% % 0.27% % 0.01% % 0.10% % 0.16% % 0.45% % 0.46% % 0.63% % 0.77% % 0.81% % 0.99% % 1.55% % 1.77% % 1.82% % 1.69% % 1.78% % 1.80% 1.91 Based on these excess returns, there is no evidence of an announcement effect on the announcement day alone, but there is mild evidence of a positive effect over the entire announcement period. 5 5 The t statistics are marginally significant at the 5% level.
9 ch06_p111_153.qxp 12/2/11 2:07 PM Page 119 Testing Market Efficiency 119 Portfolio Study In some investment strategies, firms with specific characteristics are viewed as more likely to be undervalued, and therefore have excess returns, than firms without these characteristics. In these cases, the strategies can be tested by creating portfolios of firms possessing these characteristics at the beginning of a time period and then examining returns over the time period. To ensure that these results are not colored by the idiosyncracies of one time period, this analysis is repeated for a number of periods. The seven steps in doing a portfolio study are: 1. The variable on which firms will be classified is defined, using the investment strategy as a guide. This variable has to be observable, though it does not have to be numerical. Examples would include market value of equity, bond ratings, stock price, price-earnings ratios, and price book value ratios. 2. The data on the variable is collected for every firm in the defined universe 6 at the start of the testing period, and firms are classified into portfolios based on the magnitude of the variable. Thus, if the price-earnings ratio is the screening variable, firms are classified on the basis of PE ratios into portfolios from lowest PE to highest PE classes. The number of classes will depend on the size of the universe, since there have to be sufficient firms in each portfolio to get some measure of diversification. 3. The returns are collected for each firm in each portfolio for the testing period, and the returns for each portfolio are computed, generally assuming that the stocks are equally weighted. 4. The beta (if using a single-factor model) or betas (if using a multifactor model) of each portfolio are estimated, either by taking the average of the betas of the individual stocks in the portfolio or by regressing the portfolio s returns against market returns over a prior time period (for instance, the year before the testing period). 5. The excess returns earned by each portfolio are computed, in conjunction with the standard error of the excess returns. 6. There are a number of statistical tests available to check whether the average excess returns are, in fact, different across the portfolios. Some of these tests are parametric 7 (they make certain distributional assumptions about excess returns), and some are nonparametric As a final test, the extreme portfolios can be matched against each other to see whether there are statistically significant differences across these portfolios. 6 Though there are practicial limits on how big the universe can be, care should be taken to make sure that no biases enter at this stage of the process. An obvious bias would be to pick only stocks that have done well over the time period for the universe. 7 One parametric test is an F test, which tests for equality of means across groups. This test can be conducted assuming either that the groups have the same variance or that they have different variances. 8 An example of a nonparametric test is a rank sum test, which ranks returns across the entire sample and then sums the ranks within each group to check whether the rankings are random or systematic.
10 ch06_p111_153.qxp 12/2/11 2:07 PM Page MARKET EFFICIENCY DEFINITION,TESTS, AND EVIDENCE ILLUSTRATION 6.2: Example of a Portfolio Study Price-Earnings Ratios Practitioners have claimed that low price-earnings ratio stocks are generally bargains and do much better than the market or stocks with high price-earnings ratios. This hypothesis can be tested using a portfolio approach: Step 1: Using data on price-earnings ratios from the end of 1987, firms on the New York Stock Exchange were classified into five groups, the first group consisting of stocks with the lowest PE ratios and the fifth group consisting of stocks with the highest PE ratios. Firms with negative price-earnings ratios were ignored (which may bias the results). Step 2: The returns on each portfolio were computed using data from 1988 to Stocks that went bankrupt or were delisted were assigned a return of 100%. Step 3: The betas for each stock in each portfolio were computed using monthly returns from 1983 to 1987, and the average beta for each portfolio was estimated. The portfolios were assumed to be equally weighted. Step 4: The returns on the market index were computed from 1988 to Step 5: The excess returns on each portfolio were computed from 1988 to The following table summarizes the excess returns each year from 1988 to 1992 for each portfolio. PE Class Lowest 3.84% 0.83% 2.10% 6.68% 0.64% 2.61% % 2.26% 0.19% 1.09% 1.13% 1.56% % 3.15% 0.20% 0.17% 0.12% 0.59% % 0.94% 0.65% 1.99% 0.48% 1.15% Highest 1.74% 0.63% 1.44% 4.06% 1.25% 1.95% Step 6: While the ranking of the returns across the portfolio classes seems to confirm our hypothesis that low-pe stocks earn a higher return, we have to consider whether the differences across portfolios are statistically significant. There are several tests available, but these are a few: An F test can be used to accept or reject the hypothesis that the average returns are the same across all portfolios. A high F score would lead us to conclude that the differences are too large to be random. A chi-squared test is a nonparametric test that can be used to test the hypothesis that the means are the same across the five portfolio classes. We could isolate just the lowest-pe and highest-pe stocks and estimate a t statistic that the averages are different across these two portfolios. CARDINAL SINS IN TESTING MARKET EFFICIENCY In the process of testing investment strategies, there are a number of pitfalls that have to be avoided. Six of them are: 1. Using anecdotal evidence to support/reject an investment strategy. Anecdotal evidence is a double-edged sword. It can be used to support or reject the same hypothesis. Since stock prices are noisy and all investment schemes (no matter how absurd) will succeed sometimes and fail at other times, there will always be cases where the scheme works or does not work.
11 ch06_p111_153.qxp 12/2/11 2:07 PM Page 121 Some Lesser Sins That Can Be a Problem Testing an investment strategy on the same data and time period from which it was extracted. This is the tool of choice for the unscrupulous investment adviser. An investment scheme is extracted from hundreds through an examination of the data for a particular time period. This investment scheme is then tested on the same time period, with predictable results. (The scheme does miraculously well and makes immense returns.) An investment scheme should always be tested out on a time period different from the one it is extracted from or on a universe different from the one used to derive the scheme. 3. Choosing a biased sample. There may be bias in the sample on which the test is run. Since there are thousands of stocks that could be considered part of this universe, researchers often choose to use a smaller sample. When this choice is random, this does limited damage to the results of the study. If the choice is biased, it can provide results that are not true in the larger universe. 4. Failure to control for market performance. A failure to control for overall market performance can lead you to conclude that your investment scheme works just because it makes good returns (most schemes will make good returns if the overall market does well; the question is whether they made better returns than expected) or does not work just because it makes bad returns (most schemes will do badly if the overall market performs poorly). It is crucial therefore that investment schemes control for market performance during the period of the test. 5. Failure to control for risk. A failure to control for risk leads to a bias toward accepting high-risk investment schemes and rejecting low-risk investment schemes, since the former should make higher returns than the market and the latter lower, without implying any excess returns. 6. Mistaking correlation for causation. Consider the study on PE stocks cited in the earlier section. We concluded that low-pe stocks have higher excess returns than high-pe stocks. It would be a mistake to conclude that a low price-earnings ratio causes excess returns, since the high returns and the low PE ratio themselves might have been caused by the high risk associated with investing in the stock. In other words, high risk is the causative factor that leads to both the observed phenomena low PE ratios on the one hand and high returns on the other. This insight would make us more cautious about adopting a strategy of buying low-pe stocks in the first place. SOME LESSER SINS THAT CAN BE A PROBLEM 1. Survival bias. Most researchers start with an existing universe of publicly traded companies and work back through time to test investment strategies. This can create a subtle bias since it automatically eliminates firms that failed during the period, with obvious negative consequences for returns. If the investment scheme is particularly susceptible to picking firms that have high bankruptcy risk, this may lead to an overstatement of returns on the scheme. For example, assume that the investment scheme recommends investing in stocks that have very negative earnings, using the argument that these stocks are the most likely to benefit from a turnaround. Some of the firms in this portfolio will go bankrupt, and a failure to consider these firms will overstate the returns from this strategy.
12 ch06_p111_153.qxp 12/2/11 2:07 PM Page MARKET EFFICIENCY DEFINITION,TESTS, AND EVIDENCE 2. Not allowing for transaction costs. Some investment schemes are more expensive than others because of transaction costs execution fees, bid-ask spreads, and price impact. A complete test will take these into account before it passes judgment on the strategy. This is easier said than done, because different investors have different transaction costs, and it is unclear which investor s trading cost schedule should be used in the test. Most researchers who ignore transaction costs argue that individual investors can decide for themselves, given their transaction costs, whether the excess returns justify the investment strategy. 3. Not allowing for difficulties in execution. Some strategies look good on paper but are difficult to execute in practice, either because of impediments to trading or because trading creates a price impact. Thus a strategy of investing in very small companies may seem to create excess returns on paper, but these excess returns may not exist in practice because the price impact is significant. EVIDENCE ON MARKET EFFICIENCY This section of the chapter attempts to summarize the evidence from studies of market efficiency. Without claiming to be comprehensive, the evidence is classified into four sections the study of price changes and their time series properties, the research on the efficiency of market reaction to information announcements, the existence of return anomalies across firms and over time, and the analysis of the performance of insiders, analysts, and money managers. TIME SERIES PROPERTIES OF PRICE CHANGES Investors have used price charts and price patterns as tools for predicting future price movements for as long as there have been financial markets. It is not surprising, therefore, that the first studies of market efficiency focused on the relationship between price changes over time, to see if in fact such predictions were feasible. Some of this testing was spurred by the random walk theory of price movements, which contended that price changes over time followed a random walk. As the studies of the time series properties of prices have proliferated, the evidence can be classified into two categories studies that focus on short-term (intraday, daily, and weekly price movements) price behavior and research that examines long-term (annual and five-year returns) price movements. Short-Term Price Movements The notion that today s price change conveys information about tomorrow s price change is deeply rooted in most investors psyches. There are several ways in which this hypothesis can be tested in financial markets. Serial Correlation The serial correlation measures the correlation between price changes in consecutive time periods, whether hourly, daily, or weekly, and is a measure of how much the price change in any period depends on the price change over the previous time period. A serial correlation of zero would therefore imply that
13 ch06_p111_153.qxp 12/2/11 2:07 PM Page 123 Time Series Properties of Price Changes 123 price changes in consecutive time periods are uncorrelated with each other, and can thus be viewed as a rejection of the hypothesis that investors can learn about future price changes from past ones. A serial correlation that is positive and statistically significant could be viewed as evidence of price momentum in markets, and would suggest that returns in a period are more likely to be positive (negative) if the prior period s returns were positive (negative). A serial correlation that is negative and statistically significant could be evidence of price reversals, and would be consistent with a market where positive returns are more likely to follow negative returns and vice versa. From the viewpoint of investment strategy, serial correlations can be exploited to earn excess returns. A positive serial correlation would be exploited by a strategy of buying after periods with positive returns and selling after periods with negative returns. A negative serial correlation would suggest a strategy of buying after periods with negative returns and selling after periods with positive returns. Since these strategies generate transactions costs, the correlations have to be large enough to allow investors to generate profits to cover these costs. It is therefore entirely possible that there is serial correlation in returns, without any opportunity to earn excess returns for most investors. The earliest studies of serial correlation Alexander (1963), Cootner (1962), and Fama (1965) all looked at large U.S. stocks and concluded that the serial correlation in stock prices was small. Fama, for instance, found that 8 of the 30 stocks listed in the Dow had negative serial correlations and that most of the serial correlations were less than Other studies confirm these findings not only for smaller stocks in the United States, but also for other markets. For instance, Jennergren and Korsvold (1974) report low serial correlations for the Swedish equity market, and Cootner (1961) concludes that serial correlations are low in commodity markets as well. Although there may be statistical significance associated with some of these correlations, it is unlikely that there is enough correlation to generate excess returns. The serial correlation in short period returns is affected by market liquidity and the presence of a bid-ask spread. Not all stocks in an index are liquid, and in some cases stocks may not trade during a period. When the stock trades in a subsequent period, the resulting price changes can create positive serial correlation. To see why, assume that the market is up strongly on day 1, but that three stocks in the index do not trade on that day. On day 2, if these stocks are traded, they are likely to go up in price to reflect the increase in the market the previous day. The net result is that you should expect to see positive serial correlation in daily or hourly returns in illiquid market indexes. The bid-ask spread creates a bias in the opposite direction, if transaction prices are used to compute returns, since prices have an equal chance of ending up at the bid or the ask price. The bounce that this induces in prices from bid to ask to bid again will result in negative serial correlations in returns. Roll (1984) provides a simple measure of this relationship: Bid-ask spread = 2 (Serial covariance in returns) where the serial covariance in returns measures the covariance between return changes in consecutive time periods. For very short return intervals, this bias induced
14 ch06_p111_153.qxp 12/2/11 2:07 PM Page MARKET EFFICIENCY DEFINITION,TESTS, AND EVIDENCE in serial correlations might dominate and create the mistaken view that price changes in consecutive time periods are negatively correlated. Filter Rules In a filter rule, an investor buys an investment if the price rises X percent from a previous low and holds the investment until the price drops X percent from a previous high. The magnitude of the change (X percent) that triggers the trades can vary from filter rule to filter rule, with smaller changes resulting in more transactions per period and higher transaction costs. Figure 6.1 graphs out a typical filter rule. This strategy is based on the assumption that price changes are serially correlated and that there is price momentum (i.e., stocks that have gone up strongly in the past are more likely to keep going up than go down). Table 6.1 summarizes results Fama and Blume (1966) and Jensen and Bennington (1970) from a study on returns, before and after transactions costs, on a trading strategy based on filter rules ranging from 0.5 percent to 20 percent. (A 0.5 percent rule implies that a stock is bought when it rises 0.5 percent from a previous low and is sold when it falls 0.5 percent from a prior high.) The only filter rule that beats the returns from the buy-and-hold strategy is the 0.5 percent rule, but it does so before transaction costs. This strategy creates 12,514 trades during the period which generate enough transaction costs to wipe out the principal invested by the investor. While this test is dated, it also illustrates basic problems with strategies that require frequent short-term trading. Even though these strategies may earn excess returns prior to transaction costs, adjusting for these costs can wipe out the excess returns. One popular indicator among investors that is a variant on the filter rule is the relative strength measure, which relates recent prices on stocks or other investments FIGURE 6.1 Filter Rule
15 ch06_p111_153.qxp 12/2/11 2:07 PM Page 125 Time Series Properties of Price Changes 125 TABLE 6.1 Returns on Filter Rule Strategies Return with Return with Number of Transactions Return after Value of X Strategy Buy and Hold with Strategy Transaction Costs 0.5% 11.5% 10.4% 12, % 1.0% 5.5% 10.3% 8, % 2.0% 0.2% 10.3% 4, % 3.0% 1.7% 10.1% 2, % 4.0% 0.1% 10.1% 2, % 5.0% 1.9% 10.0% 1, % 6.0% 1.3% 9.7% 1, % 7.0% 0.8% 9.6% % 8.0% 1.7% 9.6% % 9.0% 1.9% 9.6% % 10.0% 3.0% 9.6% % 12.0% 5.3% 9.4% % 14.0% 3.9% 10.3% % 16.0% 4.2% 10.3% % 18.0% 3.6% 10.0% % 20.0% 4.3% 9.8% % to either average prices over a specified period, say over six months, or to the price at the beginning of the period. Stocks that score high on the relative strength measure are considered good investments. This investment strategy is also based upon the assumption of price momentum. Runs Tests A runs test is a nonparametric variation on the serial correlation, and it is based on a count of the number of runs (i.e., sequences of price increases or decreases) in the price changes. Thus, the following time series of price changes, where U is an increase and D is a decrease, would result in the following runs: UUU DD U DDD UU DD U D UU DD U DD UUU DD UU D UU D There were 18 runs in this price series of 33 periods. The actual number of runs in the price series is compared against the number that can be expected in a series of this length, assuming that price changes are random. 9 If the actual number of runs is greater than the expected number, there is evidence of negative correlation in price changes. If it is lower, there is evidence of positive correlation. A 1966 study by Niederhoffer and Osborne of price changes in the Dow 30 stocks assuming daily, four-day, nine-day, and 16-day return intervals provided the following results: 9 There are statistical tables that summarize the expected number of runs, assuming randomness, in a series of any length.
16 ch06_p111_153.qxp 12/2/11 2:07 PM Page MARKET EFFICIENCY DEFINITION,TESTS, AND EVIDENCE Differencing Interval Daily Four-Day Nine-Day Sixteen-Day Actual runs Expected runs Based on these results, there is evidence of positive correlation in daily returns but no evidence of deviations from normality for longer return intervals. Again, while the evidence is dated, it serves to illustrate the point that long strings of positive and negative changes are, by themselves, insufficient evidence that markets are not random, since such behavior is consistent with price changes following a random walk. It is the recurrence of these strings that can be viewed as evidence against randomness in price behavior. Long-Term Price Movements While most of the earlier studies of price behavior focused on shorter return intervals, more attention has been paid to price movements over longer periods (oneyear to five-year periods) in recent years. Here, there is an interesting dichotomy in the results. When long term is defined as months rather than years, there seems to be a tendency toward positive serial correlation or price momentum. However, when long term is defined in terms of years, there is substantial negative correlation in the returns, suggesting that markets reverse themselves over long periods. Shorter-Term Price Momentum In the last section, we noted that the evidence of short-term price patterns is weak and that any price dependence over very short time periods (minutes or hours) can be attributed more to market structure (liquidity, bid ask spreads) than to inefficiency. We also argued that while chartists who track these short-term price movements abound, few seem to emerge as consistent winners. As we extend our time periods from minutes to days and from days to weeks, there is some evidence of price momentum. Put differently, stocks that have gone up in the last few weeks or months seem to have a tendency to continue to outperform the market in the next few weeks or months, and stocks that have gone down in the recent weeks or months continue to languish in the next few weeks or months. Jegadeesh and Titman present evidence of what they call price momentum in stock prices over time periods of up to eight months stocks that have gone up in the last six months tend to continue to go up, whereas stocks that have gone down in the last six months tend to continue to go down. The momentum effect is just as strong in the European markets, though it seems to be weaker in emerging markets. What may cause this momentum? One potential explanation is that mutual funds are more likely to buy past winners and dump past losers, thus generating price continuity. Longer-Term Price Reversal When the long term is defined in terms of years, there is substantial negative correlation in returns, suggesting that markets reverse themselves over very long periods. Fama and French examined five-year returns on stocks from 1941 to 1985 and present evidence of this phenomenon. They found that serial correlation is more negative in
17 ch06_p111_153.qxp 12/2/11 2:07 PM Page 127 Time Series Properties of Price Changes 127 five-year returns than in one-year returns, and is much more negative for smaller stocks rather than larger stocks. Figure 6.2 summarizes one-year and five-years serial correlation by size class for stocks on the New York Stock Exchange. This phenomenon has also been examined in other markets, and the findings have been similar. There is evidence that returns reverse themselves over long time periods. Since there is evidence that prices reverse themselves in the long term for entire markets, it might be worth examining whether such price reversals occur on classes of stock within a market. For instance, are stocks that have gone up the most over the last period more likely to go down over the next period and vice versa? To isolate the effect of such price reversals on the extreme portfolios, DeBondt and Thaler constructed a winner portfolio of 35 stocks, which had gone up the most over the prior year, and a loser portfolio of 35 stocks, which had gone down the most over the prior year, each year from 1933 to 1978, and examined returns on these portfolios for the sixty months following the creation of the portfolio. Figure 6.3 summarizes the excess returns for winner and loser portfolios. This analysis suggests that loser portfolios clearly outperform winner portfolios in the 60 months following creation. This evidence is consistent with market overreaction and correction in long return intervals. There are many, academics as well as practitioners, who suggest that these findings may be interesting but that they overstate potential returns on loser portfolios. For instance, there is evidence that loser portfolios are more likely to contain low-priced stocks (selling for less than $5), which generate higher transactions costs and are also more likely to offer heavily skewed returns; that is, the excess returns come from a few stocks making phenomenal returns rather than from consistent performance. One study of the winner and loser portfolios attributes the bulk of the excess returns of loser portfolios to low-priced stocks and also finds that the results are sensitive to when the portfolios are created Correlation in Returns Smallest Market Value Class Largest 5 Year 1 Year FIGURE 6.2 One-Year and Five-Year Correlations: Market Value Class: Source: Fama and French (1988).
18 ch06_p111_153.qxp 12/2/11 2:07 PM Page MARKET EFFICIENCY DEFINITION,TESTS, AND EVIDENCE FIGURE 6.3 Excess Returns for Winner and Loser Portfolios Source: DeBondt and Thaler (1985). Loser portfolios created every December earn significantly higher returns than portfolios created every June. Speculative Bubbles, Crashes, and Panics Historians who have examined the behavior of financial markets over time have challenged the assumption of rationality that underlies much of efficient market theory. They point to the frequency with which speculative bubbles have formed in financial markets as investors buy into fads or get-rich-quick schemes, and the crashes when these bubbles have ended, and suggest that there is nothing to prevent the recurrence of this phenomenon in today s financial markets. There is some evidence in the literature of irrationality on the part of market players. Experimental Studies of Rationality Some of the most interesting evidence on market efficiency and rationality in recent years has come from experimental studies. While most experimental studies suggest that traders are rational, there are some examples of irrational behavior in some of these studies. One such study was done at the University of Arizona. In an experimental study, traders were told that a payout would be declared after each trading day, determined randomly from four possibilities 0, 8, 28, or 60 cents. The average payout was 24 cents. Thus the share s expected value on the first trading day of a 15-day experiment was $3.60 (24 cents times 15), the second day was $3.36, and so on. The traders were allowed to trade each day. The results of 60 such experiments are summarized in Figure 6.4. There is clear evidence here of a speculative bubble forming during periods 3 to 5, where prices exceed expected values by a significant amount. The bubble ultimately bursts, and prices approach expected value by the end of the period. If this
19 ch06_p111_153.qxp 12/2/11 2:07 PM Page 129 Time Series Properties of Price Changes 129 FIGURE 6.4 Trading Price by Trading Day mispricing is feasible in a simple market, where every investor obtains the same information, it is clearly feasible in real financial markets, where there is much more differential information and much greater uncertainty about expected value. It should be pointed out that some of the experiments were run with students, and some with Tucson businessmen with real-world experience. The results were similar for both groups. Furthermore, when price curbs of 15 cents were introduced, the booms lasted even longer because traders knew that prices would not fall by more than 15 cents in a period. Thus, the notion that price limits can control speculative bubbles seems misguided. Behavioral Finance The irrationality sometimes exhibited by investors has given rise to a whole new area of finance called behavioral finance. Using evidence gathered from experimental psychology, researchers have tried to both model how investors react to information and predict how prices will change as a consequence. They have been far more successful at the first endeavor than the second. For instance, the evidence seems to suggest that: Investors do not like to admit their mistakes. Consequently, they tend to hold on to losing stocks far too long, or in some cases double up their bets (investments) as stocks drop in value. More information does not always lead to better investment decisions. Investors seem to suffer both from information overload and from a tendency to react to the latest piece of information. Both result in investment decisions that lower returns in the long term. If the evidence on how investors behave is so clear-cut, you might ask, why are the predictions that emerge from these models so noisy? The answer, perhaps, is that any model that tries to forecast human foibles and irrationalities is, by its very nature, unlikely to be a stable one. Behavioral finance may emerge ultimately as a
20 ch06_p111_153.qxp 12/2/11 2:07 PM Page MARKET EFFICIENCY DEFINITION,TESTS, AND EVIDENCE BEHAVORIAL FINANCE AND VALUATION In 1999, Robert Shiller made waves in both academia and investment houses with his book titled Irrational Exuberance. His thesis is that investors are often not just irrational but irrational in predictable ways overreacting to some information and buying and selling in herds. His work forms part of a growing body of theory and evidence of behavioral finance, which can be viewed as a congruence of psychology, statistics, and finance. While the evidence presented for investor irrationality is strong, the implications for valuation are less so. You can consider discounted cash flow valuation to be the antithesis of behavioral finance, because it takes the point of view that the value of an asset is the present value of the expected cash flows generated by that asset. With this context, there are two ways in which you can look at the findings in behavioral finance: 1. Irrational behavior may explain why prices can deviate from value (as estimated in a discounted cash flow model). Consequently, it provides the foundation for the excess returns earned by rational investors who base decisions on estimated value. Implicit here is the assumption that markets ultimately recognize their irrationality and correct themselves. 2. It may also explain why discounted cash flow values can deviate from relative values (estimated using multiples). Since the relative value is estimated by looking at how the market prices similar assets, irrationalities that exist will be priced into the asset. trump card in explaining why and how stock prices deviate from true value, but its role in devising investment strategy still remains questionable. MARKET REACTION TO INFORMATION EVENTS Some of the most powerful tests of market efficiency are event studies where market reaction to informational events (such as earnings and takeover announcements) has been scrutinized for evidence of inefficiency. While it is consistent with market efficiency for markets to react to new information, the reaction has to be instantaneous and unbiased. This point is made in Figure 6.5 by contrasting three different market reactions to information announcements. FIGURE 6.5 Information and Price Adjustment
21 ch06_p111_153.qxp 12/2/11 2:07 PM Page 131 Market Reaction to Information Events 131 Of the three market reactions pictured here, only the first one is consistent with an efficient market. In the second market, the information announcement is followed by a gradual increase in prices, allowing investors to make excess returns after the announcement. This is a slow learning market where some investors will make excess returns on the price drift. In the third market, the price reacts instantaneously to the announcement, but corrects itself in the days that follow, suggesting that the initial price change was an overreaction to the information. Here again, an enterprising investor could have sold short after the announcement and expected to make excess returns as a consequence of the price correction. Earnings Announcements When firms make earnings announcements, they convey information to financial markets about their current and future prospects. The magnitude of the information, and the size of the market reaction, should depend on how much the earnings report exceeds or falls short of investor expectations. In an efficient market, there should be an instantaneous reaction to the earnings report, if it contains surprising information, and prices should increase following positive surprises and decline following negative surprises. Since actual earnings are compared to investor expectations, one of the key parts of an earnings event study is the measurement of these expectations. Some of the earlier studies used earnings from the same quarter in the prior year as a measure of expected earnings (i.e., firms that report increases in quarter-to-quarter earnings provide positive surprises, and those which report decreases in quarter-to-quarter earnings provide negative surprises). In more recent studies, analyst estimates of earnings have been used as a proxy for expected earnings and compared to the actual earnings. Figure 6.6 provides a graph of price reactions to earnings surprises, classified on the basis of magnitude into different classes from most negative earnings reports (group 1) to most positive earnings reports (group 10). The evidence contained in this graph is consistent with the evidence in most earnings announcement studies: The earnings announcement clearly conveys valuable information to financial markets; there are positive excess returns (cumulative abnormal returns) after positive announcements and negative excess returns around negative announcements. There is some evidence of a market reaction in the day immediately prior to the earnings announcement that is consistent with the nature of the announcement (i.e., prices tend to go up on the day before positive announcements and down on the day before negative announcements). This can be viewed as evidence of either insider trading, information leakage, or getting the announcement date wrong The Wall Street Journal is often used as an information source to extract announcement dates for earnings. For some firms, news of the announcement may actually cross the news wire the day before the Wall Street Journal announcement, leading to a misidentification of the report date and the drift in returns the day before the announcement.
22 ch06_p111_153.qxp 12/2/11 2:07 PM Page MARKET EFFICIENCY DEFINITION,TESTS, AND EVIDENCE FIGURE 6.6 Price Reaction to Quarterly Earnings Report Source: Rendleman, Jones, and Latrané (1982). There is some evidence, albeit weak, of a price drift in the days following an earnings announcement. Thus a positive report evokes a positive market reaction on the announcement date, and there are mildly positive excess returns in the days following the earnings announcement. Similar conclusions emerge for negative earnings reports. The management of a firm has some discretion on the timing of earnings reports, and there is some evidence that the timing affects expected returns. A 1989 study by Damodaran of earnings reports, classified by the day of the week that the earnings are reported, reveals that earnings and dividend reports on Fridays are much more likely to contain negative information than announcements on any other day of the week. This is shown in Figure 6.7. There is also some evidence discussed by Chamber and Penman (1984) that earnings announcements that are delayed, relative to the expected announcement date, are much more likely to contain bad news than earnings announcements
23 ch06_p111_153.qxp 12/2/11 2:07 PM Page 133 Market Reaction to Information Events 133 Excess Returns 8.00% 6.00% 4.00% 2.00% 0.00% Earnings Dividends 2.00% 4.00% 6.00% Monday Tuesday Wednesday Thursday Friday % Change (EPS) % Change (DPS) FIGURE 6.7 Earnings and Dividend Reports by Day of the Week Source: Damodaran (1989). that are early or on time. This is graphed in Figure 6.8. Earnings announcements that are more than six days late relative to the expected announcement date are much more likely to contain bad news and evoke negative market reactions than earnings announcements that are on time or early. Investment and Project Announcements Firms frequently make announcements of their intentions of investing resources in projects and research and development. There is evidence that financial markets react to these announcements. The question of whether markets have a longterm or short-term perspective can be partially answered by looking at these market reactions. If financial markets are as short-term as some of their critics claim, they should react negatively to announcements by the firm that it plans to invest in research and development. The evidence suggests the contrary. Table 6.2 summarizes market reactions to various classes of investment announcements made by the firm. This table excludes the largest investments that most firms make, which is acquisitions of other firms. Here the evidence is not so favorable. In about 55 percent of all acquisitions, the stock price of the acquiring firm drops on the announcement of the acquisition, reflecting the market s beliefs that firms tend to overpay on acquisitions.
24 ch06_p111_153.qxp 12/2/11 2:07 PM Page MARKET EFFICIENCY DEFINITION,TESTS, AND EVIDENCE Cumulative Abnormal Return Day 0 Is Earnings Announcement Date Early > 6 days Delay > 6 days FIGURE 6.8 Cumulated Abnormal Returns and Earnings Delay Source: Chambers and Penman (1984). TABLE 6.2 Market Reactions to Investment Announcements Abnormal Returns On In Type of Announcement Announcement Day Announcement Month Joint venture formations 0.399% 1.412% R&D expenditures 0.251% 1.456% Product strategies 0.440% 0.35% Capital expenditures 0.290% 1.499% All announcements 0.355% 0.984% Source: Chan, Martin, and Kensinger (1990); McConnell and Muscarella (1985). MARKET ANOMALIES Merriam-Webster s Collegiate Dictionary defines an anomaly as a deviation from the common rule. Studies of market efficiency have uncovered numerous examples of market behavior that are inconsistent with existing models of risk and return and often defy rational explanation. The persistence of some of these patterns of behavior suggests that the problem, in at least some of these anomalies, lies in the models being used for risk and return rather than in the behavior of financial markets. The following section summarizes some of the more widely noticed anomalies in financial markets in the United States and elsewhere. Anomalies Based on Firm Characteristics There are a number of anomalies that have been related to observable firm characteristics, including the market value of equity, price-earnings ratios, and price book value ratios.
25 ch06_p111_153.qxp 12/2/11 2:07 PM Page 135 Market Anomalies 135 The Small Firm Effect Studies such as Banz (1981) and Keim (1983) have consistently found that smaller firms (in terms of market value of equity) earn higher returns than larger firms of equivalent risk, where risk is defined in terms of the market beta. Figure 6.9 summarizes returns for stocks in 10 market value classes for the period from 1927 to The size of the small firm premium, while it has varied across time, has been generally positive. It was highest during the 1970s and early 1980s and lowest during the 1990s. The persistence of this premium has led to several possible explanations. 1. The transaction costs of investing in small stocks are significantly higher than the transaction costs of investing in larger stocks, and the premiums are estimated prior to these costs. While this is generally true, the differential transaction costs are unlikely to explain the magnitude of the premium across time, and are likely to become even less critical for longer investment horizons. The difficulties of replicating the small firm premiums that are observed in the studies in real time are illustrated in Figure 6.10, which compares the returns on a hypothetical small firm portfolio (CRSP Small Stocks) with the actual returns on a small firm mutual fund (DFA Small Stock Fund), which passively invests in small stocks. 2. The capital asset pricing model may not be the right model for risk, and betas underestimate the true risk of small stocks. Thus, the small firm premium is really a measure of the failure of beta to capture risk. The additional risk associated with small stocks may come from several sources. First, the estimation risk associated with estimates of beta for small firms is much greater than the estimation risk associated with beta estimates for larger firms. The small firm premium may be a reward for this additional estimation risk. Second, there may be additional risk in investing in small stocks because far less information is 20.00% 18.00% 16.00% 14.00% 12.00% 10.00% 8.00% 6.00% 4.00% 2.00% 0.00% Smallest Size Class FIGURE 6.9 Annual Returns by Size Class,

26
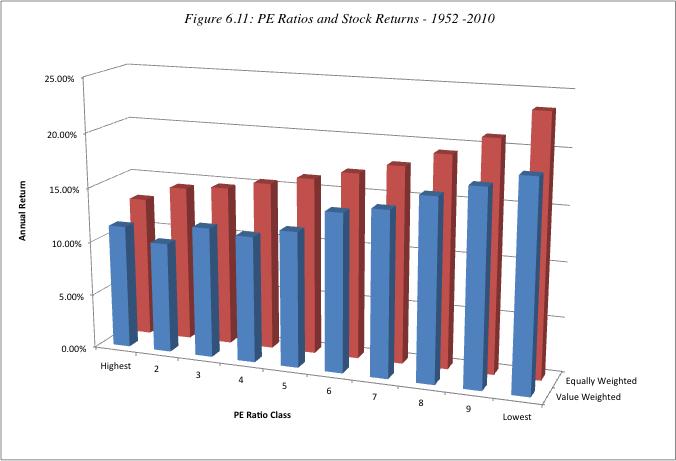
27 ch06_p111_153.qxp 12/2/11 2:07 PM Page MARKET EFFICIENCY DEFINITION,TESTS, AND EVIDENCE 15.00% 10.00% 5.00% 0.00% 5.00% 10.00% CRSP Small Stocks DFA Small Stock Fund FIGURE 6.10 Returns on CRSP Small Stocks versus DFA Small Stock Fund available on these stocks. In fact, studies indicate that stocks that are neglected by analysts and institutional investors earn an excess return that parallels the small firm premium. There is evidence of a small firm premium in markets outside the United States as well. Dimson and Marsh (1986) examined stocks in the United Kingdom from 1955 to 1984 and found that the annual returns on small stocks exceeded that on large stocks by 6 percent annually over the period. Chan, Hamao, and Lakonishok (1991) report a small firm premium of about 5 percent for Japanese stocks between 1971 and Price-Earnings Ratios Investors have long argued that stocks with low price-earnings ratios are more likely to be undervalued and earn excess returns. For instance, Benjamin Graham, in his investment classic The Intelligent Investor, used low price-earnings ratios as a screen for finding undervalued stocks. Studies [Basu (1977); Basu (1983)] that have looked at the relationship between PE ratios and excess returns confirm these priors. Figure 6.11 summarizes annual returns by PE ratio classes for stocks from 1967 to Firms in the lowest PE ratio class earned an average return of percent during the period, while firms in the highest PE ratio class earned an average return of only 6.64 percent. The excess returns earned by low PE ratio stocks also persist in other international markets. Table 6.3 summarizes the results of studies looking at this phenomenon in markets outside the United States. The excess returns earned by low price-earnings ratio stocks are difficult to justify using a variation of the argument used for small stocks (i.e., that the risk of low PE ratios stocks is understated in the CAPM). Low PE ratio stocks generally are characterized by low growth, large size, and stable businesses, all of which should work toward reducing their risk rather than increasing it. The only explanation that can be given for this phenomenon, which is consistent with an efficient market, is that low PE ratio stocks generate large dividend yields, which would have created a larger tax burden because dividends are taxed at higher rates.
28 ch06_p111_153.qxp 12/2/11 2:07 PM Page 137 Market Anomalies % 16.00% 14.00% 12.00% 10.00% 8.00% 6.00% 4.00% 2.00% 0.00% Lowest FIGURE 6.11 Annual Returns by PE Ratio Class TABLE 6.3 Excess Returns on Low PE Ratio Stocks by Country, Country Annual Premium Earned by Lowest-PE Stocks (Bottom Quintile) Australia 3.03% France 6.40% Germany 1.06% Hong Kong 6.60% Italy 14.16% Japan 7.30% Switzerland 9.02% United Kingdom 2.40% Annual premium: Premium earned over an index of equally weighted stocks in that market between January 1, 1989, and December 31, These numbers were obtained from a Merrill Lynch Survey of Proprietary Indices. Price Book Value Ratios Another statistic that is widely used by investors in investment strategy is price book value ratios. A low price book value ratio has been considered a reliable indicator of undervaluation in firms. In studies that parallel those done on price-earnings ratios, the relationship between returns and price book value ratios has been studied. The consistent finding from these studies is that there is a negative relationship between returns and price book value ratios low price book value ratio stocks earn higher returns than high price book value ratio stocks.
29
FINANCIAL MARKETS cont d
 FINANCIAL MARKETS cont d The Stock Market, the Theory of Rational Expectations, and the Efficient Market Hypothesis Stocks or Company Shares Common stock is the principal way that corporations or companies
Chapter 13. Efficient Capital Markets and Behavioral Challenges
 Chapter 13 Efficient Capital Markets and Behavioral Challenges Articulate the importance of capital market efficiency Define the three forms of efficiency Know the empirical tests of market efficiency
The Efficient Market Hypothesis
 Efficient Market Hypothesis (EMH) 11-2 The Efficient Market Hypothesis Maurice Kendall (1953) found no predictable pattern in stock prices. Prices are as likely to go up as to go down on any particular
Market Efficiency: Laying the groundwork
 Market Efficiency: Laying the groundwork Why market efficiency ma8ers.. The ques=on of whether markets are efficient, and if not, where the inefficiencies lie, is central to investment valua=on. If markets
CHAPTER 12: MARKET EFFICIENCY AND BEHAVIORAL FINANCE
 CHAPTER 12: MARKET EFFICIENCY AND BEHAVIORAL FINANCE 1. The correlation coefficient between stock returns for two non-overlapping periods should be zero. If not, one could use returns from one period to
The Efficient Market Hypothesis. Presented by Luke Guerrero and Sarah Van der Elst
 The Efficient Market Hypothesis Presented by Luke Guerrero and Sarah Van der Elst Agenda Background and Definitions Tests of Efficiency Arguments against Efficiency Conclusions Overview An ideal market
Efficient Capital Markets
 Efficient Capital Markets Why Should Capital Markets Be Efficient? Alternative Efficient Market Hypotheses Tests and Results of the Hypotheses Behavioural Finance Implications of Efficient Capital Markets
MBF2253 Modern Security Analysis
 MBF2253 Modern Security Analysis Prepared by Dr Khairul Anuar L8: Efficient Capital Market www.notes638.wordpress.com Capital Market Efficiency Capital market history suggests that the market values of
A Random Walk Down Wall Street
 FIN 614 Capital Market Efficiency Professor Robert B.H. Hauswald Kogod School of Business, AU A Random Walk Down Wall Street From theory of return behavior to its practice Capital market efficiency: the
CHAPTER 17 INVESTMENT MANAGEMENT. by Alistair Byrne, PhD, CFA
 CHAPTER 17 INVESTMENT MANAGEMENT by Alistair Byrne, PhD, CFA LEARNING OUTCOMES After completing this chapter, you should be able to do the following: a Describe systematic risk and specific risk; b Describe
CHAPTER 11. The Efficient Market Hypothesis INVESTMENTS BODIE, KANE, MARCUS. Copyright 2011 by The McGraw-Hill Companies, Inc. All rights reserved.
 CHAPTER 11 The Efficient Market Hypothesis McGraw-Hill/Irwin Copyright 2011 by The McGraw-Hill Companies, Inc. All rights reserved. 11-2 Efficient Market Hypothesis (EMH) Maurice Kendall (1953) found no
Daily Stock Returns: Momentum, Reversal, or Both. Steven D. Dolvin * and Mark K. Pyles **
 Daily Stock Returns: Momentum, Reversal, or Both Steven D. Dolvin * and Mark K. Pyles ** * Butler University ** College of Charleston Abstract Much attention has been given to the momentum and reversal
Answer FOUR questions out of the following FIVE. Each question carries 25 Marks.
 UNIVERSITY OF EAST ANGLIA School of Economics Main Series PGT Examination 2017-18 FINANCIAL MARKETS ECO-7012A Time allowed: 2 hours Answer FOUR questions out of the following FIVE. Each question carries
Behavioral Finance 1-1. Chapter 4 Challenges to Market Efficiency
 Behavioral Finance 1-1 Chapter 4 Challenges to Market Efficiency 1 Introduction 1-2 Early tests of market efficiency were largely positive However, more recent empirical evidence has uncovered a series
AFM 371 Winter 2008 Chapter 14 - Efficient Capital Markets
 AFM 371 Winter 2008 Chapter 14 - Efficient Capital Markets 1 / 24 Outline Background What Is Market Efficiency? Different Levels Of Efficiency Empirical Evidence Implications Of Market Efficiency For Corporate
Chapter 7 The Stock Market, the Theory of Rational Expectations, and the Efficient Markets Hypothesis
 Chapter 7 The Stock Market, the Theory of Rational Expectations, and the Efficient Markets Hypothesis Multiple Choice 1) Stockholders rights include (a) the right to vote. (b) the right to manage. (c)
International Journal of Management Sciences and Business Research, 2013 ISSN ( ) Vol-2, Issue 12
 Vol-2, Issue 12") Momentum and industry-dependence: the case of Shanghai stock exchange market. Author Detail: Dongbei University of Finance and Economics, Liaoning, Dalian, China Salvio.Elias. Macha Abstract A number of
Momentum and industry-dependence: the case of Shanghai stock exchange market. Author Detail: Dongbei University of Finance and Economics, Liaoning, Dalian, China Salvio.Elias. Macha Abstract A number of
PAPER No.14 : Security Analysis and Portfolio Management MODULE No.24 : Efficient market hypothesis: Weak, semi strong and strong market)
") Subject Paper No and Title Module No and Title Module Tag 14. Security Analysis and Portfolio M24 Efficient market hypothesis: Weak, semi strong and strong market COM_P14_M24 TABLE OF CONTENTS After going
Subject Paper No and Title Module No and Title Module Tag 14. Security Analysis and Portfolio M24 Efficient market hypothesis: Weak, semi strong and strong market COM_P14_M24 TABLE OF CONTENTS After going
MUTUAL FUND PERFORMANCE ANALYSIS PRE AND POST FINANCIAL CRISIS OF 2008
 MUTUAL FUND PERFORMANCE ANALYSIS PRE AND POST FINANCIAL CRISIS OF 2008 by Asadov, Elvin Bachelor of Science in International Economics, Management and Finance, 2015 and Dinger, Tim Bachelor of Business
Fresh Momentum. Engin Kose. Washington University in St. Louis. First version: October 2009
 Long Chen Washington University in St. Louis Fresh Momentum Engin Kose Washington University in St. Louis First version: October 2009 Ohad Kadan Washington University in St. Louis Abstract We demonstrate
Ulaş ÜNLÜ Assistant Professor, Department of Accounting and Finance, Nevsehir University, Nevsehir / Turkey.
 Size, Book to Market Ratio and Momentum Strategies: Evidence from Istanbul Stock Exchange Ersan ERSOY* Assistant Professor, Faculty of Economics and Administrative Sciences, Department of Business Administration,
Monetary Economics Efficient Markets and Alternatives. Gerald P. Dwyer Fall 2015
 Monetary Economics Efficient Markets and Alternatives Gerald P. Dwyer Fall 2015 Readings This lecture, Malkiel Part 3 Next lecture, Cuthbertson, Chapter 6 Behavioral Finance Behavioral finance is not a
15 Week 5b Mutual Funds
 15 Week 5b Mutual Funds 15.1 Background 1. It would be natural, and completely sensible, (and good marketing for MBA programs) if funds outperform darts! Pros outperform in any other field. 2. Except for...
The Vasicek adjustment to beta estimates in the Capital Asset Pricing Model
 The Vasicek adjustment to beta estimates in the Capital Asset Pricing Model 17 June 2013 Contents 1. Preparation of this report... 1 2. Executive summary... 2 3. Issue and evaluation approach... 4 3.1.
Kingdom of Saudi Arabia Capital Market Authority. Investment
 Kingdom of Saudi Arabia Capital Market Authority Investment The Definition of Investment Investment is defined as the commitment of current financial resources in order to achieve higher gains in the
One COPYRIGHTED MATERIAL. Performance PART
 PART One Performance Chapter 1 demonstrates how adding managed futures to a portfolio of stocks and bonds can reduce that portfolio s standard deviation more and more quickly than hedge funds can, and
Discussion Paper No. DP 07/02
 SCHOOL OF ACCOUNTING, FINANCE AND MANAGEMENT Essex Finance Centre Can the Cross-Section Variation in Expected Stock Returns Explain Momentum George Bulkley University of Exeter Vivekanand Nawosah University
Discussion of Value Investing: The Use of Historical Financial Statement Information to Separate Winners from Losers
 Discussion of Value Investing: The Use of Historical Financial Statement Information to Separate Winners from Losers Wayne Guay The Wharton School University of Pennsylvania 2400 Steinberg-Dietrich Hall
Lesson XI: Market Efficiency and FX. Forecasting
 Lesson XI: May 15, 2017 Table of Contents Getting Started Market efficiency is an equilibrium condition, such that prices reflect all the available information and no abnormal returns can thus be earned
CHAPTER 7 FOREIGN EXCHANGE MARKET EFFICIENCY
 CHAPTER 7 FOREIGN EXCHANGE MARKET EFFICIENCY Chapter Overview This chapter has two major parts: the introduction to the principles of market efficiency and a review of the empirical evidence on efficiency
It is a market where current prices reflect/incorporate all available information.
 ECMC49S Market Efficiency Hypothesis Practice Questions Date: Mar 29, 2006 [1] How to define an efficient market? It is a market where current prices reflect/incorporate all available information. [2]
Institutional Finance Financial Crises, Risk Management and Liquidity
 Institutional Finance Financial Crises, Risk Management and Liquidity Markus K. Brunnermeier Preceptor: Delwin Olivan Princeton University 1 Overview Efficiency concepts EMH implies Martingale Property
A Balanced View of Storefront Payday Borrowing Patterns Results From a Longitudinal Random Sample Over 4.5 Years
 Report 7-C A Balanced View of Storefront Payday Borrowing Patterns Results From a Longitudinal Random Sample Over 4.5 Years A Balanced View of Storefront Payday Borrowing Patterns Results From a Longitudinal
An Introduction to Behavioral Finance
 Topics An Introduction to Behavioral Finance Efficient Market Hypothesis Empirical Support of Efficient Market Hypothesis Empirical Challenges to the Efficient Market Hypothesis Theoretical Challenges
COMM 324 INVESTMENTS AND PORTFOLIO MANAGEMENT ASSIGNMENT 2 Due: October 20
 COMM 34 INVESTMENTS ND PORTFOLIO MNGEMENT SSIGNMENT Due: October 0 1. In 1998 the rate of return on short term government securities (perceived to be risk-free) was about 4.5%. Suppose the expected rate
Liquidity skewness premium
 Liquidity skewness premium Giho Jeong, Jangkoo Kang, and Kyung Yoon Kwon * Abstract Risk-averse investors may dislike decrease of liquidity rather than increase of liquidity, and thus there can be asymmetric
Hedge Funds as International Liquidity Providers: Evidence from Convertible Bond Arbitrage in Canada
 Hedge Funds as International Liquidity Providers: Evidence from Convertible Bond Arbitrage in Canada Evan Gatev Simon Fraser University Mingxin Li Simon Fraser University AUGUST 2012 Abstract We examine
Chapter 6 Investment Analysis and Portfolio Management
 Chapter 6 Investment Analysis and Portfolio Management Frank K. Reilly & Keith C. Brown Part 2: INVESTMENT THEORY 6 Pasar Efisien 7 Mnj Portofolio Konsep RETURN, RISIKO, Investasi 9 Model Ret, Risiko 8
JACOBS LEVY CONCEPTS FOR PROFITABLE EQUITY INVESTING
 JACOBS LEVY CONCEPTS FOR PROFITABLE EQUITY INVESTING Our investment philosophy is built upon over 30 years of groundbreaking equity research. Many of the concepts derived from that research have now become
EQUITY RESEARCH AND PORTFOLIO MANAGEMENT
 EQUITY RESEARCH AND PORTFOLIO MANAGEMENT By P K AGARWAL IIFT, NEW DELHI 1 MARKOWITZ APPROACH Requires huge number of estimates to fill the covariance matrix (N(N+3))/2 Eg: For a 2 security case: Require
Derivation of zero-beta CAPM: Efficient portfolios
 Derivation of zero-beta CAPM: Efficient portfolios AssumptionsasCAPM,exceptR f does not exist. Argument which leads to Capital Market Line is invalid. (No straight line through R f, tilted up as far as
In this model, the value of the stock today is the present value of the expected cash flows (equal to one dividend payment plus a final sales price).
.") Money & Banking Notes Chapter 7 Stock Mkt., Rational Expectations, and Efficient Mkt. Hypothesis Computing the price of common stock: (i) Stockholders (those who hold or own stocks in a corporation) are
Money & Banking Notes Chapter 7 Stock Mkt., Rational Expectations, and Efficient Mkt. Hypothesis Computing the price of common stock: (i) Stockholders (those who hold or own stocks in a corporation) are
Economics of Money, Banking, and Fin. Markets, 10e
 Economics of Money, Banking, and Fin. Markets, 10e (Mishkin) Chapter 7 The Stock Market, the Theory of Rational Expectations, and the Efficient Market Hypothesis 7.1 Computing the Price of Common Stock
An Empirical Study of Serial Correlation in Stock Returns
 NORGES HANDELSHØYSKOLE An Empirical Study of Serial Correlation in Stock Returns Cause effect relationship for excess returns from momentum trading in the Norwegian market Maximilian Brodin and Øyvind
ARE LOSS AVERSION AFFECT THE INVESTMENT DECISION OF THE STOCK EXCHANGE OF THAILAND S EMPLOYEES?
 ARE LOSS AVERSION AFFECT THE INVESTMENT DECISION OF THE STOCK EXCHANGE OF THAILAND S EMPLOYEES? by San Phuachan Doctor of Business Administration Program, School of Business, University of the Thai Chamber
Stock Price Behavior. Stock Price Behavior
 Major Topics Statistical Properties Volatility Cross-Country Relationships Business Cycle Behavior Page 1 Statistical Behavior Previously examined from theoretical point the issue: To what extent can the
An analysis of momentum and contrarian strategies using an optimal orthogonal portfolio approach
 An analysis of momentum and contrarian strategies using an optimal orthogonal portfolio approach Hossein Asgharian and Björn Hansson Department of Economics, Lund University Box 7082 S-22007 Lund, Sweden
Cowles Foundation Paper 159
 Cowles Foundation Paper 159 Econometrica, Vol. 28, 4 (October 1960) A REVISION OF PREVIOUS CONCLUSIONS REGARDING STOCK PRICE BEHAVIOR BY ALFRED COWLES1 This paper reports results which verify the general
Growing Sector Momentum in Emerging Markets
 Growing Sector Momentum in Emerging Markets John Capeci, Ph.D. Managing Partner, Arrowstreet Capital, L.P. Marta Campillo, Ph.D. Partner, Arrowstreet Capital, L.P. April 2002 Introduction The increasing
Steve Monahan. Discussion of Using earnings forecasts to simultaneously estimate firm-specific cost of equity and long-term growth
 Steve Monahan Discussion of Using earnings forecasts to simultaneously estimate firm-specific cost of equity and long-term growth E 0 [r] and E 0 [g] are Important Businesses are institutional arrangements
CORPORATE ANNOUNCEMENTS OF EARNINGS AND STOCK PRICE BEHAVIOR: EMPIRICAL EVIDENCE
 CORPORATE ANNOUNCEMENTS OF EARNINGS AND STOCK PRICE BEHAVIOR: EMPIRICAL EVIDENCE By Ms Swati Goyal & Dr. Harpreet kaur ABSTRACT: This paper empirically examines whether earnings reports possess informational
Week 2 Quantitative Analysis of Financial Markets Hypothesis Testing and Confidence Intervals
 Week 2 Quantitative Analysis of Financial Markets Hypothesis Testing and Confidence Intervals Christopher Ting http://www.mysmu.edu/faculty/christophert/ Christopher Ting : christopherting@smu.edu.sg :
A Monte Carlo Measure to Improve Fairness in Equity Analyst Evaluation
 A Monte Carlo Measure to Improve Fairness in Equity Analyst Evaluation John Robert Yaros and Tomasz Imieliński Abstract The Wall Street Journal s Best on the Street, StarMine and many other systems measure
CABARRUS COUNTY 2008 APPRAISAL MANUAL
 STATISTICS AND THE APPRAISAL PROCESS PREFACE Like many of the technical aspects of appraising, such as income valuation, you have to work with and use statistics before you can really begin to understand
The Effect of Kurtosis on the Cross-Section of Stock Returns
 Utah State University DigitalCommons@USU All Graduate Plan B and other Reports Graduate Studies 5-2012 The Effect of Kurtosis on the Cross-Section of Stock Returns Abdullah Al Masud Utah State University
CHAPTER 11. The Efficient Market Hypothesis INVESTMENTS BODIE, KANE, MARCUS. Copyright 2011 by The McGraw-Hill Companies, Inc. All rights reserved.
 CHAPTER 11 The Efficient Market Hypothesis McGraw-Hill/Irwin Copyright 2011 by The McGraw-Hill Companies, Inc. All rights reserved. 11-2 Efficient Market Hypothesis (EMH) Maurice Kendall (1953) found no
Stock Market Behavior - Investor Biases
 Market Tips & Jargons Stock Market Behavior - Investor Biases Random Walk Theory Efficient Market Hypothesis Market Anomaly Investor s Behavioral Biases March 25, 2017 CBMC-RGTC Copyright 2014 Pearson
Risk and Return and Portfolio Theory
 Risk and Return and Portfolio Theory Intro: Last week we learned how to calculate cash flows, now we want to learn how to discount these cash flows. This will take the next several weeks. We know discount
Empirical Evidence. r Mt r ft e i. now do second-pass regression (cross-sectional with N 100): r i r f γ 0 γ 1 b i u i
: r i r f γ 0 γ 1 b i u i") Empirical Evidence (Text reference: Chapter 10) Tests of single factor CAPM/APT Roll s critique Tests of multifactor CAPM/APT The debate over anomalies Time varying volatility The equity premium puzzle
Empirical Evidence (Text reference: Chapter 10) Tests of single factor CAPM/APT Roll s critique Tests of multifactor CAPM/APT The debate over anomalies Time varying volatility The equity premium puzzle
Institutional Finance Financial Crises, Risk Management and Liquidity
 Institutional Finance Financial Crises, Risk Management and Liquidity Markus K. Brunnermeier Preceptor: Dong Beom Choi Princeton University 1 Overview Efficiency concepts EMH implies Martingale Property
The benefits of core-satellite investing
 The benefits of core-satellite investing Contents 1 Core-satellite: A powerful investment approach 3 The key benefits of indexing the portfolio s core 6 Core-satellite methodology Core-satellite: A powerful
Lectures 11 Foundations of Finance
 Lectures 11 Foundations of Finance Lecture 11: Futures and Forward Contracts: Valuation. I. Reading. II. Futures Prices. III. Forward Prices: Spot Forward Parity. Lecture 11: Market Efficiency I. Reading.
BEYOND SMART BETA: WHAT IS GLOBAL MULTI-FACTOR INVESTING AND HOW DOES IT WORK?
 INVESTING INSIGHTS BEYOND SMART BETA: WHAT IS GLOBAL MULTI-FACTOR INVESTING AND HOW DOES IT WORK? Multi-Factor investing works by identifying characteristics, or factors, of stocks or other securities
FE670 Algorithmic Trading Strategies. Stevens Institute of Technology
 FE670 Algorithmic Trading Strategies Lecture 4. Cross-Sectional Models and Trading Strategies Steve Yang Stevens Institute of Technology 09/26/2013 Outline 1 Cross-Sectional Methods for Evaluation of Factor
Revisiting Idiosyncratic Volatility and Stock Returns. Fatma Sonmez 1
 Revisiting Idiosyncratic Volatility and Stock Returns Fatma Sonmez 1 Abstract This paper s aim is to revisit the relation between idiosyncratic volatility and future stock returns. There are three key
CHAPTER 13 EFFICIENT CAPITAL MARKETS AND BEHAVIORAL CHALLENGES
 CHAPTER 13 EFFICIENT CAPITAL MARKETS AND BEHAVIORAL CHALLENGES Answers to Concept Questions 1. To create value, firms should accept financing proposals with positive net present values. Firms can create
REVIEW OF OVERREACTION AND UNDERREACTION IN STOCK MARKETS
 International Journal of Economics, Commerce and Management United Kingdom Vol. IV, Issue 12, December 2016 http://ijecm.co.uk/ ISSN 2348 0386 REVIEW OF OVERREACTION AND UNDERREACTION IN STOCK MARKETS
Comparison in Measuring Effectiveness of Momentum and Contrarian Trading Strategy in Indonesian Stock Exchange
 Comparison in Measuring Effectiveness of Momentum and Contrarian Trading Strategy in Indonesian Stock Exchange Rizky Luxianto* This paper wants to explore the effectiveness of momentum or contrarian strategy
CTAs: Which Trend is Your Friend?
 Research Review CAIAMember MemberContribution Contribution CAIA What a CAIA Member Should Know CTAs: Which Trend is Your Friend? Fabian Dori Urs Schubiger Manuel Krieger Daniel Torgler, CAIA Head of Portfolio
High Frequency Autocorrelation in the Returns of the SPY and the QQQ. Scott Davis* January 21, Abstract
 High Frequency Autocorrelation in the Returns of the SPY and the QQQ Scott Davis* January 21, 2004 Abstract In this paper I test the random walk hypothesis for high frequency stock market returns of two
Early evidence on the efficient market hypothesis was quite favorable to it. In recent
 Appendix to chapter 7 Evidence on the Efficient Market Hypothesis Early evidence on the efficient market hypothesis was quite favorable to it. In recent years, however, deeper analysis of the evidence
CHAPTER 6. Are Financial Markets Efficient? Copyright 2012 Pearson Prentice Hall. All rights reserved.
 CHAPTER 6 Are Financial Markets Efficient? Copyright 2012 Pearson Prentice Hall. All rights reserved. Chapter Preview Expectations are very important in our financial system. Expectations of returns, risk,
Value Investing in Thailand: The Test of Basic Screening Rules
 International Review of Business Research Papers Vol. 7. No. 4. July 2011 Pp. 1-13 Value Investing in Thailand: The Test of Basic Screening Rules Paiboon Sareewiwatthana* To date, value investing has been
Seasonal Analysis of Abnormal Returns after Quarterly Earnings Announcements
 Seasonal Analysis of Abnormal Returns after Quarterly Earnings Announcements Dr. Iqbal Associate Professor and Dean, College of Business Administration The Kingdom University P.O. Box 40434, Manama, Bahrain
CFA Level II - LOS Changes
 CFA Level II - LOS Changes 2017-2018 Ethics Ethics Ethics Ethics Ethics Ethics Ethics Ethics Ethics Topic LOS Level II - 2017 (464 LOS) LOS Level II - 2018 (465 LOS) Compared 1.1.a 1.1.b 1.2.a 1.2.b 1.3.a
DOES SECTOR ROTATION WORK?
 DOES SECTOR ROTATION WORK? What goes around comes around. - Proverb 2 There is a general market wisdom that certain sectors perform well and other sectors perform poorly during different points in the
Trading Volume and Stock Indices: A Test of Technical Analysis
 American Journal of Economics and Business Administration 2 (3): 287-292, 2010 ISSN 1945-5488 2010 Science Publications Trading and Stock Indices: A Test of Technical Analysis Paul Abbondante College of
Expected Return and Portfolio Rebalancing
 Expected Return and Portfolio Rebalancing Marcus Davidsson Newcastle University Business School Citywall, Citygate, St James Boulevard, Newcastle upon Tyne, NE1 4JH E-mail: davidsson_marcus@hotmail.com
LIQUIDITY EXTERNALITIES OF CONVERTIBLE BOND ISSUANCE IN CANADA
 LIQUIDITY EXTERNALITIES OF CONVERTIBLE BOND ISSUANCE IN CANADA by Brandon Lam BBA, Simon Fraser University, 2009 and Ming Xin Li BA, University of Prince Edward Island, 2008 THESIS SUBMITTED IN PARTIAL
Finance when no one believes the textbooks. Roy Batchelor Director, Cass EMBA Dubai Cass Business School, London
 Finance when no one believes the textbooks Roy Batchelor Director, Cass EMBA Dubai Cass Business School, London What to expect Your fat finance textbook A class test Inside investors heads Something about
Technical Tools Partnered With Other Methodologies. May 15, 2014 Adam Grimes, CIO, Waverly Advisors
 Technical Tools Partnered With Other Methodologies May 15, 2014 Adam Grimes, CIO, Waverly Advisors Outline: First principles: the market problem Understanding the market in terms of probabilities Approaches
Working Paper No The Market Efficiency of the Chinese A-B-share Market
 Working Paper No. 504 The Market Efficiency of the Chinese A-B-share Market by Sujiang Zhang September 2014 Stanford University John A. and Cynthia Fry Gunn Building 366 Galvez Street Stanford, CA 94305-6015
Premium Timing with Valuation Ratios
 RESEARCH Premium Timing with Valuation Ratios March 2016 Wei Dai, PhD Research The predictability of expected stock returns is an old topic and an important one. While investors may increase expected returns
Applying fundamental & technical analysis in stock investing
 Applying fundamental & technical analysis in stock investing 2017 Live demonstration of research and trading tools Develop an Ongoing Strategy with Fidelity Software and mobile apps to enhance your trading
LECTURE 3. Market Efficiency & Investment Valuation - EMH and Behavioral Analysis. The Quants Book Eugene Fama and Cliff Asnes
 Baruch College Executive MS in Financial Statement Analysis CHAPTER 6 (PARTIAL) LECTURE 3 Market Efficiency & Investment Valuation - EMH and Behavioral Analysis Professor s Notes Are markets efficient?????
Finance 527: Lecture 27, Market Efficiency V2
 Finance 527: Lecture 27, Market Efficiency V2 [John Nofsinger]: Welcome to the second video for the efficient markets topic. This is gonna be sort of a real life demonstration about how you can kind of
Expectations are very important in our financial system.
 Chapter 6 Are Financial Markets Efficient? Chapter Preview Expectations are very important in our financial system. Expectations of returns, risk, and liquidity impact asset demand Inflationary expectations
STRATEGY OVERVIEW. Opportunistic Growth. Related Funds: 361 U.S. Small Cap Equity Fund (ASFZX)
") STRATEGY OVERVIEW Opportunistic Growth Related Funds: 361 U.S. Small Cap Equity Fund (ASFZX) Strategy Thesis The thesis driving 361 s traditional long-only equity strategies is based on the belief that
STRATEGY OVERVIEW Opportunistic Growth Related Funds: 361 U.S. Small Cap Equity Fund (ASFZX) Strategy Thesis The thesis driving 361 s traditional long-only equity strategies is based on the belief that
Cascades in Experimental Asset Marktes
 Cascades in Experimental Asset Marktes Christoph Brunner September 6, 2010 Abstract It has been suggested that information cascades might affect prices in financial markets. To test this conjecture, we
Building Portfolios with Active, Strategic Beta and Passive Strategies
 Building Portfolios with Active, Strategic Beta and Passive Strategies It s a Question of Beliefs Issues to think about on the Active/Passive spectrum: How important are fees to you? Do you believe markets
Underreaction, Trading Volume, and Momentum Profits in Taiwan Stock Market
 Underreaction, Trading Volume, and Momentum Profits in Taiwan Stock Market Mei-Chen Lin * Abstract This paper uses a very short period to reexamine the momentum effect in Taiwan stock market, focusing
COLLECTIVE INTELLIGENCE A NEW APPROACH TO STOCK PRICE FORECASTING
 COLLECTIVE INTELLIGENCE A NEW APPROACH TO STOCK PRICE FORECASTING CRAIG A. KAPLAN Proceedings of the 2001 IEEE Systems, Man, and Cybernetics Conference iq Company (www.iqco.com Abstract A group that makes
CFA Level II - LOS Changes
 CFA Level II - LOS Changes 2018-2019 Topic LOS Level II - 2018 (465 LOS) LOS Level II - 2019 (471 LOS) Compared Ethics 1.1.a describe the six components of the Code of Ethics and the seven Standards of
Further Test on Stock Liquidity Risk With a Relative Measure
 International Journal of Education and Research Vol. 1 No. 3 March 2013 Further Test on Stock Liquidity Risk With a Relative Measure David Oima* David Sande** Benjamin Ombok*** Abstract Negative relationship
Passive vs. Active Management in Singapore and Beyond
 Passive vs. Active Management in Singapore and Beyond Why Exchange Traded Funds (ETFs) provide time-tested advantages over actively managed funds in Singapore and beyond. EXECUTIVE SUMMARY Passive management,
Technical Anomalies: A Theoretical Review
 Malaysian Journal of Business and Economics Vol. 1, No. 1, June 2014, 103 110 ISSN 2289-6856 Kok Sook Ching a*, Qaiser Munir a and Arsiah Bahron a a Faculty of Business, Economics and Accountancy, Universiti
EARNINGS MOMENTUM STRATEGIES. Michael Tan, Ph.D., CFA
 EARNINGS MOMENTUM STRATEGIES Michael Tan, Ph.D., CFA DISCLAIMER OF LIABILITY AND COPYRIGHT NOTICE The material in this document is copyrighted by Michael Tan and Apothem Capital Management, LLC for which
Focused Funds How Do They Perform in Comparison with More Diversified Funds? A Study on Swedish Mutual Funds. Master Thesis NEKN
 Focused Funds How Do They Perform in Comparison with More Diversified Funds? A Study on Swedish Mutual Funds Master Thesis NEKN01 2014-06-03 Supervisor: Birger Nilsson Author: Zakarias Bergstrand Table
Advanced Corporate Finance. 7. Investor behavior and capital market efficiency
 Advanced Corporate Finance 7. Investor behavior and capital market efficiency Objectives of the session 1. So far => analysis of company value, of projects and of derivatives. Intuitively => Important
Managers who primarily exploit mispricings between related securities are called relative
 Relative Value Managers who primarily exploit mispricings between related securities are called relative value managers. As argued above, these funds take on directional bets on more alternative risk premiums,