Why do people stay poor? Oriana Bandiera with Clare Balboni, Robin Burgess, Maitreesh Ghatak and Anton Heil LSE
|
|
|
- Kellie Wilkerson
- 5 years ago
- Views:
Transcription
1 Why do people stay poor? Oriana Bandiera with Clare Balboni, Robin Burgess, Maitreesh Ghatak and Anton Heil LSE
2 Poverty has been decreasing but is still high in SSA and SA mio mio 3.0 mio 26.8 mio 3.3 mio 2.3 mio
3 These are the regions where population growth will be fastest
4 Eradicate extreme poverty by 2030 (SDG1)? Need to address the stubborn poverty problem: a lot of poor people are left behind even as countries grow. We need to understand why people stay poor in order to design policies that lift the poorest out of poverty
5 Poverty: consumption below poverty line Consumption Transfers Earnings

6 Policy tools tackle one of the two components Policy tools Consumption social assistance /protection training, credit, transfers Transfers Earnings

7 Most countries spend a large % of GDP in social protection

8 But expenditure per capita is lowest in the poorest regions
9 Can we increase labor earnings instead? Policies aim to improve productivity within occupation & access to better occupations via credit training grants We need to understand why people stay poor to assess whether these programs can be effective
10 Two views of why people stay poor Equal access to opportunity, different traits People have different innate traits which determine their standard of living Unequal access to opportunity, same traits People have different access to opportunity which determines their standards of living Initial endowments do not matter, allocation of talent is efficient Social protection programs Initial endowments matter, talent is misallocated Large asset/skill transfers
11 This lecture 1. Use theory to illustrate how response to exogenous shock to capital can be used to test between the two views of poverty 2. Implement test using RCT in Bangladesh (Bandiera et al., 2017) tracking 23k HHs across wealth distribution over 7 years 3. Inform the design of policies for poverty reduction
12 Setting Setting

13 Study site map Monga region: a lack of demand for casual wage labor, higher grain prices, extreme poverty and food insecurity
14 Data 23K households surveyed 4 times (07,09,11,14) labor market activities productive assets 4 wealth classes, ranked by the community
 Domestic Maid Agriculture day labor Ultra Poor Near Poor Middle Class Upper")
15 Three jobs account for most hours worked & occupation is correlated with wealth class Share of time devoted to different occupations Other Livestock rearing (cows/goats) Domestic Maid Agriculture day labor Ultra Poor Near Poor Middle Class Upper Class
16 Jobs Wage labor is uncertain, seasonal and pays less per hour Occupation correlated with ownership of productive assets (k): livestock, business assets (rickshaws, boats, sheds, agricultural machinery etc.) and land Asset holdings stable through time In this setting, physical capital is likely to drive any potential trap, in other settings it might be human capital
17 The poor have fewer assets and don t accumulate over time Log productive assets in 07,09,11
18 Setting Framework
19 Make precise the assumptions underpinning the two views of why people stay poor Equal access to opportunity, different traits Unequal access to opportunity, same traits People have different innate traits which determine their standard of living People have different access to opportunity which determines their standards of living DRS to factors that can be accumulated Perfect credit markets IRS to factors that can be accumulated Imperfect credit markets
20 Occupational choice under the two views Each person i is born with one unit of time, wealth endowment E i and talent A ij for occupation j = 1,2 1 is wage labor, pays w 2 is livestock rearing, requires capital K and yields A i2 f(k) Assume A i1 = 1 for all i s, A i2 can differ among people, call it A i to simplify
21 Perfect credit markets +DRS equal opportunities Everybody faces the same cost of capital r, f(k) is concave Individual i chooses K to maximise A i f K i rk i s. t. K i 0 This yields the standard FOC A i f K i threshold A s.t. A i < A choose K = 0 = r A i > A choose K i > 0, increasing in A i Endowments do not matter (with perfect credit markets nonconvexities can be overcome by borrowing) All individuals with K i = 0 have A < A
22 y = max{w, Af k } y = w 0 k(a*) K
23 No credit markets poverty trap? Without credit markets individual i chooses K, to maximise A i f K i rk i s. t. E i K i 0 Now A i f K i r = 0 for K i < E i and A i f K i r > 0 for K i > E i In a model with savings, individuals can save their way out of poverty as small investments at low K have high returns That is, as long as f(.) is concave, credit market imperfections cannot generate a trap
24 IRS at low K increase the minimum viable scale y y = max{w, Af k } y = w 0 k(a*) k(a*) K
25 No credit markets + convexity poverty trap We now have two groups of people for given talent A: those for whom E i > K(A i ) same as in previous world those for whom E i < K(A i ) stuck in low earnings occupation, K = 0 endowments matter some people with K = 0 actually have A > A
26 Setting Test
27 We use BRAC s Targeting the Ultrapoor Program K shock: Asset transfer worth 1 year of PCE 4k HHs received the program at the same time By design all get a package of similar value But they start with different assets at baseline
28 We test the joint H0 that (i) there is a threshold and (ii) the program pushes some above and leaves others below k t+1 = saf k t + 1 δ k t k t 1 k t 1 k t Compare person A with person B Both receive transfer of size Transfer sends A below and B above k A reverts back towards low steady state, k L B escapes poverty and ends up at high steady state, k H Δ Δ k L k 0 A k 0 B k k H k t
29 Preliminary evidence 2 years after the transfer 4 years after the transfer 7 years after the transfer k
30 Identifying the threshold Level of k such that those below fall back into poverty and those above escape This is identified by: estimating the transition equation for K finding the point, if any where it crosses the 45 line from below Note: this estimates an average threshold In progress: structural estimates of individual thresholds
31 The transition equation k t+1 = saf k t + 1 δ k t k t 1 find this point k t 1 k t Δ Δ k L k 0 A k 0 B k k H k t
32 Non-parametric identification k =2.34
33 Parametric identification k =2.36 k =2.34
34 Is this really a poverty trap? Identification exploits differences in baseline assets These could be correlated with 1. traits e.g. talent- that determine the return to K - the estimated k^ is an average of different thresholds - no guarantee that people below it would be able to escape poverty had they been given enough 2. shocks that drive capital accumulation
35 Four tests We present four tests to assess whether the patterns we observe can be explained by shocks or differences in talent/preferences correlated with baseline assets
36 Setting 1. Missing Mass Test

37 Missing mass around the threshold in CONTROL villages k =2.34

38 But A is unimodal
39 2. Sorting test
40 Sorting when A is uncorrelated with k0 2 types of k0: low and high 4 As in each type before transfer both types are in wage labor y y(a4) y(a3) w y(a1) y(a2) after the transfer, only the brightest of low (A4) but almost all of the high move to livestock 0 k_l k_h k_l+t k_h+t K
41 Sorting when A is correlated with k0 2 types of k0: low and high y A4 A3 low has A1-2, high has A3-4 A2 before transfer both types are in wage labor y = w A1 after the transfer, none of the low but all of the high types move to livestock 0 k_l k_h k_l+t k_h+t K
42 Implications of cov(k0,a)=0 (vs cov(k0,a)>0) 1. The number of switchers is monotonically increasing in k (flat with a discrete jump) 2. The average A for switchers is decreasing in k0 (increasing) 3. The max A for switchers is decreasing in k0 (increasing)
43 1. Number of switchers is monotonically increasing

44 hourly returns to livestock 2. Average productivity of switchers is decreasing baseline assets (k0)
45 3. Max productivity of switchers is not increasing baseline assets (k0)
46 Implications of cov(k0,a)=0 (vs cov(k0,a)>0) 1. The number of switchers is monotonically increasing in k (flat with a discrete jump) 2. The average A for switchers is decreasing in k0 (increasing) 3. The max A for switchers is decreasing in k0 (increasing)
47 Setting 3. Responses to K transfer test
48 Response to asset transfer in equal opportunity view k t 1 k t 1 k t k t+1 = saf k t + 1 δ k t Δ 1 A > 0 Δ 1 B < 0 Δ Transfer (by design the same) Δ 1 Change after Transfer (Varies depending on k 0 ) 0 Δ Δ Δ k 0 A k 0 A + Δ k 0 B + Δ k 1 A k k 1 B k 0 B k t
49 Response to asset transfer in equal opportunity view Δ 1 poorer people more likely to accumulate K 0 k k t
50 Response to asset transfer in unequal opportunity view k t 1 k t+1 = saf k t + 1 δ k t k t 1 k t Δ Δ Δ 0 k 0 A k 0 B k k 0 C = k k t
51 Response to asset transfer in unequal opportunity view Δ 1 poorer people less likely to accumulate K 0 k L k k H k t

52 Response to asset transfer in data
 in 2007")
53 Change in assets ( ) Response to asset transfer in data, allowing for discontinuty People above k accumulate more assets, at a decreasing rate People below k lose assets an an increasing rate k Productive assets (k) in transfer
54 Setting Shocks?
55 Measuring shocks If controls are in steady state, any changes in assets must be due to shocks we use data from controls 1. to test whether shocks can explain the pattern of asset accumulation we see in treatment 2. to adjust for shocks
56 Shocks (blue) cannot explain the distribution of changes in treatment (red)
57 Adjust for shocks We rank beneficiaries by their assets+transfer value We compute the average shock of controls at similar levels of assets (20 windows) Under the assumption that people with similar asset value receive similar shocks we can use shocks experienced by controls to adjust the beneficiaries responses
58 Changes in assets with shock adjustment (green)
59 Setting 4. Changes in observed traits around the threshold

60 Per-adult equivalent annual food expenditure at baseline Nutrition Per-adult equivalent annual food expenditure capital at baseline Sample restricted to 3390 treated ultra-poor Threshold at

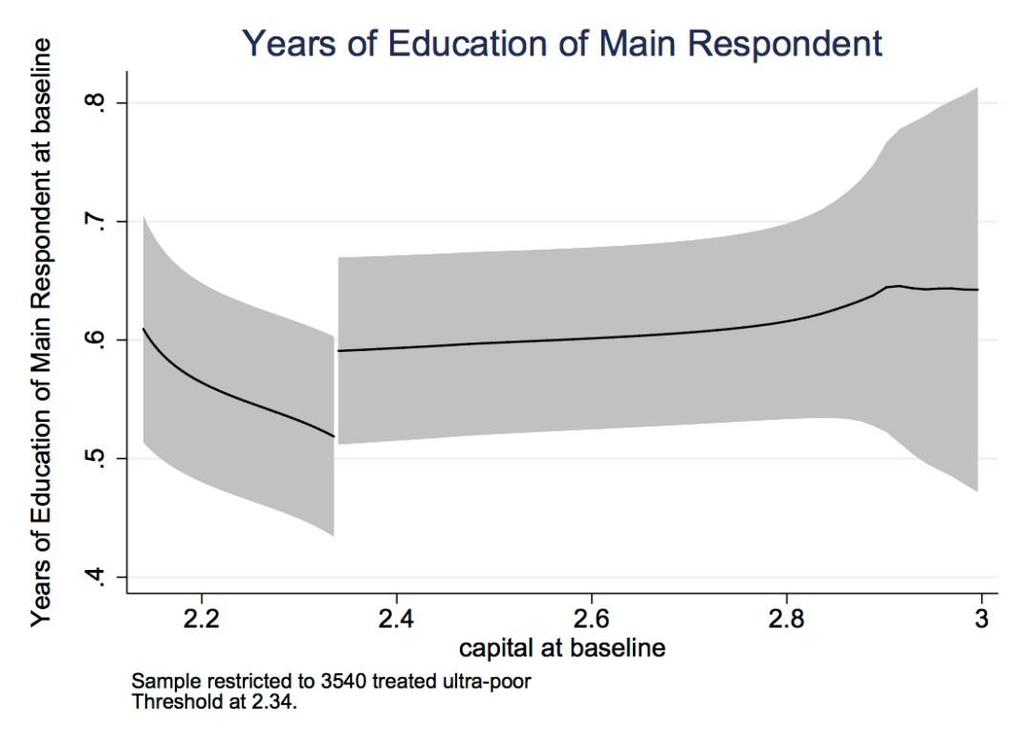
61 Human capital
62 Behavioral 1: impatience

63 Behavioral 1: impatience Suppose you have won 200 taka in a game. You can get this 200 taka today or get 250 taka instead in one month. Which one would you prefer? 1) 200 taka today 2) 250 taka in one month
 100 for winning, 100 for losing 2) 200 for winning, 60 for losing 3) 300 for winning, 20 for")
64 Behavioral 2: risk aversion Which payoff would you prefer? 1) 100 for winning, 100 for losing 2) 200 for winning, 60 for losing 3) 300 for winning, 20 for losing 4) 400 for winning, 0 for losing
65 Setting Mechanisms
66 Technology Why can t the poor get past k on their own? Recall: need IRS and no credit markets We know they cannot borrow and that they have negligible savings Evidence for IRS: fixed factors/ indivisibilities
67 Asset composition differs: fewer chickens 20% DROP
68 More business assets (esp rickshaws and boats) 20% HIKE
69 Taking stock Beneficiaries who do not start with complementary inputs regress back to poverty despite the large transfers Those who do are elevated above the threshold and set on a sustainable path out of poverty They save and invest year after year They diversify into assets (e.g. land) that were not transferred by the program
70 Setting Policy
71 Policy implications The existence of a poverty threshold implies that only transfers large enough to push beneficiaries past the threshold will reduce poverty in the long run Smaller transfers might increase consumption for a short period but will have no long lasting effects BRAC asset transfer worth $515 (.88 of PCE) was enough for 66% of beneficiaries Micro-loans are typically <$200
72 The evidence in one slide Microfinance is cheap (even profitable) but ineffective at allowing access to more remunerative occupations (Meager 18, Banerjee et al 15) Vocational training programs typically have low take up if not they are effective, but expensive (McKenzie 17, Alfonsi et al 18) Large assets & cash grants are effective at promoting occupational change, but expensive (Banerjee et al 15, Blattman et al 14,16, Bandiera et al 17)
73 A big problem requires a big solution k
74 Microloan 100 $ PPP NREGA Microloan 200 $ PPP Pakistan* Ghana* Peru* India* Honduras* Blattman et al. (2014) A big problem requires a big solution k Alternative Policies: * Country names refer to study sites in Banerjee et al. (2015)
75 thank you
Networks and Poverty Reduction Programmes
 ntro Program Method UP Direct ndirect Conclusion Community Networks and Poverty Reduction Programmes Evidence from Bangladesh Oriana Bandiera (LSE), Robin Burgess (LSE), Selim Gulesci (LSE), mran Rasul
Working with the ultra-poor: Lessons from BRAC s experience
 Working with the ultra-poor: Lessons from BRAC s experience Munshi Sulaiman, BRAC International and LSE in collaboration with Oriana Bandiera (LSE) Robin Burgess (LSE) Imran Rasul (UCL) and Selim Gulesci
ECON 6022B Problem Set 1 Suggested Solutions Fall 2011
 ECON 6022B Problem Set Suggested Solutions Fall 20 September 5, 20 Shocking the Solow Model Consider the basic Solow model in Lecture 2. Suppose the economy stays at its steady state in Period 0 and there
Labor-Tying and Poverty in a Rural Economy
 ntro Program Theory Empirics Results Conclusion Evidence from Bangladesh (LSE) EDePo Workshop, FS 17 November 2010 ntro Program Theory Empirics Results Conclusion Motivation Question Method Findings Literature
The evidence on Graduation programmes
 DEVELOPMENT The evidence on Graduation programmes Stephen Kidd 27 th June 2016 Are Graduation programmes social protection? No! They provide regular and predictable transfers for only around 10 months,
). In Ch. 9, when we add technological progress, k is capital per effective worker (k = K
. In Ch. 9, when we add technological progress, k is capital per effective worker (k = K") Economics 285 Chris Georges Help With Practice Problems 3 Chapter 8: 1. Questions For Review 1,4: Please see text or lecture notes. 2. A note about notation: Mankiw defines k slightly differently in Chs.
Economics 285 Chris Georges Help With Practice Problems 3 Chapter 8: 1. Questions For Review 1,4: Please see text or lecture notes. 2. A note about notation: Mankiw defines k slightly differently in Chs.
The Design of Social Protection Programs for the Poor:
 The Design of Social Protection Programs for the Poor: In-Kind Asset Transfers versus Unconditional Cash Transfers Imran Rasul, Orazio Attanasio [UCL] Oriana Bandiera, Robin Burgess, Adnan Qadir Khan [LSE]
The Long term Impacts of a Graduation Program: Evidence from West Bengal
 The Long term Impacts of a Graduation Program: Evidence from West Bengal Abhijit Banerjee, Esther Duflo, Raghabendra Chattopadhyay, and Jeremy Shapiro September 2016 Abstract This note reports on the long
Development Economics Part II Lecture 7
 Development Economics Part II Lecture 7 Risk and Insurance Theory: How do households cope with large income shocks? What are testable implications of different models? Empirics: Can households insure themselves
Evaluation of TUP in Pakistan Midline Results
 Evaluation of TUP in Pakistan Midline Results 1. Introduction This briefcase presents the intermediary results of the impact evaluation of Targeting the Ultra Poor (TUP) in Pakistan. TUP project is the
Shall we play a game? Solow growth model Steady state Break-even investment Rule of 70 Depreciation Dilution
 National Income & Business Cycles Why growth matters? Learn the closed economy Solow model See how a country s standard of living depends on its saving and population growth rates Importance of productivity
Building Household Resilience through Productive Inclusion. Carlo del Ninno, Thomas Bossuroy, Patrick Premand, World Bank
 Building Household Resilience through Productive Inclusion Carlo del Ninno, Thomas Bossuroy, Patrick Premand, World Bank Adaptive Social Protection (ASP) 1) Build household resilience, ex ante Household
Lifting People Out of Extreme Poverty through a Comprehensive Integrated Approach
 Lifting People Out of Extreme Poverty through a Comprehensive Integrated Approach Expert Group Meeting UNDESA June 2016 What is BRAC? BRAC is a development success story spreading anti-poverty solutions
Activation and Graduation of Social Assistance Beneficiaries in Developing Countries Istanbul
 Activation and Graduation of Social Assistance Beneficiaries in Developing Countries Istanbul May 1, 2012 Activation and graduation: semantics Both imply pro-active strategies The ultimate goal is to improve
Microfinance Demonstration of at the bottom of pyramid theory Dipti Kamble
 Microfinance Demonstration of at the bottom of pyramid theory Dipti Kamble MBA - I, Finance What is Microfinance? Microfinance is the supply of loans, savings, and other basic financial services to the
Financial markets in developing countries (rough notes, use only as guidance; more details provided in lecture) The role of the financial system
 The role of the financial system") Financial markets in developing countries (rough notes, use only as guidance; more details provided in lecture) The role of the financial system matching savers and investors (otherwise each person needs
Financial markets in developing countries (rough notes, use only as guidance; more details provided in lecture) The role of the financial system matching savers and investors (otherwise each person needs
The Solow Growth Model
 The Solow Growth Model Seyed Ali Madanizadeh Sharif U. of Tech. April 25, 2017 Seyed Ali Madanizadeh Sharif U. of Tech. () The Solow Growth Model April 25, 2017 1 / 46 Economic Growth Facts 1 In the data,
POVERTY, GROWTH, AND PUBLIC TRANSFERS IN TANZANIA PROGRESS REPORT ON THE NATIONAL SAFETY NET STUDY
 POVERTY, GROWTH, AND PUBLIC TRANSFERS IN TANZANIA PROGRESS REPORT ON THE NATIONAL SAFETY NET STUDY Preliminary Presentation Poverty Week December 2010 OBJECTIVES AND OUTPUTS How can Tanzania get maximum
The Ramsey Model. Lectures 11 to 14. Topics in Macroeconomics. November 10, 11, 24 & 25, 2008
 The Ramsey Model Lectures 11 to 14 Topics in Macroeconomics November 10, 11, 24 & 25, 2008 Lecture 11, 12, 13 & 14 1/50 Topics in Macroeconomics The Ramsey Model: Introduction 2 Main Ingredients Neoclassical
The Macroeconomics of Microfinance
 The Macroeconomics of Microfinance Francisco Buera 1 Joseph Kaboski 2 Yongseok Shin 3 1 Federal Reserve Bank of Minneapolis, UCLA & NBER 2 University of Notre Dame & NBER 3 Wash U St. Louis & St. Louis
II. Comparing Levels Of Development
 II. Comparing Levels Of Development Countries are unequally endowed with natural resources. For example, some countries benefit from fertile agricultural soils, while others have to put a lot of effort
Graduation models for the extreme poor: Evidence from a food assistance program in Juba
 Graduation models for the extreme poor: Evidence from a food assistance program in Juba Munshi Sulaiman BRAC, LSE August 05, 2010 1 / 24 1 Introducing BRAC 2 Basic premises Food transfer as the entry point
LECTURE 5 The Effects of Fiscal Changes: Aggregate Evidence. September 19, 2018
 Economics 210c/236a Fall 2018 Christina Romer David Romer LECTURE 5 The Effects of Fiscal Changes: Aggregate Evidence September 19, 2018 I. INTRODUCTION Theoretical Considerations (I) A traditional Keynesian
WEALTH AND VOLATILITY
 WEALTH AND VOLATILITY Jonathan Heathcote Minneapolis Fed Fabrizio Perri University of Minnesota and Minneapolis Fed EIEF, July 2011 Features of the Great Recession 1. Large fall in asset values 2. Sharp
Lecture Notes 1: Solow Growth Model
 Lecture Notes 1: Solow Growth Model Zhiwei Xu (xuzhiwei@sjtu.edu.cn) Solow model (Solow, 1959) is the starting point of the most dynamic macroeconomic theories. It introduces dynamics and transitions into
Development Economics: Macroeconomics
 MIT OpenCourseWare http://ocw.mit.edu 14.772 Development Economics: Macroeconomics Spring 2009 For information about citing these materials or our Terms of Use, visit: http://ocw.mit.edu/terms. Wealth
Poverty eradication through self-employment and livelihoods development: the role of microcredit and alternatives to credit
 Poverty eradication through self-employment and livelihoods development: the role of microcredit and alternatives to credit United Nations Expert Group Meeting: Strategies for Eradicating Poverty June
macro macroeconomics Economic Growth I Economic Growth I I (chapter 7) N. Gregory Mankiw
 N. Gregory Mankiw") macro Topic CHAPTER 4: SEVEN I (chapter 7) macroeconomics fifth edition N. Gregory Mankiw PowerPoint Slides by Ron Cronovich 2002 Worth Publishers, all rights reserved (ch. 7) Chapter 7 learning objectives
macro Topic CHAPTER 4: SEVEN I (chapter 7) macroeconomics fifth edition N. Gregory Mankiw PowerPoint Slides by Ron Cronovich 2002 Worth Publishers, all rights reserved (ch. 7) Chapter 7 learning objectives
Food Prices Vulnerability and Social Protection Responses
 Food Prices Vulnerability and Social Protection Responses Increased vulnerability and a typology of responses Ian Walker Lead Social Protection Specialist June 2008 1 Food price crisis: a shock transition
Ultra-Poor Graduation Approach
 Ultra-Poor Graduation Approach Syed M Hashemi May 2017 ABOUT BRAC WHERE WE WORK Founded in 1972 in Bangladesh, today BRAC is one of the largest development organizations in the world with 110,000+ staff
Testing the predictions of the Solow model:
 Testing the predictions of the Solow model: 1. Convergence predictions: state that countries farther away from their steady state grow faster. Convergence regressions are designed to test this prediction.
Graduation models for the extreme poor: Evidence from BRAC s programs in Bangladesh and Southern Sudan
 Graduation models for the extreme poor: Evidence from BRAC s programs in Bangladesh and Southern Sudan Munshi Sulaiman BRAC, LSE September 03, 2010 1 / 16 Background on BRAC s approach for the extreme
What is So Bad About Inequality? What Can Be Done to Reduce It? Todaro and Smith, Chapter 5 (11th edition)
") What is So Bad About Inequality? What Can Be Done to Reduce It? Todaro and Smith, Chapter 5 (11th edition) What is so bad about inequality? 1. Extreme inequality leads to economic inefficiency. - At a
What is So Bad About Inequality? What Can Be Done to Reduce It? Todaro and Smith, Chapter 5 (11th edition) What is so bad about inequality? 1. Extreme inequality leads to economic inefficiency. - At a
Economic Growth I Macroeconomics Finals
 Economic Growth I Macroeconomics Finals Introduction and the Solow growth model Martin Ellison Nuffield College Hilary Term 2016 The Wealth of Nations Performance of economy over many years Growth a recent
Roy Model of Self-Selection: General Case
 V. J. Hotz Rev. May 6, 007 Roy Model of Self-Selection: General Case Results drawn on Heckman and Sedlacek JPE, 1985 and Heckman and Honoré, Econometrica, 1986. Two-sector model in which: Agents are income
Lecture 5: Growth Theory
 Lecture 5: Growth Theory See Barro Ch. 3 Trevor Gallen Spring, 2015 1 / 60 Production Function-Intro Q: How do we summarize the production of five million firms all taking in different capital and labor
Write your identification number on each paper and cover sheet (the number stated in the upper right hand corner on your exam cover).
.") Department of Economics Course name: Course code: Development Economics EC7310 Examiner: Jakob Svensson Number of credits: 7,5 credits Date of exam: Wednesday 28 October 2015 Examination time: 3 hours
Department of Economics Course name: Course code: Development Economics EC7310 Examiner: Jakob Svensson Number of credits: 7,5 credits Date of exam: Wednesday 28 October 2015 Examination time: 3 hours
IN THIS LECTURE, YOU WILL LEARN:
 IN THIS LECTURE, YOU WILL LEARN: the closed economy Solow model how a country s standard of living depends on its saving and population growth rates how to use the Golden Rule to find the optimal saving
14.74 Foundations of Development Policy Spring 2009
 MIT OpenCourseWare http://ocw.mit.edu 14.74 Foundations of Development Policy Spring 2009 For information about citing these materials or our Terms of Use, visit: http://ocw.mit.edu/terms. Challenges of
Open Economy Macroeconomics: Theory, methods and applications
 Open Economy Macroeconomics: Theory, methods and applications Econ PhD, UC3M Lecture 9: Data and facts Hernán D. Seoane UC3M Spring, 2016 Today s lecture A look at the data Study what data says about open
Chapter 8 Economic Growth I: Capital Accumulation and Population Growth
 Chapter 8 Economic Growth I: Capital Accumulation and Population Growth Modified by Yun Wang Eco 3203 Intermediate Macroeconomics Florida International University Summer 2017 2016 Worth Publishers, all
MACROECONOMICS. Economic Growth I: Capital Accumulation and Population Growth MANKIW. In this chapter, you will learn. Why growth matters
 C H A P T E R 7 Economic Growth I: Capital Accumulation Population Growth MACROECONOMICS N. GREGORY MANKIW 2007 Worth Publishers, all rights reserved SIXTH EDITION PowerPoint Slides by Ron Cronovich In
Lecture Notes - Insurance
 1 Introduction need for insurance arises from Lecture Notes - Insurance uncertain income (e.g. agricultural output) risk aversion - people dislike variations in consumption - would give up some output
ECON 1100 Global Economics (Fall 2013) The Distribution Function of Government portions for Exam 3
 The Distribution Function of Government portions for Exam 3") ECON Global Economics (Fall 23) The Distribution Function of Government portions for Exam 3 Relevant Readings from the Required Textbooks: Economics Chapter 2, Income Distribution and Poverty Problems
ECON Global Economics (Fall 23) The Distribution Function of Government portions for Exam 3 Relevant Readings from the Required Textbooks: Economics Chapter 2, Income Distribution and Poverty Problems
Econ 219B Psychology and Economics: Applications (Lecture 6)
") Econ 219B Psychology and Economics: Applications (Lecture 6) Stefano DellaVigna February 28, 2007 Outline 1. Reference Dependence: Disposition Effect 2. Reference Dependence: Equity Premium 3. Reference
Econ 219B Psychology and Economics: Applications (Lecture 6) Stefano DellaVigna February 28, 2007 Outline 1. Reference Dependence: Disposition Effect 2. Reference Dependence: Equity Premium 3. Reference
Inflation. David Andolfatto
 Inflation David Andolfatto Introduction We continue to assume an economy with a single asset Assume that the government can manage the supply of over time; i.e., = 1,where 0 is the gross rate of money
ECN101: Intermediate Macroeconomic Theory TA Section
 ECN101: Intermediate Macroeconomic Theory TA Section (jwjung@ucdavis.edu) Department of Economics, UC Davis November 4, 2014 Slides revised: November 4, 2014 Outline 1 2 Fall 2012 Winter 2012 Midterm:
Economic Growth: Extensions
 Economic Growth: Extensions 1 Road Map to this Lecture 1. Extensions to the Solow Growth Model 1. Population Growth 2. Technological growth 3. The Golden Rule 2. Endogenous Growth Theory 1. Human capital
Targeting the Ultra Poor in Ghana. Abhijit Banerjee December 9, 2015
 Targeting the Ultra Poor in Ghana Abhijit Banerjee December 9, 2015 1 Why Evaluate? What is the impact of the Graduation model on the ultra poor? Impact evaluation measures: How have the lives of clients
ECON 256: Poverty, Growth & Inequality. Jack Rossbach
 ECON 256: Poverty, Growth & Inequality Jack Rossbach Plan for Semester: Two parts (split around spring break) Part I: Measurement and background Links between Poverty, Growth & Inequality Measurement:
bulletin b u i l d i n g s ta b l e l i v e l i h o o d s f o r t h e u lt r a - p o o r
 bulletin policy bulletin september 2015 b u i l d i n g s ta b l e l i v e l i h o o d s f o r t h e u lt r a - p o o r A multifaceted livelihood program that provided ultra-poor households with a productive
A multifaceted program causes lasting progress for the very poor: Evidence from six countries
 A multifaceted program causes lasting progress for the very poor: Evidence from six countries The MIT Faculty has made this article openly available. Please share how this access benefits you. Your story
WHAT WILL IT TAKE TO ERADICATE EXTREME POVERTY AND PROMOTE SHARED PROSPERITY?
 WHAT WILL IT TAKE TO ERADICATE EXTREME POVERTY AND PROMOTE SHARED PROSPERITY? Pathways to poverty reduction and inclusive growth Ana Revenga Senior Director Poverty and Equity Global Practice February
Booms and Busts in Segmented Asset Markets
 Booms and Busts in Segmented Asset Markets Martin Schneider FRB Minneapolis, NYU & NBER Motivation Large price movements in US stock, housing markets in last 10 years. Lack of diversification. Large changes
Testing the predictions of the Solow model: What do the data say?
 Testing the predictions of the Solow model: What do the data say? Prediction n 1 : Conditional convergence: Countries at an early phase of capital accumulation tend to grow faster than countries at a later
Road Map to this Lecture
 Economic Growth 1 Road Map to this Lecture 1. Steady State dynamics: 1. Output per capita 2. Capital accumulation 3. Depreciation 4. Steady State 2. The Golden Rule: maximizing welfare 3. Total Factor
Nutrition and productivity
 Nutrition and productivity Abhijit Banerjee Department of Economics, M.I.T. 1 A simple theory of nutrition and productivity The capacity curve (fig 1) The capacity curve: It relates income and work capacity
Are the Poorest Being Left Behind? Reconciling Conflicting Views on Poverty and Growth
 ILO Seminar March 24 2015 Are the Poorest Being Left Behind? Reconciling Conflicting Views on Poverty and Growth Martin Ravallion 1 A widely held view: The poorest of the world are being left behind. We
Role of Micro Finance in Poverty Reduction
 Role of Micro Finance in Poverty Reduction Preeti Sharma M.com student B.P.S.M University Khanpur kalan (Sonipat) Haryana, India Abstract: Micro finance has proven to be an effective tool for poverty reduction.
Directed Search and the Futility of Cheap Talk
 Directed Search and the Futility of Cheap Talk Kenneth Mirkin and Marek Pycia June 2015. Preliminary Draft. Abstract We study directed search in a frictional two-sided matching market in which each seller
What is Inclusive growth?
 What is Inclusive growth? Tony Addison Miguel Niño Zarazúa Nordic Baltic MDB meeting Helsinki, Finland January 25, 2012 Why is economic growth important? Economic Growth to deliver sustained poverty reduction
Brazil. Poverty profile. Country profile. Country profile. November
 Brazil Country profile Country profile 16 November www.devinit.org/pi This country profile is produced by Development Initiatives to support the National Dialogue on the 3 Agenda for Sustainable Development.
Achieving Actuarial Balance in Social Security: Measuring the Welfare Effects on Individuals
 Achieving Actuarial Balance in Social Security: Measuring the Welfare Effects on Individuals Selahattin İmrohoroğlu 1 Shinichi Nishiyama 2 1 University of Southern California (selo@marshall.usc.edu) 2
In Support of Bangladesh s Sustainable LDC Graduation
 In Support of Bangladesh s Sustainable LDC Graduation Session 3: Forging Partnerships for Sustainable Graduation Christian Eigen-Zucchi The World Bank November 29, 2017 1 Outline Distinguishing LDC vs.
Aggregate Implications of Credit Market Imperfections (II) By Kiminori Matsuyama. Updated on January 25, 2010
 By Kiminori Matsuyama. Updated on January 25, 2010") Aggregate Implications of Credit Market Imperfections (II) By Kiminori Matsuyama Updated on January 25, 2010 Lecture 2: Dynamic Models with Homogeneous Agents 1 Lecture 2: Dynamic Models with Homogeneous
Aggregate Implications of Credit Market Imperfections (II) By Kiminori Matsuyama Updated on January 25, 2010 Lecture 2: Dynamic Models with Homogeneous Agents 1 Lecture 2: Dynamic Models with Homogeneous
Development Economics 455 Prof. Karaivanov
 Development Economics 455 Prof. Karaivanov Notes on Credit Markets in Developing Countries Introduction ------------------ credit markets intermediation between savers and borrowers: o many economic activities
Class 3. Explaining Economic Growth. The Solow-Swan Model
 MACROECONOMICS I Class 3. Explaining Economic Growth. The Solow-Swan Model March 7 th, 2014 Announcement Homewor assignment #1 is now posted on the web Deadline: March 21 st, before the class (12:00) Submission:
General Examination in Macroeconomic Theory SPRING 2014
 HARVARD UNIVERSITY DEPARTMENT OF ECONOMICS General Examination in Macroeconomic Theory SPRING 2014 You have FOUR hours. Answer all questions Part A (Prof. Laibson): 48 minutes Part B (Prof. Aghion): 48
1 Income Inequality in the US
 1 Income Inequality in the US We started this course with a study of growth; Y = AK N 1 more of A; K; and N give more Y: But who gets the increased Y? Main question: if the size of the national cake Y
Rethinking Macroeconomic Policies for Inclusive and Sustainable Development
 ESCAP High-level Policy Dialogue Ministry of Finance of the Republic of Indonesia International Economic Summit 2013 Eleventh Bank Indonesia Annual International Seminar Macroeconomic Policies for Sustainable
The Effects of Experience on Investor Behavior: Evidence from India s IPO Lotteries
 1 / 14 The Effects of Experience on Investor Behavior: Evidence from India s IPO Lotteries Santosh Anagol 1 Vimal Balasubramaniam 2 Tarun Ramadorai 2 1 University of Pennsylvania, Wharton 2 Oxford University,
Road Map. Does consumption theory accurately match the data? What theories of consumption seem to match the data?
 TOPIC 3 The Demand Side of the Economy Road Map What drives business investment decisions? What drives household consumption? What is the link between consumption and savings? Does consumption theory accurately
Introduction to economic growth (2)
") Introduction to economic growth (2) EKN 325 Manoel Bittencourt University of Pretoria M Bittencourt (University of Pretoria) EKN 325 1 / 49 Introduction Solow (1956), "A Contribution to the Theory of Economic
Introduction to economic growth (2) EKN 325 Manoel Bittencourt University of Pretoria M Bittencourt (University of Pretoria) EKN 325 1 / 49 Introduction Solow (1956), "A Contribution to the Theory of Economic
Attitudes Toward Risk. Joseph Tao-yi Wang 2013/10/16. (Lecture 11, Micro Theory I)
") Joseph Tao-yi Wang 2013/10/16 (Lecture 11, Micro Theory I) Dealing with Uncertainty 2 Preferences over risky choices (Section 7.1) One simple model: Expected Utility How can old tools be applied to analyze
Joseph Tao-yi Wang 2013/10/16 (Lecture 11, Micro Theory I) Dealing with Uncertainty 2 Preferences over risky choices (Section 7.1) One simple model: Expected Utility How can old tools be applied to analyze
Topics in Contract Theory Lecture 1
 Leonardo Felli 7 January, 2002 Topics in Contract Theory Lecture 1 Contract Theory has become only recently a subfield of Economics. As the name suggest the main object of the analysis is a contract. Therefore
Homework Assignment #2: Answer Sheet
 Econ 434 Professor Ickes Fall 2008 Homework Assignment #2: Answer Sheet. Suppose that the price level in the home country is given by P = Pn α Pt α,wherep t is the price of traded goods, and α is the share
I. The Solow model. Dynamic Macroeconomic Analysis. Universidad Autónoma de Madrid. Autumn 2014
 I. The Solow model Dynamic Macroeconomic Analysis Universidad Autónoma de Madrid Autumn 2014 Dynamic Macroeconomic Analysis (UAM) I. The Solow model Autumn 2014 1 / 33 Objectives In this first lecture
Fighting Hunger Worldwide. Emergency Social Safety Net. Post-Distribution Monitoring Report Round 1. ESSN Post-Distribution Monitoring Round 1 ( )
") Emergency Social Safety Net Post-Distribution Monitoring Report Round 1 ESSN Post-Distribution Monitoring Round 1 ( ) Table of Contents 1. Introduction 3 2. Approach, methodology and Data 3 2.1. Method
Emergency Social Safety Net Post-Distribution Monitoring Report Round 1 ESSN Post-Distribution Monitoring Round 1 ( ) Table of Contents 1. Introduction 3 2. Approach, methodology and Data 3 2.1. Method
Welcome to the presentation on
 Welcome to the presentation on Poverty Reduction strategy in Bangladesh : Estimating and Monitoring of Poverty Mu. Mizanur Rahman Khandaker Deputy Director National Accounting Wing Bangladesh Bureau of
Economic Growth and Development : Exam. Consider the model by Barro (1990). The production function takes the
. The production function takes the") form Economic Growth and Development : Exam Consider the model by Barro (990). The production function takes the Y t = AK t ( t L t ) where 0 < < where K t is the aggregate stock of capital, L t the labour
form Economic Growth and Development : Exam Consider the model by Barro (990). The production function takes the Y t = AK t ( t L t ) where 0 < < where K t is the aggregate stock of capital, L t the labour
LECTURE 8 Monetary Policy at the Zero Lower Bound. October 19, 2011
 Economics 210c/236a Fall 2011 Christina Romer David Romer LECTURE 8 Monetary Policy at the Zero Lower Bound October 19, 2011 I. PAUL KRUGMAN, IT S BAAACK: JAPAN S SLUMP AND THE RETURN OF THE LIQUIDITY
International Economic Development Spring 2017 Midterm Examination
 Please complete the following questions in the space provided. Each question has equal value. Please be concise, but do write in complete sentences. Question 1 In thinking about economic growth among poor
Improving the Distribution of Wealth: Lecture in Memory of Anthony Atkinson. Joseph E. Stiglitz LSE February 16, 2018
 Improving the Distribution of Wealth: Lecture in Memory of Anthony Atkinson Joseph E. Stiglitz LSE February 16, 2018 Inequality in wealth holdings even greater than Tony emphasized Oxfam reports on wealth
1 Consumption and saving under uncertainty
 1 Consumption and saving under uncertainty 1.1 Modelling uncertainty As in the deterministic case, we keep assuming that agents live for two periods. The novelty here is that their earnings in the second
Do Conditional Cash Transfers (CCT) Really Improve Education and Health and Fight Poverty? The Evidence
 Really Improve Education and Health and Fight Poverty? The Evidence") Do Conditional Cash Transfers (CCT) Really Improve Education and Health and Fight Poverty? The Evidence Marito Garcia, PhD Lead Economist and Program Manager, Human Development Department, Africa Region
Do Conditional Cash Transfers (CCT) Really Improve Education and Health and Fight Poverty? The Evidence Marito Garcia, PhD Lead Economist and Program Manager, Human Development Department, Africa Region
Special Report N0: Link between the financial inclusion and Economic Growth: Unconventional Monetary Policy in Bangladesh
 Special Report N0: 1502 Link between the financial inclusion and Economic Growth: Unconventional Monetary Policy in Bangladesh By Dr. Sayera Younus, Deputy General Manager, Monetary Policy Department Bangladesh
Theory of Consumer Behavior First, we need to define the agents' goals and limitations (if any) in their ability to achieve those goals.
 in their ability to achieve those goals.") Theory of Consumer Behavior First, we need to define the agents' goals and limitations (if any) in their ability to achieve those goals. We will deal with a particular set of assumptions, but we can modify
Theory of Consumer Behavior First, we need to define the agents' goals and limitations (if any) in their ability to achieve those goals. We will deal with a particular set of assumptions, but we can modify
Harnessing Demographic Dividend: The Future We Want
 Harnessing Demographic Dividend: The Future We Want Presented at 5th Commission on Population and Development April 5th, 217 Republik Indonesia Ministry of National Development Planning/ Bappenas National
International Macroeconomics
 Slides for Chapter 3: Theory of Current Account Determination International Macroeconomics Schmitt-Grohé Uribe Woodford Columbia University May 1, 2016 1 Motivation Build a model of an open economy to
Growth Theory: Review
 Growth Theory: Review Lecture 1, Endogenous Growth Economic Policy in Development 2, Part 2 March 2009 Lecture 1, Endogenous Growth 1/28 Economic Policy in Development 2, Part 2 Outline Review: From Solow
Economic Impacts of Basic Income in Korea --Multiplier and Redistribution effect
 Economic Impacts of Basic Income in Korea --Multiplier and Redistribution effect Nam Hoon Kang(Hanshin University) 1. Introduction It is well known that the Korean economy has successfully developed from
Evaluating the Long-Run Impact of an Innovative Anti-Poverty Program: Evidence Using Household Panel Data
 DISCUSSION PAPER SERIES IZA DP No. 9749 Evaluating the Long-Run Impact of an Innovative Anti-Poverty Program: Evidence Using Household Panel Data M Niaz Asadullah Jinnat Ara February 2016 Forschungsinstitut
The Knowledge Problem
 The Knowledge Problem March 28, 2014 copies of this presentation can be found at www.antonydavies.org www.antonydavies.org 1 The Players and the Goals In this experiment, each of you is a member of a community.
Social Fund for Development
 Social Fund for Development Yemen Labor Intensive Works Program Targeting Khalid Moheyddeen & Abduljalil Al-Sahmere Arusha, June 2010 1 Contents Introduction About Yemen About Social Fund for Development
ECO 4933 Topics in Theory
 ECO 4933 Topics in Theory Introduction to Economic Growth Fall 2015 Chapter 2 1 Chapter 2 The Solow Growth Model Chapter 2 2 Assumptions: 1. The world consists of countries that produce and consume only
Lecture notes 2: Physical Capital, Development and Growth
 Lecture notes 2: Physical Capital, Development and Growth These notes are based on a draft manuscript Economic Growth by David N. Weil. All rights reserved. Lecture notes 2: Physical Capital, Development
Chapter 7. Economic Growth I: Capital Accumulation and Population Growth (The Very Long Run) CHAPTER 7 Economic Growth I. slide 0
 CHAPTER 7 Economic Growth I. slide 0") Chapter 7 Economic Growth I: Capital Accumulation and Population Growth (The Very Long Run) slide 0 In this chapter, you will learn the closed economy Solow model how a country s standard of living depends
Chapter 7 Economic Growth I: Capital Accumulation and Population Growth (The Very Long Run) slide 0 In this chapter, you will learn the closed economy Solow model how a country s standard of living depends
Community level impacts of financial inclusion in Kenya with particular focus on poverty eradication and employment creation
 Community level impacts of financial inclusion in Kenya with particular focus on poverty eradication and employment creation By Matu Mugo Central Bank of Kenya UN Expert Group Meeting 8 th to 11 th May
Homework 9 (for lectures on 4/2)
") Spring 2015 MTH122 Survey of Calculus and its Applications II Homework 9 (for lectures on 4/2) Yin Su 2015.4. Problems: 1. Suppose X, Y are discrete random variables with the following distributions: X
Spring 2015 MTH122 Survey of Calculus and its Applications II Homework 9 (for lectures on 4/2) Yin Su 2015.4. Problems: 1. Suppose X, Y are discrete random variables with the following distributions: X
14.05: SECTION HANDOUT #4 CONSUMPTION (AND SAVINGS) Fall 2005
 Fall 2005") 14.05: SECION HANDOU #4 CONSUMPION (AND SAVINGS) A: JOSE ESSADA Fall 2005 1. Motivation In our study of economic growth we assumed that consumers saved a fixed (and exogenous) fraction of their income.
14.05: SECION HANDOU #4 CONSUMPION (AND SAVINGS) A: JOSE ESSADA Fall 2005 1. Motivation In our study of economic growth we assumed that consumers saved a fixed (and exogenous) fraction of their income.