CPAs Views of Current Economic Conditions. Results from a Survey of New Jersey and Pennsylvania Certified Public Accountants
|
|
|
- Cody Cross
- 5 years ago
- Views:
Transcription
1 CPAs Views of Current Economic Conditions Results from a Survey of New Jersey and Pennsylvania Certified Public Accountants Prepared for New Jersey Society of Certified Public Accountants Pennsylvania Institute of Certified Public Accountants Prepared by Center for Opinion Research Franklin & Marshall College November 2014 Franklin & Marshall College Floyd Institute for Public Policy
2 Table of Contents Executive Summary... 3 Overview of Findings... 4 United States and State Economic Conditions... 4 State Differences on Selected Survey Items... 8 Pennsylvania... 9 New Jersey Trends in Economic Conditions Attachment A
3 Executive Summary Overview of Methods The purpose of this survey is to identify the economic, business, and political trends affecting the economies of Pennsylvania and New Jersey according to the certified public accountants (CPAs) residing within each state. This summary provides the responses of 418 Pennsylvania CPAs who are members of the Pennsylvania Institute of Certified Public Accountants and 414 CPAs who are members of the New Jersey Society of Certified Public Accountants. The sample of Pennsylvania CPAs and New Jersey CPAs has an estimated sample error of ± 3.6%. The data for the survey was gathered September through November, 2014 by the Franklin & Marshall College Center for Opinion Research. The survey was conducted using an on-line survey platform. The survey instrument, including the responses to each survey question, is included as Attachment A. The survey questions were designed by the staff of the Center for Opinion Research in conjunction with each state s CPA organization. The questions are designed to assess perceptions of the business climate within each state. Survey respondents are CPAs in public accounting. Survey invitations were sent to 3,219 CPAs in Pennsylvania and 3,627 in New Jersey. The survey s major findings about the US government s fiscal health and state economic conditions are summarized below. The results of the survey s other findings appear later in this report. Half (50%) of Pennsylvania and New Jersey CPAs believe the economic conditions in the US are about the same as they were one year ago (PA 5, 45%). A majority (5) of Pennsylvania and New Jersey CPAs predict increases in business revenues for the next 12 months (PA 57% increase, 4 increase). A majority (6) of Pennsylvania and New Jersey CPAs expect little change in the workforce for the next 12 months (PA 6, 65%). A large majority of CPAs in Pennsylvania and New Jersey agree that numerous factors have had a negative affect on United States economic growth during the past year, including: federal regulations (PA 80%, 7), the Affordable Care Act (PA 80%, 7), entitlement spending (PA 7, 7), United States tax policy (PA 7, 7), the global economy (PA 6, 7), and the federal deficit (PA 6, 6). Although CPAs in both states also agree that high unemployment has a negative affect on the U.S economy (77%) significantly more CPAs in New Jersey (8) feel that it has a negative affect on the U.S economy than CPAs in Pennsylvania (PA 7). 3
4 Overview of Findings United States and State Economic Conditions Most Pennsylvania and New Jersey CPAs believe that economic conditions will be better or about the same one year from now. Pennsylvania and New Jersey CPAs believe economic growth is being hindered by multiple factors, including the implementation of the Affordable Care Act, entitlement spending, and the global economy. CPAs in New Jersey view the global economy as the greatest hindrance to economic growth in the United States; whereas CPAs in Pennsylvania identified the Affordable Care Act as the greatest hindrance (see Table 1). Table 1. Pennsylvania and New Jersey CPAs Assessments of Economic Growth Do you believe the economic conditions in the United States will be better, worse or about the same one year from now? What do you believe is the greatest hindrance to economic growth in the United States? Total N=832 n = 418 n = 414 Better one year from now 29% 29% 29% Worse one year from now 2 25% 20% About the same one year from now 49% 46% 5 Affordable Care Act Entitlement spending 15% 17% 1 Global economy 15% 1 16% Federal regulations 1 16% 1 Federal deficit United States tax policy 1 10% 1 High unemployment 9% 6% 1 Private sector lending Spending cuts A majority of CPAs in both states agree that numerous factors have also negatively affected United State economic growth in the past year (see Table 2). 4
5 Table 2. Pennsylvania and New Jersey CPAs Assessments of Factors Negatively Affecting Economic Growth How has each of the following affected United States economic growth during the past year: negatively affected, no affect, positively affected? % Negatively Affected Total N=832 n = 418 n = 414 Federal regulations 77% 7 80% High unemployment 77% 8 7 Affordable Care Act 76% 7 80% Entitlement spending United States tax policy Global economy 70% 7 6 Federal deficit Private sector lending 4 46% 40% Significantly more CPAs in New Jersey than Pennsylvania (1) believe the economic conditions in the United States are worse than one year ago. About half of CPAs in both states (PA 5, 45%) believe the economic conditions are about the same as they were one year ago, and similar proportions (PA 46%, 5) are expecting economic conditions will be about the same one year from now. 5
6 Half of Pennsylvania and New Jersey CPAs are predicting increases in business revenues for the next 12 months, although many predict no change in the workforce in the coming year. Pennsylvania and New Jersey CPAs believe that salaries will increase or remain unchanged in the coming year (see Table 3). Most (86%) respondents believe that the implementation of the Affordable Care Act is affecting their companies business decisions. Among these companies, most (7) are increasing employee cost share and co-pays of existing plans, evaluating current insurance (69%), and reducing employee benefits (6). A majority (56%) of Pennsylvania and New Jersey CPAs believe the next economic bubble is most likely to occur in student debt. Table 3. CPAs Assessments of Business Growth Total N=832 n = 418 n = 414 Revenue next year Substantially increase Marginally increase 50% 56% 4 Not changed 40% 35% 4 Marginally decrease 9% 7% 1 Substantially decrease 0% 0% 0% Workforce next year Substantially increase 0% 0% 0% Marginally increase 2 26% 15% Not changed % Marginally decrease 1 9% 19% Substantially decrease Salaries next year Substantially increase 0% 0% 0% Marginally increase 47% 5 40% Not changed 46% 4 5 Marginally decrease 6% Substantially decrease 0% Benefits next year Substantially increase 6% 7% 6% Marginally increase 2 25% 19% Not changed Marginally decrease 3 27% 3 Substantially decrease 7% 7% 6
7 7
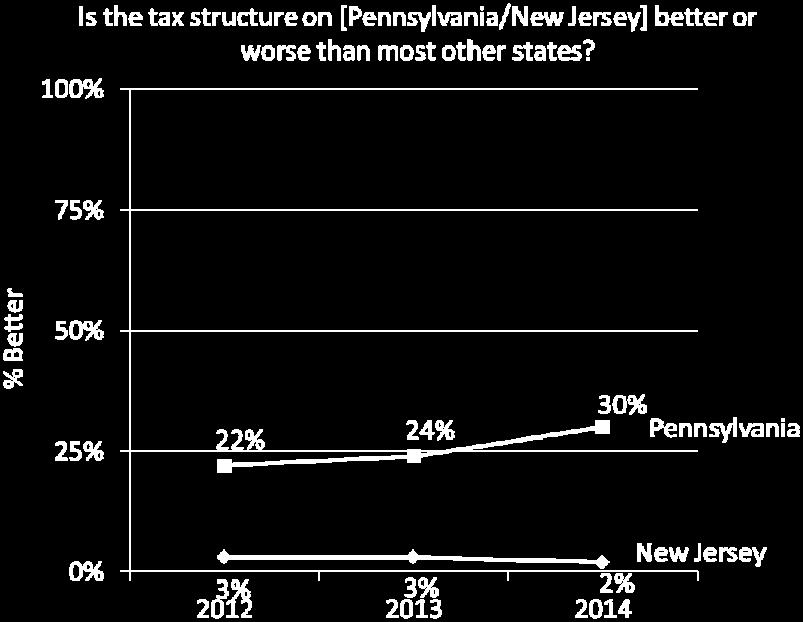
8 State Differences on Selected Survey Items CPAs assess most state economic and business conditions differently depending on which state they practice in (see Table 4). New Jersey CPAs are more likely than Pennsylvania CPAs to say that economic conditions in their state are worse than a year ago; they are also more likely to believe their state s business climate is poor and that their state s tax structure is worse than most other states. More Pennsylvania CPAs believe the implementation of the Affordable Care Act is affecting their business decisions. CPAs in Pennsylvania and New Jersey share similar feelings about future economic conditions in their states, with about half saying they will be about the same one year from now (see Table 4). Table 4. Response to Selected Survey Items by State Do you believe the economic conditions in [State] are better, worse or about the same as...* Do you believe the economic conditions in [State] will be better, worse or about the same... Do you believe the business climate in [State] is excellent, good, only fair, or poor?* Is the tax structure in [State] better or worse than most other states?* n = 418 n = 414 Better than one year ago 29% 16% Worse than one year ago 19% 3 About the same as one year ago 5 5 Better one year from now 25% 1 Worse one year from now 26% 26% About the same one year from now 49% 56% Excellent 0% Good 3 19% Only fair 5 5 Poor 7% 2 Better 30% Worse 45% 87% About the same 25% 1 Is the implementation of the ACA affecting your company s business decisions?* * Significantly different, p. <.01 Yes 8 8 No 1 16% 8
9 Pennsylvania Over half (5) of Pennsylvania CPAs believe the economic conditions in Pennsylvania are about the same as they were one year ago and nearly half expect them to be about the same one year from now (49%). In 2014, slightly more Pennsylvania CPAs foresee a decline in the economic conditions one year from now than said so in 2013 (26% worse 2015, 2 worse 2014). An increased sense of improvement is shown in 2014 compared to 2013 in regards to the revenue growth that CPAs have seen during the past year as well as their expectations for next year (see Table 5). Table 5. Revenue and Employment Growth and Expectations for Growth, Pennsylvania CPAs PA Revenue this year Substantially increased 5% Marginally increased 56% 47% 39% Not changed 25% 26% 2 Marginally decreased 1 19% 2 Substantially decreased 5% Revenue next year Substantially increase Marginally increase 56% 5 45% Not changed 35% 3 36% Marginally decrease 7% 1 16% Substantially decrease 0% Workforce this year Substantially increased 0% Marginally increased 2 19% 15% Not changed 59% 5 49% Marginally decreased 19% 2 30% Substantially decreased Workforce next year Substantially increase 0% Marginally increase 26% 26% 2 Not changed 6 55% 59% Marginally decrease 9% 16% 15% Substantially decrease 9
10 Pennsylvania CPAs perceptions of the business climate in the state continues to improve; in 2014, two in five (4) believe the business climate in the state is excellent or good, which is up from one in three (3) in 2013, and one in four (26%) in Still, half of CPAs (50%) believe the state s business climate hinders economic growth. Half of Pennsylvania CPAs feel the influence of unions in pricing and contractor selection has the most negative impact on Pennsylvania businesses (see Table 6). Table 6. What state regulation has the most negative impact on Pennsylvania businesses? Influence of unions in pricing and contractor selection 50% Complexity of the state tax code for businesses 2 Restrictions on which contractors can be chosen for state and municipal projects Regulations on environmental protections State treatment of distressed municipalities 5% Consumer protection regulations such as protection from fees and penalties Other 5% Significantly more CPAs in Pennsylvania (30%) feel that the tax structure in their state is better than in most other states when compared to CPAs in New Jersey (). Pennsylvania CPAs believe that reforming state government pensions and reducing the corporate net income tax rate would provide the greatest economic expansion in the state and that expanding the base of items subject to sales and use tax is least likely to help improve economic expansion (see Table 7). Table 7. Which of these recommendations do you think would provide for greater economic expansion and job growth potential in Pennsylvania? Which is your second choice? Which is your third choice? Top Second Third in Top Three Reform state government pensions and benefits 36% 25% 1 75% Reduce the corporate net income tax rate % 59% Implement extraction fees on Marcellus Shale gas drilling 17% Consolidate school district operations 6% 1 20% 39% Reduce state spending Increase private-public partnerships 5% 10% 1 25% Reduce the personal income tax Reduce subsidies to state-supported colleges and universities Expand the base of items subject to the sales tax and use tax 0% 5% 10
11 Eighty-eight percent of CPAs in Pennsylvania say that the Affordable Care Act has affected their company s business decisions. Nine in ten (87%) CPA businesses are increasing employee cost share and co-pays of existing plans, four in five are re-evaluating their current insurance (80%), four in five (7) are reducing employee benefits, and half (45%) are determining a business s ability to obtain coverage through state exchanges due to the Affordable Care Act. 11
12 New Jersey Half (5) of New Jersey CPAs believe the economic conditions in New Jersey are about the same as they were one year ago, and over half (56%) expect them to be about the same one year from now. In 2014, fewer New Jersey CPAs say economic conditions are better compared to last year than said so in 2013 (16% better 2013, 2 better 2013), although over half said they are about the same in 2014 (5) and in 2013 (5). A sense of stability and improvement is shown in the revenue growth that CPAs have seen during the past year as well as their expectations for next year, as seen in Table 8. Table 8. Revenue and Employment Growth and Expectations for Growth, New Jersey CPAs Revenue this year Substantially increased Marginally increased % Not changed 35% 29% 2 Marginally decreased 20% 2 3 Substantially decreased 5% Revenue next year Substantially increase Marginally increase 4 46% 4 Not changed 4 37% 3 Marginally decrease % Substantially decrease 0% Workforce this year Substantially increased 0% 0% 0% Marginally increased 10% 1 1 Not changed 55% 55% 49% Marginally decreased % Substantially decreased Workforce next year Substantially increase 0% 0% Marginally increase 15% 2 20% Not changed 65% 5 59% Marginally decrease 19% 16% 17% Substantially decrease 12
13 Only one in five (19%) New Jersey CPAs believe the business climate in the state is excellent or good, and most (7) believe the state s business climate hinders economic growth. Nearly nine in ten (87%) New Jersey CPAs feel that the tax structure in New Jersey is worse than in most other states. New Jersey CPAs also rank the state s tax climate as one of the top factors contributing to the state s high unemployment rate along with companies leaving the state (see Table 9). Table 9. What factor contributes most to the state s high unemployment rate? What is the second most important factor? Top Second One or Two New Jersey tax climate % Companies leaving the state 4 25% 65% Health care costs 10% 16% 26% Government regulation 16% 2 Poor national economy 7% 10% 1 Eighty-four percent of CPAs in New Jersey say that the Affordable Care Act is affecting their company s business decisions and three in ten (30%) identify implications of health care reform as their greatest concern in regards to operating their business in New Jersey over the next twelve months. Eighty-three percent of New Jersey CPA say businesses are increasing employee cost share and co-pays of existing plan, four in five are re-evaluating current insurance (80%), four in five (79%) are reducing employee benefits, and about half (45%) are determining a business s ability to obtain coverage through state exchanges due to the Affordable Care Act. 13
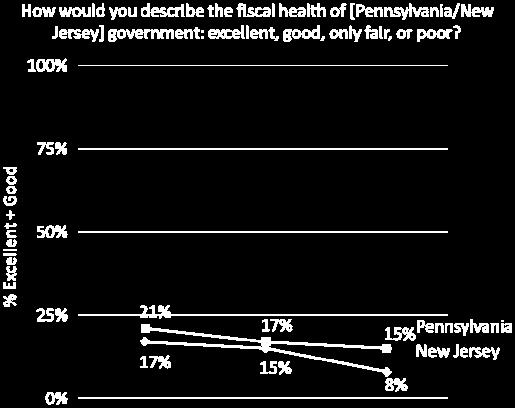
14 New Jersey CPAs are in relative agreement that reducing property tax rates and reforming state government pensions and benefits would improve economic expansion in the state, but raising the marginal rate on income tax above $1 million and expanding the tax base would not (see Table 10). A majority of New Jersey CPAs oppose legislation to raise the marginal tax on income above $1 million because: they feel it will prompt wealthy residents to leave the state (6), they believe the state should focus on shrinking government (6), and New Jersey residents are already the most highly taxed citizens in the nation (60%). Table 10. Which of these recommendations do you think would provide for greater economic expansion and job growth potential in New Jersey? Which is your second choice? Which is your third choice? Top Second Third in Top Three Reduce property tax rates 35% 25% 19% 79% Reform New Jersey s estate and inheritance taxes 16% Cut gross income tax across the board 15% 19% 1 5 Reduce New Jersey s Corporate Business Tax (CBT) 20% 15% 17% 5 Expand the tax base 7% 1 27% Raise the marginal rate on income above $1 million 6% 2 Nearly eight in ten (8) CPAs in New Jersey report the state s estate and inheritance taxes have prompted their clients to leave the state. Seven in ten (7) report they have made a recommendation to a client to relocate due to the state s estate and inheritance taxes. A large majority (8) of New Jersey CPA s agree that New Jersey s estate and inheritance taxes affect the middle class just as much as they affect the wealthy. Trends in Economic Conditions Figure 1 shows the trend in responses to six questions asked in previous surveys. After a significant increase from 2012 to 2013, the number of CPAs in Pennsylvania and New Jersey who feel the economic conditions in the United States are better than last year remained consistent between 2013 and In 2014, significantly fewer New Jersey CPAs believe the economic conditions in their state are better than they were one year ago than believed so in There is a significant decline in the number of CPAs in New Jersey who feel that the fiscal health of their state s government is excellent or good in 2014.The number of Pennsylvania CPAs who believe the tax structure in their state is better than in most other states has significantly increased from 2012 to


15 Figure 1. Trends in CPAs Attitudes Toward Economic Conditions by State 15
16 Attachment A: Marginal Frequency Report 16
17 PICPA, SCPA Member Survey Marginal Frequency Report September 16- November 10, 2014 PA N= 418 N=414 U.S. Economic Conditions and Fiscal Health Do you believe the economic conditions in the United States are better, worse, or about the same as they were one year ago? 3 35% Better than one year ago 1 20% Worse than one year ago 5 45% About the same as one year ago Do you believe the economic conditions in the United States will be better, worse, or about the same one year from now? 29% 29% Better one year from now 25% 20% Worse one year from now 46% 5 About the same one year from now What do you believe is the greatest hindrance to economic growth in the United States? 1 16% Global economy 2 1 Affordable Care Act 17% 1 Entitlement spending 1 1 Federal deficit 16% 1 Federal regulations 6% 1 High unemployment 10% 1 U.S. tax policy Private sector lending Spending cuts How much has each of the following affected U.S. economic growth during the past year? PA Affordable Care Act Federal regulations U.S. tax policy High unemployment Entitlemen spending Federal deficit Global economy Private sector lending Negatively affected 80% 80% % No affect % 2 30% 20% 39% Positively affected 6% 5% 1 2 High unemployment Federal regulations Affordable Care Act Global economy Entitlemen spending U.S. tax policy Federal deficit Private sector lending Negatively affected % No affect 16% 2 19% % 27% 35% Positively affected 9% 6% 5% 1 1
18 PICPA, SCPA Member Survey Marginal Frequency Report September 16- November 10, 2014 PA N= 418 N=414 State Economic Conditions, Fiscal Health, and Business Climate Do you believe the economic conditions in [Pennsylvania/New Jersey] are better, worse, or about the same as they were one year ago? 29% 16% Better than one year ago 19% 3 Worse than one year ago 5 5 About the same as one year ago Do you believe the economic conditions in [Pennsylvania/New Jersey] will be better, worse, or about the same one year from now? 25% 1 Better one year from now 26% 26% Worse one year from now 49% 56% About the same one year from now Do you believe the business climate in [Pennsylvania/New Jersey] is excellent, good, only fair, or poor? 0% Excellent 3 19% Good 5 5 Only fair 7% 2 Poor Do you believe the business climate in [Pennsylvania/New Jersey] encourages economic growth, hinders economic growth, or has little effect on economic growth? 20% 1 Encourages economic growth 50% 7 Hinders economic growth 30% 1 Has little effect on economic growth How would you describe the fiscal health of [Pennsylvania a/new Jersey] state government: excellent, good, only fair, or poor? 0% 0% Excellent 15% Good 56% 49% Only fair 29% 4 Poor Is the tax structure in [Pennsylvania/New Jersey] better orr worse than most other states? 30% Better 45% 87% Worse 25% 1 About the same 2
19 PICPA, SCPA Member Survey Marginal Frequency Report September 16- November 10, 2014 PA N= 418 N=414 State-Specific Items: PA Whichh of the following recommendations do you think would provide for greater economic expansion and job growth potential in Pennsylvania? Second choice? Third choice? PA Reform state government pensions and benefits Reduce the corporate net income tax rate Implement extraction fees on Marcellus Shale gas drilling Consolidate school district operations Reduce state spending Increase private-public partnerships Reduce the personal income tax Reduce subsidiess to state-supported colleges and universities Expand the base of items subject to the sales tax and use tax as 1 as 2 as 3 36% 25% % 17% 1 1 6% 1 20% % 10% 1 0% in Top 3 75% 59% 4 39% 3 25% 5% What state regulation has the most negative impact on Pennsylvania businesses? PA 50% Influence of unions in pricing and contractor selection 2 Complexity of the state tax code for businesses Restrictions on which contractors can be chosen for state and municipal projects Regulations on environmental protectionss 5% State treatment of distressedd municipalities Consumer protection regulations such ass protection from fees and penalties 5% Other Pennsylvania faces a structural budget deficit estimated at nearly $2 billion. Which of the following should the state use to close the deficit? Secondd choice? Third choice? PA Privatize liquor stores Impose a severance tax on Marcellus Shale drillers Legalize marijuana Lower businesss privilege tax Maintain the capital stock & franchise tax Raise personal income tax rate Raise the corporate new income tax rate Other as 1 as % 4 1 5% 9% 10% 10% 0% 1 as % 10% 9% in Top 3 69% 67% 27% 25% 2 20% 29% Red tape in Pennsylvania s state and local government agencies: PA 36% Is worse than ever 16% Is difficult, but improving 3 Same as beforee 0% Better than ever 9% Has not impacted my company 3
20 PICPA, SCPA Member Survey Marginal Frequency Report September 16- November 10, 2014 PA N= 418 N=414 State-Specific Items: Whichh of these recommendations do you think would provide for greater economic expansion and job growth potential in New Jersey? (Choose three) as 1 as 2 Reduce property tax rates Reform New Jersey s estate and inheritance taxes Reduce New Jersey s Corporate Business Tax (CBT)) Cut gross income tax across the board Expand the tax base Raise the marginal rate on income above $1 million 35% 16% 20% 15% 7% 6% 25% 2 15% 19% as 3 19% 2 17% 1 1 in Top 3 79% % 2 With regard to operating your business in New Jersey over the next 12 months, what is your greatest concern? 30% Implications of health care reform 19% Regulatory requirements 15% Consumer spending 1 The state s budget deficit and credit ratingg 10% State and local taxes 6% The unemployment rate 5% Other New Jersey s unemployment rate is well above the national average. What factor contributes most to the state s high unemployment rate? What is the second most important factor? Companies leaving the state New Jersey tax climate Health care costs Government regulation Poor national economy as % 7% as 2 25% 3 16% 16% 10% in top 2 65% 65% 26% 2 1 Do you believe New Jersey s estate and inheritance taxess have prompted one of your clients to leave the state? 8 Yes 17% No Have you ever advised a client to consider relocation duee to New Jersey s state and inheritance taxes? 7 Yes 29% No 4
21 PICPA, SCPA Member Survey Marginal Frequency Report September 16- November 10, 2014 PA N= 418 N=414 Do you agree or disagree with the following statement? New Jersey s estate and inheritance taxes affect the middle class just as much as they affect the wealthy. 55% Strongly agree 29% Somewhat agree 10% Somewhat disagree 6% Strongly disagree New Jersey s Transportation Trust Fund is scheduled to run out of money for road and bridge repairs in February Do you agree or disagree with the following statement? New Jersey s gas tax should be raised to fund the state s Transportation n Trust Fund.. 17% Strongly agree 39% Somewhat agree 17% Somewhat disagree 27% Strongly disagree Do you favor or oppose legislation that raisess the marginal tax on income above $1 million from the current 8.97% to 10.75%? 16% Strongly favor 1 Somewhat favor 1 Somewhat oppose 4 Strongly oppose Why do you favor raising the marginal tax rate above $1 million? n=150 6 New Jersey s wealthiest taxpayers can afford a temporary increase in their tax burden. 37% It s not fair to ask low-to-moderate income families and seniors to sacrifice while higher- income residents get a tax break 36% The tax is a necessary fix to the state s budget deficitt Some other reason Totals may equal more than 100% because multiple answers were accepted. Why do you oppose raising the marginal tax rate above $ 1 million? n=283 6 The increase will prompt wealthy residents and businesses to leave the state. 6 New Jersey need to focus on shrinking government, not imposing more taxes. 60% New Jersey residents are already the most highly taxed citizens in the nation. 47% Lower taxes on individuals and businesses are key to economic growth. 7% Some other reason Totals may equal more than 100% because multiple answers were accepted. 5
22 PICPA, SCPA Member Survey Marginal Frequency Report September 16- November 10, 2014 PA N= 418 N=414 Organizational/Client Growth Outlook Over the past year, has your clients revenuee substantiallyy increased, marginally increased, not changed, marginally decreased, or substantially decreased? Substantially increased 56% 4 Marginally increased 25% 35% Not changed 1 20% Marginally decreasedd Substantially decreased Over the next 12 months, do you expect your clients revenue to substantially increase, marginally increase, not change, marginally decrease, or substantially decrease? Substantially increasee 56% 4 Marginally increase 35% 4 Not change 7% 1 Marginally decrease 0% 0% Substantially decrease Over the past year, has your clients workforce substantially increased, marginally increased, not changed, marginally decreased, or substantially decreased? 0% 0% Substantially increased 2 10% Marginally increased 59% 55% Not changed 19% 3 Marginally decreasedd Substantially decreased Over the next 12 months, do you expect your clients workforce to substantially increase, marginally increase, not change, marginally decrease, or substantially decrease? 0% 0% Substantially increasee 26% 15% Marginally increase 6 65% Not change 9% 19% Marginally decrease Substantially decrease Over the next 12 months, do you expect your clients salaries to substantially increase, marginally increase, not change, marginally decrease, or substantially decrease? 0% 0% Substantially increasee 5 40% Marginally increase 4 5 Not change Marginally decrease 0% Substantially decrease 6
23 PICPA, SCPA Member Survey Marginal Frequency Report September 16- November 10, 2014 PA N= 418 N=414 Over the next 12 months, do you expect your clients benefits to substantially increase, marginally increase, not change, marginally decrease, or substantially decrease? 7% 6% Substantially increasee 25% 19% Marginally increase 3 3 Not change 27% 3 Marginally decrease 7% Substantially decrease Whichh of the following issues facing [Pennsylvania/New Jersey] is most likely to hinder future economic growth? Which is the second most likely to do so? PA as 1 Pension funding for public employees 37% Rising health care costss 2 Unfunded infrastructure costs 5% Regulatory burdens 7% Deficiencies in basic education 6% High taxes 6% Loss of educated workers (brain drain) A declining tax base 6% Other 0% as 1 High taxes 35% Pension funding for public employees 1 Rising health care costss 1 A declining tax base 1 Regulatory burdens 10% Unfunded infrastructure costs 5% Loss of educated workers (brain drain) Deficiencies in basic education Other 0% as % 15% 7% 6% 7% 5% 0% as 2 16% 16% 20% 1 1 5% in Top % 20% % in Top % 2 1 9% 7% Is the implementation of the Affordable Care Act affecting your company s businesss decisions? 8 8 Yes 1 16% No 7
24 PICPA, SCPA Member Survey Marginal Frequency Report September 16- November 10, 2014 PA N= 418 N=414 Whichh of the following decisionss are affected by the implementation of the Affordable Care Act? PA n=365 80% 45% 7 87% 1 n=356 79% 4 80% 8 Evaluating current insurance Determining a business s ability too obtain coverage through state exchanges Reducing employee benefits Increasing employeee cost share and co-pays of existing plans Other How often do you field the following types of questions from your clients? PA Frequently Occasionally Rarely Never N/ /A Tax planning Retirement plans for owners Employee benefits costs Cash management Retirement plans for employees Classifying individuals as employees or contractors Succession planning/selling a business Employee compensation Developing a business loan Accounting methodologies Management estimates used in financial reporting New accounting pronouncements Bankruptcy 80% 37% 36% 3 27% % 1 17% 1 0% 15% 49% 50% 46% % 35% 2 1 9% 1 19% % % 3 39% 60% 9% % Frequently Occasionally Rarely Never N/ /A Tax planning Retirement plans for owners Employee benefits costs Cash management Classifying individuals as employees or contractors Succession planning/selling a business Retirement plans for employees Employee compensation Developing a business loan Management estimates used in financial reporting Accounting methodologies New accounting pronouncements Bankruptcy % 1 17% 16% 9% 1 49% 47% 49% 50% 50% 50% % 3 26% 26% 16% 17% % 27% 2 35% 36% 37% 50% 5% % 5% 5% 8
25 PICPA, SCPA Member Survey Marginal Frequency Report September 16- November 10, 2014 PA N= 418 N=414 In which of the following sectorss is the next economic bubble most likely to occur? 5 5 Student debt 2 29% Stock market 1 1 Credit card debt Mortgage debt Other Have you ever provided clients with advice about how to handle student loan debt? 50% 5 Yes 50% 46% No What advice do you most commonly provide to your clients about ways to handle student loan debt? Second most common? Third most common? PA n=209 Pay off loans with the highest interest first Develop a budget and adhere to it Consolidate loans for one lump sum monthly payment Find roommates to share expenses Move back home Other as 1 as 2 as 3 27% 15% 5% % 1 9% 0% 5% 0% 0% 0% in top 3 46% 4 3 6% n=226 Pay off loans with the highest interest first Develop a budget and adhere to it Consolidate loans for one lump sum monthly payment Move back home Find roommates to share expenses Other as 1 as 2 as 3 in top 3 27% 1 47% 1 19% 9% 4 9% 1 10% 3 9% 0% 0% 5% 0% How many partners does your firm have? PA 40% 46% Individual practitioner 3 29% 2-5 partners 7% 1 7% partners partners More than 25 partners What is your primary area of expertise? PA 5 59% Tax 19% 16% Audit 1 16% Generalist 5% 5% Business Advisory Forensic/Businesss Valuation Other 9
26 PICPA, SCPA Member Survey Marginal Frequency Report September 16- November 10, 2014 PA N= 418 N=414 What type of clients do you typically serve? PA 7 69% Smalll Business 7% 9% 6% 5% 0% 1 Nonprofits Manufacturing Service Industry Personal Financial Planning International School Districts Other Open-Ended Please provide any additional comments, suggestions, or concerns you have about the economic, business, and political trends affecting your local economy. (Verbatim Responses) 10
CPAs Views of Current Economic Conditions. Results from a Survey of New Jersey and Pennsylvania Certified Public Accountants
 CPAs Views of Current Economic Conditions Results from a Survey of New Jersey and Pennsylvania Certified Public Accountants Prepared for New Jersey Society of Certified Public Accountants Pennsylvania
NJBIA s 60 th Annual Business Outlook Survey
 NJBIA s 60 th Annual Business Outlook Survey Employers hope to carry momentum of a positive 2018, but concerns about New Jersey s economic challenges are also growing for the new year. SALES Outlook Summary:
Scottrade Financial Behavior Study. Scottrade Financial Behavior Study 1
 2016 Scottrade Financial Behavior Study Scottrade Financial Behavior Study 1 Scottrade Financial Behavior Study Scottrade, Inc. commissioned a survey of investors to explore their attitudes and behaviors
59 th Annual Business Outlook Survey
 59 th Annual Business Outlook Survey Optimistic outlook reported on many fronts, but pending issues and existing challenges a concern in the new year. Executive Summary The results of NJBIA s 59 th Annual
Survey of Credit Underwriting Practices 2010
 Survey of Credit Underwriting Practices 2010 Office of the Comptroller of the Currency August 2010 Contents Introduction...1 Part I: Overall Results...2 Primary Findings... 2 Commentary on Credit Risk...
Credit Underwriting Practices
 Comptroller of the Currency Administrator of National Banks US Department of the Treasury 2011 Survey of OF THE R C LE UR R EN C Y CO M P T R O L Credit Underwriting Practices 186 3 Contents Introduction...
58 th Annual Business Outlook Survey
 58 th Annual Business Outlook Survey Navigating 2017: Optimism continues with sales, profits and hiring expected to rise. Executive Summary NJBIA s 58 th annual Business Outlook Survey tells a vivid story
2018 Report. July 2018
 2018 Report July 2018 Foreword This year the FCA and FCA Practitioner Panel have, for the second time, carried out a joint survey of regulated firms to monitor the industry s perception of the FCA and
18 th Annual Transamerica Retirement Survey Influences of Household Income on Retirement Readiness. June 2018 TCRS
 1 th Annual Transamerica Retirement Survey Influences of Household Income on Retirement Readiness June 01 TCRS -01 Transamerica Institute, 01 Welcome to the 1 th Annual Transamerica Retirement Survey Welcome
Governmental Accounting Standards Board
 Governmental Accounting Standards Board Survey of Users, Preparers and Auditors Prepared by: 3005 30 th Street Boulder, Colorado 80301 t: 303-444-7863 f: 303-444-1145 www.n-r-c.com Table of Contents Executive
JOB SITUATION INCOME. 3 rd Quarter 2015 PITTSBURGH
 3 rd Quarter PITTSBURGH JOB SITUATION The Pittsburgh market area will continue to experience slow and steady economic growth through the remainder of and into next year. The market area s employment is
Q1 In your opinion, should municipal governments continue to provide discounts to seniors regardless of income?
 Q1 In your opinion, should municipal governments continue to provide discounts to seniors regardless of income? Answered: 6,514 Skipped: 66 t Sure t Sure 71.57% 4,662 18.27% 1,190 10.16% 662 TOTAL 6,514
MONEY IN POLITICS JANUARY 2016
 JANUARY 2016 JANUARY 2016 PAGE 2 TABLE OF CONTENTS I. INTRODUCTION... 3 METHODOLOGY... 4 II. EXECUTIVE SUMMARY... 5 III. SUMMARY OF RESULTS... 8 IV. DATA TABLES... 27 V. DEMOGRAPHICS... 50 VI. QUESTIONNAIRE...
Opinions of Small Employers. NFIB Research Foundation Washington, DC
 Opinions of Small Employers NFIB Research Foundation Washington, DC 1 Susquehanna Polling and Research Sample Size: 500 small-business owners with 1-250 employees, random sample from the Dun and Bradstreet
2016 Business Outlook Survey
 NJBIA S 57 TH ANNUAL BUSINESS OUTLOOK SURVEY 2016 Business Outlook Survey Optimism continues going into 2016, with sales, profits and hiring continuing on an upward trajectory. However, members are cautious
National Survey. June 28-July 2, Randall Gutermuth, President
 National Survey June 28-July 2, 2017 Randall Gutermuth, President Methodology NRDC commissioned American Viewpoint to conduct a survey of likely General Election midterm voters nationwide to understand
2005 Survey of Owners of Non-Qualified Annuity Contracts
 2005 Survey of Owners of Non-Qualified Annuity Contracts Conducted by The Gallup Organization and Mathew Greenwald & Associates for The Committee of Annuity Insurers 2 2005 SURVEY OF OWNERS OF NON-QUALIFIED
Americans Say Tax Plan Helps Wealthy, Not Middle Class Republicans Expect Economic Boost, but not Personal Tax Cut December 3-5, 2017
 CBS NEWS POLL For release: Thursday, December 7, 2017 7:00 am ET Americans Say Tax Plan Helps Wealthy, Not Middle Class Republicans Expect Economic Boost, but not Personal Tax Cut December 3-5, 2017 The
STRATEGY FOR MAIN STREET SUCCESS
 NFIB/ NY 2015 LEGISLATIVE AGENDA Strategy for Main Street Success NFIB/NY 2015 Legislative Agenda STRATEGY FOR MAIN STREET SUCCESS NFIB: The Voice of Small Business NFIB: The Voice of Small Business ~
Heartland Monitor Poll XXI
 National Sample of 1000 AMERICAN ADULTS AGE 18+ (500 on landline, 500 on cell) (Sample Margin of Error for 1,000 Respondents = ±3.1% in 95 out of 100 cases) Conducted October 22 26, 2014 via Landline and
Educational Matters: The Impact of Educational Attainment on Worker Retirement Outlook
 Educational Matters: The Impact of Educational Attainment on Worker Retirement Outlook December 2010 Table of Contents About the Center Page 3 About the Survey Page 4 Methodology Page 5 Educational Matters:
2008 Cecil County Public Opinion Survey Results Summary
 Cecil County Public Opinion Survey Results Summary Survey completed by Public National Research Center Inc. Report created by WILMAPCO September www.wilmapco.org September 29, About the Survey PURPOSE
18 th Annual Transamerica Retirement Survey Influences of Generation on Retirement Readiness. June 2018 TCRS
 th Annual Transamerica Retirement Survey Influences of Generation on Retirement Readiness June 0 TCRS -06 Transamerica Institute, 0 Welcome to the th Annual Transamerica Retirement Survey Welcome to this
ANALYSIS. Proposition 103 Temporary Tax Increase for Public Education
 ANALYSIS Proposition 103 Temporary Tax Increase for Public Education Proposition 103 proposes amending the Colorado statutes to: ANALYSIS increase the state income tax rate from 4.63 to 5.0 percent for
Small Business Taxation Survey
 2011 Small Business Taxation Survey FOREWORD With just days until the April 18 income tax deadline, taxation weighs heavily on America s small-business community. Federal taxes are routinely ranked among
SUMMAR BERWOOD A. YOST AFFAIRS AND PUBLIC KAY K. HUEBNER OPINION RESEARCH
 For immediate release May 14, Franklinn & Marshall College Poll SURVEY OF PENNSYLVANIANS SUMMAR RY OF FINDINGS Prepared by: Center for Opinionn Research Floyd Institute for Public Policy Franklin & Marshall
17 th Annual Transamerica Retirement Survey Influences of Educational Attainment on Retirement Readiness
 th Annual Transamerica Retirement Survey Influences of Educational Attainment on Retirement Readiness December 0 TCRS - Transamerica Institute, 0 Welcome to the th Annual Transamerica Retirement Survey
City of Citrus Heights 2012 Community Survey
 City of Citrus Heights 2012 Community Survey Survey Conducted July 11-17, 2012 320-520 Methodology 403 telephone interviews with adult residents in Citrus Heights Interviews conducted between July 11-17,
17 th Annual Transamerica Retirement Survey Influences of Gender on Retirement Readiness
 1 th Annual Transamerica Retirement Survey Influences of Gender on Retirement Readiness December 2016 TCRS 1335-1216 Transamerica Institute, 2016 Welcome to the 1 th Annual Transamerica Retirement Survey
Comptroller of the Currency Administrator of National Banks SURVEY OF CREDIT UNDERWRITING PRACTICES 2000
 Comptroller of the Currency Administrator of National Banks SURVEY OF CREDIT UNDERWRITING PRACTICES 2000 SURVEY OF CREDIT UNDERWRITING PRACTICES 2000 Office of the Comptroller of the Currency Credit
In-House Counsel Barometer 2009
 In-House Counsel Barometer 2009 Table of Contents Study Introduction and Highlights of Findings.......................... 1 Current Economic Climate.........................................6 Being In-House
The Impact of FAS 133 on the Risk Management Practices of End Users of Derivatives. Report of Survey Results
 The Impact of FAS 133 on the Risk Management Practices of End Users of Derivatives Report of Survey Results September 2002 Introduction Background The Financial Accounting Standards Board (FASB) issued
Collection Information Statement for Businesses
 Form 433B (OIC) (Rev. May 2012) Department of the Treasury Internal Revenue Service Collection Information Statement for Businesses Complete this form if your business is a Corporation Partnership Limited
NUS DIVEST-INVEST. Research into attitudes towards investments, research and pensions across further and higher education in the UK.
 NUS DIVEST-INVEST Research into attitudes towards investments, research and pensions across further and higher education in the UK January 2016 Contents 1. Summary 2. About the research 3. Findings: Investments
Updating the American Tax System:
 Updating the American Tax System: American Attitudes and Support for Tax Reform Matthew Streit Vice President, Strategic Communications Table of Contents Executive Summary...1 Methodology...2 Part I: American
Women & Retirement: Current Outlook & New Opportunities August 2010
 & Retirement: Current Outlook & New Opportunities August 2010 Table of Contents About the Center Page 3 About the Survey Page 4 Methodology Page 5 & Retirement: Current Outlook & New Opportunities Page
INTRODUCTION 1 1. RETIREMENT IN GERMANY 2 2. THE CHANGING NATURE OF RETIREMENT 2 3. THE STATE OF RETIREMENT READINESS 6
 CONTENT INTRODUCTION 1 1. RETIREMENT IN GERMANY 2 2. THE CHANGING NATURE OF RETIREMENT 2 3. THE STATE OF RETIREMENT READINESS 6 4. THE CALL-TO-ACTION: TAKE ACTION, AND DO IT NOW 8 INTRODUCTION AEGON GERMANY
Introduction 1 Key Findings 1 The Survey Retirement landscape 2
 Contents Introduction 1 Key Findings 1 The Survey 1 1. Retirement landscape 2 2. Aspirations and expectations for a changing retirement 2 The UK is ranked in the middle of the AEGON Retirement Readiness
HOME Survey. Housing Opportunities and Market Experience. March National Association of REALTORS Research Department
 HOME Survey Housing Opportunities and Market Experience March 2017 National Association of REALTORS Research Department Introduction The Housing Opportunities and Market Experience (HOME) report was created
17 th Annual Transamerica Retirement Survey Influences of Ethnicity on Retirement Readiness
 1 th Annual Transamerica Retirement Survey Influences of Ethnicity on Retirement Readiness December 01 TCRS 1-11 Transamerica Institute, 01 Welcome to the 1 th Annual Transamerica Retirement Survey Welcome
Franklin & Marshall College Poll
 For immediate release February 7, 2013 Franklin & Marshall College Poll SURVEY OF PENNSYLVANIANS SUMMARY OF FINDINGS Prepared by: Center for Opinion Research Floyd Institute for Public Policy Franklin
The TMC Health Policy Institute Consumer Health Report 2016: Second annual survey 5 states
 Embargoed until May 18, 2016, 3 p.m. CST The TMC Health Policy Institute Consumer Health Report 2016: Second annual survey 5 states Client Logo Coverage and choice are among most important health system
Results of the 2017 Membership Opinion Survey
 Results of the 2017 Membership Opinion December 2017 INTRODUCTION The Florida Bar is one of the largest unified state bars in the United States. After starting out with fewer than 4,000 members in 1950,
Fannie Mae National Housing Survey. July - September 2010 Quarterly Wave
 Fannie Mae National Housing Survey July - ember 2010 Quarterly Wave Copyright 2010 by Fannie Mae Release Date: November 23, 2010 Consumer attitudes: measure current and track change Attitudinal Questions
Retirement Benefits and Security in the Non-Profit Sector: Survey Results. September
 Retirement Benefits and Security in the Non-Profit Sector: Survey Results September 2018 1 Table of Contents Methodology 3 Key Findings 4 The Current State of Retirement Benefits in the Non-profit Sector
HOW YOUNG NEW ZEALANDERS PERCEIVE POLITICAL & FINANCIAL WELLBEING: A LONGITUDINAL STUDY ELECTION YEAR UPDATE
 HOW YOUNG NEW ZEALANDERS PERCEIVE POLITICAL & FINANCIAL WELLBEING: A LONGITUDINAL STUDY ELECTION YEAR UPDATE FIN ED.MASSEY.AC.NZ ABOUT THE FIN-ED CENTRE Westpac New Zealand and Massey University founded
Sustainability in Education 2017
 Sustainability in Education 2017 Survey research by the Environmental Association for Universities and Colleges, National Union of Students, University and College Union, Association of Colleges and the
RAMS First Home Buyers Pulse Check Survey 2013
 RAMS First Home Buyers Pulse Check Survey 2013 Australian attitudes and behaviours towards buying their first home August 2013 Strictly Embargoed: 12:01am AEST, 23 August 2013 Contents Highlights.....3
Methodology. Surveyed members from influential Chambers of Commerce in Texas: Arlington, Austin, Corpus Christi, Dallas, Fort Worth, and San Antonio.
 Methodology Surveyed members from influential Chambers of Commerce in Texas: Arlington, Austin, Corpus Christi, Dallas, Fort Worth, and San Antonio. Collectively, these chambers serve thousands of Texas
17 th Annual Transamerica Retirement Survey Influences of Generation on Retirement Readiness
 1 th Annual Transamerica Retirement Survey Influences of Generation on Retirement Readiness December 016 TCRS 1-6 Transamerica Institute, 016 Table of Contents Welcome to the 1 th Annual Transamerica Retirement
Saving and Investing Among High Income African-American and White Americans
 The Ariel Mutual Funds/Charles Schwab & Co., Inc. Black Investor Survey: Saving and Investing Among High Income African-American and Americans June 2002 1 Prepared for Ariel Mutual Funds and Charles Schwab
The Canadian Payroll Association
 The Canadian Payroll Association CPA NPW 2017 Employee Research Survey, National Press Release Results Prepared by Framework Partners Inc., August 2017 Field Dates: June 22, 2017 August 1, 2017 The Canadian
Sixth Annual Transamerica Center for Health Studies Employers Survey: U.S. Businesses Remain Committed to Employee Healthcare Benefits
 Sixth Annual Transamerica Center for Health Studies Employers Survey: U.S. Businesses Remain Committed to Employee Healthcare Benefits November 2018 1 Table of Contents About the Transamerica Center for
NFIB SMALL BUSINESS. William C. Dunkelberg Holly Wade SMALL BUSINESS OPTIMISM INDEX COMPONENTS. Seasonally Adjusted Level
 NFIB SMALL BUSINESS ECONOMIC TRENDS William C. Dunkelberg Holly Wade June 215 Based on a Survey of Small and Independent Business Owners SMALL BUSINESS OPTIMISM INDEX COMPONENTS Index Component Seasonally
NFIB SMALL BUSINESS. William C. Dunkelberg Holly Wad SMALL BUSINESS OPTIMISM INDEX COMPONENTS. Seasonally Adjusted Level
 NFIB SMALL BUSINESS ECONOMIC TRENDS William C. Dunkelberg Holly Wad May 214 Based on a Survey of Small and Independent Business Owners SMALL BUSINESS OPTIMISM INDEX COMPONENTS Index Component Seasonally
Foreclosure Avoidance Research II A follow-up to the 2005 benchmark study
 Foreclosure Avoidance Research II A follow-up to the 2005 benchmark study Copyright 2008 Freddie Mac. All Rights Reserved. Research Objective Lenders are unable to contact borrowers in more than half of
October 31, 2013 SUMMAR BERWOOD A. YOST AFFAIRS AND PUBLIC KAY K. HUEBNER OPINION RESEARCH
 For immediatee release October 31, 2013 Franklinn & Marshall College Poll SURVEY OF PENNSYLVANIANS SUMMAR RY OF FINDINGS Prepared by: Center for Opinionn Research Floyd Institute for Public Policy Franklin
Donor Confidence Report Issue 9, February 2010
 Donor Confidence Report Issue 9, ruary 2010 The results in this Donor Confidence Report are drawn from an ongoing survey of donor attitudes about giving by Campbell Rinker. The sample size for the ruary
2014 Business Outlook Survey
 NEW JERSEY BUSINESS & INDUSTRY ASSOCIATION S 55 TH ANNUAL BUSINESS OUTLOOK SURVEY 2014 Business Outlook Survey New Jersey s business outlook is the best in many years sales, profits and hiring on the upswing.
Report :: Upside Down & Backwards: Taxes in New Jersey by Jon Shure. January 2003
 WHO PAYS? Upside Down & Backwards Taxes in New Jersey By Jon Shure January 2003 No one consciously designed it this way. New Jersey's tax structure has evolved over time. The local property tax-actually
February Franklin & Marshall College Poll PHILADELPHIA STATE OF THE CITY SUMMARY OF FINDINGS
 For immediate release Thursday, February 10, 2011 February 2011 Franklin & Marshall College Poll PHILADELPHIA STATE OF THE CITY SUMMARY OF FINDINGS Prepared by: Center for Opinion Research Floyd Institute
The Morning Call / Muhlenberg College Institute of Public Opinion THE 2009 LEHIGH VALLEY QUALITY OF LIFE SURVEY KEY FINDINGS REPORT
 The Morning Call / Muhlenberg College Institute of Public Opinion THE 2009 LEHIGH VALLEY QUALITY OF LIFE SURVEY KEY FINDINGS REPORT May, 2009 KEY FINDINGS: 1. Lehigh Valley residents continue to give positive
NFIB SMALL BUSINESS. William C. Dunkelberg Holly Wad SMALL BUSINESS OPTIMISM INDEX COMPONENTS. Seasonally Adjusted Level
 NFIB SMALL BUSINESS ECONOMIC TRENDS William C. Dunkelberg Holly Wad April 13 Based on a Survey of Small and Independent Business Owners SMALL BUSINESS OPTIMISM INDEX COMPONENTS Index Component Seasonally
INTRODUCTION AEGON GERMANY REPRESENTATIVE 1 1. RETIREMENT IN GERMANY 2 2. THE CHANGING NATURE OF RETIREMENT 2 3. THE STATE OF RETIREMENT READINESS 6
 CONTENT INTRODUCTION AEGON GERMANY REPRESENTATIVE 1 1. RETIREMENT IN GERMANY 2 2. THE CHANGING NATURE OF RETIREMENT 2 3. THE STATE OF RETIREMENT READINESS 6 4. THE CALL-TO-ACTION: TAKE ACTION, AND DO IT
A Compendium of Findings About American Employers 15 th Annual Transamerica Retirement Survey. April 2015 TCRS
 A Compendium of Findings About American Employers th Annual Transamerica Retirement Survey April TCRS - Table of Contents PAGE Introduction to the Retirement Study: Employer Perspective About the Transamerica
OPINIONS OF NFIB MEMBERS & THE SMALL BUSINESS POPULATION: Is There a Difference? William J. Dennis, Jr. January, 2009 Washington, DC
 OPINIONS OF MEMBERS & THE SMALL BUSINESS POPULATION: Is There a Difference? William J. Dennis, Jr. January, 2009 Washington, DC Study Objectives To determine if there are differences of opinion between
Fifth Annual Transamerica Center for Health Studies Survey: Employers Hold Steady in Time of Uncertainty
 Fifth Annual Transamerica Center for Health Studies Survey: Employers Hold Steady in Time of Uncertainty November 2017 Table of Contents About the Transamerica Center for Health Studies Page 3 About the
The 48 th Quarterly C-Suite Survey
 The 48 th Quarterly C-Suite Survey October 12, 2017 Sponsored by: Published and broadcast by: Introduction Methodology: telephone interviews with 153 C-level executives from ROB1000-listed companies between
Retired Steelworkers and Their Health Benefits: RESULTS FROM A 2004 SURVEY
 Retired Steelworkers and Their Health Benefits: RESULTS FROM A 2004 SURVEY May 2006 Methodology This chartpack presents findings from a survey of 2,691 retired steelworkers who lost their health benefits
Unlocking Value From Effective Retirement Plan Governance. The 2016 Willis Towers Watson U.S. Retirement Plan Governance Survey
 Unlocking Value From Effective Retirement Plan Governance The 2016 Willis Towers Watson U.S. Retirement Plan Governance Survey Organizations with effective retirement plan governance are better equipped
Quality of Life in Nonmetropolitan Nebraska: Perceptions of Well-Being and Church Life: 2012 Nebraska Rural Poll Results: A Research Report
 University of Nebraska - Lincoln DigitalCommons@University of Nebraska - Lincoln Publications from the Center for Applied Rural Innovation (CARI) CARI: Center for Applied Rural Innovation 7-2012 Quality
CTJ. Citizens for Tax Justice
 CTJ Citizens for Tax Justice September 19, 2011 Contact: Steve Wamhoff (202) 299-1066 x33 Revenue Provisions in President s Jobs Bill The American Jobs Act proposed by President Barack Obama includes provisions
Risk Tolerance Questionnaire
 Risk Tolerance Questionnaire Date: Name: To help us understand what type of investor you may be, we have developed a self-scoring questionnaire. This grading material can also help you get a better perspective
The CFSI Underbanked Consumer Study Underbanked Consumer Overview & Market Segments Fact Sheet
 The CFSI Underbanked Consumer Study - Fact Sheet June 8, 28 The CFSI Underbanked Consumer Study Underbanked Consumer Overview & Market Segments Fact Sheet Released: June 8, 28 Introduction The purpose
GLOBAL ENTERPRISE SURVEY REPORT 2009 PROVIDING A UNIQUE PICTURE OF THE OPPORTUNITIES AND CHALLENGES FACING BUSINESSES ACROSS THE GLOBE
 GLOBAL ENTERPRISE SURVEY REPORT 2009 PROVIDING A UNIQUE PICTURE OF THE OPPORTUNITIES AND CHALLENGES FACING BUSINESSES ACROSS THE GLOBE WELCOME TO THE 2009 GLOBAL ENTERPRISE SURVEY REPORT The ICAEW annual
Committee on Small Business United States Senate. Hearing on. Small Business and Health Insurance. Testimony Submitted by
 T - 137 Committee on Small Business United States Senate Hearing on Small Business and Health Insurance Testimony Submitted by Paul Fronstin Employee Benefit Research Institute Washington, DC Feb. 5, 2003
FINDINGS FOR INFRASTRUCTURE 2014
 Opinion Research Strategic Communication FINDINGS FOR INFRASTRUCTURE 2014 Introduction The following report covers the results for the Infrastructure 2014 survey of decision makers in the public and private
COMMUNITY OUTLOOK SURVEY
 Fourth Quarter 2014 COMMUNITY OUTLOOK SURVEY COMMUNITY DEVELOPMENT STUDIES AND EDUCATION DEPARTMENT Job Availability Improves for Third Consecutive Quarter; Other Household Conditions Stabilize About the
March Franklin & Marshall. College Poll SUMMARY OF FINDINGS. Prepared by: Center for Opinion Research. Floyd Institute for Public Policy
 For immediate release March 29, 2018 March 2018 Franklin & Marshall College Poll SUMMARY OF FINDINGS Prepared by: Center for Opinion Research Floyd Institute for Public Policy Franklin & Marshall College
Millennial, Gen X, and Baby Boomer Workers and Retirees RETIREMENT SAVING & SPENDING STUDY
 Millennial, Gen X, and Baby Boomer Workers and Retirees RETIREMENT SAVING & SPENDING STUDY Table of Contents Methodology Workers with 401(k)s: Millennials, Gen X, and Baby boomers Workers 401(k) Accounts
Kansas Speaks Fall 2017 (Updated) Statewide Public Opinion Survey
 Statewide Public Opinion Survey") Kansas Speaks Fall 2017 (Updated) Statewide Public Opinion Survey Prepared For The Citizens of Kansas By The Docking Institute of Public Affairs Fort Hays State University Copyright December 2017 All Rights
Kansas Speaks Fall 2017 (Updated) Statewide Public Opinion Survey Prepared For The Citizens of Kansas By The Docking Institute of Public Affairs Fort Hays State University Copyright December 2017 All Rights
NONPROFIT SURVEY SUMMER 2018
 NONPROFIT SURVEY Introduction Focus Marks Paneth LLP s Summer 2018 Nonprofit Pulse survey is based on the opinions of 216 leaders and managers of nonprofit organizations. Current conditions in the nonprofit
SMB Job Generation Outlook
 SMB Job Generation Outlook Q3 2014 The Lucas Group Job Generation Outlook is an innovative approach to traditional hiring and employment surveys, gauging both recent and planned activity in the United
T. Rowe Price 2015 FAMILY FINANCIAL TRADE-OFFS SURVEY
 T. Rowe Price 2015 FAMILY FINANCIAL TRADE-OFFS SURVEY Contents Perceptions About Saving for Retirement & College Education Respondent College Experience Family Financial Profile Saving for College Paying
HEALTH WEALTH CAREER HEALTH REFORM FIVE YEARS IN
 HEALTH WEALTH CAREER HEALTH REFORM FIVE YEARS IN ABOUT THE SURVEY March 23, 2015, marked the five-year anniversary of the signing of the Affordable Care Act (ACA). In 2015, the public exchanges began
Results from Census of EXs and Feeder Group Core Public Administration
 PWGSC Contract #42001-060452/001/CY-Amd.002 POR Registration #POR 375-06 Contract Award Date: 21/02/2007 Results from Census of s and Group Core Public Administration FINAL REPORT Submitted to: Canada
Dynamic Planner Risk Profiler
 Dynamic Planner Risk Profiler In order for your adviser to provide you with financial, they need to understand your experience of investing in financial products and approach to risk. To do this they have
REPORT OF THE AUDITOR GENERAL
 REPORT OF THE AUDITOR GENERAL To the House of Assembly On the Audit of the Financial Statements of the Province of Newfoundland and Labrador For the Year Ended 31 March 2010 Office of the Auditor General
Public Perceptions of Oil and Natural Gas Development in Karnes County, Texas: A Summary Report
 Public Perceptions of Oil and Natural Gas Development in Karnes County, Texas: A Summary Report Prepared by: Gene L. Theodori Sam Houston State University Adrian B. Uzunian Utah State University September
Littleton, CO 2016 Business Survey
 Littleton, CO 2016 Business Survey June 2016 2955 Valmont Road Suite 300 Boulder, CO 80301 303-444-7863 www.n-r-c.com Contents Executive Summary... 1 Background and Methods... 3 Business Survey Results...
NFIB SMALL BUSINESS. William C. Dunkelberg Holly Wade SMALL BUSINESS OPTIMISM INDEX COMPONENTS
 NFIB SMALL BUSINESS ECONOMIC TRENDS William C. Dunkelberg Holly Wade 21 Based on a Survey of Small and Independent Business Owners SMALL BUSINESS OPTIMISM INDEX COMPONENTS Index Component Seasonally Adjusted
HART RESEARCH ASSOCIATES Study # page 1
 HART RESEARCH ASSOCIATES Study #12269--page 1 1724 Connecticut Avenue, NW Interviews: 400 registered voters Washington, DC 20009 Dates: November 18-21, 2017 (202) 234-5570 FINAL Study #12269--Arizona State
PREQIN SPECIAL REPORT: PRIVATE DEBT FUND MANAGER OUTLOOK H alternative assets. intelligent data.
 PREQIN SPECIAL REPORT: PRIVATE DEBT FUND MANAGER OUTLOOK H2 2017 alternative assets. intelligent data. PREQIN SPECIAL REPORT: PRIVATE DEBT FUND MANAGER OUTLOOK FOREWORD So far in 2017, private debt fundraising
1. Is Pennsylvania intending to require driver s license numbers on electronically filed returns? If so, when?
 PSTAP Committee on Cooperation with Pennsylvania Department of Revenue December 2, 2016 10:00 AM 12:00 NOON Individual Taxes 1. Is Pennsylvania intending to require driver s license numbers on electronically
Wells Fargo/Gallup Survey: If Tax-Deferred Saving in a 401(k) Is Eliminated, Nearly Half of U.S. Investors Would Save Less or Stop Saving
 Is Eliminated, Nearly Half of U.S. Investors Would Save Less or Stop Saving") Media Amy Hyland Jones (704) 374-2553 Amy.HylandJones@wellsfargo.com Wells Fargo/Gallup Survey: If Tax-Deferred Saving in a 401(k) Is Eliminated, Nearly Half of U.S. Investors Would Save Less or Stop Saving
Media Amy Hyland Jones (704) 374-2553 Amy.HylandJones@wellsfargo.com Wells Fargo/Gallup Survey: If Tax-Deferred Saving in a 401(k) Is Eliminated, Nearly Half of U.S. Investors Would Save Less or Stop Saving
Serving and Investing in
 Technical Elements (What qualifies?) Performance Context Community Development Services Community Development Investments 1 Community Development 1)Affordable housing g( (including multifamily rental housing)
A PROFILE OF FAMILY BUSINESS IN THE GREAT LAKES BAY REGION
 A PROFILE OF FAMILY BUSINESS IN THE GREAT LAKES BAY REGION JUNE, 2015 TABLE OF CONTENTS 3 Executive Summary 4 Survey Participants; Purpose of Study 5 Methodology; Response Rate; FB Longevity 6 Top Executive
Business Confidence Report. Winter 2013
 Business Confidence Report Winter 2013 2013 SONOMA COUNTY Winter 2013 Business Confidence Survey and Report February 2013 The Sonoma County Economic Development Board (EDB), in partnership with the Sonoma
June Franklin & Marshall. College Poll SUMMARY OF FINDINGS. Prepared by: Center for Opinion Research. Floyd Institute for Public Policy
 For immediate release June 14, 2018 June 2018 Franklin & Marshall College Poll SUMMARY OF FINDINGS Prepared by: Center for Opinion Research Floyd Institute for Public Policy Franklin & Marshall College
Investment Policy Statement Questionnaire
 Investment Policy Statement Questionnaire Client Date Investment Advisor Investor Profile Questionnaire Intended Use of Portfolio: Tax Sensitive: YOUR TIME HORIZON 1. When do you expect to begin withdrawing