The 2014 Annual Economic Report on the EU Fishing Fleet (STECF 14-16)
|
|
|
- Constance Underwood
- 5 years ago
- Views:
Transcription

 Edited by Anton Paulrud Natacha")

1 213 Annual Economic Report on the EU Fishing Fleet The 214 Annual Economic Report on the EU Fishing Fleet (STECF 14-16) Scientific, Technical and Economic Committee for Fisheries (STECF) Edited by Anton Paulrud Natacha Carvalho Alessandra Borrello This report was reviewed by the STECF through written procedure, 24 3 October EUR 2691 EN
2 European Commission Joint Research Centre Institute for the Protection and Security of the Citizen Contact information STECF secretariat Address: Maritime Affairs Unit, Via Enrico Fermi 2749, 2127 Ispra (VA), Italy Tel.: Fax: Legal Notice Neither the European Commission nor any person acting on behalf of the Commission is responsible for the use which might be made of this publication. This report does not necessarily reflect the view of the European Commission and in no way anticipates the Commission s future policy in this area. Europe Direct is a service to help you find answers to your questions about the European Union Freephone number (*): (*) Certain mobile telephone operators do not allow access to 8 numbers or these calls may be billed. A great deal of additional information on the European Union is available on the Internet. It can be accessed through the Europa server JRC 9257 EUR 2691 EN ISBN ISSN ISSN doi:1.2788/19812 Luxembourg: Publications Office of the European Union, 214 European Union, 214 Reproduction is authorised provided the source is acknowledged How to cite this report: Scientific, Technical and Economic Committee for Fisheries (STECF) The 214 Annual Economic Report on the EU Fishing Fleet (STECF-14-16) Publications Office of the European Union, Luxembourg, EUR 2691 EN, JRC 9257, 363 pp. Printed in Italy
3 214 Annual Economic Report on the EU Fishing Fleet CONTENTS LIST OF TABLES 3 LIST OF FIGURES 6 THE 214 ANNUAL ECONOMIC REPORT ON THE EU FISHING FLEET (STECF 14-16) 9 STECF OBSERVATIONS 1 STECF CONCLUSIONS 1 Expert Working Group report 11 EXTENDED SUMMARY INTRODUCTION Terms of Reference for STECF EWG-14-4 & Data Source and Coverage Abbreviations LIST OF PARTICIPANTS EU FLEET OVERVIEW Overview of the EU Fishing Fleet in Economic Performance indicators Trends of performance for selected EU fishing fleets: Main drivers and trends affecting the economic performance of the EU fleet EU FLEET REGIONAL ANALYSIS EU Baltic Sea Fishing Fleet Mediterranean & Black Sea EU North Atlantic Fishing Fleet North Sea & Eastern Arctic area Other Fishing Regions (OFR) EU Distant-water fleet NATIONAL CHAPTERS BELGIUM BULGARIA CROATIA CYPRUS DENMARK ESTONIA FINLAND FRANCE GERMANY GREECE IRELAND ITALY LATVIA LITHUANIA MALTA THE NETHERLANDS POLAND PORTUGAL ROMANIA SLOVENIA SPAIN 32 1
4 214 Annual Economic Report on the EU Fishing Fleet 5.22 SWEDEN UNITED KINGDOM 34 6 AER REPORT METHODOLOGY DCF VARIABLES REQUESTED CONCEPTS, TERMS AND DEFINITIONS ECONOMIC PERFORMANCE INDICATOR CALCULATIONS ECONOMIC PERFORMANCE INDICATOR CLASSIFICATIONS ECONOMIC PERFORMANCE PROJECTIONS DISAGGREGATION OF ECONOMIC DATA DATA COVERAGE AND LIMITATIONS List of Participants EWG 14-4 and List of Background Documents 363 2
5 214 Annual Economic Report on the EU Fishing Fleet LIST OF TABLES Table 1 DCF capacity data for the EU fishing fleet in Table 2 DCF capacity data for the EU fishing fleet in 212, continued 18 Table 3 EU fleet employment and average wage by Member State, Table 4 EU fleet revenue by Member State, 212 (million ) 23 Table 5 EU fleet cost structure by Member State, 212 (million ) 24 Table 6 EU fishing fleet economic performance indicators, 212 (million ) 26 Table 3.1 Main variables and indicators by Member State, Table 3.2 Main variables and indicators by MS and fishing activity, Table 4.1 TAC in the Baltic Sea, Table 4.2 EU Baltic Sea fleet structure and economic performance estimates by MS, Table 4.3 EU Baltic Sea fleet structure and economic performance estimates by MS and fishing activity, Table 4.4 EU Baltic Sea fleet structure and economic performance estimates of the top 25 MS Fleet Segment in terms of revenue, Table 4.5 EU Mediterranean & Black Sea fleet structure and economic performance estimates by MS and fishing activity, Table 4.6 EU Mediterranean & Black Sea fleet structure and economic performance estimates by MS and fishing activity, Table 4.7 EU Mediterranean & Black Sea fleet economic performance estimates for top 35 MS fleet segment, Table 4.8 EU North Atlantic fleet economic performance by MS fleets, Table 4.9 EU North Atlantic fleet economic performance by MS and fishing activity 135 Table 4.1 EU North Atlantic fleet economic performance of the top 35 MS fleet segments, Table 4.11 EU North Sea and Eastern Arctic fleet structure, landings and revenue by MS, Table 4.12 EU North Sea and Eastern Arctic fleet economic performance estimates by MS and fishing activity 137 Table 4.13 EU North Sea and Eastern Arctic fleet economic performance estimates for top 35 MS fleet segments, Table 4.14 EU OFR fleet structure and economic performance estimates by MS, Table 4.15 EU OFR fleet structure and economic performance estimates by MS and fishing activity, Table 4.16 EU OFR fleet structure and economic performance estimates of the top 25 MS Fleet Segment in terms of revenue, Table Belgian national fleet structure, activity and production trends: Table Belgian national fishing fleet economic performance in and projections for Table Main socio-economic performance indicators by fleet segment in the Belgian national fishing fleet, Table Bulgarian national fleet structure, activity and production trends: Table Bulgarian national fishing fleet economic performance in and projections for Table Bulgarian national fleet structure, activity and production trends by operational scale: Table Economic performance of the Bulgarian national fishing fleet by operational scale: Table Main socio-economic performance indicators by fleet segment in the Bulgarian national fishing fleet, Table Croatian national fleet structure, activity and production trends: Table Croatian national fishing fleet economic performance in and projections for Table Croatian national fleet structure, activity and production trends by operational scale: Table Economic performance of the Croatian national fishing fleet by operational scale: Table Main socio-economic performance indicators by fleet segment in the Croatian national fishing fleet, Table Cypriot national fleet structure, activity and production trends: Table Cypriot national fishing fleet economic performance in and projections for Table Cypriot national fleet structure, activity and production trends by operational scale: Table Economic performance of the Cypriot national fishing fleet by operational scale: Table Main socio-economic performance indicators by fleet segment in the Cypriot national fishing fleet, Table Danish national fleet structure, activity and production trends: Table Danish national fishing fleet economic performance: Table Danish small and Large scale fleet structure, activity and production trends: Table Danish small scale and large scale fishing fleet economic performance:
6 214 Annual Economic Report on the EU Fishing Fleet Table Main socio-economic performance indicators by fleet segment in the Danish national fishing fleet, Table Estonian national fleet structure, activity and production trends: Table Estonian national fishing fleet economic performance in and projections for Table Estonian national fleet structure, activity and production trends by operational scale: Table Economic performance of the Estonian national fishing fleet by operational scale: Table Main socio-economic performance indicators by fleet segment in the Estonian national fishing fleet in Table Finnish national fleet structure, activity and production trends: Table Finnish national fishing fleet economic performance in and projections for Table Finnish national fleet structure, activity and production trends by operational scale: Table Economic performance of the Finnish national fishing fleet by operational scale: Table Main socio-economic performance indicators by fleet segment in the Finnish national fishing fleet in Table French national fleet structure, activity and production trends: Table French national fishing fleet economic performance in Table French national fleet structure, activity and production trends by operational scale: Table Economic performance of the French national fishing fleet by operational scale: Table Main socio-economic performance indicators by fleet segment in the French national fishing fleet in Table German national fleet structure, activity and production trends: Table German national fishing fleet economic performance in and projections for Table German national fleet structure, activity and production trends by operational scale: Table Economic performance of the German national fishing fleet by operational scale: Table Main socio-economic performance indicators by fleet segment in the German national fishing fleet in Table Greek national fleet structure, activity and production trends: Table Greek national fishing fleet economic performance indicators in Table Greek national fleet structure, employment and activity trends by fishing activity: Table Costs and capital value of the Greek national fishing fleet by fishing activity: Table Irish national fleet structure, activity and production trends: Table Irish national fishing fleet economic performance in and projections for Table Irish national fleet structure, activity and production trends by operational scale: Table Economic performance of the Irish national fishing fleet by operational scale: Table Main socio-economic performance indicators by fleet segment in the Irish national fishing fleet in Table Italian national fleet structure, activity and production trends: Table Italian national fishing fleet economic performance in 212 and projections for Table Economic performance of the Italian national fishing fleet by operational scale: Table Main socio-economic performance indicators by fleet segment in the Italian national fishing fleet in Table Main socio-economic performance indicators by fleet segment in the Italian national fishing fleet in Table Latvian national fleet structure, activity and production trends: Table Latvian national fishing fleet economic performance in and projections for Table Latvian national fleet structure, activity and production trends by operational scale: Table Economic performance of the Latvian national fishing fleet by operational scale: Table Main socio-economic performance indicators by fleet segment in the Latvian national fishing fleet in Table Lithuanian national fleet structure, activity and production trends: Table Lithuanian national fishing fleet economic performance in and projections for Table Economic performance of the Lithuanian national fishing fleet by operational scale: Table Lithuanian national fleet structure, activity and production trends by operational scale: Table Main socio-economic performance indicators by fleet segment in the Lithuanian national fishing fleet in Table Maltese national fleet structure, activity and production trends: Table Maltese national fishing fleet economic performance in and projections for
7 214 Annual Economic Report on the EU Fishing Fleet Table Maltese national fleet structure, activity and production trends by operational scale: Table Economic performance of the Maltese national fishing fleet by operational scale: Table Main socio-economic performance indicators by fleet segment in the Maltese national fishing fleet in Table Dutch national fleet structure, activity and production trends: Table Dutch national fishing fleet economic performance in and projections for Table Dutch national fleet structure, activity and production trends by operational scale: Table Economic performance of the Dutch national fishing fleet by operational scale: Table Main socio-economic performance indicators by fleet segment in the Dutch national fishing fleet in Table Polish national fleet structure, activity and production trends: Table Polish national fishing fleet economic performance in and projections for Table Polish national fleet structure, activity and production trends by operational scale: Table Economic performance of the Polish national fishing fleet by operational scale: Table Main socio-economic performance indicators by fleet segment in the Polish national fishing fleet in Table Portuguese national fleet structure, activity and production trends: Table Portuguese national fishing fleet economic performance in and projections for Table Portuguese national fleet structure, activity and production trends by operational scale: Table Economic performance of the Portuguese national fishing fleet by operational scale: Table Main socio-economic performance indicators by fleet segment in the Portuguese national fishing fleet in Table Romanian national fleet structure, activity and production trends: Table Romanian national fishing fleet economic performance in and projections for Table Romanian national fleet structure, activity and production trends by operational scale: Table Economic performance of the Romanian national fishing fleet by operational scale: Table Main socio-economic performance indicators by fleet segment in the Romanian national fishing fleet in Table Slovenian national fleet structure, activity and production trends: Table Slovenian national fishing fleet economic performance in and projections for Table Slovenian national fleet structure, activity and production trends by operational scale: Table Economic performance of the Slovenian national fishing fleet by operational scale: Table Main socio-economic performance indicators by fleet segment in the Slovenian national fishing fleet in Table Spanish national fleet structure, activity and production trends: Table Spanish national fishing fleet economic performance in Table Spanish national fleet structure, activity and production trends by operational scale: Table Economic performance of the Spanish national fishing fleet by operational scale: Table Main socio-economic performance indicators by fleet segment in the Spanish national fishing fleet in Table Swedish national fleet structure, activity and production trends: Table Swedish national fishing fleet economic performance in and projections for Table Swedish national fleet structure, activity and production trends by operational scale: Table Economic performance of the Swedish national fishing fleet by operational scale: Table Main socio-economic performance indicators by fleet segment in the Swedish national fishing fleet in Table UK national fleet structure, activity and production trends: Table UK national fishing fleet economic performance in and projections for Table UK national fleet structure, activity and production trends by operational scale: Table Economic performance of the UK national fishing fleet by operational scale: Table Main socio-economic performance indicators by fleet segment in the UK national fishing fleet in Table DCF Fleet economic data call contents for years Table 6.2 Inflation and nominal LT interest rates by EU Member State Table 6.3 Development trend classification 354 Table 6.4 Profitability classification 354 5
8 214 Annual Economic Report on the EU Fishing Fleet LIST OF FIGURES Figure 1 EU fishing fleet economic performance indicators: comparing 211 and Figure 2 Trends in fleet economic performance indicators: 22 to Figure 3 Trends in EU fleet capacity, (Source: EU Fleet Register) 18 Figure 4 Trends in EU fleet capacity: Figure 5 Trends in employment and average wage indicators, Figure 6 Trends in effort and fuel consumption, Figure 7 Trend in landings weight and value: Figure 8 Trends in fuel consumption per tonne of live weight landed and fuel consumption per landed value: Figure 9 Trends in revenue and costs: Figure 11 Trends in fleet economic performance indicators: Figure 12 Projection performance results for 213 by MS 32 Figure 3.1 Trends on the EU fishing fleet capacity: Figure 3.2 MS fleet capacity as percentage of EU fleet in Figure 3.3 Capacity by main fishing activity as percentage of EU fleet in Figure 3.4 Employment (total employed and FTE) by MS as a percentage of the EU fleet: Figure 3.5 Employment (total employed and FTE) by fishing activity as a percentage of the EU fleet: Figure 3.6 Effort and fuel consumption, expressed as a percentage of the EU fleet: Figure 3.7 Distribution of fishing effort in 212 by main FAO fishing area 82 Figure 3.8 EU fishing fleet effort in Days at sea and Fishing days, Figure 3.9 Effort deployed and fuel consumption by fishing activity, expressed as a percentage of the EU fleet: Figure 3.1 Landings in weight and value by MS, expressed as a percentage of the EU fleet: Figure 3.11 Top ten species landed in weight (left) and in value (right) in Figure 3.12 Average price of the top species landed in terms of weight and/or value in Figure 3.13 EU fishing fleet landing in 212 by main fishing area (ICES rectangle) 85 Figure 3.14 EU landings in weight and value, Figure 3.15 Landings by fishing activity, expressed as a percentage of the EU fleet: Figure 3.16 Landings by MS and fishing activity: Figure 3.17 Revenue and main cost items by MS, expressed as a percentage of the total: Figure 3.18 Revenue and main cost items by fishing activity, expressed as a percentage of the total: Figure 3.19 Fleet replacement value and Investment, expressed as a percentage of the total: Figure 3.2 In-year investments by EU Member in 211 and Figure 3.21 Economic performance indicators by MS: Figure 3.22 Economic performance indicators as a percentage of revenue by MS: Figure 3.23 RoFTA by EU Member State in 211 and Figure 3.24 Coverage of the selected EU fishing fleets according to the DCF data 91 Figure 3.25 Trends in EU fleet capacity by main fishing activity and vessel length groups: Figure 3.26 Trends in fleet employment and average wage indicators: Figure 3.27 Trends in fleet employment and average wage indicators by fishing activity: Figure 3.28 Trends in fishing effort and fuel consumption: Figure 3.29 Trends in fishing effort and fuel consumption by fishing activity: Figure 3.3 Trends in fleet landings in weight and value: Figure 3.31 Trends in landings by top species in terms of weight (left) and value (right): Figure 3.32 Trends in average first sales price for key species:
9 214 Annual Economic Report on the EU Fishing Fleet Figure 3.33 Trends in landings weight (left) and value (right) by main fishing operation: Figure 3.34 Trends in EU fleet revenue and costs: Figure 3.35 Trends costs and revenue by fishing activity: Figure 3.36 Trends in fleet economic performance indicators: Figure 3.37 Trends in fleet economic performance indicators by fishing activity: Figure 3.38 Trends in selected EU Member States economic performance indicators: 22 to Figure 3.39 Trends in labour productivity (GVA per FTE) and capital use: Figure 3.4 Trends in labour productivity (GVA per FTE) and capital use by fishing activity: Figure 3.41 Trends in average fuel consumption per tonne landed (litres/tonne) and per landed value (litres/thousand ): Figure 3.42 Trends in fuel consumption per tonne of live weight landed and fuel consumption per landed value by fishing activity: Figure 3.43 Projection performance results for 213 by MS 11 Figure 3.44 Projection performance results for 213 by fishing activity 12 Figure 4.1 Regional map, highlighting MS fishing in the Baltic Sea 111 Figure 4.2 EU Baltic Sea fleet capacity, effort and landings by MS and fishing activity: Figure 4.3 List of the top 1 species in terms of weight landed for MS fleets operating in the Baltic Sea, Figure 4.4 Regional map highlighting MS operating in the Mediterranean & Black Sea 114 Figure 4.5 EU Mediterranean & Black Sea fleet capacity, effort and landings by MS and fishing activity: Figure 4.6 List of the top 1 species in terms of weight landed in the for MS fleets operating in the Mediterranean & Black Sea, Figure 4.7 Regional map highlighting MS fleets operating in the North Atlantic region 117 Figure 4.8 North Atlantic fleet capacity, effort and landings by MS and fishing activity: Figure 4.9 List of the top 1 species in terms of weight landed for MS fleets operating in the North Atlantic region, Figure 4.1 Regional map highlighting MS fishing in the North Sea and Eastern Arctic areas 121 Figure 4.11 North Sea and Eastern Artic fleet capacity, effort and landings by MS and fishing activity: Figure 4.12 List of the top 1 species in terms of weight landed of MS fleets operating in the North Sea and Eastern Artic region, Figure 4.13 Landings (in weight) in Other Fishing Regions by Region (left) and MS (right): Figure 4.14 Trend of landings (in weight) by major fishing area and MS fleet in Other Fishing Regions: Figure 4.15 Other fishing region fleet capacity, effort and landings by MS and fishing activity: Figure 4.16 List of the top 1 species in terms of weight landed in the for MS fleets operating in Other Fishing Regions, Figure 4.17 List of the top 1 species in terms of weight landed in the for MS fleets operating in Other fishing regions, Figure Belgian fleet: main trends Figure Belgian fleet main economic performance trends Figure Belgian fleet fishing effort by main FAO fishing areas, Figure Bulgarian fleet: main trends for the period Figure Bulgarian fleet main economic performance trends for the period Figure Croatian fleet main trends for the period Figure Cost structure of the Croatian fleet for the period Figure Cypriot fleet: main trends for the period Figure Cypriot fleet main economic performance trends for the period Figure Danish fleet: main trends for the period Figure Danish fleet main economic performance trends for the period Figure Danish fleet fishing effort by FAO fishing area, Figure Estonian fleet: main trends for the period Figure Estonian fleet main economic performance trends for the period Figure Estonian fleet effort and landings by FAO fishing area, Figure Finnish fleet: main trends /14 19 Figure Finnish main economic performance trends Figure Finnish effort and landings by FAO fishing area,
10 214 Annual Economic Report on the EU Fishing Fleet Figure French fleet: main trends / Figure French fleet main economic performance trends Figure French effort (days-at-sea and fishing days) and landings (weight and value) by FAO fishing area, Figure German fleet: main trends for the period Figure German fleet main economic performance trends for the period Figure German fleet effort and landings by FAO fishing area, Figure Irish fleet: main trends Figure Irish main economic performance trends Figure Irish fleet effort and landings by FAO fishing area, Figure Italian fleet main trends / Figure Italian fleet main economic performance trends Figure Italian fleet effort and landings by FAO fishing area, Figure Latvian fleet: main trends for the period Figure Latvian fleet main economic performance trends for the period Figure Latvian effort and landings by FAO fishing area, Figure Lithuanian fleet: main trends for the period Figure Lithuanian fleet main economic performance trends for the period Figure Lithuanian fleet effort and landings by FAO fishing area, Figure Maltese fleet main trends for the period Figure Maltese fleet main economic performance trends for the period Figure Dutch fleet: main trends for the period Figure Dutch fleet main economic performance trends for the period Figure Dutch fleet effort and landings by FAO fishing area, Figure Polish fleet: main trends for the period Figure Polish fleet main economic performance trends for the period Figure Polish fleet effort and landings by FAO fishing area, Figure Portuguese fleet: main trends for the period Figure Portuguese fleet main economic performance trends for the period Figure Portuguese effort (days-at-sea and fishing days) and landings (weight and value) by FAO fishing area, Figure Romanian fleet: main trends Figure Romanian fleet main economic performance trends Figure Slovenian fleet main trends for the period Figure Slovenian fleet main economic performance trends for the period Figure Spanish fleet: main trends for the period Figure Spanish fleet main economic performance trends for the period Figure Spanish fleet landings by main FAO fishing area, Figure Swedish fleet main economic performance trends for the period Figure Swedish fleet main economic performance trends for the period Figure Swedish fleet effort and landings by FAO fishing area, Figure UK fleet: main trends Figure UK main economic performance trends Figure GBR effort and landings by FAO fishing area,
11 214 Annual Economic Report on the EU Fishing Fleet SCIENTIFIC, TECHNICAL AND ECONOMIC COMMITTEE FOR FISHERIES (STECF) THE 214 ANNUAL ECONOMIC REPORT ON THE EU FISHING FLEET (STECF 14-16) THIS REPORT WAS REVIEWED THROUGH WRTTEN PROCEDURE, 24 3 OCTOBER 214 Request to the STECF STECF is requested to review the report of the STECF Expert Working Group meetings, evaluate the findings and make any appropriate comments and recommendations. Background Following the 214 DCF call for economic data on the EU fishing fleet, EWG 14 4 & 14 5 was requested to analyse the data and comment on the economic performance of the EU and Member State fishing fleets between 28 and 214. STECF OBSERVATIONS STECF observes and appreciate the huge effort undertaken by the EWG, JRC and the EWG chair in order to produce the AER report 214. STECF notes that some Member States did not provide all the data requested under the 214 fleet economic data call issued by DG MARE. Furthermore, the quality (questionable accuracy) of some Member States data submissions remains a concern. Missing and questionable data compromises the ability of the STECF to produce comprehensive and accurate analyses of fleet economic performance at the national, regional and EU level, and to undertake the additional analyses requested. Also late arrival of data is of great concern, and undermines the possibility for STECF to publish the report within an acceptable time. STECF would welcome more efforts on the chapter: trends of performance of the EU fishing fleet with data from all MS and a deeper analysis of the year following the target year. In this report, the likely performance in 213 is very interesting. STECF CONCLUSIONS STECF concludes that the Annual Economic report prepared by the EWG 14 4 and 14 5 represents the most comprehensive assessment of the performance of EU fishing fleets currently available, and despite its limitations through incomplete or missing data sets, STECF endorses the Report. Furthermore, the usefulness of future Annual Economic Reports on the performance of EU fishing fleets will remain less than optimal unless Member States submit complete, accurate and timely data submissions in response to annual economic data calls. STECF urges the Commission to take whatever action is necessary to ensure that future data submission from Member States are complete, accurate and are submitted within timescale specified in the annual data calls. 9
12 1
13 214 Annual Economic Report on the EU Fishing Fleet EXPERT WORKING GROUP REPORT REPORT TO THE STECF EXPERT WORKING GROUP OF THE 214 ANNUAL ECONOMIC REPORT ON THE EU FISHING FLEET EWG 14 4 & 14 5 ISPRA, ITALY, 7 11 APRIL & GOTHENBURG, SWEDEN, 9 13 JUNE 214 This report does not necessarily reflect the view of the STECF and the European Commission and in no way anticipates the Commission s future policy in this area. 11

.")
14 EXTENDED SUMMARY The 214 Annual Economic Report (AER) on the European Union (EU) fishing fleet provides a comprehensive overview of the latest information available on the structure and economic performance of EU Member States fishing fleets. The 214 AER was produced by two working groups of economic experts 1 convened under the Scientific, Technical and Economic Committee for Fisheries (STECF). The data used to compile all the various analyses contained within the report were collected under the data collection framework (DCF). The data call requested economic and transversal data for the years 28 to 213. This extended summary supplements the 214 Annual Economic Report on the EU fishing Fleet 2. Main Findings of the 214 AER EU Fleet economic performance results for 212 The 212 data from EU Member States show that although revenue (income from seafood sales plus other income from non-fishing activities) generated by the fleet decreased compared to 211, costs decreased even more, making the EU fishing fleet generally profitable and more so than in 211. The decrease in revenue is consistent with a decrease in the total weight and value of seafood landed by the EU fleet. In 212, the EU fleet generated 6.9 billion in revenue, amounting to 3.3 billion in Gross Value Added (GVA), which measures the direct contribution of the fishing fleet to the economy. After deducting for operating costs, the fleet generated 1.3 billion in gross profit and 458 million in net profit after accounting for capital costs, (Figure 1). In relative terms, GVA as a proportion of revenue was estimated at 48%, which means that fishing fleet transforms roughly half of the total revenue into salaries and profits for the fishing community. An estimated 6.6% of the fleet s revenue was retained as net profit in (see Annex Tables 3 to 5). Source: Member State data submissions under the DCF 214 Fleet Economic Figure 1 EU fishing fleet economic performance indicators: comparing 211 and 212 Note: excludes Bulgaria, Croatia, Cyprus, Greece and Malta 1 EWG 14-4 and EWG Due to some incomplete and/or questionable datasets for several MS fleets over the period , a complete overview of the EU fleet, including all 23 coastal MS fishing fleets, was not possible (see Table 1). To overcome some of the data limitations, the AER provides a snap-shot of the EU fleet in 212 including results for all MS fleets with the exception of Bulgaria, Croatia, Cyprus, Greece and Malta. A trend analysis is also provided but, for consistency, includes only the MS fleets for which all the relevant datasets were available for This analysis covers just 15 MS fleets and excludes, in addition to the five MS mentioned above, Estonia, France and Spain. Given that France and Spain comprise two of the most important EU fishing fleets, the analysis serves mainly to provide insights on the main development trends of the EU fleet, represented by the selected fleets, over the period See Annex Table 1 and Table 2 for more information on the data quality and coverage. 3 Projection results for 213, covering 15 MS fleets, suggest that GVA to revenue decreases to 46%, gross profit margin increases to 19.5% of revenue and net profit margin falls to 4% 13
15 The fleet s improved economic performance in 212 was mainly a result of lower overall costs, which declined when compared to 211. More specifically, labour costs declined 6% and capital costs (mainly depreciation) 13%. However, as the EU fleet is very diverse, operating in many different fishing regions using a wide variety of fishing techniques, this overall positive evolution in 212 did not apply to all fleets. Five national fleets made overall net losses, and while the performance of the large-scale and distant-water fleets improved in 212, that of small-scale fleets tended to deteriorate. Economic performance projections for 213 suggest decreased revenue for nine out of 15 Member State fleets assessed. However, GVA as a proportion of revenue is expected to have increased or remained stable in 9 out of the 15 MS fleets, and gross profit and net profit margins are expected to have increased in about half of the fleets assessed. Results suggest that the performance of the small-scale fleet could deteriorate somewhat more, although to what extent is yet uncertain. The data available makes it possible to examine longer time series (22-212) but including only 11 MS fleets 4 (Figure 2). This time series analysis shows that the economic performance of the covered national fleets improved gradually over the period. This is due to a combination of factors including higher market prices for several commercially important species, improved situation of some stocks, implementation of long-term management plans under the CFP, capacity reduction in some fleet segments, etc. Time series also shows the impact of the fuel crises in 23 and 28, highlighting the vulnerability of the fishing sector to external shocks but also its resilience. Figure 2 Trends in fleet economic performance indicators: 22 to 212 Source: Member State data submissions under the DCF 214 Fleet Economic Drivers affecting the economic performance of the EU fleet Drivers that may have contributed to improve economic performance include, but are not limited to the following (in no specific order): Higher average first sale prices for many commercially important species, e.g. European pilchard, anchovy and brown shrimp; Recovery of some stocks, such as the Baltic cod, herring and North Sea plaice, leading to increased TACs and quotas; Research and innovation projects (more selective fishing gears, bio-marine ingredients facility) funded by the European Fishing Fund and national support; Capacity reduction (decommissioning with or without public support); 4 The performance indicators were estimated using DCR and DCF data on the following MS fleets: Belgium, Denmark, Germany, Finland, France, Italy, Latvia, Lithuania, Spain, Sweden and the UK. 14
16 Favourable market conditions (internal and export) for several species; Implementation of certification schemes and the growing demand for certified products; More fuel efficient fishing techniques and changes of fishing behaviour in order to reduce fuel consumption. Drivers that may have contributed to deteriorating economic performance include, but are not limited to the following (in no specific order): Increasing fuel prices and other operating costs; Effects of the global economic crisis that continue to affect internal and international markets for some species and limit access to credit; Reduced TACs and quotas for several key stocks, such as European sprat and Atlantic herring; Market saturation (e.g. Baltic cod) and poor marketing to place products on new markets; Low abundance (e.g. anchovy and pilchard in the Mediterranean) and/or low quality of some species (e.g. Baltic cod); Severe weather conditions and for a few number of fleets (e.g. Baltic and Celtic Seas) damage caused by marine mammals (e.g. seals); Shortage of local crews as young people in fishing communities are less and less attracted to fishing as a career choice; Increase in the number and size of areas that prohibit or limit specific fishing access/activity due to established restrictions for energy production or temporary closures of areas for stock recovery. Overview of the EU Fishing Fleet The total number of vessels in the EU fishing fleet on the 1st of January 212 was 86,283 vessels, with a combined gross tonnage (GT) of 1.7 million tonnes and engine power of 6.7 million kilowatts (kw). According to DCF data, the EU active fleet generated direct employment for around 151 thousand people in 212, corresponding to 12 thousand FTEs 5. The fleet spent almost 5 million days at sea 6, consumed around 2.4 billion litres of fuel 7 and landed 4.3 thousand tonnes of seafood in 212. The total amount of income from landings was estimated at almost 6.9 billion. The fleet made an additional 92 million in other income from non-fishing activities. Costs incurred by the fleet amounted to almost 6.5 billion: 5.6 billion in operating costs and 874 million in capital costs. The main costs items were labour (almost 1.8 billion in crew wages and 223 million in unpaid labour) and energy ( 1.6 billion). Other costs linked to production amounted to 957 million, while other non-variable and repair costs amounted to another 1.1 billion. Annual depreciation, totalling 84 million, accounted for 92% of capital costs, while the opportunity cost of capital was estimated at 7 million. Gross value added and gross profit generated by the fleet in 212 amounted to 3.3 billion and 1.3 billion, respectively. After deducting capital costs, net profit was estimated at 458 million, indicating that 6.6% of the fleet s revenue was retained as profit in excl. Bulgaria 6 excl. Cyprus and Greece 7 excl. Bulgaria and Cyprus 15
17 EU small-scale coastal fleet Based on EU Member States DCF data submissions, the EU small-scale fleet (SSF) consisted of around 51 thousand vessels and 74% of the EU active fleet in 212. The small-scale coastal fleet landed 6% of the landings in weight but around 12% of the landed value. This suggests that when compared to larger vessels, the small-scale fleet obtains on average higher first sale prices (higher value species composition and/or better quality of product). Over the period, the economic performance of the SSF has generally deteriorated and projection results for 213 suggest a continuing declining trend for this segment 8. Small-scale coastal fleet (SSF) is defined as all vessels under 12 metres using static gears. The SSF showed that despite representing only 8% of the gross tonnage it generated 48% of the total employment and 16% of the total GVA. EU large-scale fleet The EU large-scale fleet (LSF) comprised 74% of EU fleet tonnage and employed 48% of EU fleet employment. It landed 79% of the landings in weight and generated 71% of the landings value. The segment s contribution to GVA equated to 73%, 75% to gross profit and 72% to the net profit produced by the EU fleet. The LSF economic performance has generally improved over the period analysed. As the main fleet component in the EU fleet in terms of profit generation, the overall performance of the EU fleet is largely driven by the LSF. Large-scale fleet (LSF) is defined as all vessels using towed gears and vessels over 12 meters using static gears operating in EU fishing regions as well as in NAFO and NEAFC fishing areas Large-scale fleet (LSF) consumed 76% of the energy used by the EU fleet. In relative terms, the LSF generated gross profit and net profit margins of 22% and 7.6%, respectively. EU distant-water fleet There were 7 EU MS distant-water fleets (DWF) operating in 212 for which data were available 9. The DWF contributed 15% to landings in weight and 17% of the landed value generated in 212. The distant-water fleets covered contributed around 11% of the GVA, 14% of the gross profit and 19% of the net profit by the EU fleet in 212. In relative terms, it generated a GVA, gross profit and net profit margin of 41%, 3% and 8.9%, respectively. The economic performance of the DWF fleet has generally improved over the period. Distant-water fleet (DWF) is defined as all EU-registered vessels over 24 metres operating in Other Fishing Regions (OFR) including some EU outermost regions. This fleet segment accounted for less than 1% of the number of vessels but 18% of the EU fleet GT and 7% of the engine power. The DWF contributed to 4% of the EU fleet employment and deployed 2% of the effort in days at sea, but consumed 16% of the energy used by the EU fleet. 8 Contrary to larger vessels, SSF vessels have normally one employee on board, which in most cases is also the vessel owner. Owner/workers can chose, normally for fiscal reasons, between wages or profits. Low profitability could just be a result of a decision to have bigger wages. 9 Values provided for the EU distant-water fleet should be considered with caution, taking into account that the data availability on the EU distant-water fleet is limited and in many cases underreported or not provided due to data collection and/or confidentiality reasons (few fishing vessels owned by reduced number of enterprises). To protect commercial sensitive economic data, these fleets are often omitted or aggregated into other fleet segments. 16
18 EU Fishing Fleet Structure Fleet capacity: status in 212 The EU fishing fleet is very diverse, using a large variety of fishing gear types on vessels up to and over 14 meters in length. According to the DCF data submitted, the total number of vessels active vessels in the EU fleet in 212 was 68,935 vessels, with a combined gross tonnage (GT) of 1.5 million tonnes and engine power of 5.8 million kilowatts (kw) 1. The number of vessels (84,75) provided in Table 1 excludes inactive vessels from the French and Greek fleets (Table 1 and Table 2). The total number of vessels according to the EU Fleet Register in 212 numbered 86,283. Greece had the highest number of registered vessels in 212, accounting for 19% of the EU total. The Italian fleet was the second largest in number (17%), followed by Spain (12%). Spain s fishing fleet was the largest in terms of GT, with 24% of the EU total, followed by the UK at 12% and Italy at 1%. Italy s fishing fleet was the largest in terms of engine power, with 18% of the EU total, followed by Spain (14%) and then France (13%). Between 211 and 212, the number of vessels decreased or remained stable in all MS except for Ireland, Croatia and Bulgaria (Table 1). Table 1 DCF capacity data for the EU fishing fleet in 212 Arrows indicate change ( ) in relation to 211: ( ) increase; ( ) decrease and ( ) stable/no change ( between -1 and +1%). N vessels as % of total to 211 N of active vessels as % of total active to 211 N of inactive vessels as % of inactiv e to 211 Inactiv e as % of fleet BEL 86.1% 82.1% 4.%.% BGR* 2, % 1, % 1, % 1.4% CYP 1, % % %.6% DEU 1, % 1, % %.5% DNK 2,52 2.4% 1, % %.6% ESP 1, % 8, % 1,66 1.2% 1.9% EST % % 1.1%.% FIN 3,359 4.% 1, % 1,47 8.9% 1.7% FRA** 5,83 6.9% 5,83 8.5% -.% -.% GBR 6, % 4, % 1, % 2.2% GRC** 16,63 19.% 16, % - -.% -.% HRV 4,236 5.% 2, % 1,421 9.% 1.7% IRL 2,23 2.6% 2,24 2.9% %.2% ITA 14, % 12, % 1, % 1.8% LTU 151.2% 14.2% 47.3%.1% LVA 356.4% 279.4% 77.5%.1% MLT 1,6 1.3% % %.3% NLD 74.9% 558.8% %.2% POL 86 1.% % 38.2%.% PRT 8, % 4, % 4, % 4.8% ROU 261.3% 183.3% 78.5%.1% SVN 181.2% 89.1% 92.6%.1% SWE 1, % 1,19 1.5% %.4% Total 84,75 68,935 15,815 Source: Member State data submissions under the DCF 214 Fleet Economic. *Inactive vessels added to Total number of vessels for BGR and LVA due to incorrect submission of data; **Data on inactive vessels missing for FRA and GRC due to non-submission. With over 4, vessels, Portugal possessed the largest inactive fleet (26%), followed by the UK with 1,83 vessels (12%). However, in terms of gross tonnage and engine power, Spain possessed the largest latent GT and Italy the most inactive kw, with each MS covering 21% of the total 11. Inactive vessels for the selected fleets, represented on average 26% of the total number of vessels over the period , 9% of the gross tonnage and 14% of the engine power (Table 2). 1 These values may differ somewhat from the EU Fleet Register due in part to missing data on inactive vessels from several Member State fleets 11 excl. France and Greece 17
 as % of total to 211 Vessel tonnage (thousand GT) as % of total to 211 Inactive kw as % of total to 211 Inactive GT BEL 49.1 1% 15.3 1% 2.6 %.8 1% BGR 37.6 1% 5.1 % 25.")
19 Table 2 DCF capacity data for the EU fishing fleet in 212, continued Arrows indicate change ( ) in relation to 211: ( ) increase; ( ) decrease and ( ) stable/no change ( between -1 and +1%). Engine power (thousand kw) as % of total to 211 Vessel tonnage (thousand GT) as % of total to 211 Inactive kw as % of total to 211 Inactive GT BEL % % 2.6 %.8 1% BGR % 5.1 % % 2.3 2% CYP % % % 7.9 7% DEU % % 14. 2% 3. 3% DNK % % % 1.9 2% ESP % % % % EST % % 3.4 % 1.8 2% FIN % % % 4.2 4% FRA % % na - na - - GBR % % % % GRC % % - na - na - - HRV % % % 12. 1% IRL % % 3.8 4% 9.7 8% ITA 1, % % % 6.6 6% LTU % 45. 3% 5.1 1% 2.4 2% LVA 21.9 % 8.3 1%.8 %.1 % MLT % 8. % % 1.9 2% NLD % % % 5.6 5% POL % % 2.4 %.6 % PRT % % % % ROU 5.9 %.7 % 1.1 %.2 % SVN 1.1 %.8 % 3.8 1%.2 % SWE % % % 1.1 1% Total 6,534 1, as % of total to 211 Source: Member State data submissions under the DCF 214 Fleet Economic In 212, the EU SSF consisted of almost 51 thousand vessels, the LSF numbered 17.7 thousand vessels and the DWF 335 vessels, accounting for 74%, 26% and.5% of the vessels in the EU fleet, respectively. Greece, totalling 14.9 thousand vessels, possessed the largest SSF (29% of the total), followed by Italy (17%), France, Spain (each 8%) and then Portugal (7%). Combined, these five MS possessed almost 7% of the EU small-scale vessels. With almost 4,5 vessels, Spain encompassed the largest LSF (25%), followed by Italy (24%) and France (9%). Spain also possessed the largest distant-water fleet with 264 vessels, totalling 79% of the vessels and 63% of the gross tonnage and engine power of the EU distant-water fleet covered (see Annex Tables 6 to 8 and Figure 1, for a break-down of the EU fleet capacity by main type of fishing operation into small-scale, large-scale and distantwater fleets). Trends in fleet capacity: Overall, EU fleet capacity has decreased steadily over the years, with an average annual decrease of 2% in terms of vessel numbers and kw and 3% in GT. Between 28 and 213, the fleet decreased 8% in number, 11% in kw and 15% in GT (Figure 3). These decreases are mainly a result of MS attempts to bring their fishing capacity in line with fishing opportunities; reducing excess capacity through mechanisms such as decommissioning schemes and the introduction of tradable fishing right concessions (TFC or ITQs-Individual transferable quotas). Source: EU Fleet register Figure 3 Trends in EU fleet capacity:


 and Greece (18%) (Table 3).")
20 The number of inactive vessels has remained quite stable over the period, peaking in 29 and 21, mainly due to the increase of inactive vessels less than 12 metres. Despite the high number of inactive vessels in terms of GT, the percentage of the inactive fleet has decreased dramatically by 4% between 28 and 212. This decrease was more pronounced in the over 4m vessel length group, where inactive GT declined 6% over the same period (Figure 4). Figure 4 Trends in EU fleet capacity: Source: Member State data submissions under the DCF 214 Fleet Economic EU Fleet Socio-Economic Structure Employment and average wage: status in 212 According to the DCF data submitted by Member States, the number of fishers employed in the EU fleet 12 in 212 was 151,383, corresponding to 12,315 full time equivalents (FTEs). Three countries accounted for 6% of the total FTE employment levels: Spain employed 23%, followed by Italy (19%) and Greece (18%) (Table 3). Table 3 EU fleet employment and average wage by Member State, 212 Arrows indicate change ( ) in relation to 211: ( ) increase; ( ) decrease and ( ) stable/no change ( between -1 and +1%). Total employed BEL 351 % 334 % 74,38 78,166 BGR 13,466-7, CYP 1,29 1% 817 1% 1,297 2,47 DEU 1,752 1% 1,372 1% 28,97 35,879 DNK 1,469 1% 1,556 1% 71,851 67,816 ESP 34,399 23% 3,32 25% 16,775 19,43 EST 2,46 1% 54 % 2,42 9,169 FIN 2,16 1% 282 % 5,133 36,694 FRA 9,678 6% 7,375 6% 39,8 51,189 GBR 12,445 8% 9,868 8% 18,665 23,538 GRC 27,558 18% - 23,944 2% - 5,968-6,869 - HRV 1,125 1% 163 % 8,211 56,585 IRL 3,392 2% 2,233 2% 26,679 4,528 ITA 28,292 19% 2,716 17% 8,63 11,12 LTU 732 % 566 % 6,1 7,761 LVA 643 % 353 % 5,977 1,888 MLT 425 % 413 % 9,653 9,934 NLD 2,881 2% 1,769 1% 32,538 52,993 POL 2,54 2% 1,737 1% 6,51 9,385 PRT 16,143 11% 14,931 12% 8,813 9,529 ROU 471 % 39 % 671 8,22 SVN 17 % 63 % 12,19 2,514 SWE 1,663 1% 942 1% 18,244 32,192 Total* 151,383 12,315 14,358 18,66 * excluding Bulgaria as % of total to 211 FTE as % of total to 211 Av. wage per employed to 211 Av. Wage per FTE to 211 Source: Member State data submissions under the DCF 214 Fleet Economic 12 excl. Bulgaria 19

21 The average wage per FTE in 212 was estimated at 18 thousand. Belgian (FTE) fishers, at 78 thousand earned the highest wages on average; four times more than the average EU fisher. At 68 thousand, Danish fishers earned three and a half times more than the average EU fisher and Dutch fishers, at 53 thousand, three times more. In contrast, Cypriot and Greek fishers received an average wage of 2 thousand and 6.9 thousand, respectively (Table 3). These differences could be due to a variety of reasons including misreporting and only partial activity. When analysed by main fishing activity and in terms of total employment, the small-scale fleet employed 72.8 thousand fishers (48%), followed by the large-scale fleet with 72.3 thousand (48%) and the distant-water fleet with 6.2 thousand (4%). In terms of FTE, the large-scale fleet in turn accounted for 52%, the small-scale for 42% and the distant-water for fleet 6%. The different figures indicate that the SSF has more part-time employment than larger fleets (see Annex Tables 9 to 11). In fact, for most MS the lower ratio FTE/total employed observed in the SSF fleets suggests that fishing is mostly a part-time occupation in this segment. Average wage per FTE in the small-scale fleet was estimated at 8.5 thousand in 212. The same indicator for fishers operating in the large-scale fleet was 25.3 thousand while for fishers in the distant-water fleet, the average wage per FTE was surprising low ( 1.2 thousand) which may in part be due to high levels of employment of third country nationals that are paid relatively lower wages. Fishers engaged in the French distant-water fleet received by far the highest average wage ( 98,844) while large-scale Danish fishers received the highest average wage ( 81.6 thousand) in that segment, followed by Belgian fishers ( 73.8 thousand). Additionally, fishers engaged in the small-scale fleet received high wages if they were employed in the Danish and French fleets (see Annex Tables 9 to 11). Trends in Employment and average wage: Employment in the EU fishing fleet decreased steadily over the period. The number of fishers (and FTE), declined on average 2% per year. This decrease of on-board employment can be a result of the reduction in the number of EU vessels. Decreased employment was accompanied by a steady increase in average wage (+2% per year over the period) (Figure 5). Trends in fleet employment and wages by fishing activity can be found in Annex Figure 2. Figure 5 Trends in employment and average wage indicators: Source: Member State data submissions under the DCF 214 Fleet Economic EU Fishing Activity and Output Fishing Effort: status in 212 The EU fleet 13 spent almost 5 million days at sea in 212. The Italian, Spanish, French, UK and Portuguese fleets together accounted for 8% of the registered days at sea (See Annex Table 12). The EU fleet 14 consumed 2.4 billion litres of fuel (energy), 5% less than in 211. The reduction in fuel consumption is due to a variety of 13 excl. Cyprus and Greece 14 excl. Bulgaria and Cyprus 2
 but consumed less than a tenth of the fuel in 212.")
22 factors including the shift to more fuel efficient fishing gears, fleet reduction and changes in fishing behaviour and fleet dynamics. By fishing activity, the small-scale fleet deployed more than half of the total EU fleet effort in days at sea (54%) but consumed less than a tenth of the fuel in 212. Conversely, the large-scale fleet consumed 76% of the fuel for 44% of the effort in days at sea (see Annex Tables 13 to 15, Figure 3). Trends in fishing effort: Days at sea has declined on average 1% per year over the period. In parallel, energy consumption has been decreasing continuously, particularly after the fuel crisis of 28. As explained above, the reduction in fishing capacity and fishing fleet coupled with adaptions in the fishing technology and behaviour of the fleets may explain these trends (Figure 6). Average energy consumption per landed weight also revealed a decreasing, although less marked, trend. Despite lower energy consumption, energy costs have increased sharply since 29 due to higher fuel prices. Actually, the average price of fuel increased for almost all MS fleets (Figure 6, Annex Table 12). Figure 6 Trends in effort and fuel consumption: Source: Member State data submissions under the DCF 214 Fleet Economic. Landings: status in 212 According to DCF data, the EU fleet landed 4,295 thousand tonnes of seafood in 212, corresponding to 6.9 billion in landed value 15. Spain, the UK, France and Denmark together accounted for over half the landings in 212. The Spanish fleet landed the most, accounting for 2% of the landed weight, followed by the UK fleet (14%) (see Annex Table 16). In terms of landed value, the Spanish fleet generated the highest landed value (28% of the total), followed by the French (16%), UK (14%) and then Italian (13%) fleets (See Annex, Table 17). The SSF landed 6% of the landings in weight but accounted for 12% of the landed value in 212, indicating highvalued species composition and/or higher product quality. The LSF landed 79% in weight and 71% in value while the DWF accounted for 15% in weight and 17% in value (see Annex Tables 18 to 2). Trends in landings: Despite the decline in landed weight since 29-21, landed value has increased steadily from 29 to 211 but declined slightly in 212. A similar trend is observed when analysed by effort: an increase in landed value per day at sea since 29 and a decrease in the weight landed per day at sea from 21 (Figure 7). 15 excl. Greece, for both landed weight and value 21

23 Figure 7 Trend in landings weight and value: Source: Member State data submissions under the DCF 214 Fleet Economic Atlantic herring has remained the most landed species in terms of weight, surpassed only by sprat in 29, reaching a record high in 212. In terms of landed value, Atlantic mackerel and Norway lobster remained the two top species throughout the period, alternating places between 28 and 21, after which Atlantic mackerel has remained in first place, with a record high in 211 (see Annex Figure 4). Results by main fishing activity followed the general trend with landings in weight decreasing steadily since 29 for all fleet categories. While the average landed price for the LSF and DWF have generally increased over recent years, the SSF has suffered declines apart from an increase in 211. The DWF also suffered a slight decline in average landed price in 212 (see Annex Figure 5). Trends in fuel use intensity: Fuel use intensity for the EU fleet can be analysed as litres of fuel consumed per tonne of live weight landed and/or litres consumed per thousand landed. Results indicate that average fuel use intensity per tonne landed decreased between 28 and 21, but increased slightly in 211 and 212, because of the decrease in landed weight. Fuel use intensity per value of landings also decreased, with the exception of during the fuel crisis of 28. The sharp decrease from 29 to 211 is related to the increase in landed value and to the decrease in fuel consumption observed over the same period (Figure 8). As explained above the causes for the reduction in fuel consumption are due to a variety of factors such as more fuel efficient fishing gears, fleet reduction and changes in the fleet dynamics. Source: Member State data submissions under the DCF 214 Fleet Economic Figure 8 Trends in fuel consumption per tonne of live weight landed (litres/tonne) and fuel consumption per landed value (litres/thousand ): Compared to other vessels, small-scale coastal vessels are more fuel intensive, in terms of fuel per landed live weight but less fuel intensive in terms of litres per thousand landed. The difference can be explained by the higher value species composition landed by the SSF. On the other hand, results suggest that the distant-water fleet consumes less fuel per landed tonne. Yet, significant yearly variations occur, and in 212 it surpassed the large-scale fleet in the amount of fuel consumed per landed tonne. In the LSF, fuel consumption per landed tonne remained quite stable over the period while the amount of fuel consumed per thousand of landings decreased steadily since 29 (see Annex Figure 6). 22
24 EU Fleet Economic Performance Income and Expenditure: status in 212 In 212, the EU fishing fleet generated over 6.9 billion in revenue, consisting of 6.85 billion in seafood sales and 92 million in other income 16. The Spanish fleet generated the most amount of revenue (27% of the EU total), almost exclusively from landings income. The UK fleet, which was the third most important fleet in terms of revenue, generated the most other income (3% of the EU total), equating to almost 3% of its revenue (Table 4). Total costs, including capital costs but excluding fishing right costs, incurred by the fleet in 212 amounted to 6.48 billion. Of these, 5.6 billion (or 86.5% of total costs) were operating costs 17 and 874 million capital costs 18 (13.5% of total costs) (Table 5). Total costs to revenue was estimated at 93.4% in 212. For a breakdown of revenue and costs by fishing activity see Annex Table 21 to 26. Table 4 EU fleet revenue by Member State, 212 (million ) Arrows indicate change ( ) in relation to 211: ( ) increase; ( ) decrease and ( ) stable/no change ( between -1 and +1%). Landings income as % of total to 211 Other income as % of total to 211 Revenue1 as % of total BEL 76 1% 4. 4% 8.4 1% BGR 5 %.6 1% % CYP 7 % - % % DEU 148 2% 2.6 3% % DNK 378 5% 7.5 8% % ESP 1,98 28%.1 % 1, % EST 14 %.1 % 14. % FIN 39 1% 4.6 5% % FRA 1,65 15% % 1, % GBR % % % GRC HRV IRL 31 4% 5.2 6% 36. 4% ITA % % LTU 43 1%.7 1% % LVA 23 % 1.4 1% 24.7 % MLT 13 %.5 1% % NLD 358 5% 5.9 6% % POL 55 1%.2 % % PRT 439 6% 1. 11% % ROU.9 % % SVN 1.5 %.9 1% 2.3 % SWE 124 2% 5.6 6% % Total* 6, ,966 Total** 6, ,941 * excludes Croatia (HRV); ** excludes Bulgaria (BGR), Cyprus (CYP), Croatia and M alta (M LT) to 211 Source: Member State data submissions under the DCF 214 Fleet Economic HRV - questionable MS level data and inconsistent with landings value 1 Revenue excludes direct income subsidies and income from fishing rights but may include indirect subsidies such as fuel tax concessions 16 excl. Croatia and Greece 17 Operating costs consisted mainly of labour costs, representing 35.6% of total operating costs (amounting to 1.8 billion in crew wages and 223 in imputed value of unpaid labour) and 1.6 billion in fuel costs (27.6% of operating costs). Other costs linked to production amounted to 957 million, while other non-variable and repair costs amounted to 551 and 84 million, respectively. 18 Capital costs, consisting of 84 million in annual depreciation and 7 million in opportunity costs of capital, amounted to 13% of revenue. 23
25 Table 5 EU fleet cost structure by Member State, 212 (million ) Arrows indicate change ( ) in relation to 211: ( ) increase; ( ) decrease and ( ) stable/no change ( between -1 and +1%). Crew wages as % of total to 211 Upaid labour as % of total to 211 Energy costs as % of total Annual deprecia- costs costs tion capital BEL % 2.7 1% % 5.5 1% 1.8 1% 6.8 1% 9.3 1%.2 % 86.1 BGR 1.4 %.1 % 1.3 %.4 % 1.5 %.2 %.2 %.2 % 5.1 CYP.5 % 1.2 1% 3. % 1.7 % 4.5 %.1 % 3.8 % % 41. DEU % 1.6 5% % % % % % -.5-1% DNK % % % % % 2.7 4% % % ESP % % % % % % % % 1,79.4 EST 4.9 %.1 % 3.1 % 1.6 % 1.2 %.5 % 1.3 % -.7-1% 11.9 FIN 4.5 % 5.9 3% 11. 1% 4.8 1% 2.8 % 5.1 1% 3.4 % -.8-1% 36.6 FRA % % % % % % 2.9 3% 1,72.5 GBR % 12. 5% % % % % % % GRC % % % 4.1 7% % 7.8 1% % % 57. HRV IRL % 1. % % 27. 5% % % % % ITA % % % 42. 8% % % % % LTU 4.4 %. % % 6.1 1% 11. 1% 1.8 % 2.2 %.8 1% 37.9 LVA 3.8 %. % 4.9 % 1.4 % 3.7 % 6.3 1% 1.4 %.2 % 21.7 MLT 2.1 % 2. 1% 4.3 % 1.6 % 2.8 %.3 % 5.7 1%.4 % 19.2 NLD % 9.1 4% % % % % % % POL % 1.6 1% % 4. 1% 4.9 1% 5.3 1% 3.6 % 1.2 1% 49.3 PRT %.8 % % % % % 76. 9% % ROU.3 %. %.2 %.1 %.1 %. %.1 %.1 %.9 SVN.9 %.3 %.3 %.2 %.2 %. %.2 %.1 % 2.3 SWE % % % 2.3 4% 9.9 1% 9.3 2% %.9 1% Total* 1, , ,548 Total** 1, , ,482 Source: Member State data submissions under the DCF 214 Fleet Economic to 211 Repair costs as % of total to 211 Other variable * excludes Croatia (HRV) and Greece (GRC); ** excludes Bulgaria, Cyprus (CYP), Croatia (HRV), Greece (GRC) and M alta (M LT) as % of total to 211 Nonvariable as % of total to 211 as % of total to 211 Opport. cost of as % of total to 211 Total Costs to
.")
.")
26 Trends in income and expenditure: After increasing in 21 and 211, revenue generated by the EU fleet decreased in 212. However, costs decreased even more and the fleet was again profitable. Operating costs to revenue and total costs to revenue have remained relatively stable over the period (Figure 9). Source: Member State data submissions under the DCF 214 Fleet Economic Figure 9 Trends in revenue and main cost items: Economic Performance Indicators: status in 212 The amount of GVA generated by the EU fishing fleet in 212 was estimated at 3.3 billion. Gross profit 19 and net profit were 1.3 billion 2 and 458 million, respectively (Table 6). While GVA and gross profit suffered a marginal decline in 212 compared to 211, mainly due to lower revenue, net profit improved, and 6.6% of revenue was retained as net profit, an improvement on 211 results (Table 6). Analysis of economic performance in 212 by Member State revealed a mixed picture. The data suggests that 15 out of 18 Member States 21 generated net profits while three Member States (Belgium, The Netherlands and Slovenia) generated net losses in 212 (see Annex Table 27, Figure 8). Labour productivity (GVA/FTE) was estimated at 35 thousand, remaining rather stable (+1%) compared to 211. The Danish fishers were by far the most productive in 212, generating on average 156 thousand per FTE, followed by the Belgian ( 89 thousand) and Dutch ( 74 thousand) fishers (see Annex Table 27). In terms of capital productivity, i.e. profits in relation to capital invested, the EU fleet generated a 9.5% return on fixed tangible assets (RoFTA) in 212, a significant improvement on 211 results (5.8%). This indicator is one of the parameters considered in the balance of fishing capacity and fishing opportunities as a long-term performance indicators and it may be compared with the interest rate of an alternative investment (normally long term risk-free government bonds). In-year investments amounted to 419 million, 6% increase from the 396 million invested in 211, which could indicate some optimism in the future of the fishing sector (see Annex Table 28, Figure 9) 21. At fishing activity level, the large-scale fleet generated 73% of the total GVA in 212 and 75% of the gross and 72% of net profits. The small-scale fleet contributed the least to the gross and net profit generated (12 and 7%, respectively), while the DWF contributed the least to GVA (11% of the total) (see Annex Tables 29 to 31, Figure 1). Yet, in relative terms, the small-scale coastal fleet generated the highest GVA as a percentage of revenue while the distant-water fleet each generated the highest profit margin 8.9% in 212. Results suggest that the performance of the SSF deteriorated over the period while it improved for the LSF and DWF, although the DWF suffered a significant decline in 21 (Annex Table 32, Figure 1). In terms of capital productivity, the SSF generated a low return on fixed tangible assets (RoFTA) in 212 (2.8%), a slight decline on 211 results (3%); the LSF performed better generating a 6.6% rate of return (relatively modest for a high risk economic activity) while the DWF obtained an impressive 25% return on investment. 19 calculated as revenue minus operating costs 2 calculated as revenue minus operating costs and capital costs 21 excl. Bulgaria, Croatia, Cyprus, Greece, Malta 25
 (see Annex Table 33).")
27 In 212, the SSF had an estimated (depreciated) replacement value of 872 million and in-year investments amounted to 14 million (-1% compared to 211), indicating that 11.5% of revenue was invested in 212 (an increase of 4% compared to 211) (see Annex Table 33). The LSF had an estimated (depreciated) replacement value of 4 billion and in-year investments amounted to 388 million (+45% compared to 211), indicating that 7.7% of revenue was invested in 212 (see Annex Table 34). The DWF had an estimated (depreciated) replacement value of 298 million and in-year investments amounted to 7.6 million (-74% compared to 211), indicating that.7% of revenue was invested in 212 (see Annex Table 35). Table 6 EU fishing fleet economic performance indicators, 212 (million ) 22 Arrows indicate change ( ) in relation to 21: ( ) increase; ( ) decrease and ( ) stable/no change ( between -1 and +1%). Revenue as % of total to Operating 211 costs as % of total to 211 Capital Costs as % of total BEL 8.4 1% % 9.5 1% % 3.7 % % BGR 5.3 % 4.8 %.4 % 2. %.5 %.2 % CYP 6.7 % 11.1 % % % % % DEU % % % % % 6. 1% DNK % % % % % % ESP 1, % 1, % % % % % EST 14. % 11.3 %.6 % 7.7 % 2.7 % 2.1 % FIN % 34. 1% 2.6 % % 9.1 1% 6.6 2% FRA 1, % % % % % 7.3 2% GBR % % % % % % GRC HRV IRL 36. 4% % % % % % ITA % % % % % % LTU % % 3. % 12.9 % 8.5 1% 5.5 1% LVA 24.7 % 2.1 % 1.6 % 8.5 % 4.6 % 3. 1% MLT 13.1 % 13.1 % 6.1 1% 4.2 %.1 % % NLD % % % % % % POL % % 4.8 1% % 11. 1% 6.2 1% PRT % % % % % % ROU.9 %.7 %.2 %.6 %.3 %.1 % SVN 2.3 % 2. %.3 % 1.6 %.3 % -. % SWE % % 24. 3% % % 2.2 1% Total* 6,966 5, ,33 1, Total** 6,941 5, ,326 1, to 211 as % of total * excludes Croatia (HRV) and Greece (GRC); ** excludes Bulgaria (BGR), Cyprus (CYP), Croatia (HRV), Greece (GRC) and Malta (MLT) GVA to 211 Gross profit as % of total to 211 Net profit as % of total to 211 Trends in economic performance: Overall, the economic performance of the EU fleet improved in 212 compared to 211, however, showing some signs of stagnation (Figure 11). Source: Member State data submissions under the DCF 214 Fleet Economic (MARE/A3/AC(214)). Figure 1 Trends in fleet economic performance indicators: Note: Total* Croatia excluded due to unreliable income estimates; Greece excluded as only costs were provided (no income). EU** provides estimates excluding Cyprus, Croatia, Greece and Malta for consistency and comparison with economic performance indicators. 26
28 Fleet performance in terms of GVA as a percentage of revenue and gross profit margin declined steadily after peaking in 29, mainly reflecting lower fuel prices as revenue declined, levelling off between 211 and 212. Net profit margin has remained rather stable but positive over the period with marked improvements in 21 and 212, reaching its highest point in 212 (Figure 11). Labour productivity, defined as gross value added per FTE (GVA/FTE), measures the amount of output produced by the amount of labour and gives an indication of the economic growth in the sector. Labour productivity in the fishing fleet increased over the period analysed, stabilising between 211 and 212 (see Annex Figure 11), although decreasing steadily in the SSF, where productivity is on average lower. Fishers in the LSF appear more efficient, generating on average more output per employee while results for the DWF shows significant variations. The ratio between the number of jobs and vessel gross tonnage provides an indication of the labour and capital use on-board vessels: the higher the ratio, the more labour intensive the vessel is and the lower the ratio the more capital intensive or industrialised (see Annex Figure 12). Over the period, the number of jobs per vessel has remained quite stable while the number of jobs per GT increased between 28 and 212. As expected, the SSF is more labour intensive, with a high number of jobs per GT. Conversely, the large-scale and the distant-water fleets are more capitalised, revealing lower jobs to GT ratio values (see Annex Figure 13). Economic Performance Assessment for 213 Due to the 2-year lag in data collection, the most recent economic data available in 214 refers to the year 212. In order to bring the report more up to date, economic performance indicators for 213 were estimated based on transversal data (effort, landings and capacity) and preliminary landings income data for the year 213 (see methodology section). Not all MS were in a position to provide the necessary data within the time-frame and hence, EU fleet level projections for 213 were not possible. Projections suggest that although fleet revenue decreased in most Member States, GVA as a proportion of revenue increased or remained stable in 9 out of the 15 MS assessed (Figure 12, see Annex Table 36 and 37). Therefore, improved economic performance in 213 is expected for roughly half of the national fleets. Although preliminary economic performance projections for a number of key fleets in 213 suggest mixed performance, it was not possible to project an overall economic position in 213 for the whole EU fleet due to insufficient data on a number of Member States fleets. Projection results by fishing activity suggest that the performance of the SSF deteriorated further in 213 while the LSF generated a higher net profit (see Annex Figure 14). Due to limited data, results for the DWF should be considered with care. Source: Member State data submissions under the DCF 214 Fleet Economic Figure 11 Projection performance results for 213 by MS 27
29 EU Member State Fleet Summary Report A summary of the main issues affecting the economic performance of each EU Member States national fleet in 212 and 213 are summarised below: Belgium The Belgian fleet mainly consists of beam trawlers operating in the North Sea, English Channel and other areas of the North Atlantic. Belgian fleet capacity decreased further in 213. Additionally, the deteriorating trend observed over the last few years is expected to continue, with poor performance projected for 213. The Belgian fleet has high operating costs, accounting for over 85% of revenue in 213, with crew and fuel costs alone accounting for 7% of revenue. Bulgaria National Fleet In 213, the Bulgarian fishing fleet with an average age of 19 years consisted of 2,54 vessels, of which 862 were inactive. The overall size of the Bulgarian fishing fleet decreased between 212 and 213; 2 vessels were scrapped through EFF before 211. Landings weight increased to 8.1 kilo-tonnes from 7.6 kilo-tonnes in 211 and landed value increased from 2.7 million to 4.4 million. In terms of employment, the fleet generated 5,638 jobs, corresponding to 2,872 FTEs; the level of employment increased 72% compared to 211. Gross Value Added (GVA), gross profit and net profit generated by the Bulgarian fleet in 212 were 2 million,.5 million and.2 million, respectively. According to the data, GVA increased 231% and gross profit and net profit increased by 117%, and 15%, respectively, between 211 and 212. Due to the inconsistent data on landings income and other income reported under the DCF, these estimates are questionable. The main factors that influenced the economic status of the Bulgarian fisheries sector in 212 were: absence of bank credit lending policy, something which is desperately needed to facilitate the development of the sector; a comparatively large number of ageing vessels; poor weather conditions and poor domestic consumption demand due to a lack of affordability. Most of the fishing activities are carried out in territorial waters up to 12 nm. There are quotas for two species in Bulgaria, turbot and sprat. The Black Sea TAC (quota regime) was introduced in 28, following the accession of Bulgaria and Romania to the European Union (EU). A decreasing trend in turbot biomass indices has been observed since 28, despite the presence of the quotas regime for turbot in community waters. For this reason, implementation of additional and more effective management measures restricting turbot exploitation is necessary. Bulgaria has made significant efforts in withdrawing vessels from the fleet, particularly in the 6-12mm 12-18m and 18-24m length classes. Small-scale Fleet The small-scale fleet has an average age of 24 years. Most of the vessels under 12m are engaged in small-scale coastal fishing with (anchored) gillnets. These vessels are generally owner-operated, for whom fishing is an additional income stream. The profit is the actual remuneration (wages) of the owner s work. There are limited human resources available and procedures to work with the data in Bulgaria; there is a difficulty in analysing the fishing effort data because of the large number of vessels under 12m engaged in mixed fisheries, targeting several species of fish at the same time using different fishing gears throughout the year. Furthermore, there is no established automatic system for fleet management and or separate fish markets. The presence of many very small landing ports and the fact that the majority of the fleet is under 12m creates difficulties with the accuracy of landings and their monitoring. Joint research conducted with Romanian scientists on turbot and sprat stocks in Community waters in 21 and 211 is a big step forward because it gives a more accurate picture on the stocks. Amendments have also been adopted in national legislation, which has enabled effective measures to be taken against inactive vessels. 28
30 Croatia National Fleet The Croatian fleet is highly diversified with a broad range of vessel types targeting different species predominantly in the Adriatic Sea. The national fleet consisted of 29 (DCF) fleet segments and 4,236 vessels in 212. The total amount of income generated in 212 was 994 million. The Croatian fleet s income increased 17% between 21 and 212. Total operating costs incurred by the Croatian national fleet in 212 equated to 783 million, amounting to 79% of total income. Crew cost and fuel costs, the two major fishing expenses, were 227 and 194 million respectively. Between 28 and 212, total operating costs increased by 19%, largely due to an increase in fuel costs, which amounted to 2% of total income in 212. In terms of economic performance, the total amount of Gross Value Added (GVA), gross profit and net profit generated by the Croatian national fleet in 212 were 4 million, 173 million and 124 million respectively. Gross Value Added (GVA), gross profit and net profit decreased 7%, 14% and 22% respectively between 211 and 212. The major factors causing the decline in economic performance included a 15% increase in fuel costs despite the number of days at sea remaining almost unchanged. While overall the fleet is profitable, with 16% of income being retained as net profit, there are considerable variations within the fleet segments and these are inconsistent within the segments or according to vessel size or according to the number of vessels within a segment offering little indication of the cause of the variability. The value of fishing rights showed a sharp increase of 29% between 21 and 211 reflecting optimism about the prospects of the industry. Small-scale Fleet The 7% increase in landed value between 21 and 211 is considerably poorer than the 19% increase experienced by the national fleet as a whole, indicating that the smaller vessels have not been able to exploit the species where demand has been strongest. Landings in weight remained stable over the period. Some 3 Marine Protected Areas are in the course of being established in Croatia. The importance of these to the fleets is variable but it is more likely that their impact will be mainly on the small-scale fleet which is less able to navigate longer distances to avoid them. Approximately 2 fishermen have lost their jobs due to vessel scrapping. In the near future, an increased number of small scale vessels is expected because some of them will start operating in a self employed manner. Due to reduced catches, increase in prices for European pilchard (sardine) and anchovy and, consequently, higher income for those targeting these species can be expected. Cyprus Passive gear vessels form the majority of the Cypriot fleet. Capacity increased between when measured in terms of number of active vessels, total kilowatt but total gross tonnage remained stable in contrast with the decreasing trend. Employment also increased. At the same time, profitability (in terms of both gross and net profits) decreased significantly and stayed negative showing a worrying situation for Cyprus. Small-scale fleet The small-scale fleet (defined as vessels below 12 meters using non-towed gears), represented more than 65% of the total active fleet. The amount of income generated by the small scale fleet accounted for 4.4 million in 212. The landings value generated by the small scale fleet has been decreasing from The small scale fleet made losses in 212 (gross loss of 3.8 million and net loss of 6.6 million). Whether the small scale fleet can halt the negative trend of the economic performance in the coming years is uncertain and potentially threatens the current level of fleet employment (732 FTE in 212). Large-scale fleet The Cypriot large-scale fleet comprised only 33 vessels in 212, with 2.3 million landings income and 85 full time employees. The economic performance remained negative but the fleet slowed down the negative trend in 212. However, the ability to maintain or increase the economic indicators for this fleet is uncertain. 29
31 Denmark Capacity in the Danish fleet decreased further in 213 when measured in terms of number of active vessels, total gross tonnage or total kilowatt. In 212 the Danish government cleaned up their register which resulted in a decrease of around 6 inactive vessels compared to the previous year. In 213, landings weight dropped drastically due to a decrease in quota for sandeels. The decreased landing weight of sandeel together with lower prices for Atlantic mackerel and Norway Lobster caused a decrease in total landings value. Small-scale fleet The small-scale fleet operates mostly in the Baltic Sea, and Kattegat. The amount of revenue generated by the small scale fleet equated to 27 million in 212, which is 7% of the national income for fisheries. The landings value generated by the small scale fleet increased 5% between The small scale fleet made losses in 212 (gross loss of.9 million and net loss of 5.1 million). The loss in gross profit decreased 5% and the net loss decreased by 15% from 211 to 212. Whether the small scale fleet can halt the negative trend of the economic performance in the coming years is uncertain. Large-scale fleet The total amount of revenue generated by the large scale fleet accounted for 359 million in 212. Landings value decreased 9% between The large scale fleet made profits in 212 (gross profit of million and net profit of 55.4 million). Most of the net profit is generated by the distant-water fleet targeting pelagic species such as sandeel, mackerel and herring. Gross profit increased by 1% and the net loss increased by 8% from 211 to 212. Estonia The Estonian national fleet includes three main segments: Baltic pelagic trawlers, small-scale fleet with passive gears and distant-water fleet. In 213, the Estonian fishing fleet consisted of 1,349 registered vessels, with average age of 2 years. The weight landed by the Estonian Baltic Sea fleet in 212 was 53 thousand tonnes of seafood, with a landed value of 14 million. The total weight of landings decreased over the period analysed. However, the total value of landings has remained rather stable. This shows a rise in average prices of key species. The higher first sales prices were primarily due to good export conditions. The decrease in quotas for the internationally TAC regulated species (European sprat and Atlantic herring) was the main reason for decreases in total weight landed. However, a slight increase in quotas and total catches took place in 213. The Estonian fishing fleet segments were profitable in 212. Fisheries subsidies paid in 212 to fishing companies for permanent cessation of fishing activities by scrapping or permanent reassignment of fishing vessels amounted to nearly 251 thousand. In addition, 34 thousand was paid for investments on board fishing vessels. The rise in fuel prices will be an important factor influencing fleet economic performance in the coming years. The main management measures in Estonia are individual volume quotas (ITQs) in the open water fisheries (both Baltic and Atlantic trawling) and gear usage quotas (ITE; individual transferable effort) in the Baltic coastal fisheries. The Estonian experience shows that ITQs are an effective method for increasing the allocation of fishing rights to the most effective enterprises and speeding up the process of reducing excessive fleet capacity. The number of trawlers decreased significantly during the ITQ period (since 21). In 2, there were 189 vessels in the Estonian Baltic trawling sector and after 14 years, this number decreased to 37 and is likely to decrease even further. Small-scale fleet An important increase in size took place in the small-scale fleet in 213. The small scale fleet increased as fishing capacity was released in other fleet segments and the Ministry of Agriculture decided to use it in order to meet the additional need for small scale fishing vessels to enter into the register. Finland National Fleet The Finnish national fleet is based mainly on pelagic trawling and small scale fishing. The pelagic trawler fleet is the dominant fishery in terms of weight and value. In 212 the profitability of the fleet as a whole turned positive. Baltic herring stocks are currently exceptionally strong especially in the most important fishing grounds in Bothnian 3
32 Bay. Catches in 212 and the 213 for herring were at record highs. The market situation has also been favourable and therefore the economic performance of the pelagic trawlers looks promising for the near future. Small-scale fleet The coastal small scale fleet is the biggest Finnish fleet segment with 1,89 vessels. Increased seal populations have strongly influenced the coastal fishery for several years. Many fishermen have had to stop their activity in traditional fishing grounds. An EMFF subsidy scheme was put in place to support fishermen to continue fishing elsewhere. There was also a pilot project to subsidise intensive fishing for low value fish (mostly cyprinid fish) to remove nutrients from the water system. This has contributed to a new method of fishing and created new markets for non commercial species. There is a high variation in the activity and the economic performance varied with the activity. Overall the segment as whole turned positive in 212. France National Fleet The size of the French fishing fleet decreased between 28 and 212, with the number of vessels decreasing by 11%, and GT and kw decreasing by 16% and 1% respectively. Year 212 remained broadly stable compared to 211 in terms of landed value, due to a slight increase in the weight of landings combined with a decrease in average landed price. The gross profit margin reached 14.3% for the national fleet in 212, against 15.7% observed in 211. Economic performance differs significantly nevertheless between fleet segments and supra regions. Fuel prices remained high in 212, and had a direct negative impact on vessel profitability, especially for demersal, pelagic trawlers and dredgers. In the Atlantic region, the situation differs depending on ports, fishing gear used and target species. Abundance of species was generally good in 212, however resulting in a reduction in average prices for some (monkfish, hake, etc.). Economic situation in the Mediterranean Sea, which was particularly worrying in 211, remains fragile due to the lack of abundance of pelagic species in 212 (anchovy, pilchard). Year 212 was also the last year of "European payback" from the French purse seiners. Thereby, 213 quotas of bluefin tuna for Mediterranean seiners have returned to normal levels in 213 (around 2, tons). Small scale Fleet / Large-scale fleet The total weight landed by the French small-scale fleet in 212 represented 14% of the total weight and 17% of the total value of the national fleet. The gross profit margin reached 18.6% for the national fleet in 212, against 21% observed in 211. The total weight landed by the French large-scale fleet in 212 represented 7% of the total weight and 68% of the total value of the national fleet. The gross profit margin reached 12.1% for the national fleet in 212, against 14.2% observed in 211. Long Distant-water Fleet Total revenue increased significantly between 211 and 212 (+21.6%). This good economic year is due to an increase of average prices, especially for yellowfin tuna. This favourable situation is explained both by the stability of the global production and the development of new markets. During the year 212, the frequency of piracy has decreased significantly in the Indian Ocean. However, the instability of access to the resource (non-renewal of EU bilateral fisheries agreements with some African countries for example) may have an impact on the economic sustainability of this fleet in the coming years. A significant proportion of the catch is indeed caught in exclusive economic zones. Germany National Fleet The German fishing fleet decreased further in size in 213 in terms of vessels numbers. One demersal trawler vessel from the high seas fleet was sold outside Germany. The number of cutters and small-scale fishing vessels decreased, thus continuing the long term trend. Fleet segments were affected differently by price and quota 31
33 developments. The most striking development for the cutter fleet was the considerable increase in revenues from brown shrimp landings; the price more than doubled in 212 after the 211 crash and basically remained at that level in 213. Therefore, the economic situation became satisfactory again for the shrimp beam trawl fleet as the total catch remained stable. As a consequence, owners increased investments. The North Sea plaice stock was assessed at another all-time high, and thus quota increased again as well. However, the benefit for the fleet was limited due to decreasing prices even dropping to the intervention price at one point. Saithe fisheries in the North Sea were satisfactory. The lower quota was fully exploited, but decreasing prices affected the profitability in 213. The MSC certification of this fishery has been renewed in 212 and again proven conducive for marketing. The Nephrops fishery has become more and more important for the German cutter fleet due to the possibility of international quota exchange. The Cod fishery in the North Sea was regarded as satisfactory due to stock recovery. Baltic cod quota had increased, but was not fully exploited. The considerable stock increase led to a lack of food. Thus the fish showed sign of malnutrition which resulted in decreasing prices. Moreover, Baltic cod did not aggregate as usual, according to the fisheries, thus leading to lower hourly catches in spite of increased stock. Small scale Fleet The coastal fishery on Baltic herring was satisfactory, and the considerably increased quota could be fully exploited in short time in 213. Due to the still pending long-term management plan Baltic herring could not be MSC certified. As several buyers only accept certified herring, prices were not always at a satisfactory level. Distant-Water Fleet According to the German fishing industry, 213 was a mediocre year for both pelagic and demersal trawlers, particularly due to the unresolved dispute on Atlantic mackerel. One large demersal trawler exited the German fleet due to decreasing fishing opportunities in Greenland waters, according to information from the sector. On the other hand, considerable investment has been undertaken for modernising the high seas fleet. This mainly referred to on-board processing facilities and cooling technology. In 213 the construction of a new pelagic trawler has been initiated which is expected to be operational in 215. The MSC certification for fisheries cod, saithe and haddock in the North Sea and in Norwegian waters was successfully renewed. The annual audit for fisheries on North Sea herring (including Norwegian waters) was passed successfully. Due to the ongoing uncertainties over quota allocation on Atlantic mackerel the certification was cancelled causing negative consequences for the participating industry. Cod fisheries in the Svalbard, Barents Sea and Norwegian areas were efficient. However, decreasing prices had a negative impact on profitability. The saithe fishery in the North Sea did not entirely fulfil their expectations. The Greenland halibut fishery was efficient and led to positive results. The demersal high seas fleet did not perform any fishing activities in the North Sea. Quota was exchanged with the cutter fleet. The pelagic fleet experienced good results in the North Sea and North Atlantic fisheries on herring, jack mackerel and mackerel. The quota for blue whiting was unsatisfactory, but as in 212 partial compensation could be achieved through the fishery on argentine. Some fisheries for both pelagic and demersal redfish were opened up in 212. In 213 no fishery took place in African or pacific waters. Greece National Fleet The Greek fishing fleet continues to fall steadily in terms of vessel numbers, gross tonnage and total power in 212. Total employment was estimated at 27,558 jobs corresponding to 23,944 FTEs in 212. The fishing fleet spent an estimated 2.8 million days at sea and consumed in total around 115 million litres. The fleet s economic performance reveals a net loss. The main costs include energy costs and wages as well as the imputed value of unpaid labour. In Greece, the majority of vessels (93%) are small-scale vessels. The small-scale fleet employs a total of 19,394 FTEs, thus contributing 81% of the total national employment in the sector. 32
34 The polyvalent passive gear segment is the most important fleet segment. It comprises 94% of the vessels, represents 56% of the total value of national landings and employs 82% of the national FTEs. This fleet segment made net losses. The main cost is the imputed value of unpaid labour, which, in fact, represents the value of the owner s work. The bottom trawler segment includes 3% of the Greek fishing fleet (54 vessels). It produces 26% of the national landings and employs 7% of the national FTEs. This segment provides positive net profit. Energy costs is the main cost item. Other important expenses are crew costs as well as variable costs. The purse seiner segment is a small segment (252 vessels), representing 2% of the Greek fishing fleet. It produces 13% of the national landings and employs 9% of the national FTEs. The purse seiner 12-18m segment generated net profits. The main costs of the purse seiners are wages and salaries of the crew. Ireland National Fleet The composition, by segment, of the Irish national fleet (i.e. >1m and <1m LOA) in 212 and 213 reflects that reported for 212. No significant removals or additions to the national fleet occurred, other than adjustments due to accidental loss, damage and occasional redundancy. In terms of the profitability and development trends the national fleet improved for net profit margin (%), RoFTA (%) and GVA per FTE (thousand ). Running costs continue to be a key driver influencing the economic performance of the Irish national fleet in 213, particularly those associated with the identification and retention of crew and the cost of fuel and oils which both increase from 211 to 212. Although marine gas oil prices throughout 212 and into 213 have shown some volatility they have maintained a slow annual increase in average price, which is consistent with the 5 year trend in the prices of crude, bunker and marine gas oil. Landing value and weight increased from 211 to 212 with landings of Boarfish (BOR and BOC) contributing significantly to this increase. Small-scale fleet The number of vessels (under 1m) rose by 3% every year from 211 and prior to 211 increased by 8% and 5% between the years 28/29 and 29/21 respectively. Overall, this represents a 25% increase in the number of under 1m vessels from 1337 to 1677 between the years 28 and 213. The number of the small-scale fleet demonstrates a similar trend (under 12m passive gears). This segment consisted of 1317 vessels in 213, an increase from 1159 vessels in 29. Figures for small-scale fisheries for static gears, under 12m only, also demonstrate a 4% increase from 211 to 212. Italy National Fleet The economic performance of the Italian fleet in 212 was negative, with decreased revenues and profits when compared to the previous year. For the last few years, several factors have greatly contributed to reduced profit margins of fishing enterprises. While the overexploitation status of some assessed stocks could have had an impact on this trend, other factors seems to have affected the fall in total captures and unitary productivity, even more strongly than the decrease in stock abundance, and include: increase in fuel price, changes in fishing zones due to increased production costs, and a different catch composition, which targeted the most sought-after species in domestic and International markets. However, according to the 213 projections, a slight increase in the economic performance of the fleet can be expected, mainly triggered by the increase in income levels. Gross profit and net profit generated by the Italian national fleet in 213 reached the highest values over the last three years. The recovery of the sector also seems to be confirmed by the trend observed in the profitability indicators, such as the net profit margin and the RoFTA indicators. The size of the Italian fishing fleet decreased between 212 and 213, with the number of vessels decreasing by 2% and GT by 7%. 33
35 Small-scale Fleet The small-scale fleet was not particularly profitable in 212, with a reported gross profit of around 82 million and an estimated net profit of 38 million, a reduction of 19% and 29%, respectively from 211. The sustained increase of intermediate costs, together with a decrease in production level, eroded added value and profits; further weakening the sector already in an economic recession. Several factors affected the decrease in total captures and unitary productivity, such as the increase in fuel price and the implementation of new restrictive management measures. However, according to projected data for 213, the trend is improving, mainly driven by an increase in total landings. In 212, 11 Local Management Plans were implemented. They contain restrictive management measures in order to reduce fishing effort, to improve the state of fishery resource, to limit the conflict between other users (sport and recreational fisheries, tourism). These local plans represent a completely innovative intervention tool in the range of available management measures and are expected to have a positive impact on the state of the resources as well as on the economic profitability of the small-scale fleet. Large-scale fleet This fleet includes trawlers, dredgers, purse seiners and pelagic trawlers. In 212, the economic performance of these fleets was mostly negative, with a reduction in gross profit of 19% compared with the previous year. According to projected data for 213, income will continue to decrease, but profitability will increase slightly. This can be explained by the reduction in operating costs that was driven by the decreased number of days spent at sea, a responsible strategy undertaken by the fishing operators to face the increase of intermediate costs. At the end of 213, 22 fishing effort adjustment plans and several national management plans were implemented. They are expected to achieve significant improvements in the biological and economic sustainability. Latvia National Fleet In 212, the Latvian Baltic Sea fishing fleet consisted of 279 registered vessels, with a combined gross tonnage of 8.3 thousand GT and total power of 21.9 thousand kw. The size of the Latvian fishing fleet has followed a decreasing trend between 211 and 212. The number of vessels declined by 13% (or 4 vessels), while the total GT and kw of the fleet declined by 2% during the same period. The general reason for the changes was connected to the vessel scrappage program according to the multi-annual management plan to achieve a better balance between fishing capacity and the available resources. Vessel scrapping between 28 and 212 and changes in the structure of fleet segments had a positive impact on incomes and minimised total costs. The total weight landed by the Latvian fleet in 212 was 57.5 thousand tonnes of fish, with a landed value of 23.4 million. The total weight of landings declined 9% between 211 and 212 and the value of landings increased 8% during the same period. The main reason for the decrease in weight of landing was reduced Latvian quota for European Sprat in the Baltic. The Gross Value Added (GVA) and gross profit decreased by 2% and 36% respectively between 211 and 212. Therefore in terms of profitability, the total amount of Gross Value Added (GVA), gross profit and net profit generated by the Latvian national fleet in 212 was 8.4 million, 4.6 million and 3. million respectively. Small-scale Fleet The number of vessels in the small-scale fleet decreased 16% between 211 and 212. Landings weight decreased 14% while the value of landings increased 18% and was around 1.4 million between 211 and 212. The smallscale fishing fleet is important for employment in coastal regions and was estimated at 258 jobs, corresponding to 154 FTEs. Total employment and FTEs for small-scale fleet decreased 2% and 24%, respectively over the observed period. While total costs increased 19%, net profit increased during the same period by 12%. Gross Value Added (GVA) and gross profit, increased by 11% between 211 and 212. Nevertheless the share of landings generated by small coastal vessels to total income is quite insignificant, around 6%. Distance-water fleet In 212, Latvia had two distant water trawlers over 4m operating in the North Atlantic and five trawlers operating in the CECAF area (EEZ of Mauritania and Morocco), which all belong to three fishing firms. 34
36 Lithuania National Fleet The total amount of income generated by the Lithuanian national fleet in 212 was 42.8 million representing an 8% annual decrease. Total revenues consisted of 98% of fishing income and less than 2% of other income. Total operating costs equated to 34.9 million and were 12% lower compared to the year before. In 212 sea fisheries employed 732 people, corresponding to 566 FTEs. The level of employment during 211 and 212 slightly decreased and FTE was more or less stable in this period. In fact these changes were mostly influenced by distantwater fisheries due to temporary outage for vessels in the CECAF area. Small-scale The fleet targets a variety of species but in particular Baltic cod, European smelt and Baltic herring. In terms of value of landings the main part of income comes from Baltic cod and European smelt, with marginal differences between them. In 212, the total income was almost.33 million and around 3 FTEs were employed in this fleet segment. This fleet segment was profitable, with a reported gross profit of around.134 million and net profit of.123 million in 212. Regarding profitability and development trends between 211 and 212, the small-scale fishery performed relatively well and improved in such positions as net profit margin and return on tangible assets. Large-scale For demersal trawlers the main target was Baltic cod, though a certain part of this segment performed mixed fisheries using a second gear for pelagic species. The catches of Baltic cod have a tendency to decrease despite the constantly increasing quotas. Around 84% of catches are landed in national ports according to legal obligations. This segment is energy demanding and expenditure for fuel amounted to 36.7% of total operating costs. The national landing obligation, mentioned above, from one point of view adversely affected profitability for an already inefficient old fleet. Increased effort in days at sea increased production cost, while weight with that effort declined as well. The insufficient level of cod price in local markets resulted in weak economic performance for the demersal trawler segment. Net profit margin for the demersal trawler segment was around 1% and was the lowest value among the national fleet. Large-scale vessels such as pelagic trawlers demonstrated good economic results. Increased demand for small pelagic species at sufficiently good prices lead to high profitability even with decreased effort. For example, days at sea between 211 and 212 decreased 1%, whereas net profit increased 27%. Distance-water fleet Long distance vessels predominantly operate in CECAF region (area 34) and some vessels fishing in the North Atlantic (area 27). In the CECAF region the fleet was targeting mainly small pelagic species, such as Cunene horse mackerel and Round sardinella, whereas vessels from Area 27 were fishing sandeels, Atlantic redfish and northern prawns. In 212, the total income was almost 35.6 million and around 355 FTEs were employed in this fleet segment, contributing to 83% and 63% of the total income from landings and FTEs generated by the Lithuanian fishing fleet, respectively. This fleet segment was profitable, with a reported gross profit of around 6.8 million and net profit of 4.2 million in 212. Despite outstanding problems in the long distance fleet, with bilateral agreements with third countries and relatively unfavourable conditions for Lithuanian pelagic vessels fishing in the CECAF area which reduced effort around 19%, economic performance was sufficient with an annual increase of net profit by 2%. Malta Overall, at the Maltese national fleet level increases in landings weight and higher average prices resulted in a 1.3% increase in the value of landings, from 11.3 million in 211 to 12.6 million in 212. Total operational costs and energy consumption for the year 212 are expected to decline, consistent with the decrease in effort (days at sea) which decreased by 18.5% between 211 and 212. Fleet profitability in 211 was weak in nearly all fleet segments and this is expected to continue in future years considering the current trends but the economic development trend may improve in some sectors. From the socioeconomic performance trends observed in the latest years (21 and 211) for the 14 segments analysed, over a third of the segments (5 segments) improved but these are mainly small-scale fleet segments and the 18 24m demersal trawlers. For the demersal trawl fleet segment, the situation is not expected to improve for several reasons. One reason is the rising fuel prices, which form a considerable percentage of variable costs. In addition, area restrictions to trawling around Malta may be implemented, which will greatly affect trawlers 35
37 targeting demersal and deep-water shrimps. Therefore, economic performance is expected to remain low and potentially deteriorate further. Most other economic variables for the year 213 are not expected to change drastically. However, fuel costs are expected to increase due to the substantial rise in fuel prices and consequently, profitability from this point of view is expected to be negatively affected. Small-scale Fleet The small scale fleet decreased significantly between 21 and 211, however the economic performance increased and the improving trend in the small-scale fleet segments is expected to continue into the future. The Netherlands National Fleet In 212 the Dutch fisheries sector was not profitable. The major factors causing the deterioration in economic performance include lower income due to decreasing prices for fish and higher costs, mainly by higher fuel prices. Additionally, the pelagic fleet lost fishing opportunities in 212. Fishery licenses for African waters were not prolonged and fishing in Pacific waters was not profitable due to poor catches. Some pelagic vessels could not fish for some months and were tied up temporarily. Due to research and innovation projects in the demersal sector, in 213 the economic performance of the Dutch fleet showed some improvement and turned from making a loss to slightly profitable. The most important issues in the Dutch fishery sector are: Flatfish fishery in general (beam trawl 12 18m, 24 4m and over 4m segments) Introduction of pulse technique as an alternative for tickler chains in beam trawl: In 29 only 5 vessels received a permit, in 211, 15 more vessels (i.e. totalling 2) were allowed to start and to invest in pulse technique by the ministry. Performance of vessels using pulse was quite positive, both in sustainability and economically. In 212, an additional 22 vessels (i.e. totalling 42) were allowed to invest in pulse technique (temporary permits) and those entrepreneurs started fishing during 212. In addition to that, another 42 fishermen applied for permits and recently (March 214) they were allowed to start using pulse technique (total number in 214 will be 84, after completion of investments). Permits are given on a temporary basis and it is still uncertain whether these permits will be transformed into permanent ones. Economic, ecologic as well as societal reasons (increase in profitability, avoiding discards (discard ban), Natura 2 and closed areas, market requirements and responsible fisheries) force fishermen to innovate and to invest in more sustainable and economic viable flatfish fishing techniques (as an alternative for beam trawl). Saving fuel and costs (up to 5%), better wages for the crew, better profitability, less discards and less impact on the seabed are the most important advantages of using pulse technique to catch flatfish. Shrimp fishery in general (beam trawl 18 24m segment) Introduction of pulse technique: In 211 the ministry of Economic Affairs allowed some vessels from this segment to invest in pulse technique, suitable for shrimp fishery. The economic performance of these shrimp vessels (on an experimental, but commercial basis) is rather promising and it is expected that results will improve in the future, compared to traditional beam trawl. Other shrimp fishermen applied for permits but until now (214) they are prohibited from using the pulse technique. The permits were given on a temporary basis and it is still uncertain and unclear if the permits will be transformed into permanent ones. Distant-water Fleet (pelagic trawl over 4m segment) In 212 (and 213 also) this segment faced problems with effort in African waters and in the Pacific. EU appointments and contracts with Mauritania stopped. Mid 212, a part of the capacity of the Dutch pelagic fleet was tied up. As a result of that, effort and volume went down by 23% and 8%, respectively. It looks like that in (mid) 214 fisheries in African waters will start up again but negotiations are still going on. Small-scale Fleet This part of the fleet operates in the coastal zone and depends highly on sole catches. Other species of less importance include turbot, cod, mullet and seabass. The state of the sole stock is very important and (seasonal) effort and economic performance depends largely on that. The gill net fishery was profitable but because of lack of quota and high competition (high price quota) they are not able to lease quota from other fishermen. 36
38 Poland National Fleet In 213 the Polish fishing fleet consisted of 836 registered vessels, with a combined gross tonnage of 57 thousand GT, a total power of 98.4 thousand kw and an average age of 28 years. The number of vessels remained unchanged between 211 and 212; however GT and kw decreased 11% and 5%, respectively. The total weight of seafood landed by the Polish fleet in 213 was 195 thousand tonnes (8% more than in 212). The national fleet consisted of 8 (DCF) fleet segments in 212, with 4 inactive length classes consisting of 43 vessels. One of the active fleet segments made losses in 212 while 5 made an overall profit (information lacking for deep sea fleet segment). The total amount of Baltic Sea fleet landings was 133 thousand tonnes, with a landed value of 56 million. The total landings weight and value of the Baltic Sea fleet increased 2% between 212 and 213. In 213, European sprat generated the highest landed value in Baltic fisheries, followed by Atlantic cod, Atlantic herring and then European flounder. The major factor causing the growth in 213 weight and value of landings was high pelagic catches and prices. The total amount of income generated by the Polish Baltic fleet in 212 was 55.5 million (without subsidies), a 21% increase between compared to 211. In 213 the Polish small-scale fleet consisted of 585 registered vessels, with a combined gross tonnage of 2.7 thousand GT, a total power of 21.1 thousand kw. The size of the fleet increased between 212 and 211, with the number of vessels increasing by 6% and GT and kw by 11% and 7%, respectively. The major factor causing the small-scale fleet to increase was termination of the cod management plan. The total amount of income generated by the Polish small-scale fleet in 212 was 12 million (without subsidies, which amounted to 1.5 million). The Polish small-scale fleet s total income increased 9% between 211 and 212. Crew cost and fuel costs, the two major fishing expenses. Gross Value Added (GVA) increased by 6%, gross profit and net profit decreased 31% and 34% respectively between 211 and 212. The major factors causing the deterioration in economic performance include increases in labour, energy and non-variable costs. The Polish large-scale fleet s total income increased 25% between 211 and 212 and amounted to 43.3 million (without subsidies million). The net profit margin development trend for large-scale Baltic fleet improved significantly and the indicator improved in 212 compared to 211 (1%). This may be explained by high increase in prices of small pelagic species. Similarly RoFTA and GVA per FTE indicators improved in 212 compared to 211 as well as the development trend had improved compared to the average. Gross Value Added (GVA) increased by 31%, gross profit and net profit increased by 39% and 37%, respectively, between 211 and 212. The major factor causing the improvement in economic performance was again high herring and sprat prices. Total amount of landings by the deep water fleet was 61.4 thousand tonnes in 213, a 4% increase compared to 212. In 213, Atlantic horse mackerel generated the highest landed weight, followed by round sardinella and Atlantic mackerel. Two vessels operated in Mauritanian waters and one in the North-East Atlantic fishing grounds. Baltic landings income were slightly higher in 213 ( 56.4 million) compared to 212 ( 55.3 million). In spite of similar TAC available for Poland in Baltic Sea for 214, lower landings revenues are expected. This will be a result of a crisis in cod fisheries and a new pelagic quota allocation system implemented by Polish fisheries administration. Deteriorating condition of Baltic cod (skinny fish) is also negatively influencing performance of demersal fleet segments targeting cod. Portugal National Fleet The economic performance of the Portuguese fleet, which has been profitable over the last 4 years, deteriorated in 212, mainly due to a decrease in landings and increased operational costs. There is an overall decreasing trend in capacity of the national fleet, in terms of number of vessels, power and GT and in the number of active vessels, which is most likely to continue over the next few years. This is mainly due to the scrapping of particularly older aged vessels in the fleet. The price per kilo of landings shows an increasing trend and may be party related to the decrease in the total weight of landings. The implementation of measures at national level for restriction of catches of European pilchard resulted in a decrease in catches of about 4% in 212, from around 54 thousand tonnes to 35 thousand tonnes. This trend continued into 213, where total catches were reduced to 27 thousand tonnes. 37
39 The Portuguese fleet is highly diversified with a broad range of vessel types targeting different species predominantly in the Portuguese Exclusive Economic Zone (27.9.a for the mainland fleet, 27.1 for the Azores and CECAF for the Madeira fleet). Eighteen vessels make up the hook 24 4m segment, which mainly operates along the Africa Coast and Indian Ocean (FAO 34, 41, 51, 57). The fleet targets a variety of species but in particular large pelagic fishes, such as blue shark, bigeye tuna and swordfish. Small-scale Fleet The small-scale fleet continues to decrease in terms of number of vessels. The economic performance of the Portuguese small scale fleet has deteriorated over the last few years, a situation aggravated in 212 due to decreasing landings and an increase in operational costs. The situation is expected to improve in 213, due to the increase in landings value. Distant-water Fleet Economic performance has deteriorated in recent years. However, the long-distant-water fleet is expected to remain profitable over the next few years. Longliners faced some constraints due to increasing restrictions regarding deep-sea species and shark catches. The registered decrease in landings value was compensated with a reduction in operational costs, although net profit reduced substantially. Projections show an improvement in 213, due to adjustments made in cost structure and increased landing values. A greater improvement for 214 is expected due to the increase in available quotas for Portugal. Romania National Fleet In 212, the Romanian fishing fleet had an average age of 12 years and decreased in size between 28 and 212, by 1.6 thousand GT 68% and 2.9 thousand kw - 33%, respectively. Landings in weight increased 4% and value 28%. Employment has decreased in number from 875 in 28 to 471 in 212, due to the decreasing quota for turbot the main commercially important species The major factor causing the decrease in economic performance corresponds to a decrease in the value of landings, compounded by market price evolution during the period. It should be noted that the fishing sector and the weight and value of landings generated are relatively modest compared to other EU member states, with more than 85% of production attributed to the small-scale fishery. The major factor causing a stable situation is the reduced dimension of the fleet and concentration of high capital dependency on internal markets. Additionally, the absence of fishing infrastructures, government subsidies system and an integrated supply chain (including an organised selling system e.g. no fishery auction) negatively affects the sector. The difficult access of fishermen to finance, including loans, is reflected in the character of the sector s general and technical efficiency. Small-scale Fleet The small-scale fishery is represented by vessels less than 12m overall length using, in the same season, polyvalent gears and polyvalent mobile and passive gears, the same boats shifting from one gear to another in the same period of time. The reported data are supplied by fishermen more or less in strict correspondence with the effective fishing activity. These fishermen simultaneously use various kinds of gear during the season, and in general, do not accurately record all the associated expenses/selling value, etc. of the species captured for each type of gear or technique used. This fishery is characterised by a very high mix of techniques due to the lack of target species. The main explanation for the actual status is the dependency of the fishery on the internal market and a weak selling system, due to fishermen, in principal, acting on their own, and a lack of concentration in the sector; the existing fishermen s organizations do not participate in marketing the catch. Slovenia National Fleet The economic performance increased in recent years due to lower expenditure on fuel and labour costs and increases in income from other sources, although the performance is still poor. In 213 the Slovenian fishing fleet consisted of 171 registered vessels, with a combined gross tonnage of 599 GT, a total power of 8.5 thousand kw 38
40 and an average age of 36 years. The size of the Slovenian fishing fleet decreased between 28 and 213; the number of vessels by 5.5% and GT and kw by 4% and 2%, respectively. The major factors causing the fleet to decrease include the scrapping of some vessels in the Slovenian fleet, including two of the largest vessels. Consequently, landings weight decreased in 212. Hence, a decrease in the value of landings and thus the total income of the Slovenian fleet is expected. Due to fleet reduction and related lower fishing effort, the biological status of fish stocks may improve. In view of this, landings weight may start to increase again due to better catches. Repair and maintenance costs are expected to continue to increase in the future because the fleet is generally old and poorly equipped. Small-scale Fleet The same issues apply to the small scale fleet. Approximately 2 fishermen have lost their jobs because of vessel scrapping. In the future, an increased number of small scale vessels is expected as some will start operating in a self employed manner. Due to reduced catches, increase in prices for European pilchard (sardine) and anchovy and, consequently, higher income for vessels targeting these species can be expected. Spain National Fleet The Spanish fleet is highly diversified with a broad range of vessel types (1,544 registered vessels in 212) targeting many different species (tunas, cod, anchovies, sardines, squid, cuttlefish, octopus among others) predominantly in the Mediterranean and North Atlantic. As in previous years, in 212 the Spanish fishing fleet decreased in terms of number of vessels. This reduction has also been in size, decreasing in tonnage and power (about 3-4% less). This declining trend for the period is expected to follow in 213 motivated by the structural adjustment of the Spanish fleet, mainly the small-scale fleet. The number of fishing enterprises totalled 9,776 in 212, 3% less than the year before, with the vast majority of enterprises (94%) owning a single vessel. The value of landings decreased 2% in 212 and it is expected to decrease over the next year, reversing the increasing trend of the last years. The level of employment also decreased, decreasing the number of jobs by 5% and FTEs by 6%. This reduction in the landings income and employment was caused by the declining trend in the number of fishing vessels. Although landings income fell in 212, profitability of the Spanish fleet improved lead by a larger reduction in all operating costs, but specifically in crew and energy expenses, which represented 3% and 23% of total income respectively. In addition, the number of inactive vessels increased 59% in 212 (possibly an effect of the declining profitability of the activity in the previous years), may be another factor in improving the profitability of the sector. The amount of income generated by the Spanish fleet in 212 was 1,97.7 million, decreasing 3% between 211 and 212 caused mainly by the small-scale fleet, where income decreased by 31%. Small-scale Fleet In 212, the small-scale fleet, with 4,188 vessels, represented 4% of the whole Spanish fleet whereas it only represented 19% of the total employment. This fleet has suffered an important reduction in landings income of 31% driven by a similar reduction in the number of vessels (39%), in the last year. The small-scale fleet was not profitable in 212, although performance improved compared to former years. Large-scale Fleet In 212, the large-scale fleet increased significantly in number of vessels (62%), representing a 46% of the Spanish fleet in number of vessels and a 69% of the total employment. Despite this increase in capacity, the landings income suffered a reduction of 5% in 212. However, the fleet improved its profitability. Distant-water Fleet In 212, the long-distant and outermost region fleets, numbered 264 vessels and represented 3% of the whole Spanish fleet. This fleet was the most profitable in Spain since its landings income increased by 12% while its operating costs decreased. 39
41 Sweden The size of the Swedish fleet decreased between 28 and 213. The general trend since the beginning of 2s is a decrease in capacity, i.e. the number of vessels, which is also reflected in the reduction of total engine power and gross tonnage. This is partly due to management efforts directed at decreasing fleet size in order to bring it in balance with the resources. The major factors causing the fleet to decrease include decreased number of permits to fish European Eel, entry barriers, bad profitability, scrapping campaigns, introduction of transferable fishing rights and natural wastage due to age. However, this is not the whole truth since a part of the decrease is because many fishermen have left the trade since they cannot make a living from fishing anymore. Some fishermen operating inside the pelagic fishing rights system have sold their rights and left the sector while others just left the sector without being compensated. The total weight decreased while the value of landings increased over the period analysed. The profitability of the diminishing Swedish fleet is increasing perhaps not as fast as expected due to decreasing quotas and prices (Baltic cod). The analysis of economic performance shows that all Swedish segments with vessels over 12 meters were making positive net profits. Segments with vessels less than 12 meters in length were all making net losses. But the variation in performance is large. The large vessels over 12 meters fishing mainly for Northern prawn and those fishing for cod are making losses, although their negative results are outweighed by the profits of the pelagic vessels and the vessels fishing for Norwegian lobster since they are reported in the same segment. Towards the end of 29, Sweden introduced a tradable fishing right system for pelagic quotas. Transactions took place in the beginning of 21 and the first effects became visible in late 21 in terms of profitability for the pelagic fisheries. The effect of the new system can be better seen in the profitability of 211 and 212 once capacity had been removed. However, decreases in quotas for pelagic species (most importantly for herring and sprat) had a negative effect on the expected profitability increase resulting from the system. The pelagic vessels also partly fish demersal for cod. Fuel prices increased during 21 and 211 and remained at high levels during 212, which had an effect on all fisheries. The increase is supposed to have the greatest effect on segments fishing with active gears (e.g. trawls and seiners). In general, fuel consumption has decreased between 29 and 211 but started to increase again in 212. All segments with vessels fishing with active gears have increased their use of fuel from 211 to 212. Higher fuel consumption was generally the result of increased number of days spent at sea and better fuel efficiency. Most of the rest of the Swedish fleet, the part fishing with passive gears has decreased their fuel use or more or less used the same amount. The question, how much further fuel efficiency rationalisation that could occur without significant investments in new technologies and newer vessels has perhaps been answered. Segments fishing with passive gears have been heavily affected in recent years by increasing populations of seals. The damages caused by seals increase costs (e.g. gears repairs) and create extra working hours. There is also a crew recruitment problem as jobs on board fishing vessels is not seen as a particularly attractive way of living for younger people due to the low wages and relatively poor working conditions compared to other jobs on land; this poor recruitment is reflected in the increasing average age of Swedish fishermen. This coupled with a decreasing fleet size is expected to continue for some time. United Kingdom National Fleet The increase in the value of landings of 23% from 28 to 212 matches the 23% increase in the consumer price index for fish and seafood. The decline in landings of mackerel has been compensated for by increases in herring and the other species important to the UK fleet. The number of vessels continues to fall steadily from 6,796 in 28 to 6,46 in 213 but the falling average age suggests that there has been little if any fall in capacity, newer boats being more effective than older ones. The fall in FTEs from 1,55 in 29 there was a decommissioning scheme in 28 which distorts the impression for that year - to 9,868 in 212 suggests that the cost of labour is continuing to cause substitution of capital for labour but the magnitude of the trend is not unduly strong. While overall the fleet is profitable, with 16% of income being retained as net profit, there are considerable variations within the fleet segments and these are inconsistent within the segments or according to vessel size or according to the number of vessels within a segment offering little indication of the cause of the variability. The 4
42 value of fishing rights showed a sharp increase of 3% between 21 and 211 and a slight increase of 2% between 211 and 212 reflecting optimism about the prospects of the industry. Energy efficiency of the fleet continued to improve, by 4%, between 211 and 212, a consequence of the decreasing average age of vessels in the UK fleet. There has been a significant increase in landings of both scallops and nephrops into the UK from foreign vessels. Both weight and value of these landings have nearly doubled in 212. This influx of vessels has largely come from the North Sea fishery into the fishery West of Scotland and has led to a shortage of kilowatt days-at-sea to catch the quota. Small Scale Fleet Although value of landings for the fleet saw a slight drop from 211 to 212 the small scale fleet saw a 7% increase. This is despite a 5% decrease in the number of vessels making up the fleet. In terms of economic performance, the total amount of Gross Value Added (GVA), gross profit and net profit generated by the small scale fleet in 212 were 59 million, 17 million and 11 million respectively. All three variables saw increases of around 15% between 211 and 212. This increase in economic performances comes in spite of rising costs and largely due to a 12% increase in landings income and 65% increase in other income. In 211, 9% of income was retained as net profit. The reallocation of quota from the over 1m sector to the less than 1m sector was upheld by judicial review which will benefit the Small Scale Coastal Fleet going forward. Distant Water Fleet The UK distant water fleet consists of a few very large vessels fishing in Arctic waters and in the northern Atlantic near Greenland. Little information can be separated from the aggregate because the size of the fleet is too small to protect the commercial sensitivity of the data. A ban on bottom trawling and the introduction of capacity limits has been proposed by the European Commission for the distant waters fleet. In the short term this seems destined to reduce landings and GVA as well as directly impact employment. The longer-run effects are hard to judge. Potentially these rules could limit the growth of the fishery if new opportunities emerge. 41
43 Annex 1 - Data coverage and quality issues Annex Table 1 Data issues by MS regarding the 214 DCF call on economic data on the EU fishing fleet Main data issues 214 DCF data call BEL: no major data issues BGR: emplyment data for 212, missing energy consumption 211 and 212 CYP: seadays in 28 and 212, fishing days 212, energy consumption 211 and 212 DEU: DCF data excludes the DEU pelagic trawlers DNK: no major data issues; no 213 data provided ESP: seadays and fishing days missing ; landings weight ; Landings value ; Depreciated replacemnet value EST: DWF (1 vessel in 21, 211 and 212) only capacity data provided; SSF: FTE missing in 28 and 29; seadays, fishing days and energy consumption missing for all years FIN: no major data issues FRA: for SSF and LSF, seadays and fishing days and depreciated replacement value missing 28-29; DWF: employed and FTE missing in 28; seadays and fishing days missing in 28, 29 and 211; energy consumption, landings weight, landings value, income from landings missing in 28; not possible to estimate performance indicators for FRA DWF in 28, and net profit for all years; number of inactive vessles missing in all years GBR: no major data issues GRC: data provided only for 212; seadays, fishing days, landings weight and value, landings income missing; number of inactive vessles missing for all years HRV: data provided for ; data estimation issues IRL: SSF: depreciated replacement value missing in 29 and 21 (net profit not estimated) ITA: no major data issues LTU: no major data issues; incomplete data for several fleet segments (confidentiality) LVA: SSF and LSF - depreciated replacement value missing in 28; number of inactive vessles missing in MLT: no major missing data issues; although some questionable data quality issues NLD: no major data issues POL: DWF - energy consumption, landings value, landings income, costs missing for all years (performance indicators not estimated for DWF for all years) PRT: no major data issues ROU: LSF - all values missing in 21 (reduced number of vessels) SVN: no major data issues SWE: no major data issues 42
44 Annex Table 2 Data coverage by MS regarding the 214 DCF call on economic data on the EU fishing fleet Capacity Capital and Investment Effort Employment Expenditure Income Landings BEL BGR CYP DEU DNK ESP EST FIN FRA GBR GRC HRV IRL ITA LTU LVA MLT NLD POL PRT ROU SVN SWE 43
45 Annex 2- COMPLEMENTARY DATA TABLES AND FIGURES: EU and Member State level Annex Table 3 Trends on the main DCF variables and estimated indicators for the 15 selected EU fleets Development trend based on the % change in 212 to the average Arrows indicate change ( ) in relation to the average : ( ) increase; ( ) decrease and ( ) stable/no change ( between -1 and +1%). 211* and 212* includes DCF data available for all MS excluding Bulgaria, Croatia, Cyprus, Greece and Malta. Source: Member State data submissions under the DCF 214 Fleet Economic Development % 21 % 211 % 212 % trend 211* 212* No. Vessels (number) 45,369 44,96-1% 44,574-1% 43,747-2% 42,248-3% -4% 61,576 59,545 Vessel tonnage (thousand tonne) 1,88 1,47-4% 1,15-3% 99-3% 941-5% -7% 1,576 1,513 Vessel power (thousand kw) 4,179 4,74-2% 3,841-6% 3,98 2% 3,759-4% -5% 5,758 5,566 Total employed (number) 8,354 77,461-4% 78,72 1% 75,387-3% 74,861-1% -3% 124,388 12,984 FTE (number) 61,92 59,546-4% 61,39 3% 58,577-4% 56,761-3% -5% 98,742 94,978 Days at sea (thousand day) 3,22 3,352 5% 3,199-5% 3,213 % 3,36-6% -5% 3,218 4,684 Fishing days (thousand days) 3,7 3,179 6% 3,31-5% 3,78 2% 2,884-6% -5% 3,82 4,443 Energy consumption (million litre) 1,475 1,48 % 1,421-4% 1,33-8% 1,235-5% -11% 2,488 2,228 Energy consumed/landed tonne (litre/tonne) 8,383 8,843 5% 9,16 4% 8,342-9% 8,17-3% -5% 9,131 9,556 Landings weight (thousand tonne) 3,175 3,344 5% 3,32-1% 3,49-8% 2,791-8% -11% 3,576 4,221 Landings value (million ) 3,779 3,516-7% 3,665 4% 3,948 8% 3,89-4% 2% 5,13 6,821 Landings income (million ) 3,768 3,519-7% 3,681 5% 3,938 7% 3,863-2% 3% 7,36 6,849 Other income (million ) % % 84-27% 77-9% -11% Crew wage costs (million ) % 898 1% 96 1% 899-1% 1% 1,872 1,772 Unpaid labour (million ) % 15-3% 145-3% 136-6% -8% Energy costs (million ) % 731 2% 87 19% 895 3% 12% 1,525 1,55 Repair costs (million ) % 314-2% 344 9% 348 1% 6% Other variable costs (million ) % 448 2% 475 6% 454-4% % 1, Other non-variable costs (million ) % % 327 4% 293-1% -3% Annual depreciation (million ) % 521-2% % 532-8% -1% GVA (million ) 1,879 1,962 4% 1,989 1% 2,6 1% 1,949-3% % 3,43 3,326 GVA to Revenue (%) 48.9% 54.4% 11% 52.4% -4% 49.9% -5% 49.5% -1% -4% 47.9% 47.9% Gross profit (million ) % 941 2% 955 1% 914-4% % 1,36 1,332 Gross profit margin (%) 22.1% 25.5% 16% 24.8% -3% 23.7% -4% 23.2% -2% -3% 18.2% 19.2% Net profit (million ) % % 286-1% % 13% Net Profit margin (%) 7.% 7.2% 3% 8.4% 16% 7.1% -15% 8.4% 19% 14% 4.3% 6.6% GVA per FTE (thousand ) 3,35 32,947 9% 32,591-1% 34,249 5% 34,332 % 6% 34,739 35,23 44
46 Annex Table 4 Trends for main DCF variables and estimated indicators for selected fleets by fishing activity, Development trend based on the % change in 212 to the average Arrows indicate change ( ) in relation to the average : ( ) increase; ( ) decrease and ( ) stable/no change ( between -1 and +1%). The column 212* includes DCF data available for all MS excluding Bulgaria, Croatia, Cyprus, Greece and Malta. Total N of vessels Inactive vessels N. of active vessels 28 as % of total 29 as % of total 21 as % of total 211 as % of total 212 as % of total 45,371 44,965 44,589 43,838 42,391-3% -5% 84,816 11,26 25% 11,569 26% 11,632 26% 11,428 26% 1,783 25% -6% -6% 15,815 19% 34,111 33,396 32,957 32,41 31,68-2% -5% 69,1 SSF 24,186 71% 23,514 7% 23,372 71% 22,957 71% 22,417 71% -2% -5% 5,948 74% LSF 9,852 29% 9,85 29% 9,516 29% 9,385 29% 9,139 29% -3% -5% 17,718 26% DWF 74 % 77 % 7 % 68 % 52 % -24% -3% 335.5% Vessel tonnage % -6% 1,554 thousnad tonnes SSF 77 8% 61 6% 61 7% 61 7% 6 7% -2% -8% 128 8% LSF 82 84% 77 81% % % % 2% -2% 1,15 74% DWF 81 8% % 13 11% 15 12% 69 8% -35% -34% % Engine power 3,576 3,465 3,383 3,365 3,277-3% -5% 5,843 thousand kw SSF % % % % % -1% % 1,828 31% LSF 2,631 74% 2,515 73% 2,44 72% 2,47 72% 2,363 72% -2% -5% 3,638 62% DWF 12 3% 129 4% 115 3% 117 3% 8 2% -31% -33% 377 6% Total employed 8,357 77,461 78,73 75,385 74,859-1% -4% 151,33 SSF 37,589 47% 36,243 47% 38,13 49% 36,94 49% 35,568 48% -4% -4% 72,818 48% LSF 41,412 52% 4,48 52% 38,863 5% 37,221 49% 38,224 51% 3% -3% 72,291 48% % to 211 Development trend 212* as % of total FTE DWF 1,356 2% 1,17 2% 1,197 2% 1,225 2% 1,67 1% -13% -14% 6,193 4% 61,92 59,546 61,38 58,573 56,76-3% -6% 12,268 Days at sea thousand days SSF 24,269 39% 23,21 39% 24,685 4% 24,529 42% 22,253 39% -9% -8% 5,759 42% LSF 36,66 59% 35,543 6% 35,352 58% 33,8 56% 33,491 59% 1% -5% 62,25 52% DWF 1,27 2% 981 2% 1,1 2% 1,36 2% 1,17 2% -2% 1% 7,259 6% 3,2 3,352 3,199 3,21 3,22-6% -7% 4,951 SSF 1,939 61% 2,71 62% 1,971 62% 2,46 64% 1,887 62% -8% -6% 2,695 54% LSF 1,248 39% 1,266 38% 1,217 38% 1,153 36% 1,126 37% -2% -8% 2,174 44% DWF 12 % 15 % 11 % 11 % 1 % -11% -21% 82 2% Energy consumption 1,472 1,479 1,416 1,31 1,237-5% -13% 2,358 million litres SSF 118 8% 132 9% 125 9% 133 1% 118 9% -12% -8% 215 9% LSF 1,295 88% 1,3 88% 1,251 88% 1,129 87% 1,92 88% -3% -13% 1,78 76% DWF 58 4% 47 3% 4 3% 39 3% 28 2% -29% -43% % Landed weight 3,178 3,33 3,285 3,44 2,79-8% -13% 4,293 thousand tonnes SSF 154 5% 155 5% 152 5% 15 5% 155 6% 3% 1% 269 6% LSF 2,822 89% 2,896 87% 2,967 9% 2,715 89% 2,525 9% -7% -12% 3,387 79% DWF 22 6% 278 8% 166 5% 179 6% 11 4% -39% -51% % Landed value 3,778 3,59 3,661 3,943 3,86-3% 2% 6,875 million SSF % % % % % -9% -7% % LSF 3,9 82% 2,876 82% 3,55 83% 3,257 83% 3,219 85% -1% 5% 4,9 71% DWF 137 4% 9 3% 73 2% 124 3% 76 2% -39% -3% 1,163 17% Source: Member State data submissions under the DCF 214 Fleet Economic 45
47 Annex Table 5 Trends for main DCF variables and estimated indicators for selected fleets by fishing activity, Development trend based on the % change in 212 to the average Arrows indicate change ( ) in relation to the average : ( ) increase; ( ) decrease and ( ) stable/no change ( between -1 and +1%). The columns 211* and 212* includes DCF data available for all MS excluding Bulgaria, Croatia, Cyprus, Greece and Malta. as % of as % of as % of as % of as % of % to Development trend total as % of * 212* total total total total total 211 Revenue 3,777 3,57 3,739 3,946 3,847-2% 2% 7,144 6,925 million million SSF % % % % % -9% -8% 1,33 14% % LSF 3,8 82% 2,921 82% 3,18 83% 3,275 83% 3,245 84% -1% 5% 5,14 71% 4,982 72% DWF 113 3% 9 3% 83 2% 94 2% 8 2% -15% -16% 1,6 14% 1,52 15% Labour costs 1,22 1,41 1,44 1,44 1,32-1% -1% 2,12 1,992 SSF % % % 19 18% % -4% -9% 431 2% % LSF % 838 8% 836 8% % % % 2% 1,49 7% 1,46 73% DWF 12 1% 8 1% 9 1% 11 1% 9 1% -2% -14% 199 9% 185 9% Energy costs % 15% 1,521 1,547 million SSF 77 9% 62 1% 74 1% 95 11% 88 1% -7% 14% 141 9% 126 8% LSF % % 63 87% % % 5% 17% 1,157 76% 1,187 77% DWF 36 4% 19 3% 21 3% 22 3% 2 2% -13% -21% % % Total operating cost 2,962 2,672 2,834 3,37 3, -1% 4% 5,845 5,62 million SSF % 39 15% 47 14% % % -3% 1% % % LSF 2,44 82% 2,218 83% 2,36 83% 2,539 84% 2,526 84% % 6% 4,16 71% 4,5 71% DWF 93 3% 64 2% 67 2% 66 2% 56 2% -16% -24% % % Capital costs % -6% million SSF 78 14% 87 14% 94 15% 9 14% 84 15% -6% -4% % % LSF % % 51 82% % % -11% -7% % % DWF 11 2% 17 3% 15 2% 2 3% 17 3% -14% 9% 73 8% 68 8% GVA 1,837 1,939 1,949 1,953 1,88-4% -2.1% 3,46 3,34 million SSF 367 2% % 34 17% % % -15% -19% % % LSF 1,438 78% 1,541 79% 1,584 81% 1,58 81% 1,561 83% -1% 2% 2,422 71% 2,425 73% DWF 32 2% 34 2% 25 1% 38 2% 33 2% -14% 2% 35 1% % Gross profit % -3.9% 1,285 1,269 million SSF % % % % 14 12% -28% -34% 22 16% % LSF % 73 78% % % % -2% 2% % % DWF 2 2% 26 3% 16 2% 28 3% 24 3% -12% 8% % % Net profit % 1.4% million SSF 76 3% 82 32% 47 16% 55 2% 2 7% -63% -8% 42 16% 27 7% LSF % % % 29 77% 247 9% 18% 23% % % DWF 9 4% 9 3% 1 % 8 3% 7 3% -7% 7% 58 23% 75 21% as % of total Source: Member State data submissions under the DCF 214 Fleet Economic Note: The analysis presented in the table is based on the fleet segment level data submissions and refers to the sample covered under the DCF with complete time series data. This excludes Bulgaria, Croatia, Cyprus, Greece, Malta, France and Spain. 46
48 Annex Table 6 EU small-scale fleet capacity data by Member State, 212 Arrows indicate change ( ) in relation to 211 ( ) increase; ( ) decrease and ( ) stable/no change ( between -1 and +1%). EU SMALL-SCALE FLEET N as % of to to as % of to kw as % of total GT vessels total total 211 BGR 1, % 25, % 2, % CYP % 29, % 1,96 1.5% DEU % 22, % 2, % DNK 1,75 2.1% 42, % 4,96 3.2% ESP 4, % 18,996 6.% 11, % EST % 14,616.8% 1, % FIN 1,89 3.7% 84, % 4,33 3.4% FRA 4,29 8.3% 41, % 15, % GBR 3, % 191,52 1.5% 12, % GRC 14, % - 274,76 15.% - 28, % - HRV 1, % 89,88 4.9% 4, % IRL 1, % 33, % 3, % ITA 8, % 247, % 16, % LTU 69.1% 1,7.1% 2.2% LVA 27.4% 2,187.1% 354.3% MLT % 4, % 1, % NLD 199.4% 19, % 1, % POL % 21, % 2, % PRT 3, % 18, % 7, % ROU 179.4% 3,51.2% 286.2% SVN 67.1% 2,697.1% 168.1% SWE % 53, % 3, % EU 5,948 1,828,28 127,982 Source: Member State data submissions under the DCF 214 Fleet Economic (MARE/A3/AC(214)). Annex Table 7 EU large-scale fleet capacity data by Member State, 212 Arrows indicate change ( ) in relation to 211 ( ) increase; ( ) decrease and ( ) stable/no change ( between -1 and +1%). EU LARGE-SCALE FLEET N as % of to to as % of to kw as % of total GT vessels total total 211 BEL 82.5% 46, % 14, % BGR 8.5% 12,344.3% 2,892.3% CYP 3.2% 6,22.2% 1,56.1% DEU % 15, % 56, % DNK % 154,63 4.2% 56,21 4.9% ESP 4, % 487, % 189, % EST 4.2% 19,887.5% 1,154.9% FIN 62.3% 3,38.8% 8,56.7% FRA 1,63 9.% 397, % 19,19 9.5% GBR 1,41 8.% 57, % 175, % GRC 1,16 6.5% - 18,935 5.% - 47, % - HRV 1,13 6.2% 15, % 27, % IRL % 133, % 51, % ITA 4, % 79, % 149, % LTU 25.1% 7,58.2% 3,522.3% LVA 72.4% 19,756.5% 7,981.7% MLT 77.4% 2,444.6% 4,436.4% NLD % 244, % 126,76 11.% POL % 47,71 1.3% 14, % PRT % 172, % 64, % ROU 4.% 1,236.% 262.% SVN 22.1% 3,618.1% 452.% SWE % 98,48 2.7% 24, % EU 17,718 3,638,16 1,15,78 Source: Member State data submissions under the DCF 214 Fleet Economic (MARE/A3/AC(214)). 47

).")
49 Annex Table 8 EU distant-water fleet capacity data by Member State, 212 Arrows indicate change ( ) in relation to 211 ( ) increase; ( ) decrease and ( ) stable/no change ( between -1 and +1%). N vessels as % of total to 211 EU DISTANT-WATER FLEET kw as % of total to 211 ESP % 24, % 173, % EST 1.3% 94.2% 555.2% FRA % 55, % 32, % ITA 5 1.5% 5,28 1.4% 2,726 1.% LTU 1 3.% 4, % 38, % POL 2.6% 11,84 3.1% 15,61 5.7% PRT % 22,681 6.% 11, % EU , ,872 Source: Member State data submissions under the DCF 214 Fleet Economic (MARE/A3/AC(214)). Note: For several MS, data on the distant-water fleet may be missing due to non-submission or aggregation of data for confidentially reasons. Additionally, DCF criteria may limit data availability on certain fleet segments as each vessel can only be allocated to one fleet segment (fishing gear and vessel length and supraregion combination) based on dominance (more than 5% of fishing time). For more information GT as % of total to 211 Annex Figure 1 Trends in fleet capacity by fishing activity: Source: Member State data submissions under the DCR (211) and DCF 214 Fleet Economic (MARE/A3/AC(214)). 48
50 Annex Table 9 EU small-scale fleet employment and average wage by Member State, 212 Arrows indicate change ( ) in relation to 211: ( ) increase; ( ) decrease and ( ) stable/no change ( between -1 and +1%). Total employed BGR 4,87 6.7% 2, % CYP 1,25 1.7% % DEU % % 4,2 2,54 1,814 DNK 345.5% 252.6% 51,361 2,626 2,364 ESP 8, % 5, % 15,262 6,689 8,343 EST 1, % 362.8% 3,539 1,293 1,514 FIN 1, % 173.4% 18, FRA 3, % 2, % 41,955 44,943 38,378 GBR 5, % 2,32 4.6% 16,56 8,378 9,73 GRC 21, % - 19, % ,623 - HRV 122.2% 26.1% 18, IRL 1, % % 4,89 1,957 71,839 ITA 13, % 9, % 8,386 3,716 2,997 LTU 149.2% 49.1% 6,158 2,936 2,589 LVA 258.4% 154.3% MLT 159.2% 235.5% 95,61 1, NLD 359.5% 117.3% 2, ,54 POL 1, % % 9,399 7,129 9,16 PRT 8,26 11.% 7, % 3,628 8,1 8,256 ROU 445.6% 35.1% 16,391 2,159 1,381 SVN 68.1% 44.1% 14,17 5,917 7,383 SWE % 34.8% 26,635 1,168 1,378 Total* 72,818 44,497 5,279 8,466 8,412 * excludes Bulgaria (BGR) EU SMALL-SCALE FLEET to 211 Annex Table 1 EU large-scale fleet employment and average wage by Member State, 212 Arrows indicate change ( ) in relation to 21: ( ) increase; ( ) decrease and ( ) stable/no change ( between -1 and +1%). Total employed as % of total as % of total to 211 FTE as % of total Av. wage per employed EU LARGE-SCALE FLEET to Av. wage per FTE Av. wage per FTE to 211 to 211 Av. wage per vessel Av. wage per vessel BEL 354.5% 334.5% 73,75 78, ,377 BGR CYP 85.1% 85.1% 5,811 5,811 11,698 DEU % % 52,897 65,821 98,542 DNK 1, % 1,34 2.1% 81,647 7, ,724 ESP 21, % 19,33 3.6% 17,61 19,59 128,93 EST 188.3% 178.3% 19,312 2,397 8,9 FIN 138.2% 19.2% 36,819 46,615 54,219 FRA 5,74 7.9% 4, % 42,319 52, ,942 GBR 6, % 7, % 27,388 24, ,459 GRC 5,778 8.% - 4, % - 9,63-11, HRV 1,3 1.4% 138.2% 8,82 64,265 7,785 IRL 1, % 1, % 61,35 71,788 23,136 ITA 14, % 1, % 11,364 14,955 43,747 LTU 228.3% 163.3% 4,674 6,545 44,953 LVA 385.5% 199.3% 9,735 18,834 43,431 MLT 189.3% 131.2% 11,877 16,448 15,76 NLD 2, % 1, % 36,517 55, ,298 POL 1,53 1.5% 1,75 1.7% 1,498 1,275 41,895 PRT 7, % 7, % 13,783 14,7 131,477 ROU 26.% 4.% 1,16 8,39 11,72 SVN 39.1% 19.% 17,31 34,554 36,895 SWE % 62 1.% 27,791 34,294 41,311 Total* 72,291 62,25 22,264 25,332 97,591 * excludes Bulgaria (BGR) to 211 FTE as % of total to 211 Av. wage per employed to
. Total employed as % of total to 211 FTE EU DISTANT WATER FLEET as % of total to 211 Av. wage per employed ESP 4,713 76.1% 5,891 81.")
51 Annex Table 11 EU distant-water fleet employment and average wage by Member State, 212 Arrows indicate change ( ) in relation to 21: ( ) increase; ( ) decrease and ( ) stable/no change ( between -1 and +1%). Total employed as % of total to 211 FTE EU DISTANT WATER FLEET as % of total to 211 Av. wage per employed ESP 4, % 5, % 28,712 22,974 57,41 EST FRA % % 98, ,287 2,267,927 ITA % 25.3% 4,411 13,324 66,166 LTU % % 8,845 8, ,9 POL % % PRT % % 11,16 11,16 145,19 Total 6,193 7,259 9,635 1,213 17,931 Source: Member State data submissions under the DCF 214 Fleet Economic (MARE/A3/AC(214)). Note: For several MS, data on the distant-water fleet may be missing due to non-submission or aggregation of data for confidentially reasons. Additionally, DCF criteria may limit data availability on certain fleet segments as each vessel can only be allocated to one fleet segment (fishing gear and vessel length and supraregion combination) based on dominance (more than 5% of fishing time). For more information to 211 Av. wage per FTE to 211 Av. wage per vessel 211 Source: Member State data submissions under the DCF 214 Fleet Economic (MARE/A3/AC(214)). Annex Figure 2 Trends in fleet employment by fishing activity:
52 Annex Table 12 EU fleet effort and fuel consumption data by Member State, 212 Arrows indicate change ( ) in relation to 211: ( ) increase; ( ) decrease and ( ) stable/no change ( between -1 and +1%). Days at sea (thousand) as % of total 211 Fishing days (thousand) as % of total to 211 Energy consumed (million l) BEL 16.8 % 1 % % 2, BGR % 25 1% CYP DEU % 124 3% % DNK % 18 2% 81. 3% 78.7 ESP 1, % 1,12 23% % EST 4.2 % 4 % 3.1 % FIN % 137 3% % FRA % 452 9% % GBR 45. 8% 332 7% % GRC % HRV % 268 6% 11. % 5.68 IRL % 43 1% % 1, ITA 1, % 1,538 32% % LTU 11. % 9 % % 1, LVA 19.5 % 17 % 9.4 % MLT % 56 1% 1.6 % NLD % 43 1% % 3, POL % 64 1% 2.2 1% 31.7 PRT % 369 8% % ROU 3.4 % 3 %.2 % SVN 7.6 % 8 %.3 % SWE % 79 2% % Total 4,964 4,791 2, Source: Member State data submissions under the DCF 214 Fleet Economic as % of total to 211 Av. fuel (l) consumed per DAS to 211 Average fuel price ( /l) to 211 Annex Table 13 EU small-scale fleet effort and fuel consumption data by Member State, 212 Arrows indicate change ( ) in relation to 211 ( ) increase; ( ) decrease and ( ) stable/no change ( between -1 and +1%). Days at sea (thousand) as % of total to 211 Fishing days (thousand) as % of total EU SMALL-SCALE FLEET to 211 Energy consumed (million l) as % of total BGR % % CYP DEU % % 1.4.6% DNK % % % ESP % % % EST FIN % % 1.6.8% FRA % % % GBR % % % GRC % - - HRV % %.4.2% IRL 8.5.3% 8.1.3% % ITA 1, % 1, % % ,829.4 LTU 5.6.2% 5.6.2%.2.1% LVA 1.9.4% 9.4.4%.1.% MLT % % 1.1.5% ,46.4 NLD 2.5.1% 2.4.1%.8.4% ,89.9 POL % % 1.8.8% PRT % % % ROU 3.3.1% 3.3.1%.1.1% SVN 6.2.2% 6.2.2%.1.% 9.8 1,41.4 SWE % % % Total 2,695 2, to 211 Av. fuel consumed per DAS to 211 Av. fuel consumed per tonne landed to
53 Annex Table 14 EU large-scale fleet effort and fuel consumption by Member State, 212 Arrows indicate change ( ) in relation to 211 ( ) increase; ( ) decrease and ( ) stable/no change ( between -1 and +1%). Days at sea (thousand) as % of total to 211 Fishing days (thousand) as % of total EU LARGE-SCALE FLEET to 211 Energy consumed (million l) BEL % 9.8.5% % 2,414 1,815. BGR 7.5.3% 7.5.4% CYP DEU % % % 1, DNK % % % 1, ESP % % % EST 4.2.2% 4.1.2% 3.1.2% FIN 6..3% 5.5.3% % 2, FRA % % % GBR % % % 1, GRC % % HRV % % 1.6.6% IRL % % % 1, ITA % % % 531 1,689.3 LTU 3..1% 2..1% 2.8.2% LVA 8.6.4% 8..4% 9.4.5% 1, MLT 5.4.2% 4.3.2%.6.% NLD % % % 3, POL % % % PRT % % % ROU.1.%.1.%..% SVN 1.4.1% 1.4.1%.2.% SWE % % % 1, Total 2,174 2,46 1, Source: EU Member States 214 DCF data submissions (MARE/A3/AC(214)). as % of total to 211 Av. fuel consumed per DAS to 211 Av. fuel consumed per tonne landed to 211 Annex Table 15 EU distant-water fleet effort and fuel consumption by Member State, 212 Arrows indicate change ( ) in relation to 211 ( ) increase; ( ) decrease and ( ) stable/no change ( between -1 and +1%). Days at sea (thousand) as % of total to 211 Fishing days (thousand) as % of total EU DISTANT-WATER FLEET to 211 Energy consumed (million l) as % of total ESP % % % 4, EST FRA.1.1% -.4.1% % - 393, ITA.3.4% -.% 1..3% 3, 1,52 LTU % % % 5, POL.5.5%.4.5% PRT % % % 1, Total , to 211 Source: Member State data submissions under the DCF 214 Fleet Economic (MARE/A3/AC(214)). Av. fuel consumed per DAS 211 Av. fuel consumed per tonne landed 211 Note: For several MS, data on the distant-water fleet may be missing due to non-submission or aggregation of data for confidentially reasons. Additionally, DCF criteria may limit data availability on certain fleet segments as each vessel can only be allocated to one fleet segment (fishing gear and vessel length and supraregion combination) based on dominance (more than 5% of fishing time). For more information 52

54 Source: Member State data submissions under the DCF 214 Fleet Economic Annex Figure 3 Trends in effort and fuel consumption by days at sea by fishing activity,
55 Annex Table 16 EU fleet landings in weight (thousand tonnes) by Member State: Development trend based on the % change (% ) of landings in weight in 211 to landings in weight over Arrows indicate change ( ) in relation to the average : ( ) increase; ( ) decrease and ( ) stable/no change ( between -1 and +1%). 28 as % of as % of as % of as % of as % of Development total total total total total trend BEL 2. 1% 19. % % 2.1 1% % 11% BGR 7.5 % 7.1 % 9.3 % 7.6 % 8.1 % 2% CYP 2. % 1.4 % 1.4 % 1.2 % 1.1 % -27% DEU % % % % % -2% DNK % % % % % -33% ESP % EST % % % % % -31% FIN % % % % % 13% FRA % % % % % 14% GBR % % % % % 9% GRC HRV % % -1% IRL % % % % % 8% ITA % % % % % -13% LTU % % 17. 3% % % -61% LVA % % 74. 2% % % -24% MLT 1.3 % 1.6 % 1.8 % 1.9 % 2.2 % 33% NLD % 35. 9% % % % -11% POL % % % % % 4% PRT % % % % % -7% ROU.4 %.3 %.2 %.5 %.8 % 116% SVN.7 %.9 %.8 %.7 %.3 % -57% SWE % % % % % -31% Total 3,73 3,869 3,859 3,656 4,295 Total* 3,587 3,361 * excluidng Croatia (HRV) and Spain (ESP) Annex Table 17 EU fleet landings in value (million ) by Member State: Development trend based on the % change (% ) of landings value in 212 to the average landings value over Arrows indicate change ( ) in relation to the average : ( ) increase; ( ) decrease and ( ) stable/no change ( between -1 and +1%). as % of as % of as % of as % of as % of Development total total total total total trend BEL % 68. 2% % % % 2% BGR 3.1 % 2.8 % 2.3 % 2.7 % 4.4 % 62% CYP 13.2 % 8.8 % 1.2 % 8. % 6.7 % -33% DEU % % % % % 11% DNK % % % % % 7% ESP , % EST 15.6 % 14.4 % 12.9 % 13.8 % 14.1 % -1% FIN 23.1 % % % % % 35% FRA % % % 1,5.7 21% 1, % 14% GBR % % % % % 16% GRC HRV % % -1% IRL % % % % % 29% ITA 1, % 1,22. 27% 1, % 1,11. 22% % -18% LTU % 4.2 1% % 74. 1% 4.5 1% -28% LVA 23.2 % 17.8 % 21.2 % 21.6 % 23.4 % 12% MLT 7.8 % 8.4 % 9.6 % 11.4 % 12.7 % 36% NLD % % % % % 1% POL % % 4. 1% % % 4% PRT % % % % % 7% ROU.7 %.6 %.5 % 1.4 %.9 % 17% SVN 2.1 % 2.2 % 2. % 2.1 % 1.5 % -3% SWE % 1.4 2% % % % 14% Total 4, , , ,81.3 6,886.6 Total* 5,35. 4,914.6 * excludes Croatia (HRV) and Spain (ESP) 54
 in relation to 211 ( ) increase; ( ) decrease and ( ) stable/no")

56 Source: Member State data submissions under the DCF 214 Fleet Economic Annex Figure 4 Trend in landings weight and value of top 6 species: Source: Member State data submissions under the DCF 214 Fleet Economic Annex Table 18 EU small-scale fleet landings in weight and value by Member State: Arrows indicate change ( ) in relation to 211 ( ) increase; ( ) decrease and ( ) stable/no change ( between -1 and +1%). EU SMALL-SCALE FLEET Landings weight as % of total to 211 Landings value as % of total to 211 Av. landed price ( /kg) to 211 BGR 2..8% 1.3.2%.7 CYP.6.2% DEU 8. 3.% % 1.1 DNK % % 2.1 ESP % EST % FIN % %.8 FRA % % 2.5 GBR % % 2.6 GRC HRV 1.2.4% 3.6.4% 3.1 IRL % 5.9.7% 1.1 ITA % % 7.8 LTU.6.2%.6.1% 1. LVA % 1.4.2%.5 MLT.7.3% 4.4.5% 6.1 NLD.5.2% 3.1.4% 6.8 POL % % 1. PRT % % 3.8 ROU.7.3%.8.1% 1.2 SVN.1.%.5.1% 8.5 SWE % % 2.8 Total Source: Member State data submissions under the DCF 214 Fleet Economic (MARE/A3/AC(214)). 55
. Landings weight as % of total EU LARGE-SCALE FLEET to 211 Landings value as % of total to 211 Av. landed price ( /kg) BEL 21.9.6% 76.4 1.6% 3.5 BGR 5.7.2% 3..1%.5 CYP.5.2% 2.3.% 4.6 DEU 69.")
57 Annex Table 19 EU large-scale fleet landings in weight and value by Member State: Arrows indicate change ( ) in relation to 211 ( ) increase; ( ) decrease and ( ) stable/no change ( between -1 and +1%). Landings weight as % of total EU LARGE-SCALE FLEET to 211 Landings value as % of total to 211 Av. landed price ( /kg) BEL % % 3.5 BGR 5.7.2% 3..1%.5 CYP.5.2% 2.3.% 4.6 DEU % % 2. DNK % %.7 ESP % EST % 9.4.2%.2 FIN % %.2 FRA % % 2.1 GBR % % 1.4 GRC HRV % 38..8%.6 IRL % %.9 ITA % % 4.1 LTU % 6.5.1%.4 LVA % %.4 MLT 1.5.% 8.3.2% 5.6 NLD % % 1.1 POL % %.4 PRT % % 1.9 ROU.1.%.1.% 1.1 SVN.3.% 1..% 3.5 SWE % %.8 Total 3, , to 211 Annex Table 2 EU distant-water fleet landings in weight and value by Member State: Arrows indicate change ( ) in relation to 211 ( ) increase; ( ) decrease and ( ) stable/no change ( between -1 and +1%). EU DISTANT-WATER FLEET Landings weight as % of total to 211 Landings value as % of total to 211 Av. landed price ( /kg) ESP % EST FRA % % 1.9 ITA.9.1% 4.5.4% 4.7 LTU % %.8 POL % PRT % % 2.7 Total , to 211 Source: Member State data submissions under the DCF 214 Fleet Economic (MARE/A3/AC(214)). Note: For several MS, data on the distant-water fleet may be missing due to non-submission or aggregation of data for confidentially reasons. Additionally, DCF criteria may limit data availability on certain fleet segments as each vessel can only be allocated to one fleet segment (fishing gear and vessel length and supra-region combination) based on dominance (more than 5% of fishing time). For more information Source: Member State data submissions under the DCF 214 Fleet Economic Annex Figure 5 Trends in landings by fishing activity:
58 Data source: Member State data submissions under the DCF 214 Fleet Economic (MARE/A3/AC(214)). Annex Figure 6 Trends in fuel consumption per tonne of live weight landed (litres/tonne) and fuel consumption per landed value (litres/thousand ) by fishing activity: Table 21 Small-scale fleet revenue by Member State for 212, (million ) Arrows indicate change ( ) in relation to 211: ( ) increase; ( ) decrease and ( ) stable/no change ( between -1 and +1%). Landings income as % of total to 211 BGR.9 %.5 2% % CYP 4.4 % % DEU 8.8 1%.8 4% 9.7 1% DNK 25. 3% 2. 9% % ESP %. % % EST 4.7 1%.1 % 4.8 1% FIN % % % FRA % 1.5 7% % GBR % % % GRC HRV.4 %.1 %.5 % IRL % 1.5 7% % ITA % % LTU.6 %. %.7 % LVA 1.4 %. % 1.5 % MLT 4.4 %.1 % % NLD 3.1 %.7 3% % POL 12. 1%. % 12. 1% PRT 6.8 7% 1.9 9% % ROU.9 % % SVN.5 %.3 1%.8 % SWE % 3. 14% % Total* Total** * excludes Croatia (HRV) and Greece (GRC) EU SMALL-SCALE FLEET Other income as % of total to 211 Revenue* as % of total to 211 ** excludes Bulgaria (BGR), Cyprus (CYP), Croatia (HRV), Greece (GRC) and Malta (MLT) 57
59 Annex Table 22 Large-scale fleet revenue by Member State for 212, (million ) Arrows indicate change ( ) in relation to 211: ( ) increase; ( ) decrease and ( ) stable/no change ( between -1 and +1%). Landings income as % of total to 211 BEL % 4. 6% 8.4 2% BGR 2.7 %.1 % 2.7 % CYP 2.3 % % DEU % 1.7 3% % DNK % 6.1 9% % ESP % % EST 9.2 %. % 9.2 % FIN % 2. 3% % FRA % % % GBR % % % GRC HRV % 4.8 7% 37. 1% IRL % 3.7 5% % ITA % % LTU 6.5 %.4 1% 6.9 % LVA 21.9 % 1.4 2% 23.3 % MLT 8.3 %.4 1% % NLD % 5.2 8% % POL %.1 % % PRT % 4.6 7% % ROU.1 % -.1 % SVN 1. %.6 1% 1.5 % SWE % 2.6 4% % Total* 4, ,996 Total** 4, ,982 * excludes Croatia (HRV) and Greece (GRC) EU LARGE-SCALE FLEET Other income as % of total to 211 Revenue* as % of total to 211 ** excludes Bulgaria (BGR), Cyprus (CYP), Croatia (HRV), Greece (GRC) and Malta (MLT) Annex Table 23 Distant-water fleet revenue by Member State for 212, (million ) Arrows indicate change ( ) in relation to 211: ( ) increase; ( ) decrease and ( ) stable/no change ( between -1 and +1%). Landings income as % of total EU DISTANT-WATER FLEET to 211 Other income as % of total to 211 Revenue* ESP %.1 4% % EST FRA % % ITA 6.5 1% % LTU %.3 12% % POL PRT % % % Total 1, ,51.9 as % of total to 211 Source: Member State data submissions under the DCF 214 Fleet Economic (MARE/A3/AC(214)). 58

60 Source: Member State data submissions under the DCF 214 Fleet Economic (MARE/A3/AC(214)). Annex Figure 7 Trends in revenue and costs by fishing activity: Note: For several MS, data on the distant-water fleet may be missing due to non-submission or aggregation of data for confidentially reasons. Additionally, DCF criteria may limit data availability on certain fleet segments as each vessel can only be allocated to one fleet segment (fishing gear and vessel length and supraregion combination) based on dominance (more than 5% of fishing time). For more information 59
61 Annex Table 24 EU small-scale fleet cost structure by Member State, 212 (million ) Arrows indicate change ( ) in relation to 211: ( ) increase; ( ) decrease and ( ) stable/no change ( between -1 and +1%). Crew wages as % of total to 211 Upaid labour as % of total to 211 Energy costs as % of total to 211 Repair costs BGR.7 %. %.3 %.2 %.4 %.1 %. %.1 1% CYP - % 1.2 1% 2.1 2% 1.3 2% 3.7 3%. % 1.5 1% % DEU 1.6 1% 1.3 1% 1.1 1% 1.2 2% 1.5 1% 2.4 3% 1.5 1% -. % DNK 2.5 1% % 2.4 2% 3.8 6% 4.1 4% 3.7 5% 4.6 4% -.4-3% ESP % % % 7. 12% % 4.4 6% 4.4 4% 1.1 1% EST 1.3 1% - %.7 1%.6 1%.4 %. %.4 % -.3-2% FIN.8 % 4.5 4% 1.5 1% 1.7 3% 1. 1% 2.1 3% 1.4 1% -.3-2% FRA % - % % % % % %.7 6% GBR % 1.5 9% % % % % 7.2 6% -.7-6% GRC HRV IRL 6.4 3%.1 % 6.6 5% 3.3 6% 6.4 6% 6.6 8%.5 %.4 3% ITA % % % % % % % 3.5 3% LTU.2 %. %.2 %. %.1 %.1 %. %. % LVA.1 %. %. %. %. %.1 %. % - % MLT.4 % 1.4 1% 1.3 1%.6 1% 1.1 1%.1 %.7 1%.1 % NLD.8 %.9 1%.6 %.8 1%.4 %.5 1% 1.1 1% -.1-1% POL 5.1 2%.6 % 1.3 1%.6 1% 1.3 1% 1. 1%.3 %.4 3% PRT %.7 1% 9.8 8% 5.6 9% 2.7 2% 4.3 6% % % ROU.3 %. %.1 %.1 %.1 %. %.1 %. % SVN.5 %.1 %.1 %.1 %.1 %. %.1 %. % SWE 1. % 8.6 7% 3.2 2% 3.2 5% 1.9 2% 2.1 3% 3.4 3%.1 1% Total* Total** * excludes Croatia (HRV) and Greece (GRC) ** excludes Bulgaria (BGR), Cyprus (CYP), Croatia (HRV), Greece (GRC) and Malta (MLT) Source: Member State data submissions under the DCF 214 Fleet Economic (MARE/A3/AC(214)). EU SMALL-SCALE FLEET as % of total to 211 Other variable costs as % of total to 211 Nonvariable costs as % of total to 211 Annual depreciation as % of total to 211 Opport. cost of capital as % of total to 211 6
62 Annex Table 25 EU large-scale fleet cost structure by Member State, 212 (million ) Arrows indicate change ( ) in relation to 211: ( ) increase; ( ) decrease and ( ) stable/no change ( between -1 and +1%). Crew wages as % of total to 211 Upaid labour as % of total to 211 Energy costs as % of total to 211 BEL % 2.7 2% % 5.5 1% 1.8 2% 6.8 2% 9.3 1%.2 % BGR.7 %. % 1. %.2 % 1.2 %.1 %.2 %.1 % CYP.5 % -.9 %.5 %.9 %.1 % 2.3 % 4.4 8% DEU % 9.3 8% 3.1 3% % 9.8 2% % % -.5-1% DNK % % 54. 5% % % % % % ESP % % % % % % % % EST 3.6 %.1 % 2.4 % 1. %.8 %.4 %.9 % -.4-1% FIN 3.7 % 1.4 1% 9.5 1% 3.1 1% 1.8 % 3. 1% 2. % -.4-1% FRA % - % % % % % % 2.2 4% GBR % 1.5 1% % % % % 4.8 6% % GRC HRV IRL %.9 1% % % 2.4 4% % % % ITA % 2.3 2% % % % % % % LTU 1.1 % - 2. %.7 %.8 %.7 %.3 %.1 % LVA 3.8 % % 1.4 % 3.7 1% 6.2 2% 1.3 %.2 % MLT 1.6 %.6 1% 2.6 %.6 % 1.6 %.1 % 3.9 1%.3 1% NLD % 8.2 8% % % % % % % POL 9.6 1% 1.1 1% % 3.3 1% 3.5 1% 4.3 1% 3.3 1%.8 2% PRT %.1 % % 28. 7% % % % % ROU.3 % -.4 %. %.1 % -.1 %.1 % SVN.5 %.2 %.2 %.1 %.1 %.1 %.1 %.1 % SWE % 5.6 5% 3.5 3% % 8.1 1% 7.2 2% %.7 1% Total* 1, , Total** 1, , * excludes Croatia (HRV) and Greece (GRC) ** excludes Bulgaria (BGR), Cyprus (CYP), Croatia (HRV), Greece (GRC) and Malta (MLT) Repair costs Source: Member State data submissions under the DCF 214 Fleet Economic (MARE/A3/AC(214)). EU LARGE-SCALE FLEET as % of total to 211 Other variable costs as % of total to 211 Nonvariable costs as % of total to 211 Annual as % of depreciation total to 211 Opport. cost of capital as % of total to
63 Annex Table 26 EU distant-water fleet cost structure by Member State, 212 (million ) Arrows indicate change ( ) in relation to 211: ( ) increase; ( ) decrease and ( ) stable/no change ( between -1 and +1%). Crew wages as % of total to 211 Upaid labour as % of total to 211 Energy costs as % of total to 211 Repair costs ESP % 1.4 1% % % % % % % EST FRA % % % 4.8 2% % - - ITA.3 % -.8 %.1 %.3 %.1 % 2.3 4%.5 5% LTU 3.1 2% % 5.4 6% 1.2 4% 1. 1% 1.9 3%.7 6% POL PRT 5.1 3% % 2.2 2% 7.6 3%.7 1% % 3.3 3% Total Source: Member State data submissions under the DCF 214 Fleet Economic (MARE/A3/AC(214)). EU DISTANT-WATER FLEET as % of total to 211 Other variable costs as % of total to 211 Note: For several MS, data on the distant-water fleet may be missing due to non-submission or aggregation of data for confidentially reasons. Additionally, DCF criteria may limit data availability on certain fleet segments as each vessel can only be allocated to one fleet segment (fishing gear and vessel length and supra-region combination) based on dominance (more than 5% of fishing time). For more information Nonvariable costs as % of total to 211 Annual as % of depreciation total to 211 Opport. cost of capital as % of total to
64 Annex Table 27 Economic performance indicators as a percentage of revenue by Member State, 212 Arrows indicate change ( ) in relation to 21: ( ) increase; ( ) decrease and ( ) stable/no change ( between -1 and +1%). GVA to to Gross profit to Net profit to GVA/FTE to to RoFTA (%) Revenue (%) 211 margin (%) 211 margin (%) 211 (thousand ) BEL BGR CYP DEU DNK ESP EST FIN FRA GBR GRC HRV , IRL ITA LTU LVA MLT NLD POL PRT ROU SVN SWE EU* * excluding Bulgaria (BGR), Cyprus (CYP), Croatia (HRV), Greece (GRC), Malta (MLT) Source: Member State data submissions under the DCF 214 Fleet Economic Source: Member State data submissions under the DCF 214 Fleet Economic Annex Figure 8 EU Member States performance indicators as a percentage of revenue in

65 Annex Table 28 Capital and investment indicators by Member State, 212 Fleet replacement value as % of total to 211 In-year Investment as % of total to 211 Investment as % of revenue to 211 BEL % 1.4 2% 13.% BGR % CYP %.6 % 8.6% DEU % 21. 5% 13.9% DNK % % 19.% ESP % % 1.2% EST 16.6 % 1.6 % 11.3% FIN % % 25.7% FRA % % 5.5% GBR % % 5.% GRC % 3.2 7% HRV % 2.6 1%.9% IRL % % 26.9% ITA % % 3.1% LTU % 1.2 % 2.8% LVA 1.5 %.5 % 2.1% MLT 41. 1% 2.3 1% 17.4% NLD % % 9.7% POL % % 2.9% PRT % 3.9 1%.9% ROU 3.5 %.1 % 12.8% SVN 4.6 %.3 % 13.4% SWE % 7.2 2% 5.6% Total 5, % Total* 4, % * excluding Bulgaria, Croatia, Cyprus, Greece, Malta Annex Figure 9 In-year investments (top) and RoFTA by EU Member State in 211 and 212 Source: Member State data submissions under the DCF 214 Fleet Economic. 64
66 Source: Member State data submissions under the DCF 214 Fleet Economic (MARE/A3/AC(214)). Annex Figure 12 Trends in estimated fleet replacement value and in-year investments: Annex Table 29 EU small-scale coastal fleet economic performance indicators, 212 (million ) Arrows indicate change ( ) in relation to 21: ( ) increase; ( ) decrease and ( ) stable/no change ( between -1 and +1%). EU SMALL-SCALE FLEET Revenue as % of to Operating as % of to as % of to Gross as % of Net as % of GVA total 211 costs total 211 total 211 profit total 211 profit total 211 BGR 1.4 % 1.6 %.5 % -.2 % -.2-1% CYP 4.4 % 8.2 1% -.5 % % % DEU 9.7 1% 9.1 1% 3.4 1%.5 % -.9-4% DNK % % % -.9-1% % ESP % % % 1.9 1%.9 4% EST 4.8 1% 3.1 % 3. 1% 1.7 1% 1.6 7% FIN % % 8.1 2% 2.8 2% 1.7 8% FRA % % % % % GBR % % % % % GRC HRV IRL % % % % % ITA % % % % % LTU.7 %.5 %.4 %.2 %.1 1% LVA 1.5 %.3 % 1.3 % 1.2 1% 1.2 6% MLT 4.5 % 5. 1% 1.3 % -.5 % % NLD 3.8 % 4. 1% 1.5 % -.2 % % POL 12. 1% 9.9 1% 7.7 1% 2.1 1% 1.5 7% PRT % % 4.3 8% % % ROU.9 %.6 %.5 %.3 %.2 1% SVN.8 %.9 %.5 % -.1 % -.3-1% SWE % 2.1 3% 7.2 1% % % Total* Total** * excludes Croatia (HRV) and Greece (GRC) ** excludes Bulgaria (BGR), Cyprus (CYP), Croatia (HRV), Greece (GRC) and Malta (MLT) 65
67 Annex Table 3 EU large-scale fleet economic performance indicators, 212 (million ) Arrows indicate change ( ) in relation to 21: ( ) increase; ( ) decrease and ( ) stable/no change ( between -1 and +1%). Revenue as % of to Operating as % of to as % of to Gross as % of to Net as % of GVA total 211 costs total 211 total 211 profit total 211 profit total 211 BEL 8.4 2% % % 3.7 % % BGR 2.7 % 3.2 %.3 % -.4 % -.6 % CYP 2.3 % 2.9 % -.1 % -.6 % % DEU % % 7.4 3% % 6.9 3% DNK % % % % % ESP % % % % % EST 9.2 % 8.2 % 4.7 % 1. %.5 % FIN % % 11.4 % 6.3 1% 4.6 2% FRA % % % % % GBR % % % % % GRC % HRV 37. 1% % % % 6.2 3% IRL % % % % % ITA % % % % 9.8 4% LTU 6.9 % 5.3 % 2.7 % 1.6 % 1.2 % LVA 23.3 % 19.9 % 7.2 % 3.4 % 1.8 1% MLT 8.7 % 7.1 % 3.8 % 1.7 % % NLD % % % % % POL % % % 8.9 1% 4.7 2% PRT % % % % % ROU.1 %.1 %. %. % -. % SVN 1.5 % 1.1 % 1.1 %.5 %.3 % SWE % % % % 9.3 4% Total* 4,996 4,18 2, Total** 4,982 4,5 2, * excludes Croatia (HRV) and Greece (GRC) EU LARGE-SCALE FLEET ** excludes Bulgaria (BGR), Cyprus (CYP), Croatia (HRV), Greece (GRC) and Malta (MLT) Annex Table 31 EU distant-water fleet economic performance indicators, 212 (million ) Arrows indicate change ( ) in relation to 21: ( ) increase; ( ) decrease and ( ) stable/no change ( between -1 and +1%). EU DISTANT-WATER FLEET Revenue as % of to Operating as % of to as % of to Gross as % of to Net as % of to GVA total 211 costs total 211 total 211 profit total 211 profit total 211 ESP % % % % % EST FRA % % 71. 2% % - ITA 6.5 1% 1.6 % 5.2 1% % % LTU % % 9.9 3% % 4.2 6% POL - % PRT % 25. 3% % %.79 1% Total 1, Source: Member State data submissions under the DCF 214 Fleet Economic (MARE/A3/AC(214)). Note: For several MS, data on the distant-water fleet may be missing due to non-submission or aggregation of data for confidentially reasons. Additionally, DCF criteria may limit data availability on certain fleet segments as each vessel can only be allocated to one fleet segment (fishing gear and vessel length and supra-region combination) based on dominance (more than 5% of fishing time). For more information 66
 in relation to the average 28-211: ( ) increase; ( ) decrease and ( ) stable/no change ( between -1 and +1%).")
68 Annex Table 32 Main performance indicators for the EU fleet by main fishing activity: Development trend based on the % change (% ) of the net profit margin in 212 to the average net profit margin in Arrows indicate change ( ) in relation to the average : ( ) increase; ( ) decrease and ( ) stable/no change ( between -1 and +1%) Development trend GVA to revenue (%) 44.8% 49.2% 49.3% 46.8% 47.3% SSF % Deteriorated LSF % Stable DWF % Improved Gross profit margin (%) 14.5% 14.9% 17.% 17.5% 19.% SSF % Deteriorated LSF % Stable DWF % Improved Net profit margin (%) 3.5% 3.4% 4.2% 3.8% 6.7% SSF % Deteriorated LSF % Improved DWF % Improved Source: Member State data submissions under the DCF 214 Fleet Economic Note: For several MS, data on the DWF may be missing due to nonsubmission or aggregation of data for confidentially reasons. Additionally, DCF criteria may limit data availability on certain fleet segments as each vessel can only be allocated to one fleet segment (fishing gear and vessel length and supra-region combination) based on dominance (more than 5% of fishing time). Annex Figure 1 Trends in economic performance by fishing activity:
 in relation")
 211 value Revenue BGR -.% 9.9 9.6% 736% - 14.1 CYP 34.2 3.")
69 Source: Member State data submissions under the DCF 214 Fleet Economic (MARE/A3/AC(214)). Annex Figure 11 Trends in labour productivity and indicators of labour/capital use: Table 33 EU small-scale fleet capital and investment indicators, 212 Arrows indicate change ( ) in relation to 21: ( ) increase; ( ) decrease and ( ) stable/no change ( between -1 and +1%). EU SMALL-SCALE FLEET Fleet Investment as % of to In-year as % of to to RoFTA to replacement as % of total 211 investments total (%) 211 value Revenue BGR -.% % 736% CYP %.1.1% 1.8% DEU 6.9.8% % 23.8% DNK % % 15.3% ESP % % 1.6% 3.6 EST 6.3.7%.3.3% 5.5% 24.8 FIN % % 36.1% 8.9 FRA % % 8.6% 1.8 GBR % % 12.7% 15.2 GRC % % HRV 5.6.6%.1.1% 18.5% IRL % % 18.5% ITA % % 3.6% 23.1 LTU.5.1%.4.% 6.1% 29. LVA.2.%.1.%.7% MLT 5.1.6% % 3.% NLD % -.% POL % % 1.5% 5.2 PRT %.3.3%.5% ROU.9.1%.1.1% 9.4% 17.1 SVN 1.3.1%.1.1% 7.5% SWE % % 8.8% Total %
70 Annex Table 34 EU large-scale fleet capital and investment indicators, 212 Arrows indicate change ( ) in relation to 21: ( ) increase; ( ) decrease and ( ) stable/no change ( between -1 and +1%). EU LARGE-SCALE FLEET Fleet Investment as % of to In-year as % of to to RoFTA to replacement as % of total 211 investments total (%) 211 value Revenue BEL % % 15% BGR -.% % 51% CYP %.5.5% 21% DEU % % 13% 9.1 DNK % % 28% 11.6 ESP % % 2% 19.2 EST % % 14% 5.1 FIN % % 2% 16.4 FRA % % 6% GBR % % 4% 36.3 GRC % % HRV % % 7% 1.1 IRL % % 28% -.8 ITA % % 3% 1.7 LTU 6.3.7% 1. 1.% 15% 19.1 LVA %.5.5% 2% 17.8 MLT %.7.7% 9% - 8. NLD % % 1% -.7 POL % % 24% 7. PRT % % 1% 5.4 ROU 1.5.2%.2.% 22% SVN 1.6.2%.1.1% 9% 19.5 SWE % % 5% 8.9 Total 3, % 6.6 Annex Table 35 EU distant-water fleet capital and investment indicators, 212 Arrows indicate change ( ) in relation to 21: ( ) increase; ( ) decrease and ( ) stable/no change ( between -1 and +1%). Fleet replacement as % of total to 211 EU LARGE-SCALE FLEET In-year investments as % of total to 211 Investment as % of to 211 RoFTA (%) value Revenue ESP % %.8% 35.6 ITA %.8.7% 11.8% 8.9 LTU %.2.1%.4% 1.2 PRT %.3.3%.7% 1.8 Total % 25.1 to
71 Source: Member State data submissions under the DCF 214 Fleet Economic Annex Figure 13 Trends in labour and capital productivity and indicators of vessel labour/capital use by fishing activity: Source: Member State data submissions under the DCF 214 Fleet Economic Annex Figure 14 Projection performance results for 213 by fishing activity. 7
72 Annex Table 36 Economic performance AER forecast indicators (million ) for 213 Arrows indicate change ( ) in relation to 212: ( ) increase; ( ) decrease and ( ) stable/no change ( between -1 and +1%). Revenue as % of to total 212 Operatin g costs as % of total to Capital as % of 212 Costs total BEL % % 8.9 1% 28. 2% 3.5 1% % BGR 6.2 % 5.6 % 1. % 3.3 %.6 % -.4 % CYP 5.8 % 1.1 % % - % - % - % DEU % % % 7.7 5% % 3.1 3% DNK % ESP - 1,.6 24% % EST 15.4 % 1.5 % 1.4 % 1.3 1% 5. 1% 3.6 4% FIN % % 4.1 % % 7.4 1% 3.3 3% FRA % % GBR % % 5.5 6% % % % GRC HRV IRL % 29. 5% 39. 4% % % % ITA % % % % % % LTU % 32. 1% 3.2.4% 1..1% % % LVA % 19.5 % 1.1.1% 8.3 1% 4.7 1% 3.6 4% MLT % % % 5.1 % % % NLD % % % % % 9.4 1% POL % % 5.7 1% % % 5.5 6% PRT % % % % % % ROU 1.4.%.8.%.1.% 1.2.1%.6.1%.5.6% SVN % 1.66.%.4.% 1..1%..% % SWE % % % 83. 6% % % Total* 3,283 4, , Total** 3,259 4, , to 212 * excludes Croatia (HRV); ** excludes Bulgaria (BGR), Cyprus (CYP), Croatia (HRV) and Malta (MLT). Greece no data The analysis covers the national fleets for which there were enough data to forecast economic indicators. GVA as % of total to 212 Gross profit as % of total to 212 Net profit as % of total to 212 Annex Table 37 Economic performance AER forecast indicators (%) for 213 Arrows indicate change ( ) in relation to 212: ( ) increase; ( ) decrease and ( ) stable/no change ( between -1 and +1%). The analysis covers the national fleets for which there were enough data to forecast economic indicators. GVA to Revenue to 212 Gross profit margin to Net profit 212 margin to 212 GVA/FTE to 212 RoFTA to 212 BEL BGR CYP DEU DNK ESP EST FIN FRA GBR GRC HRV , IRL ITA LTU LVA MLT NLD POL PRT ROU SVN SWE Source: Member State data submissions under the DCF 214 Fleet Economic 71
73 214 Annual Economic Report on the EU Fishing Fleet 1. INTRODUCTION The 214 Annual Economic Report (AER) on the European Union (EU) fishing fleet provides a comprehensive overview of the latest information available on the structure and economic performance of EU Member States fishing fleets. This report covers a six year time period and includes information on the EU fleet s fishing effort, landings, revenue, costs and employment for the years 28 to 212. The economic performance of the EU fishing fleet is also reported in terms of gross value added, profits, labour and capital productivity. This publication includes: 1) An structural and economic overview of the EU fishing fleet in 212 and trend analyses for the years ; 2) A regional analysis of the EU fishing fleet by major sea basin: Baltic Sea, North Sea and Eastern Arctic, North Atlantic, Mediterranean and Black Sea, as well as fleets operating in Other Fishing Regions; 3) A detailed structural and economic overview of each EU Member State fishing fleet, including qualitative economic performance assessments for 212 and projections for TERMS OF REFERENCE FOR STECF EWG-14-4 & 14-5 Background Following the 214 DCF call for economic data on the EU fishing fleet, EWG 14-4 and 14-5 are requested to analyse and comment on the economic performance of the EU and national fishing fleets between 28 and 212; and 213 where relevant. The two main objectives for the 214 AER are to increase qualitative interpretation of all data outputs and bring the report more "up to date. Quality of data remains essential. Data quality checks and data validation tools will be applied by the JRC. Experts will receive the data tables for the national and regional analyses, already validated where possible, on the first day of the meeting. Past experience suggests that some quality issues will remain (errors that can only be identified by those with specific knowledge of the data) and therefore experts are requested to check for further errors and report on these whilst carrying out the various tasks. Time saved by the experts as a result of not having to carry out specific quality checks on MS DCF data submissions will enable an increased qualitative interpretation of the economic data analysed in the report. The 214 AER will follow a more analytical approach and contain qualitative information and analysis on the drivers and trends in fleet economic performance and other aspects of policy relevance. For this, questions on the major drivers and issues affecting fleet economic performance, such as market prices, capacity imbalance, decommissioning, discards/high-grading, poor stock recruitment/stock recovery situations, ITQs systems, certification, MPAs, etc., should be asked consistently at all levels of analysis, i.e. fleet segment level, national level, regional level, and overall EU level. Furthermore, trends will be based on longer data series: generally 5 years of DCF data including DCR data, prepared previously by the JRC, where applicable. Increased qualitative interpretation of the data outputs requires sufficient attendance of experts knowledgeable in Member State specific fleet economic performance issues, while a more up-to-date report requires that MS provide the data necessary to successfully undertake the calculations. The regional analysis will be further improved, particularly in terms of the level of disaggregation (in some instances it may be necessary to make assumptions about the allocation of costs and earnings for fleet segments operating in two or more sea basin areas). Another improvement will be bringing the report more 'up-to-date' by providing, where possible, robust estimates of 214 economic performance using the latest available data (214 agreed quota and effort restrictions). 72
74 Introduction EWG 14-4 must prepare a long summary of the AER report 214 to be included at the beginning of the report but which can also be published as a stand-alone STECF document if necessary. EWG 14-4 is requested to quality check, analyse and summarise economic, social and technical balance indicators produced by JRC for the period /13. The procedure will be as follows: JRC calculates the economic, technical and social indicators plus the number of inactive vessels. Under an adhoc contract, the SHI and SAR indicators are calculated and checked using the methodology used by the balance group. The figures produced in step 1 are provided to the first EWG 14-4 in order to check these before being submitted together with the provided step 2 to STECF for written procedure on 11 April (or shortly after). DG MARE sends the estimates, if endorsed by STECF, to Member States to be used in the fleet reports. Terms of Reference AER on the EU fishing fleet STECF is requested to provide the Annual Economic Report on EU fleets for 214 including, at least, the following sections: 1 - Introductory remarks STECF observations Extended summary Expert working group report 2 Overview of the EU fishing fleet EU fleet structure Socio-economic structure of the EU fleet, including employment and average salaries EU fleet fishing activity and output EU fleet economic performance Section on resource efficiency examining aspects such as energy efficiency and labour productivity Section on EU small-scale fleet segments distant water fleets (key socio-economic indicators) Assessment for Regional analyses Baltic Sea Mediterranean and Black sea North Atlantic North Sea and Eastern Arctic area Other fishing regions 4 - National chapters on the economic performance of each MS fleet Should include a section on the small-scale, large-scale and distant-water fleet segments 5 - Annex Concepts, terms & definitions, Methodology 73
75 214 Annual Economic Report on the EU Fishing Fleet 1.2. DATA SOURCE AND COVERAGE The data used to compile all the various analyses contained within the report were collected under the frameworks of the Data Collection Regulation (DCR); cf. Council Regulation (European Commission (EC)) No 1543/2 of 29 June 2 and the data collection framework (DCF), cf. Council regulation (European Commission (EC) No 199/28 of 25th February 28). The 214 data call requested data for the years 28 to 214. Capacity data was requested up to and including 214, while employment and economic parameters were requested up to and including 212. Most effort and all landings data were requested up to and including 213, as well as, income from landings (nonmandatory) to allow for economic performance projections to be estimated at fleet segment and national level for 213. This report includes data reported by national totals and by fleet segments (a combination of the main fishing technology used and vessel length group operating predominately in one supra-region). The data analysed covers transversal (capacity, landings and effort) and economic data (income, costs, employment, enterprises, capital and investment). For a full list of variables and reference years requested under the 214 DCF call for economic data on the EU fishing fleet see the Methodology section. In terms of the completeness of the Member States data submissions, most countries submitted the majority of parameters requested under the call. In many cases missing data relates to fleet segments with low vessel numbers for which data is hard to obtain. In terms of data quality, inevitably some abnormal estimates for various parameters were detected by JRC or the experts and in many cases rectified by the Member States. However, some quality issues remain outstanding. This year, Greece provided data but only for 212, and with substantial amount of missing data, in particular on effort and landings. Additionally, the new Member State, Croatia was only able to provide data since 211. This year s submission from Cyprus, France and Spain continue to be incomplete and some data quality issues remain for several other Member States, such as Bulgaria and Malta. Incomplete time series data due to either the non-submission of data, questionable data and/or new MS additions, make trend analysis at the EU and regional levels impossible without excluding the MS fleets that are incomplete. The MS that were unable to deliver complete and reliable data on their fishing fleets for the years were excluded from the trend analysis and include Bulgaria, Croatia, Cyprus, Estonia, France, Greece, Malta and Spain. For results on the current situation (212) of the EU fleet, Estonia, France and Spain were included. Other relevant data related issues are highlighted throughout the text. The National Chapters present all the DCF data provided by MS, highlighting some questionable data. For more information on data coverage and limitations see the Methodology section. 74
76 Introduction 1.3. ABBREVIATIONS European Member States BEL Belgium BGR Bulgaria CYP Cyprus DEU Germany DNK Denmark ESP Spain EST Estonia EU European Union FIN Finland FRA France GBR United Kingdom GRC Greece HRV Croatia IRL Ireland ITA Italy LTU Lithuania LVA Latvia MLT Malta NLD Netherlands POL Poland PRT Portugal ROU Romania SVN Slovenia SWE Sweden Fishing Technologies DCF categories DFN Drift and/or fixed netters DRB Dredgers DTS Demersal trawlers and/or demersal seiners FPO Vessels using pots and/or traps HOK Vessels using hooks MGO Vessel using other active gears MGP Vessels using polyvalent active gears only PG Vessels using passive gears only for vessels < 12m PGO Vessels using other passive gears PGP Vessels using polyvalent passive gears only PMP Vessels using active and passive gears PS Purse seiners TM Pelagic trawlers TBB Beam trawlers Fishing activity scale of fishing vessel / activity SSF Small-scale fleet LSF Large-scale fleet DWF Distant-water fleet 75
77 214 Annual Economic Report on the EU Fishing Fleet 2. LIST OF PARTICIPANTS The report has been produced by two working groups of economic experts (expert working group 14-4 and 14-5) convened under the Scientific, Technical and Economic Committee for Fisheries (STECF), which took place from the 7 to 11 of April in Ispra, Italy and from the 9 to 13 June 214 in Gothenburg, Sweden. The groups consisted of independent experts from within the EU and experts from the European Commission s Research Centre (JRC). The full list of participants at EWG 14-4 and 14-5 is presented in section 7. 76
78 214 Annual Economic Report on the EU Fishing Fleet 3. EU FLEET OVERVIEW KEY FINDINGS Situation 212 The EU fishing fleet numbered 86,283 vessels on the 1st of January 212 based on EU s fleet register (including available data on Croatia) with a combined gross tonnage (GT) of 1.7 million tonnes and engine power of 6.7 million kilowatts (kw). EU fleet capacity has decreased steadily over the years, with an average annual decrease of 2% in terms of vessel numbers and kw and 3% in terms of GT. Based on DCF data, there were 68.9 thousand vessels active in 212. Of the active vessels, 74% were small-scale, 26% large-scale and less than 1% distant-water vessels. Direct employment generated by the fleet amounted to just over 151 thousand fishers, corresponding to 12 thousand FTEs (excluding Bulgaria). Average annual wage per FTE was estimated at 18 thousand, ranging from 78 thousand for Belgian fishers to less than 7 thousand (e.g. Greek fishers). The EU fleet (excl. Greece) spent almost 5 million days at sea and consumed 2.36 billion litres of fuel (excluding Bulgaria and Cyprus). Average fuel price increased 14% in 212. The EU fleet (excl. Greece) landed 4,295 thousand tonnes of seafood in 212, amounting to almost 6.9 billion in landed value. Economic performance Revenue generated by the EU fishing fleet in 212 (excl. Bulgaria, Croatia, Cyprus, Greece and Malta) was estimated at 6.9 billion, consisting of 6.8 billion in fish sales and 92 million in non-fishing income. As in previous years, the major cost items were labour and energy, representing 35% and 28% of total operating costs, respectively. The amount of Gross Value Added (GVA) and gross profit (all excl. subsidies) generated by the EU fishing fleet (excl. Bulgaria, Croatia, Cyprus, Greece and Malta) in 212 was 3.3 billion and 1.3 billion, respectively. GVA as a proportion of revenue was estimated at 48% and gross profit margin at 19.2%. With a net profit of 458 million in 212, 6.6% of the EU fleet s revenue was retained as net profit. Fifteen out of 18 Member States (MS) generated net profits in 212 while three MS generated net losses. Trend analyses on key performance indicators for selected EU fleets Projections for 213 suggest that revenue decreased in nine out of the 15 MS assessed. GVA as a % of revenue also increased or remain stable in 9 out of 15 MS, while gross profit and net profit margins increased in about half of the MS fleets assessed. Main drivers and trends Factors that may have contributed to improved economic performance include: higher average first-sale prices; reduced operating costs; research and innovation projects (e.g. more fuel efficient techniques); recovery of some stocks under management plans and reduced capacity. Main factors that may have contributed to poor economic performance include: reduced TACs and quotas for several key stocks; low abundances and/or low quality of some species; increased fuel prices; market saturation (e.g. Baltic cod) and poor marketing channels. 77
79 EU Fleet Overview Background This chapter provides an overview of the structure and economic performance of the EU fishing fleet in 212 and highlights some key trends between 28 and 213 based on data obtained through the 214 DCF fleet economic data call. Capacity data on the EU fishing fleet held in the EU Fleet Register database were used to complement the DCF capacity data. All fishing activity (effort and landings) and socio-economic analysis are based on the data provided by MS during the 214 DCF data call. The EU fleet encompasses all fishing vessels registered in the EU coastal Member States, which, with the addition of the Croatia, numbered 23. Croatia officially joined the EU in 213 and was only in a position to provide DCF data for the years 211 to 213. On the other hand, Greece was only able to submit data on its national fleet for the year 212. The remaining 21 MS were able to submit, at least in most part, data for all DCF years (28-213). Due to these and other data related issues, a comprehensive overview of the EU fleet was not possible for the period Considering these data limitations and in order to provide the most reliable, complete and up-to-date information as possible on the EU fleet, this chapter is structured as follows: - Section 3.2 provides a snapshot of the EU fleet in 212, including all 23 MS fleets where possible. Results are presented at EU level with additional analyses by Member State and main type of fishing activity (i.e. small-scale, large scale and distant-water fleet); - Section 3.3 provides an overview of the economic performance of the EU fleet in 212. Due to several data inconsistencies, results include all MS fleets with the exception of Bulgaria, Croatia, Cyprus, Greece and Malta; - Section 3.4 relates trend analyses on the key performance indicators for selected EU fleets. These selected MS fleets include only those with a complete coverage of reliable data for the period This analysis covers 15 of the 23 MS fleets and excludes, in addition to the five MS mentioned above, Estonia, France and Spain. Given that France and Spain comprise two of the most important EU fishing fleets, this section serves to provide some insight on the development trends of the EU fleet, represented by the selected fleets, over the period Additionally, results by main type of fishing activity (small-scale, large-scale and distant-water fleet) and projections results for 213 are provided; - Section 3.5 concludes with a short description of the main drivers and trends affecting the economic performance of the EU fleet over recent years. Under the DCF, Member States provide transversal and economic data on their fleets at the national level and by fleet segment (combination of main fishing technology and vessel length group at the supra-region level). For this chapter, national level datasets were used for analyses at the EU and MS levels while fleet segment level data were used to compile results by fishing activity (i.e. by small-scale, large-scale and distant-water fleets). While in theory both national and fleet segment datasets submitted by MS should equate, this is not always the case and some discrepancies exist between the two sets of data. These discrepancies are mainly due to missing/incomplete datasets at the fleet segment level. Discrepancies may also arise due to the fact that MS cluster (aggregate fleet segments) to avoid breaching secrecy issues when fleet segments contain too few vessels. For confidentiality reasons, MS may aggregate fleet segments into clusters to provide sensitive economic data. In several cases, clustering may not be enough to guarantee confidentiality, and hence, parts of MS fleets are not covered at all. 78
 - includes all vessels under 12m using static gears.")
 - segment includes all vessels using towed gears.")
80 214 Annual Economic Report on the EU Fishing Fleet 3.1. Overview of the EU Fishing Fleet in 212 The following section provides data on the EU fleet in 212, aggregated at the EU level and by main type of fishing activity, i.e. small-scale, large-scale and distant-water fleets. The types of fishing activity are defined as: Small scale fleet (SSF) - includes all vessels under 12m using static gears. According to the DCF gear definitions these include: drift and/or fixed netters, pots and/or traps, hooks, passive gears only, other passive gears, polyvalent passive gears only, active and passive gears. Large-scale fleet (LSF) - segment includes all vessels using towed gears. According to the DCF gear definitions these include: dredgers, demersal trawlers and/or demersal seiners, other active gears, polyvalent active gears only, purse seiners, beam trawlers, pelagic trawlers and vessels over 12 metres using static gears operating in EU fishing regions. The distant-water fleet (DWF) - includes EU registered vessels over 24 metres operating in other fishing regions including EU outermost regions (excluding the Azores region). More detailed results by Member State and fishing activity for the period 28 to 212, can be found in Tables 3.1 and 3.2 at the end of this section. Fleet Capacity According to the EU fishing fleet register, which includes information on all commercial fishing vessels from 22 coastal Member States (Croatia is not yet covered), the total number of vessels in the EU fleet on 1 January 212, totalled 82,47 vessels with a combined gross tonnage (GT) of 1.69 million tonnes and total engine power of 6.36 million kilowatts (kw). When including the available DCF capacity data on the Croatian fleet, the EU fleet comprised 86,238 vessels and a combined gross tonnage of 1.73 million tonnes and total engine power of 6.69 million kilowatts in 212. The overall capacity of the EU fleet decreased between 28 and 213 by: vessels -8%, GT -15% and kw -11% (Figure 3.1). Relative to the data held in the EU fleet register, the latest DCF data covered 96% of the EU fleet in GT, 98% in kw and 97% in number. The higher coverage in 212 is due to the submission of Greek data that were previous lacking in the DCF data 1. Figure 3.1 Trends on the EU fishing fleet capacity: Data source: EU Fleet register and Member State data submissions under the DCF 214 Fleet Economic (MARE/A3/AC(214)). Left: Data held in the EU Fleet Register (not covering Croatia); Right: coverage of the DCF capacity data related to EU Fleet Register. According to the EU Fleet Register and including Croatia, Greece possessed the largest fleet in terms of vessel number, encompassing 19% of the total EU fleet in 212, followed by Italy (17%) and then Spain (13%). The Spanish fishing fleet was the largest in terms of vessel tonnage (24% of the EU total), followed by the UK (12%) and Italian (1%) fleets. 1 DCF data for Croatia, available only for the years , are excluded from the coverage for consistency, as the EU fleet register does not yet contain data on the Croatian fleet. 79
.")

, followed by the UK with more than 1,8 vessels (12%) (Figure 3.2).")
).")
81 EU Fleet Overview In terms of engine power, the Italian fleet encompassed 18% of the total EU fleet kw, followed by France (16%) and Spain (14%). Belgium, with 86 vessels, possessed the smallest fleet in number and Romania the lowest gross tonnage and engine power, only.1% of the EU total (Figure 3.2). Inactive vessels, excluding the French and Greek fleets, represented 25% of the total fleet in number, 9% of the gross tonnage and 16% of the engine power, indicating that most of the inactive vessels are small-scale in nature. In fact, 93% of the inactive vessels were less than 12 m in length while vessels between 12 and 24 m accounted for 6% and vessels over 24 m less than 2% of the inactive fleet (Figure 3.3). With over 4, vessels, Portugal possessed the largest inactive fleet (26%), followed by the UK with more than 1,8 vessels (12%) (Figure 3.2). However, in terms of gross tonnage, the Spanish fleet possessed the largest latent GT with 21% of the EU total while the Italian fleet held the most inactive engine power (21% of the inactive kw). Figure 3.2 MS fleet capacity as percentage of EU fleet in 212 Data source: EU Fleet Register and Member State data submissions under the DCF 214 Fleet Economic (MARE/A3/AC(214)). Note: Data on number of inactive vessels are not available for France and Greece Analysing the active part of the fleet by fishing activity, the small-scale fleet comprised 51 thousand vessels, 74% of the total EU fleet in number, 8% in gross tonnage (128 thousand GT) and 31% in engine power (1.8 million kw). The distant-water fleet, although comprising less than 1% of the number of vessels (335), represented 18% of the total gross tonnage (275 thousand GT) and 7% of the engine power. The large-scale fleet represented the remaining 26% of the fleet in number (17.7 thousand), 74% of the gross tonnage and 62% of the engine power (3.6 million kw) (Figure 3.3). Figure 3.3 Capacity by main fishing activity as percentage of EU fleet in 212 Data source: Member State data submissions under the DCF 214 Fleet Economic (MARE/A3/AC(214)). Employment and average wage The EU fishing fleet directly employed 151,383 fishers in 212, corresponding to 12,315 FTEs 2. Five MS fleets employed 8% of the total EU fishers, with the Spanish fleet employing 23%, followed by the Italian (19%) and 2 Excludes Bulgaria 8
, indicating more part-time fishers in the Italian fleet.")
82 214 Annual Economic Report on the EU Fishing Fleet Greek (18%) fleets. In terms of FTEs, the same five MS fleets employed 83% of the EU total, with the Greek fleet surpassing the Italian fleet (Figure 3.4), indicating more part-time fishers in the Italian fleet. According to DCF data, the average wage per FTE 3 in 212 was 18 thousand. At 78 thousand, Belgian (FTE) fishers earned the highest wages on average, followed by the Danish fishers ( 68 thousand), and Dutch fishers ( 53 thousand). On the other hand, the Cypriot fishers received the lowest average wage at 2 thousand followed by Greek fishers ( 7 thousand) in 212 (Table 3.1). Data source: Member State data submissions under the DCF 214 Fleet Economic (MARE/A3/AC(214)) Figure 3.4 Employment (total employed and FTE) by MS as a percentage of the EU fleet: 212 Note: Data for Bulgaria excluded due to questionable data quality When analysed by fishing activity, the small-scale fleet employed 72.8 thousand fishers, equating to 48% of the total number of employees and corresponding to 44.5 thousand FTEs (42% of total) in 212. The largescale fleet employed 72.3 thousand fishers, corresponding to 62 thousand FTEs (52%). On the other hand, the distant-water fleet employed 6 thousand fishers, corresponding to 7 thousand FTEs (or 6% of the total) (Figure 3.5). Higher FTE values are due to crewmembers usually having longer and/or extra shifts on-board distant-water fleets. Data source: Member State data submissions under the DCF 214 Fleet Economic (MARE/A3/AC(214)) Figure 3.5 Employment (total employed and FTE) by fishing activity as a percentage of the EU fleet: 212 Average wage per FTE in the small-scale fleet was estimated at 8.5 thousand in 212. The same indicator for fishers operating in the large-scale fleet was 25.3 thousand while for fishers in the distant-water fleet, average wage per FTE was surprising low at 1.2 thousand, possibly reflecting high levels of employment of third country nationals (Table 3.2). According to the data, crew engaged in the French distant-water fleet received by far the highest salary, earning on average 98,844. Among those engaged in the large-scale fleet, Danish fishers received on average the highest salary ( 81.6 thousand), followed by Belgian fishers ( 73.8 thousand). In addition, fishers engaged in the small-scale fleet, received high wages if they were employed in the Danish and French fleets. 3 Wage indicators are estimated including crew wages and unpaid labour; estimations excludes employment figures for Bulgaria, due to their unreliability 81
, followed by Spain (23%), France (1%), the UK (8%) and Portugal (8%).")
83 EU Fleet Overview Effort and fuel consumption The total number of days at sea reported by the EU fleet 4 reached almost 5 million days in 212. Italy reported by far the highest number of days at sea, amounting to 1.5 million days (31% of the total), followed by Spain (23%), France (1%), the UK (8%) and Portugal (8%). Together, these five MS accounted for 8% of the total registered days at sea in 212 (Figure 3.6). Energy consumed by the EU fleet 5 in 212 was reported at 2.36 billion litres. According to the data available, the Spanish fleet consumed the most, accounting for 29% of total fleet fuel consumption, followed by the Italian (14%) and French (13%) fleets (Figure 3.6). Data source: Member State data submissions under the DCF 214 Fleet Economic (MARE/A3/AC(214)) Figure 3.6 Effort and fuel consumption, expressed as a percentage of the EU fleet: 212 Figure 3.7 shows the spatial distribution of fishing effort deployed by the EU fleet in 212. While the EU fleet operates in most fishing areas worldwide, effort is concentrated in the Mediterranean Sea and coastal Atlantic waters, owing to the high number of small-scale vessels operating in these regions. Figure 3.7 Distribution of fishing effort in 212 by main FAO fishing area. Colour shows fishing days and size shows days at sea. Data source: Member State data submissions under the DCF 214 Fleet Economic (MARE/A3/AC(214)) 4 excluding Cyprus and Greece due to missing data 5 excluding Cyprus and Bulgaria 82


) From left to right: vessels <12 m; between 12-24m; 24 to over 4 meters.")
 but consumed less than a tenth of the fuel in 212.")
84 214 Annual Economic Report on the EU Fishing Fleet The map in Figure 3.8 presents fishing effort distribution in days at sea and fishing days by vessel length groups and shows that most of the fishing effort is applied in the Mediterranean Sea. This is not surprising since the Italian, Spanish and French fleets, important Mediterranean MS fleets, deploy around 64% of the total effort in sea days. Vessels less than 12 m operate predominately in the Mediterranean Sea, while larger vessels deploy a large portion of their effort also in the North and Baltic Seas, in the Celtic Sea and in the Bay of Biscay. Vessels greater than 4 m also operate in distant waters, along the African coast, W Atlantic and Arctic Sea. Figure 3.8 EU fishing fleet effort in Days at sea and Fishing days, 212. Data source: Member State data submissions under the DCF 214 Fleet Economic (MARE/A3/AC(214)) From left to right: vessels <12 m; between 12-24m; 24 to over 4 meters. Colour shows fishing days and size shows days at sea. By fishing activity, the small-scale fleet deployed more than half of the total fishing effort of the EU fleet in days at sea (54%) but consumed less than a tenth of the fuel in 212. Conversely, the distant-water fleet deployed 2% of the total effort but consumed 15% of the energy used by the fleet. The large-scale fleet consumed 76% of the fuel for 44% of the effort in sea days (Figure 3.9). Data source: Member State data submissions under the DCF 214 Fleet Economic (MARE/A3/AC(214)) Figure 3.9 Effort deployed and fuel consumption by fishing activity, expressed as a percentage of the EU fleet: 212 Landings According to DCF data, the EU fleet 6 landed 4,295 thousand tonnes of seafood in 212, corresponding to almost 6.9 billion in value (Figure 3.3). The Spanish fleet landed the most in weight, totalling 2% of the landings covered, followed by the UK (14%), French and Danish fleets (both contributing 12%, respectively). In terms of landed value, the Spanish fleet landed the most (28% of the total), followed by France (16%), the UK (14%), Italy (13%) and Portugal (7%) (Figure 3.1). 6 Excl. Greece due to missing landings data 83


85 EU Fleet Overview Data source: Member State data submissions under the DCF 214 Fleet Economic (MARE/A3/AC(214)) Figure 3.1 Landings in weight and value by MS, expressed as a percentage of the EU fleet: 212 At 61.6 thousand tonnes, herring was the most important species in terms of weight landed in 212 7, followed by Atlantic mackerel at 349 thousand tonnes and then European sprat at 324 thousand tonnes. At 346 million, landings of Atlantic mackerel generated the most landed value, followed by yellowfin tuna at 337 million, Norway lobster at 328 million and then Atlantic cod at 38 million (Figure 3.11). Figure 3.11 Top ten species landed in weight (left) and in value (right) in 212. Data source: Member State data submissions under the DCF 214 Fleet Economic (MARE/A3/AC(214)) Note: Spanish data excluded, as Spain provided data on landings weight but not on landings value The common sole achieved by far the highest average first-sale price in 212 at 1.6/kg, followed by Norway lobster at 5.9/kg, swordfish at 5.4/kg and European hake at 3.3/kg (Figure 3.12). Data source: Member State data submissions under the DCF 214 Fleet Economic (MARE/A3/AC(214)) Figure 3.12 Average price of the top species landed in terms of weight and/or value in Spanish figures have been excluded from this analysis, as Spain provided data on landings weight but not on landings value 84

) Figure 3.")
 and Portugal.")

86 214 Annual Economic Report on the EU Fishing Fleet Figure 3.13 shows the spatial distribution of landings (representing catches) by the EU fishing fleet in 212. The majority of landings, in weight and value, are taken in the North Sea and to a lesser extent in the Mediterranean Sea, while lower quantities and valued landings occur in the Black, Baltic and Celtic Seas. Figure 3.13 EU fishing fleet landing in 212 by main fishing area (ICES rectangle). Colour shows landings value and size shows weight of landings. Data source: Member State data submissions under the DCF 214 Fleet Economic (MARE/A3/AC(214)) Figure 3.14 presents landings (representing catch) in weight and value by vessel length groups and shows that in general, vessels under 12m catch lower quantities mainly in EU coastal and island regions, with one exception being the north coast of France (Brittany) and Portugal. Higher SSF landings in value are obtained in the Mediterranean Sea and along the coasts of France and Portugal (no data available for the Greek fleet) while lower landings in weight and value occur in the Baltic and North Seas. Larger vessel landings in weight are taken mainly from the Baltic and North Sea, with the North Sea being more important in terms of landed value. Figure 3.14 EU landings in weight and value, 212. From left to right: vessels <12 m; between 12-24m; 24m to over 4 meters Colour shows value of landings and size shows weight of landings. Data source: Member State data submissions under the DCF 214 Fleet Economic (MARE/A3/AC(214)) By fishing activity, the large-scale fleet contributed 79% to landings in weight and 71% to landings value. While the small-scale fleet landed 6% of the landing in weight (excluding Greece), it produced more than 12% 85
. Data source: Member State data submissions under the DCF 214 Fleet Economic (MARE/A3/AC(214)) Figure 3.")
87 EU Fleet Overview of landed value (excluding Greece), indicating that when compared to its larger counterpart, the small-scale fleet on average obtains higher first sale value, depending on species etc.(figure 3.15). Data source: Member State data submissions under the DCF 214 Fleet Economic (MARE/A3/AC(214)) Figure 3.15 Landings by fishing activity, expressed as a percentage of the EU fleet: 212 According to the data submitted, the large-scale fleet contributes the most to landings, both in weight and value, for almost all MS (Figure 3.15). For example, the UK LSF landed 93% of the seafood weight in 212, corresponding to 88% in value; for France, 7% in weight and 69% in value; for Denmark, 98% in weight and 94% in value. The only exceptions were Spain, Lithuania, Cyprus and Romania. For Spain and Lithuania, the distant water fleet landed, 51% and 71%, respectively, of the total amount of seafood in 212, which for Lithuania corresponded to 82% of its overall value. Conversely, for Cyprus and Romania 8 the largest part of landings derive from the small-scale fleet: 53% in weight and 65% in value for Cyprus, and 9% in weight and value for Romania (Figure 3.16). Figure 3.16 Landings by MS and fishing activity: 212 Data source: Member State data submissions under the DCF 214 Fleet Economic (MARE/A3/AC(214)) 8 Cypriot and Romanian large-scale fleets are very small (in 212, they comprised 3 and 4 vessels, respectively); Furthermore, these two countries do not have a distant water fleet. 86
88 214 Annual Economic Report on the EU Fishing Fleet Income and Costs The available data suggest that the amount of revenue 9 generated by the EU fishing fleet (excluding Greece, Croatia, Bulgaria, Cyprus and Malta 1 ) in 212 was billion. This amount consisted of billion in fish sales and 92 million in non-fishing income. With the exclusion of the same five countries, costs incurred by the EU fishing fleet in 212 amounted to 6.5 billion 11, 13.5% of which consisted of capital costs ( 84 million in annual depreciation and 7 million in opportunity costs of capital) and 86.5% of operating costs 12. This mainly consisted of labour costs (35.6% of total operating costs, 1.8 billion in crew wages and 223 million in unpaid labour) and fuel costs ( 1.6 billion, 27.6% of total operating costs). Other costs linked to production amounted to 957 million; while other nonvariable costs and repair costs amounted to 551 million and 556 million, respectively. Total costs amounted to 93.4% of revenue generated by the fleet in 212. The top four MS fleets in terms of revenue (Spain, France, the UK and Italy) accounted for over 7% of the revenue generated, as well as, the labour and energy costs incurred by the fleet in 212 (Figure 3.17). Data source: Member State data submissions under the DCF 214 Fleet Economic (MARE/A3/AC(214)) Figure 3.17 Revenue and main cost items by MS, expressed as a percentage of the total: 212 Analysed by fishing activity, the large-scale fleet generated 72% of the revenue, accounting for 73% of the labour costs and 77% of the energy costs. Conversely, the small-scale fleet generated 13% of the revenue and accounted for 18% of the labour costs and 8% of the energy costs. The distant-water fleet generated 15% of the revenue and contributed 9% to labour costs (Figure 3.18). Data source: Member State data submissions under the DCF 214 Fleet Economic (MARE/A3/AC(214)) Figure 3.18 Revenue and main cost items by fishing activity, expressed as a percentage of the total: Direct income subsidies and income from leasing out fishing rights excluded from the economic analyses. 1 Data for Greece not reported; data for Bulgaria, Croatia, Cyprus and Malta considered unreliable. 11 Fishing rights costs excluded for methodological reasons. 12 Total operating costs include: crew wage costs, unpaid labour, energy costs, other variable costs, repair costs, other non-variable costs 87
89 EU Fleet Overview Capital value and investments In 212, the fleet had an estimated (depreciated) replacement value of 4.8 billion and in-year investments amounted to 419 million, 6% increase from the 396 million invested in 211, showing some signs of optimism in the future of the sector. The French fleet was estimated at having a (depreciated) replacement value of 863 million in 212, followed by the Italian fleet ( 78 million) and the UK fleet ( 54 million). The Spanish and Danish fleets were both valued at around 514 million (Figure 3.19). In terms of investment, the Irish fleet invested 82 million in 212, followed by the Danish fleet ( 73 million) and then the French fleet ( 59 million) (Figure 3.2). Data source: Member State data submissions under the DCF 214 Fleet Economic (MARE/A3/AC(214)) Figure 3.19 Fleet replacement value and Investment, expressed as a percentage of the total: 212 Figure 3.2 In-year investments by EU Member in 211 and 212 Source: Member State data submissions under the DCF 214 Fleet Economic (MARE/A3/AC(214)). 88
 in 212 was 3.31 billion, 1.33 billion and 458 million, respectively.")
90 214 Annual Economic Report on the EU Fishing Fleet 3.2. Economic Performance indicators 212 The amount of Gross Value Added (GVA), Gross profit and net profit (all excluding subsidies) generated by the EU fishing fleet (excluding Greece, Bulgaria, Croatia, Cyprus and Malta 13 ) in 212 was 3.31 billion, 1.33 billion and 458 million, respectively. In relative terms, GVA as a proportion of revenue was estimated at 48%, while 19% of revenue was retained as gross profit and after deducting for capital costs, 6.6% of revenue was retained as net profit in 212. Analysis of economic performance in 212 by Member State revealed a mixed picture. The data suggests that 15 out of 18 Member States generated net profits while three Member States (Belgium, The Netherlands and Slovenia) generated net losses in 212 (Figure 3.21). Results indicate that Spanish fleet generated the highest revenue and GVA, followed by the French, UK and Italian fleets, although the Italian fleet generated a higher GVA than the UK fleet (Figure 3.21). Figure 3.21 Economic performance indicators by MS: 212 Source: Member State data submissions under the DCF 214 Fleet Economic (MARE/A3/AC(214)). In relative terms, the Slovenian fleet generated the highest level of GVA relative to revenue (69%), followed by the Danish fleet (63%) and the Romanian fleet (62%). The Danish fleet generated the highest gross profit margin (36%), followed by the Irish fleet (29%) and the Romanian fleet (28%). The UK fleet generated the highest net profit margin with 16% of revenue retained, followed by the Finnish (15%), Estonian (15%) and Danish (13%) fleets (Figure 3.22). Figure 3.22 Economic performance indicators as a percentage of revenue by MS: 212 Source: Member State data submissions under the DCF 214 Fleet Economic (MARE/A3/AC(214)). 13 Data for Greece not reported; data for Bulgaria, Croatia, Cyprus and Malta considered unreliable. 89
91 EU Fleet Overview Economic performance data 14 broken down by main fishing activity suggest that the EU large-scale fleet generated 73% of the total GVA produced by the fleet in 212, 75% of the gross profit and 72% of net profits. The small-scale fleet contributed 16% to GVA, 12% to gross profit in 212 and 7% to the net profit. In relative terms, the small-scale fleet generated the highest GVA as a percentage of revenue (55%), while the large-scale fleet generated the highest gross profit margin (22%). Labour productivity (GVA/FTE) in the EU fleet was estimated at 35 thousand per FTE in 212, with the Danish fishers being by far the most productive, generating on average 156 thousand per FTE, followed by the Belgian ( 89 thousand) and Dutch ( 74 thousand) fishers. In terms of capital productivity, i.e. profits in relation to capital invested, the EU fleet generated a 9.5% return on fixed tangible assets (RoFTA) in 212, a significant improvement on 211 results (5.8%). The Latvian fleet obtained the highest rate of return in 212, followed by the UK and Spanish fleets (Figure 3.23). Figure 3.23 RoFTA by EU Member State in 211 and 212 Source: Member State data submissions under the DCF 214 Fleet Economic (MARE/A3/AC(214)). 14 always excluding Greece, Bulgaria, Croatia, Cyprus and Malta 9

92 214 Annual Economic Report on the EU Fishing Fleet 3.3. Trends of performance for selected EU fishing fleets: Data coverage for trend analyses The following trend analysis covers 15 selected MS fleets for the years and serves mainly to assess the main development trends of the EU fleet over this period. The selection of fleets was based on data availability and reliability for the years 28 to 212. Due to insufficient and/or unreliable data over the time series, MS excluded from the analysis were Bulgaria, Cyprus, Croatia, Estonia, France, Greece, Malta and Spain. According to the DCF submissions, data coverage of the selected 15 MS fleets over the period ranged from 51% to 67% in terms of total number of vessels, 57% to 61% in GT and 58% to 65% in kw. The lower coverage in 211 and 212 reflects the availability of DCF data on two additional MS fleets not previously covered by the DCF: Croatia in 211 and 212 and Greece in 212 (Figure 3.24). Data source: Member State data submissions under the DCF 214 Fleet Economic (MARE/A3/AC(214)) Figure 3.24 Coverage of the selected EU fishing fleets according to the DCF data. Fleet Structure According to the data on the selected fleets, the number of vessels decreased steadily between 28 and 212 (-3% p.a. on average). While the number of SSF and LSF vessels decreased on average 3% p.a., the decrease in DWF vessels was more pronounced (-13% p.a.). Additionally, the declining trend was more marked between 211 and 212, with SSF and LSF vessels decreasing 8% and DWF vessels decreasing 33% (Figure 3.25). A similar trend was observed in terms of gross tonnage (GT) and engine power (kw), both decreasing 4% p.a. on average. For the SSF, the decrease was slightly lower at around 3% p.a. while for the LSF and DWF, the decrease average 4% and 5%, respectively. In terms of engine power, between 28 and 212, SSF kw decreased on average 1% p.a., LSF kw 4% p.a. and DWF kw 1% p.a. (Figure 3.25). Inactive vessels in the selected fleets (also excluding the Latvian fleet due to missing data for several years), represented on average 26% of the total number of vessels over the period , 9% of the gross tonnage and 14% of the engine power (Figure 3.25). The number of inactive vessels has remained quite stable over the period, peaking in 29 and 21 due mainly to the increase of vessels under 12 m. Conversely, the latent GT has decreased significantly, declining almost 4% between 28 and 212. The decrease was more pronounced for the group of vessels with a length of over 4m, with inactive GT declining 6% over the same period (Figure 3.25). 91

.")

, 58% (LSF) and 2% (DWF).")
.")
93 EU Fleet Overview Data source: Member State data submissions under the DCF 214 Fleet Economic (MARE/A3/AC(214)). Figure 3.25 Trends in EU fleet capacity by main fishing activity and vessel length groups: Note: figures for inactive vessels (number, GT and kw) exclude also Latvia, for which data were not available for all years. Employment and Average crew wage Employment decreased steadily between 28 and 212 (-2% p.a. on average for number of employees and FTEs). Accompanying this decrease was an increase in average wage per FTE and per employee by about 2% p.a. on average (Figure 3.26). The contribution to fleet employment by the three types of fishing activity has remained rather stable over the period analysed: SSF contributing 48% on average over the period to the total employed, the LSF 51% and the DWF 2%. The corresponding shares in FTEs were 4% (SSF), 58% (LSF) and 2% (DWF). The differences between the shares in terms of employees and FTEs indicate that the SSF tends to have more part-time jobs compared to the LSF (Figure 3.27). In absolute terms, the LSF lost the highest number of FTEs over the period (3,118 FTEs between 28 and 212, against 2,17 FTEs and 11 FTEs for the SSF and the DWF, respectively). In relative terms, the same order is observed but lower in magnitudes (-9% for LSF, -8% for SSF, -1% for DWF). 92
) Note: Latvia excluded from the")

94 214 Annual Economic Report on the EU Fishing Fleet Figure 3.26 Trends in fleet employment and average wage indicators: Data source: Member State data submissions under the DCF 214 Fleet Economic (MARE/A3/AC(214)) Note: Latvia excluded from the estimation of the indicator average wage per vessel, due to incomplete data on active fleet Data source: Member State data submissions under the DCF 214 Fleet Economic (MARE/A3/AC(214)) Figure 3.27 Trends in fleet employment and average wage indicators by fishing activity: Fishing Effort Data on the number of days at sea for the selected fleets reveal a declining trend although with some variation (-1% p.a. on average over the period; -6% between 211 and 212). Energy consumption has decreased continuously since 29 (-4% on average) while average energy consumption per landed tonne also decreased but less marked (-2% p.a. in average). Despite lower energy consumption, energy costs have increased sharply since 29 (Figure 3.28), reflecting increasingly higher average fuel prices. 93
) Analysed by fishing activity, the decrease in")
95 EU Fleet Overview Figure 3.28 Trends in fishing effort and fuel consumption: Data source: Member State data submissions under the DCF 214 Fleet Economic (MARE/A3/AC(214)) Analysed by fishing activity, the decrease in energy consumption per day at sea between 28 and 29 appears to be largely attributed to the DWF, as average energy consumption in the SSF and LSF has followed a steady, slightly decreasing trend over the period (Figure 3.29). Data source: Member State data submissions under the DCF 214 Fleet Economic (MARE/A3/AC(214)) Figure 3.29 Trends in fishing effort and fuel consumption by fishing activity: Landings Landings in weight and value for the selected fleets have continued to decline since 29. However, while a 8% increase in value accompanied the decrease in weight in 211, the decline in weight in 212 (-8%) also corresponded to a decrease in landed value (-4%) (Figure 3.3). Analysed by day at sea, landed weight has declined over the last few years while landed value per sea day has increased steadily since 29, levelling off somewhat between 211 and 212 (Figure 3.3). Figure 3.3 Trends in fleet landings in weight and value: Data source: Member State data submissions under the DCF 214 Fleet Economic (MARE/A3/AC(214)). 94
.")
96 214 Annual Economic Report on the EU Fishing Fleet Data on landings by species for the selected fleets reveal that Atlantic herring has remained the most landed species in terms of weight, surpassed only by sprat in 29. However, while landings of sprat declined steadily since 29, reaching its lowest point in 212, Atlantic herring landing peaked in 212 (Figure 3.31). In terms of landed value, Atlantic mackerel and Norway lobster remained the two top species throughout the period, alternating places between 28 and 21, after which Atlantic mackerel has remained in first place, with a record high in 211 (Figure 3.31). Data source: Member State data submissions under the DCF 214 Fleet Economic (MARE/A3/AC(214)). Figure 3.31 Trends in landings by top species in terms of weight (left) and value (right): Figure 3.32 contains the average real price of the top 6 species landed by the selected EU fleets in terms of weight (left) and value (right) over the period While from 21 to 211, the average first-sale price for all species (except for Atlantic mackerel) increased, in 212 the average price fell for most of the top species in terms of value (e.g. -15% for Atlantic mackerel, -8% for common sole and -5% for European hake). For several species, the increase in the average unit price appears linked to reductions in landed weight. This is observed for European sprat (-15% in weight, +24% in unit price) and European pilchard (-38% in weight, +26% in unit price). Conversely, and as expected, for other species (i.e. common sole and European hake), a decrease in unit price is coupled with an increase in landed weight (+2% in weight and -8% in the unit price for sole and +8% in weight and -5% in price for hake). However, this rule does not appear to apply for the other top species. For example, the increase in weight landed for Atlantic herring (+27%), Atlantic cod (+11%) and horse mackerel (+9%) occurred together with higher average unit prices in 212 (+15%, +4% and +5%, respectively). On the contrary, for Norway lobster and Atlantic mackerel the decrease in value landed (-4% and -19%, respectively) in 212 was coupled by a decrease in the average unit price (-1% and -15%, respectively). Figure 3.32 Trends in average first sales price for key species: Left: top six species in terms of weight; Right: top six species in terms of landed value. Data source: Member State data submissions under the DCF 214 Fleet Economic (MARE/A3/AC(214)). 95

 and value (right) by main fishing operation: 28-212 Data: Data for")


 Figure 3.")
97 EU Fleet Overview As shown in the Figure 3.33, landings in weight and value decreased for all fishing activity types when compared to 211. Data source: Member State data submissions under the DCF 214 Fleet Economic (MARE/A3/AC(214)). Figure 3.33 Trends in landings weight (left) and value (right) by main fishing operation: Data: Data for Spain, Croatia, Greece, Romania, France, Poland and Estonia excluded from the analysis for the sake of comparability across years Income and Costs After increasing in 21 and 211, revenue generated by the fleet decreased in 212. While revenue decreased so did costs and by more making the fleet again profitable. For the selected fleets operating costs to revenue and total costs to revenue have remained relatively stable, averaging 76% and 93% of revenue over the period (Figure 3.34). Jan-4 Jan-5 Jan-6 Jan-7 Jan-8 Jan-9 Jan-1 Jan-11 Jan-12 Jan-13 Jan-14 Data source: Member State data submissions under the DCF 214 Fleet Economic (MARE/A3/AC(214)); DG MARE (for the EU gasoil and Brent trend) Figure 3.34 Trends in EU fleet revenue and costs: Top left: revenue; top right: breakdown of costs items as % of total costs; bottom left: revenue, operating costs and total costs; bottom right: average energy prices 96
 provides EU Gasoil and Brent prices for 28-214 and shows that average prices rose sharply in 28, reaching a peak in July before declining rapidly in the following months.")

 and the fleet segment was profitable over the period.")
98 214 Annual Economic Report on the EU Fishing Fleet Figure 3.34 (bottom right) provides EU Gasoil and Brent prices for and shows that average prices rose sharply in 28, reaching a peak in July before declining rapidly in the following months. While fuel prices remained relatively low during 29 and early 21, they increased steadily throughout 21 and 211, peaking in early 212. These fluctuations in fuel prices have a significant impact on the performance of the fleet. The data suggest that as fuel prices eased in 29, energy costs of the EU fleet fell significantly, both in absolute terms and in relation to revenue. Compared to 29, energy costs increased 47% in 212. When analysing the selected fleets by fishing activity, revenue generated by the SSF decreased just over 1% p.a. on average and although costs increased, they did so to a lesser extent (.4% p.a.) and the fleet segment was profitable over the period. Total costs to revenue ranged from 85% in 28 to 91% in 212. The percentage variation between 212 and the average over the period shows that revenue decreased almost 5% while operating costs increased by less than 2% (Figure 3.35). For the LSF, revenue increased on average 1.5% p.a. while total costs increase by.6%. Total costs to revenue decreased over the period, from 95% in 28 to 92% in 212. The percentage change between 212 and the average over the period , shows that revenue increased 5.3% while operating costs increased 5% but total costs only 2.9%. For the DWF, revenue decreased on average 9% p.a. but total costs decreased even more and total costs to revenue averaged 92% over the period (Figure 3.35). Figure 3.35 Trends costs and revenue by fishing activity: ; Data source: Member State data submissions under the DCF 214 Fleet Economic (MARE/A3/AC(214)). Economic performance Indicators Figure 2.36 shows GVA, gross profit and net profit in absolute terms and as a proportion of revenue for the selected fleets. The economic performance indicators have remained relatively stable over the period , with GVA to revenue peaking in 29 at 54%. Gross profit margin also peaked in 29, mainly reflecting lower fuel prices as revenue declined. Net profit margin peaked in 212, with 8.4% of revenue generated by the select fleet was retained as profit. Figure 3.36 Trends in fleet economic performance indicators: Data source: Member State data submissions under the DCF 214 Fleet Economic (MARE/A3/AC(214)). 97
 suggests that GVA decreased 19%, gross profit 34% and net profit 8%.")
.")
99 EU Fleet Overview Economic performance analysis by fishing activity reveals that the performance of the EU small-scale has generally deteriorated over the period. The development trend (percentage change from 212 to average over the years ) suggests that GVA decreased 19%, gross profit 34% and net profit 8%. Conversely, the data on the selected fleets suggests that the economic performance of the EU large-scale and distant-water fleets have generally improved, although the DWF suffered a significant decline in 21, due to higher than average capital costs and possibly problems related to the renewal of fisheries agreements with non-eu countries (Morocco). The development trend for the LSF suggests that GVA and gross profit increased 2% and net profit 23%. The GVA generated by the LSF on average increased 2% p.a., gross profit 4% p.a. and net profit 16.5% p.a. Development trend for the DWF suggests that GVA increased 2% while gross profit and net profit increased 8% and 7%, respectively (Figure 3.37). Data source: Member State data submissions under the DCF 214 Fleet Economic (MARE/A3/AC(214)). Figure 3.37 Trends in fleet economic performance indicators by fishing activity: A longer time series analysis, including data on 11 Member States (due to availability over the time series), suggests that the economic performance of the EU fleet covered improved since 22, with deteriorations coinciding with global fuel crises that peaked in 23 and 28 (Figure 3.38). These performance indicators 98
). Figure 3.")
100 214 Annual Economic Report on the EU Fishing Fleet were estimated including data on the following MS fleets: Belgium, Denmark, Finland, France, Germany, Italy, Latvia, The Netherlands, Spain, Sweden and the UK. Data source: Member State data submissions under the DCF 214 Fleet Economic (MARE/A3/AC(214)). Figure 3.38 Trends in selected EU Member States economic performance indicators: 22 to 212 Labour and Capital Productivity Labour productivity, defined as gross value added per FTE (GVA/FTE), measures the amount of output produced by the amount of labour (input) and gives an indication of the economic growth in the sector. Labour productivity in the fishing fleet increased over the period analysed, stabilising between 211 and 212 (Figure 3.39). The ratio between the number of jobs and vessel gross tonnage provides an indication of the labour and capital use aboard vessels: the higher the ratio, the more labour intensive the vessel is and the lower the ratio the more capital intensive or industrialised. Over the period, the number of jobs per vessel has remained quite stable while the number of jobs per GT increased between 28 and 212. Figure 3.39 Trends in labour productivity (GVA per FTE) and capital use: Data source: Member State data submissions under the DCF 214 Fleet Economic (MARE/A3/AC(214)) Figure 3.4 shows that labour productivity (GVA/FTE) is low in the SSF and has decreased steadily over the period while LSF fishers are more efficient, generating on average more output per FTE. Data on the DWF shows significant variations. In addition, as expected, the SSF is more labour intensive, with a high number of jobs per GT. On the contrary, the large-scale and the distant-water fleets are more capitalised (low number of jobs to GT ratio), with low jobs to GT ratio values. 99
101 EU Fleet Overview Data source: Member State data submissions under the DCF 214 Fleet Economic (MARE/A3/AC(214)) Figure 3.4 Trends in labour productivity (GVA per FTE) and capital use by fishing activity: Note: employment data for Bulgaria excluded due to questionable reliability Fuel use intensity Fuel use intensity of the EU fleet was analysed as litres of fuel consumed per tonne of live weight landed and litres consumed per thousand landed. Fuel use intensity varies largely on the type of fishing operation, fishing gear, fish targeted and CPUE (catch per unit of effort). Based on the data submitted by MS, the results indicate that average fuel use intensity per tonne landed decreased between 28 and 21, increasing slightly in 211 and 212. On the other hand, fuel use intensity per thousand of fish landed, albeit an increase between 28 and 29, has since decreased (Figure 3.41). Data source: Member State data submissions under the DCF 214 Fleet Economic (MARE/A3/AC(214)). Figure 3.41 Trends in average fuel consumption per tonne landed (litres/tonne) and per landed value (litres/thousand ): By fishing activity, small-scale vessels are more fuel intensive, consuming more fuel per landed weight but when analysed by landed value the SSF is less fuel intensive than its larger counterparts (Figure 3.42). On the 1
102 214 Annual Economic Report on the EU Fishing Fleet other hand, results suggest that the distant-water fleet is less fuel intensive, consuming less fuel per landed tonne. Yet, significant variations occur from year to year and in 212, it surpassed the large-scale fleet for fuel consumed per landed tonne. Fuel consumption per landed tonne by the large-scale fleet remained quite stable over the period while the amount of fuel consumed per value landed decreased steadily since 29. Data source: Member State data submissions under the DCF 214 Fleet Economic (MARE/A3/AC(214)). Figure 3.42 Trends in fuel consumption per tonne of live weight landed (litres/tonne) and fuel consumption per landed value (litres/thousand ) by fishing activity: Assessment for 212 and 213 The 214 call for economic data on the EU fishing fleet requested transversal data (effort, landings and capacity) from MS for 213, as well as income from landings, which were used to forecast fleet economic performance indicators for 213. Fifteen MS submitted reliable data to carry out the forecasts. Projection results for 213 suggest that fleet revenue and GVA increased or remained stable in six out of the 15 MS considered while gross profit and net profits in seven out of the 15 MS (Figure 3.43). Economic performance estimates for 213 suggest that although fleet revenue decreased in most Member States, GVA as a proportion of revenue increased or remained stable in nine out of 15 MS while gross profit increased or remained stable in eight MS and net profit margins increased or remained stable in seven out of the 15 MS (Figure 3.43). Therefore, improved economic performance in 213 is expected for roughly half of the national fleets. Although preliminary economic performance projections for a number of key fleets in 213 suggest mixed performance, it was not possible to project an overall economic position in 213 due to insufficient data on a number of Member States fleets. Figure Projection performance results for 213 by MS Data source: Member State data submissions under the DCF 214 Fleet Economic (MARE/A3/AC(214)). 11
103 EU Fleet Overview Projection results by fishing activity suggest that the performance of the SSF deteriorated further in 213 while the net profit of the LSF remained stable (Figure 3.44). Due to limited data, results for the DWF should be considered with care. Figure Projection performance results for 213 by fishing activity. Data source: Member State data submissions under the DCF 214 Fleet Economic (MARE/A3/AC(214)). 12
104 214 Annual Economic Report on the EU Fishing Fleet 3.4. Main drivers and trends affecting the economic performance of the EU fleet Overall, in 212 there was a decrease in the total weight and value of seafood landed by the EU fleet. Both revenue and costs decreased in 212 compared to 211. Costs, and in particular labour and capital costs (mainly annual depreciation costs), decreased more than revenue and the fleet was again profitable in 212. The economic performance of the EU fleet also showed improvements to 211, with 6.6% of income retained as net profit, up from 4.4% in 211. However, as the EU fleet is very diverse, operating in many different fisheries using a wide variety of fishing techniques, this trend did not apply to all fleet segments. While overall the EU fleet was profitable in 212, five national fleets made net losses. In general, the performance of the large-scale and distant-water fleets improved from 28 to 212, while the performance of small-scale fleets tended to deteriorate. Economic performance projections for 213 suggest decreased revenue for nine out of 15 Member State fleets assessed. However, GVA as a proportion of revenue is expected to have increased or remained stable in 9 out of the 15 MS fleets, and gross profit and net profit margins are expected to have increased in about half of the fleets assessed. Factors that may have contributed to improved economic performance include, but are not limited to the following (in no specific order): Higher average first sale prices for many commercially important species, e.g. European pilchard and anchovy Recovery of some stocks, such as the Baltic herring and North Sea plaice, leading to increased TAC and quotas. Research and innovation projects (more selective fishing gears, bio-marine ingredients facility) funded by the European Fishing Fund and national support. Capacity reduction (decommissioning with or without public support) Favourable market conditions (internal and export) for several species Implementation of certification schemes and the growing demand for certified products More fuel efficient fishing techniques and fishing behaviour Factors that may have contributed to poor economic performance include, but are not limited to the following (in no specific order): Increasing fuel prices and other operating costs The effects of the global economic crisis that continues to affect internal and international markets for some species and limits access to credit Reduced TACs and quotas for several key stocks, such as European sprat and Atlantic herring Market saturation (e.g. Baltic cod) and poor marketing to place products on new markets Low abundance and/or low quality of some species and severe weather conditions and for a few number of fleets (e.g. Baltic and Celtic seas) damage caused by marine mammals (e.g. seals) Shortage of local crews as young people in fishing communities are less and less attracted to fishing as a career choice Increase in areas that prohibit or limit specific fishing access/activity due to established restrictions for energy production or temporary closures of areas for stock recovery and nature conservation. 13
105 EU Fleet Overview 3.5. Appendix Tables 14
106 214 Annual Economic Report on the EU Fishing Fleet Appendix Table 3.1 Main variables and indicators by Member State, 212 No. Vessels (number) Vessel tonnage (thousand tonne) Vessel power (thousand kw) Total employed (number) FTE (number) Days at sea (thousand day) Energy consumption (million litre) Landings weight (thousand tonne) Landings value Landings income (million ) Other income (million ) Crew wage costs (million ) Unpaid labour (million ) Energy costs (million ) Repair costs (million ) Other variable costs (million ) Other non-variable costs (million ) Annual depreciation (million ) GVA (million ) GVA to Revenue (%) Gross profit (million ) Gross profit margin (%) Net profit (million ) Net Profit margin (%) GVA per FTE (thousand ) BEL BGR 1, , , CYP 1, , DEU 1, ,752. 1, DNK 2, , , ESP 1, , ,31.9 1, , EST , FIN 3, , FRA 5, ,678. 7, ,68.1 1, GBR 6, ,445. 9, GRC 16, , , HRV 4, , ,632.3 IRL 2, , , ITA 14, , , , , LTU LVA MLT 1, NLD ,88.9 1, POL ,54. 1, PRT 8, , , ROU SVN SWE 1, , Tot.* 83,478 1,662 6,534 4,966 2,344 4,282 4,945 Tot.** 59,545 1,513 5,566 12,984 94,978 4,686 2,217 4,28 4,88 6, , , ,312 48% 1,332 48% 458 7% * All countries available ** Exc.BGR,CYP,MLT,HRV&GRC 15
107 EU Fleet Overview Appendix Table 3.2 Main variables and indicators by MS and fishing activity in 212 Variable/indicator No. Vessels (number) Vessel tonnage (thousand tonne) Vessel power (thousand kw) Total employed (number) Fishing activity BEL BGR CYP DEU DNK ESP EST FIN FRA GBR GRC HRV IRL ITA LTU LVA MLT NLD POL PRT ROU SVN SWE Total Total* SSF 1, ,75 4, ,89 4,29 3,176 14,93 1,712 1,281 8, , ,944 LSF , ,63 1,41 1,16 1, , ,722 DWF SSF LSF ,15 DWF SSF ,828 LSF ,639 DWF SSF 4,87 1, ,61 1,858 1,878 3,525 5,468 21, ,648 13, ,271 8, ,818 LSF ,123 21, ,74 6,968 5,778 1,3 1,744 14, ,522 1,53 7, ,291 DWF 4, ,193 FTE (number) SSF 2, , ,378 2,32 19, , , ,759 Days at sea (thousand day) Fishing days (thousand days) Energy consumption (million litre) Energy consumption per landed tonne Landings weight (thousand tonne) Landings value (million ) LSF ,34 19, ,646 7,836 4, ,392 1, ,652 1,75 7, ,25 DWF 5, ,259 SSF , ,697 LSF ,174 DWF SSF , ,675 LSF ,47 DWF SSF LSF ,769 DWF SSF , , , ,756 LSF 1, , ,559 DWF , ,517 SSF LSF ,374 DWF SSF LSF ,995 DWF * Excluding BGR Note: data in red are considered unreliable 16
108 214 Annual Economic Report on the EU Fishing Fleet Variable/indicator Fishing activity BEL BGR CYP DEU DNK ESP EST FIN FRA GBR GRC HRV IRL ITA LTU LVA MLT NLD POL PRT ROU SVN SWE Total Total* SSF Landings income (thousand ) LSF ,9.2 DWF ,49.4 SSF Other income (thousand ) LSF DWF SSF Crew wage costs (thousand ) LSF ,337.4 DWF SSF Unpaid labour (thousand ) LSF DWF Energy costs (thousand ) SSF LSF ,186.8 DWF Repair costs (thousand ) SSF LSF DWF SSF Other variable costs (thousand ) LSF DWF SSF Non-variable costs (thousand ) LSF DWF SSF Annual depreciation (thousand ) LSF DWF GVA (thousand ) SSF LSF ,48. DWF GVA to Revenue (%) SSF LSF DWF OCF (thousand ) SSF LSF DWF Gross profit (thousand ) SSF LSF DWF Gross profit margin (%) SSF LSF DWF Net profit (thousand ) SSF LSF DWF SSF Net Profit margin (%) LSF DWF GVA per FTE (thousand ) SSF LSF DWF * excluding BGR,CYP,MLT,HRV,GRC; unreliable values have been highlighted in red 17
109 EU REGIONAL ANALYSIS 4. EU FLEET REGIONAL ANALYSIS KEY FINDINGS BALTIC SEA FLEET: Nine Member State fleets operated in the region in 212; the most important in terms of active vessel number was the Finnish fleet, also accounting for the most effort deployed due to its sheer size. In terms of production, the Finnish, Polish, Swedish and Danish fleets were the most important, collectively responsible for 74% of the landed weight and 76% of the value landed in 212. Baltic herring, sprat and cod continue to be the most important species. Revenue generated by the Baltic Sea fleet was estimated at around 259 million, with the Polish and Swedish fleets each contributing 21%. GVA produced by the fleet in 212 was estimated at 11 million and after accounting for operating costs, the fleet made 37 million in gross profit. While overall the Baltic fleet was profitable, three MS fleets, Denmark, Germany and Sweden, suffered net losses in 212. Two MS small-scale fleets and one MS large-scale fleet generated gross losses in 212. Development trend of the Baltic SSF fleets improved or remained stable in 5 out of the 7 MS fleets while performance deteriorated in four out of the eight MS large-scale fleets over the period The most important fleets in terms of revenue and GVA generated were the Polish and Finnish pelagic trawlers 24-4 m and Swedish demersal trawlers 24-4 m. MEDITERRANEAN & BLACK SEA FLEET: Eleven Member State fleets operated in the region in 212, with Bulgaria and Romania fishing exclusively in the Black Sea; the most important in terms of active vessel number was the Greek fleet, while the Italian fleet was the largest in terms of gross tonnage and engine power. In terms of production, landings (excl. Greece) amounted to approx. 363 thousand tonnes, corresponding to 1.3 billion. Italy, Spain and Croatia were the leading countries, accounting for 93% of the recorded landings. Overall the Mediterranean & Black Sea fleet saw declines in capacity, effort deployed and landings in weight from 211 to 212. European pilchard (sardine) and anchovy were the most important species. Revenue generated by the Mediterranean & Black Sea fleet covered was estimated at around 1 billion (excluding around 3 million in landings value by the Spanish fleet), with the Italian fleet contributing 87% ( 91 million). In fact, the top 4 fleet segments operating in the region where all Italian and collectively accounted for 38% of the vessels, 57% of the effort, 47% of landings weight and 45% of the revenue generated. GVA produced by the fleets covered was estimated at 522 million. After accounting for operating costs, the fleet made 252 million in gross profit. NORTH ATLANTIC FLEET: Eleven Member State fleet operated in the region in 212 (data on the Polish fleet not available); the most important in terms of active vessel number was the Portuguese fleet, also accounting for the most effort deployed. In terms of production, the UK, French and Irish fleets were collectively responsible for 72% of the landed weight. In value, the French, UK and Portuguese fleets, together accounted for 8% of the landed value in 212. The main species included the small pelagics Atlantic mackerel, jack and horse mackerels and European pilchard (sardine) and demersal species, such as Norway lobster and European hake. Revenue generated by the North Atlantic Sea fleet was 1.9 billion, 91% distributed amongst four MS fleets: France ( 673 million), UK ( 59 million), Portugal ( 357 million) and Ireland ( 238 million). GVA produced by the fleet in 212 was estimated at 951 million and after accounting for operating costs, the fleet made 327 million in gross profit. These values exclude the Spanish fleet operating in the region. The small-scale fleet generated 171 million in GVA and 42 million in gross profits but overall performance deteriorated, with the SSF moving from a profit making position in 211 to posting a net loss in 212. Collectively, the large-scale fleet generated gross profits in 212, improving compared to 211, largely a result of the improved performance of the UK fleet. While overall the North Atlantic fleet generated gross profits, all expect for three MS fleets suffered net loss in 212. Profitable fleets were the German ( 1.6 million), Dutch ( 524 thousand) and UK ( 88 million) fleets. 18
110 214 Annual Economic Report on the EU Fishing Fleet NORTH SEA & EASTERN ARCTIC: Eleven Member State fleet operated in the region in 212; the most important in terms of active vessel number was the UK fleet, also accounting for the most effort deployed. In terms of production, the Danish, UK, Dutch and French fleets were the most important, collectively responsible for 87% of the landed weight and 81% of the value landed in 212. Atlantic herring, mackerel and sprat were the most important species. Revenue generated by fleet was estimated at around 1.6 billion, with the UK and Danish fleets together contributing 51%. The GVA produced by the fleet in 212 was estimated at 774 million and after accounting for operating costs, the fleet made 385 million in gross profit. While overall the North Sea fleet was profitable, two MS small-scale fleets generated gross losses in 212. Development trend of the Baltic SSF fleets deteriorated in 5 out of 1 MS fleets. The most important fleets in terms of production generated were the Danish pelagic trawlers over 4 m and the UK purse seiners over 4 m. OTHER FISHING REGIONS FLEET: According to FAO fisheries statistics, there were 12 EU fleets operating in OFR in 212: Estonia, France, Germany, Greece, Italy, Latvia, Lithuania, Netherlands, Poland, Portugal, Spain and United Kingdom (Figure 4.1). No landings data was recorded for Ireland in 212. DCF economic data on the EU OFR or distant-water fleet is limited but DCF landings data compared to the corresponding FAO statistics had 94% coverage in 212. According to the DCF data submitted, the nine Member State fleets operating in the OFR, for which data was available, numbered 2,87 vessels in 212. The French fleet comprised the largest fleet in number (65% of the total reported), while the Spanish fleet, possessed 42% of the engine power and 62% of the gross tonnage. In terms of production, the EU OFR fleet landed 78 thousand tonnes in 212, corresponding to 1.2 billion (excluding the Polish fleet). Spain was the main EU MS fishing in other regions, covering 58% of all capture production in weight and 76% in value in 212. The most important species were skipjack tuna (178 thousand tonnes; 21 million), yellowfin tuna (147.6 thousand tonnes; 335 million) and swordfish ( 117 million). At fleet segment level, the Spanish pelagic seiners over 4m generated the highest landed value in 212, amounting to 422 million (54% of the total), followed at a distance by the Spanish demersal trawler over 4m segment ( 263 million) and then the French purse seiners over 4m ( 148 million). Background This chapter provides an overview of the MS fleets operating in each sea basin region. For each region, data on fleet capacity, employment, fishing effort, landings and economic performance indicators are provided by Member State, fishing activity and fleet segment (top 25 in terms of revenue) and results are summarised in the regional tables. To assess the economic performance of the EU fleet at regional sea basin level, JRC and STECF EWG 14 5 produced estimates on the structure and economic performance of fleet segments by allocating FTEs, revenue and costs to the sea basin using the effort and landings data available at a higher disaggregation level (subregion, FAO level 3 and level 4 for the Baltic Sea). Fleet economic data cannot be collected at higher resolution than defined in the DCF, i.e. Supra-region. Only the transversal variables, landings (value and weight) and effort data (days at sea, fishing days, etc.) are provided by Member States at the sub-region level and by fleet segment. Therefore, the correlation with transversal data is the only viable way for disaggregating economic data at the sea basin level, namely: Baltic Sea, North Sea & Eastern Arctic, North Atlantic, Mediterranean & Black Sea and Other Fishing regions). As DCF economic data is collected at the supra region level, the economic data for fleet segments that operate in a specific region does not always relate exclusively to the fishing activity of those vessels in the region. For example, a Danish trawl segment that spends half of its time in the Baltic Sea and half of its time in the North Sea will only have economic data available at supra region level 27, which consists of the Baltic Sea, the North Sea and the North Atlantic fishing regions. Therefore, to assess the performance of the Danish North Sea fleet, economic data provided for the fleet segment at the supra-region (area 27) is disaggregated at the sub-region (North Sea) level by assuming several correlations with transversal data. For this exercise, transversal and 19
111 EU REGIONAL ANALYSIS economic data by fleet segment were disaggregated based on either the value of landings or effort (days at sea), as: (1) Value of landings was used to allocate crew costs and all income indicators; (2) Effort in days at sea was used to allocate fuel costs, repair and maintenance costs, depreciation and variable and non-variable costs; capacity and employment indicators. The number of vessels operating in the region was provided by Member States with their data submissions. There are several limitations to this approach, which should be considered exploratory rather than a source of factual statements that are considered robust enough to be a basis for policy decisions. Apart from missing and/or questionable datasets, other limitations due to the nature of the DCF data and the methodology used may affect the quality (or reality) of the results to a certain extent. One example of data/methodology limitation is when a fleet segment that is based in the Baltic Sea but operates predominately in the North Sea will have sea days in the Baltic region (steaming to and from fishing grounds) with little or no corresponding income (landings). This can introduce errors that will negatively affect the performance of the Baltic fleet while conversely improving the performance of the North Sea fleet by underestimating costs (steaming to get to the North Sea fishing areas will be attributed to the Baltic Sea, where perhaps, little of no fishing activity occurred, i.e. reduced revenue). Therefore, estimates for fleet segments with less than 3% of effort and/or landings value/weight in a region should be considered with caution. In several cases, the share of active vessels in the region showed very low values but attained very high effort and/or landings share in the region (and vice-versa). These apparent data inconsistencies should be further investigated and improved in future. See Methodology (section 8.4) for more details on the method used to disaggregate and allocate economic variables at the sea basin level. 11

112 214 Annual Economic Report on the EU Fishing Fleet 4.1. EU Baltic Sea Fishing Fleet The Baltic Sea covers ICES areas IIIb, IIIc and IIId and is bounded by the Swedish part of the Scandinavian Peninsula, mainland Europe and the Danish islands. The central part of the Baltic Sea is bordered on its northern edge by the Gulf of Bothnia, on its north-eastern edge by the Gulf of Finland, and on its eastern edge by the Gulf of Riga. Eight EU Member States were involved in Baltic Sea fisheries in 212: Denmark, Estonia, Finland, Germany, Latvia, Lithuania, Poland and Sweden (Figure 4.1). Results for the Baltic Sea fleet exclude the German pelagic trawl segment due to confidentiality issues. Due to incomplete and/or unreliable datasets, the Baltic fleet analysis excludes the Estonian fleet. Figure Regional map, highlighting the Baltic Sea MS fleets and FAO fishing areas. Data source: Member State data submissions under the DCF 214 Fleet Economic (MARE/A3/AC(214)). Regional Fisheries management The European Commission (EC) prepares proposals for measures and instruments for resource conservation including fishing quotas and fishing effort limitations after a certain consultative process. TACs (Total Allowable Catches) and quotas are annually defined for commercially important fish stocks in the Baltic (cod, herring, sprat, salmon and plaice). There are currently 5 species/stocks under TAC management in the Baltic Sea: (1) Cod; (2) Herring; (3) Sprat; (4) Atlantic salmon and (5) Plaice. Cod is the only fish species for which a multi-annual plan exists (Council Regulation (EC) No 198/27) (Table 4.1). The plan defines targets for stock recovery (in terms of cod mortality for Eastern and Western cod stocks) and also maximum fishing effort and licensing system for vessels fishing cod in the Baltic. Compared to 211, available cod quota increased in 212 while effort limitation remained stable (163 fishing days for Western cod (ICES subdivisions 22-24) and 16 fishing days for Eastern cod (ICES subdivision 25-28)). The European eel Recovery plan also affects several Baltic States. Within this plan, MS through national eel management plans need take measures that allow 4% of adult eels to escape from inland waters to the sea, where they can spawn. EU regulations also comprise specific fishery technical regulatory measures, such as mesh sizes, minimum landing sizes, by-catch limitations as well as periods and areas closed for fishing. Ban on driftnet fisheries was set after a three year transitional period in 28. The Baltic Sea coastal and inland fisheries are mainly regulated by each MS in the region through their national legislation. Table TAC in the Baltic Sea in 212 ICES subdivision TAC and % change to 211 ICES subdivision TAC and % change to 211 Overall TAC and % change to 211 Cod % % % Plaice % Herring 29 32% % % Sprat % Salmon (number of fishes) % 111
 and engine power (115 thousand kw) while the Swedish Baltic fleet was the largest in gross tonnage (18.")

, Poland (12 thousand tonnes), Sweden (89 thousand tonnes) and Denmark (62 thousand tonnes) were again the leading MS fleets.")
 (Figure 4.2).")
113 EU REGIONAL ANALYSIS Baltic Sea fishing fleet, effort and landings According to the DCF data submitted by region, the Member State fleets operating in the Baltic Sea collectively numbered 5,297 vessels in 212. The Finnish fleet comprised the largest fleet in number (1,952 vessels) and engine power (115 thousand kw) while the Swedish Baltic fleet was the largest in gross tonnage (18.6 thousand GT) (Figure 4.2). The latest official DCF data suggests that the EU Baltic Sea fleet spent almost 4 thousand days at sea in 212, 98.6% of which were actual fishing days. The weight and value of landings generated by the fleet amounted to approximately 545 thousand tonnes and 243 million, respectively. Finland, Germany and Poland together accounted for around 72% of the total days at sea (mostly generated by small scale fisheries). In terms of landed weight, Finland (133 thousand tonnes), Poland (12 thousand tonnes), Sweden (89 thousand tonnes) and Denmark (62 thousand tonnes) were again the leading MS fleets. Poland ( 55 million), Sweden ( 51 million) and Denmark ( 43 million), collectively accounted for around 61% of the total value of landings in the Baltic Sea in 212, followed by Finland, Latvia and Germany (again, bear in mind the exclusion of German pelagic landings) (Figure 4.2). The small-scale fleet accounted for 81% of the days at sea in the Baltic Sea while large-scale vessels generated by far the highest landed weight, with 92% of the total. The difference between the two fishing activities was slightly less for landed value, with LSF accounting for 79% of the total and SSF vessels 21%, reflecting the lower value of pelagic species that are mainly targeted by the LSF (Figure 4.2). While SSF covered 85% of the number of vessels, employment in this group amounted to 1,521 FTE in 212, representing around 4% of the total FTEs in the Baltic Sea fisheries, indicating the part-time nature of this fleet segment. In fact, the SSF showed a high variety of targeted species and species/stocks under quota management in the Baltic Sea (cod, herring and salmon). Other targeted species include perch, eel (also under the management plan), pike-perch, flounder and whitefish. Data source: Member State data submissions under the DCF 214 Fleet Economic (MARE/A3/AC(214)). Figure EU Baltic Sea fleet capacity, effort and landings by MS and fishing activity: 212. For confidentiality reasons, the figure for landed weight excludes the German pelagic trawl segment, which would have increased the total catch weight of the German fleet by around 38%. In addition, German demersal trawl segments sometimes target pelagic species while pelagic trawls may also target demersal 112

114 214 Annual Economic Report on the EU Fishing Fleet species. This is also the case for Swedish vessels, fishing both pelagic and demersal. Results should therefore be interpreted taking this into account. In 212, due to quota reduction, herring (234 thousand tonnes) overtook sprat (24 thousand tonnes) in terms of total weight landed, followed by cod (63.5 thousand tonnes) and then flounder (14.6 thousand tonnes) (Figure 4.3). Cod generated the highest value of landings in 212 ( 77 million), followed by herring ( 68 million), and then sprat ( 5 million). Data source: Member State data submissions under the DCF 214 Fleet Economic (MARE/A3/AC(214)). Figure List of the top 1 species in terms of weight landed for MS fleets operating in the Baltic Sea, 212 Sprat landings in weight and value in the Baltic Sea decreased 14% from 211 to 212. Baltic sprat quota (subdivisions 22 32) decreased again by 22% between 211 and 212, causing the decrease in landed weight. Although the total landed weight of Baltic herring decreased 6% between 211 and 212, value increased 14% over the same period. Cod landings remained relatively stable in both weight and value between 211 and 212. The multi-annual plan for cod in the Baltic impacts all fleets that have quota for cod and which interact with the cod fisheries. With an increase in TAC, the limited number of licenses and days at sea restrictions are becoming more constraining for fleets and may have an impact on the economic performance. Socio-economic performance Tables 4.2 to 4.4 contain a summary of economic performance of the Baltic Sea fleet by Member State, fishing activity and fleet segment, respectively. Performance by Member State The revenue (income from landings and other income) generated by the Baltic Sea fleet in 212 was an estimated 259 million, 76% of which was split between four Member States Poland ( 55.5 million), Sweden ( 53.8 million), Denmark ( 45 million) and Finland ( 43 million). Revenue increased 5% compared to 211, largely driven by increased revenue in the Finnish and Lithuanian fleets (Table 4.2). GVA produced by the Baltic Sea fleet in 212 was estimated at 11 million. After accounting for operating costs, the fleet made 37 million in gross profit (Table 4.2). While overall the Baltic fleet was profitable, one MS fleet (Germany), suffered gross losses in 212; deteriorating further compared to previous years. In fact, the German Baltic fleet moved from a profit making position in 211 to post a loss in 212, mainly as a result of the poor performance of its large-scale fleet (again, pelagic trawlers are excluded), which generated a gross loss of almost 1.8 million. The German small-scale fleet performed slightly better than its larger counterpart as well as improving on 211 results by generating a gross profit of 671 thousand (Table 4.2). 113
, generated the highest revenue ( 14.4 million) in this fleet segment, followed by Danish and Polish SSF fleets 12.9 and 12 million, respectively.")
115 EU REGIONAL ANALYSIS Performance by fishing activity 1 By fishing activity, the Finnish small-scale fleet, consisting of 1,89 vessels and employing 173 FTEs (indicating that fishing is mostly a part-time activity), generated the highest revenue ( 14.4 million) in this fleet segment, followed by Danish and Polish SSF fleets 12.9 and 12 million, respectively. The Swedish Baltic large-scale fleet, consisting of 147 vessels, generated the highest revenue ( 45.5 million), followed by the Polish ( 43.5 million) and Danish ( 32.3 million) large-scale fleets (Table 4.3). Although two MS small-scale fleets generated gross losses in 212 (Danish SSF million and Swedish SSF million), the performance of the Baltic SSF fleets improved or remained stable in 5 out of the 7 MS fleets over the period Performance of the Polish and Swedish SSF, the latter already in a loss making position, deteriorated compared to previous years. Only the German Baltic large-scale fleet generated gross losses in 212 (- 1.8 million) but performance deteriorated in four out of the eight MS large-scale fleets over the period analysed (Table 4.3). Performance by fleet segment Table 4.4 provides results for the top 35 MS fleet segments in terms of landed value, operating in the Baltic Sea in 212. These 35 MS fleet segments represented 93% of the effort deployed (369 thousand days at sea), 97% of the landed weight (531 thousand tonnes) and 96% of the landed value ( 233 million) generated by the Baltic Sea fleet in 212. At fleet segment level, the Polish pelagic trawl 24-4m segment operating in the Baltic Sea region generated the most revenue in 212 ( 24 million), followed by the Swedish demersal trawl and seine 24-4m segment ( 23.6 million) and the Finnish pelagic trawl 24-4m segment ( 23.3 million) (Table 4.4). The most important fleets in terms of revenue and GVA were again the Polish and Finnish pelagic trawlers 24-4m and Swedish demersal trawlers 24-4m. In relative terms, the Latvian passive gear segment under 1m generated the highest profit margins, followed by the German drift and fixed netters 12-18m and the Swedish demersal trawlers 1-12m. The Swedish demersal trawler 1-12m and 12-18m segments were estimated to have generated the highest GVA per FTE in 212, 23 and 189 thousand, respectively (Table 4.4) Mediterranean & Black Sea EU Member States fishing in Mediterranean waters include Croatia, Cyprus, France, Greece, Italy, Malta, Portugal, Slovenia and Spain, while Bulgaria and Romania fish exclusively in the Black Sea (Figure 4.4). Cyprus, Greece, France and Spain submitted incomplete data under the 214 DCF. Spain did not submit data on landings by species and effort for the years Due to data inconsistencies for several MS fleets were excluded from the trend analysis. Greece failed to provide any effort and landings data and is therefore excluded from the analysis. Hence, a fully comprehensive and realistic analysis could therefore not be carried out due to insufficient data. Due to very low levels of activity, the Portuguese fleet was not considered in the analysis. Figure Regional map, highlighting MS fleets operating in the Mediterranean & Black Sea. Note: no data submitted for GRC. GRC and fishing area to be included in map 1 based on data submitted by fleet segments and including only those with all the relevant data to estimate gross profit; Spain excluded in the economic indicator estimations due to missing data 114

 Sprat (Bulgaria 8,32.5 tonnes; Romania 3,442.")
 while the Italian Mediterranean fleet was the largest in gross tonnage (166 thousand GT) and engine power (1 million kw) (Figure 4.")
116 214 Annual Economic Report on the EU Fishing Fleet Fisheries Management in the Region The fisheries management in the Mediterranean Sea is mostly effort and area based, there are also some technical measures defined through the restriction of gear use and minimum landing sizes for species as listed in the COM 1967/26. TAC is defined for the only for the highly valuable blue fin tuna. All quotas defined in the Mediterranean Sea for 212 remained stable compared to 211. There are 2 species under TAC management in the Black sea: Turbot (Bulgaria 43.2 tonnes; Romania 43.2 tonnes) Sprat (Bulgaria 8,32.5 tonnes; Romania 3,442.5 tonnes) Mediterranean & Black Sea fishing fleet, effort and landings When including available data for Greece, the EU fleet fishing in the Mediterranean & Black Sea consisted of 38,484 vessels. Greece comprised the largest fleet in number (16 thousand vessels) while the Italian Mediterranean fleet was the largest in gross tonnage (166 thousand GT) and engine power (1 million kw) (Figure 4.5). In 212, according to the data available, which excludes Greece, there were 21,972 active vessels operating in the region. The Mediterranean & Black Sea fleet (excluding Cyprus, Greece and Spain due to incomplete effort data) spent more than 1.9 million days at sea in 212. The weight and value of landings generated by the regional fleet (excluding Greece) in 212 amounted to approximately 362 thousand tonnes and 1.3 billion, respectively. It should again be emphasised that the lack of complete data for all MS fleets operating in the region does not allow for a very realistic overall analysis of the Euro Mediterranean fleet production, as seen in Figure 4.5, where according to the available data, which excludes Cyprus, Greece and Spain), the Italian fleet accounted for 82% of the total number of days, followed at some distance by Croatia (12%). In terms of landed weight, Italy (196 thousand tonnes), Spain (8 thousand tonnes) and Croatia (62 thousand tonnes) were again the leading countries of those who provided data, together accounting for 93% of the total weight of landings by the EU Mediterranean & Black Sea fleet (excluding Greece). Large-scale vessels generated by the far the highest landed weight with 87% of the landed weight. Data source: Member State data submissions under the DCF 214 Fleet Economic (MARE/A3/AC(214)). Figure EU Mediterranean & Black Sea fleet capacity, effort and landings by MS and fishing activity: 212. Note: no data submitted for GRC; effort data missing for Cyprus and Spain 115
. Around 87% of the value landed by the EU Mediterranean & Black Sea fleet covered was predominantly generated by the large-scale fleet.")
117 EU REGIONAL ANALYSIS The Italian ( 925 million) and Spanish ( 267 million) fleets collectively accounted for around 91% of the total value of landings by the EU Mediterranean & Black Sea fleet (excluding Greece). Around 87% of the value landed by the EU Mediterranean & Black Sea fleet covered was predominantly generated by the large-scale fleet. Although over two thirds of the effort in Mediterranean & Black Sea is deployed by the small-scale fleet, these vessels landed only 13% of weight and 23% of the value in the region (Figure 4.5). This fleet segment is more important from a social point of view as it represents almost 47% of the FTE employment in the Mediterranean & Black Sea fleet. Again, these figures do not include the Greek fleet and hence, not a complete picture of the regional fleet. The main species for the EU Mediterranean & Black Sea fleet (excluding Greek landings) in 212, in terms of weight was European pilchard (=sardine) (78.5 thousand tonnes), followed by European anchovy (64 thousand tonnes) and then striped venus (2 thousand tonnes) (Figure 4.6). European pilchards are mainly landed in the Adriatic Sea by Italian and Croatian dredgers. The most landed species in value in 212 was European anchovy ( 11 million), followed by European hake ( 11 million). Figure List of the top 1 species in terms of weight landed in the for MS fleets operating in the Mediterranean & Black Sea, 212 Note: no data submitted for GRC Socio-economic performance Tables 4.5 to 4.7 contain a summary of economic performance of the Mediterranean & Black Sea fleet by Member State, fishing activity and fleet segment, respectively. The Greek fleet is not included due to missing data. Performance by Member State The revenue (income from landings and other income) generated by the Mediterranean & Black Sea fleet (excluding Spain) in 212 was an estimated 1,45 million, 87% of which was generated by the Italian fleet ( 91 million). If considering the value of landings reported for the Spanish fleet ( 265 million) as a proxy of revenue, the regional fleet generated approx. 1,31 million in revenue in 212 (Table 4.5). GVA produced by the Mediterranean & Black Sea fleet (excluding Spain) in 212 was estimated at 522 million and after accounting for operating costs, the fleet made 252 million in gross profit (Table 4.5). Five out of eight EU Member States fleet considered in the regional analysis and operating in the Mediterranean & Black Sea suffered decreases in revenue between 211 and 212. Italian Mediterranean fleet is estimated to have generated the highest GVA and gross profit in 212 ( 453 million and 232 million, respectively). 116

118 214 Annual Economic Report on the EU Fishing Fleet Performance by fishing activity 1 By fishing activity, and according to the available data, the Mediterranean & Black Sea fleet appears somewhat unevenly distributed between the two main types of fishing activity. The SSF possessed 69% of the fleet in number and accounted for 67% of the effort but employed only 47% of the FTE (or 51% of the total employed). In terms of production, the SSF landed only 13% in weight but 23% in value; overall generating 27% of the revenue, 32% of the GVA and 34% of gross profit (Table 4.6). Although five MS small-scale fleets and two large-scale fleets generated gross losses in 212, overall the Mediterranean & Black Sea SSF and LSF (excluding Spain) generated a gross profit of 87 million and 172 million, respectively. Performance by fleet segment Table 4.7 provides results for the top 35 MS fleet segments in terms of landed value operating in the Mediterranean & Black Sea in 212. These 35 MS fleet segments represented 84% of the effort deployed (1.6 million days at sea), 91% of the landed weight (328 thousand tonnes) and 93% of the landed value ( 1,223 million) generated by the regional fleet, which included around 15 active fleet segments in 212. At fleet segment level, the Italian polyvalent passive gear 6-12m segment generated the most revenue from the Mediterranean & Black Sea region in 212 ( 197 million, 13% decrease from 211), followed by the Italian demersal trawls and seines 12-18m segment ( 169 million, 18% decrease from 211) and then the Italian demersal trawls and seines 18-24m segment ( 166 million, 9% decrease from 211). The same fleet segments also generated the highest GVA and gross profit in 212 (Table 4.7) EU North Atlantic Fishing Fleet The North Atlantic covers ICES subdivisions V, VI, VII (except VIId) and VIII, IX, X, XII, as well as NAFO areas (AREA 21). There were 11 Member State fleets operating in the North Atlantic region in 212: Belgium, Denmark, France, Germany, Ireland, Lithuania, Portugal, Poland, Spain, The Netherlands and the United Kingdom in 212 (Figure 4.7). Due to insufficient data, the Polish fleet is not covered in the analysis. Additionally, estimates provided for the Danish, Dutch, German and Lithuanian fleets should be considered with caution due to the limited fishing activity reported for these MS fleets (effort and landings shares in the region less than 3%). Hence, according to the available data, the main fleets operating in the North Atlantic region in 212 were the French, Irish, Portuguese and UK fleets. Figure Regional map, highlighting MS fleets active in the North Atlantic region. Data source: Member State data submissions under the DCF 214 Fleet Economic (MARE/A3/AC(214)). Fisheries management The management plans that impact on North Atlantic fleets include: Long term plan for cod stocks and the fisheries exploiting those stocks (Council Regulation (EC) No 1342/28) Council Regulation (EC) No 388/26 established a multiannual plan for the sustainable exploitation of the stock of sole in the Bay of Biscay covering ICES areas VIIIa and VIIIb Council Regulation (EC) No 59/27 established a multi-annual plan for the sustainable exploitation of the stock of sole in the Western Channel (ICES VIIe) 117
119 EU REGIONAL ANALYSIS COUNCIL REGULATION (EC) No 2166/25 established measures for the recovery of the Southern hake and Norway lobster stocks in the Cantabrian Sea and Western Iberian Peninsula and amending Regulation (EC) No 85/98 for the conservation of fishery resources through technical measures for the protection of juveniles of marine organisms. COUNCIL REGULATION (EC) No 13/28 established a multi-annual plan for the herring stock distributed to the west of Scotland and the fisheries exploiting that stock in international and EU waters in ICES zones Vb and VIb, and the northern part of ICES zone VIa excluding the Clyde. Measures for the recovery of eel Area covered includes EU estuaries and rivers that flow into seas in ICES areas III, IV, VI, VII, VIII, IX and the Mediterranean (Council Regulation (EC) No 11/27 of 18 September 27). The long term plan for cod impacts on all fleets that have quota for cod and that interact with the cod fisheries. Days at sea restrictions are becoming more constraining and may have an effect on the economic performance of the fleets. In 212, there were catch/landings limitations for 5 fish species defined for the region, such as: boarfish, hake, capelin, horse mackerel, herring, blue whiting, Atlantic redfish, anchovy, Norway lobster, Greenland halibut, anglerfish, skates and rays, northern prawn, haddock, ling, saithe, Atlantic cod, roundnose grenadier, common sole and black scabbardfish. For some species, e.g. boarfish, capelin and blue whiting, the fishing opportunities in 212 increased by more than 1% compared to 211. However for others, e.g. anchovy and skates and rays, fishing opportunities decreased by more than 3%. Other management measures that may affect economic performance of the fleets operating in the North Atlantic include marine protected areas and other legislation that has a multispecies impact. North Atlantic fishing fleet, effort and landings According to the data provided at the regional level, Member State fleets operating in the North Atlantic region numbered over 8 thousand vessels in 212. Due to the non-submission of data, this value is underreported as it excludes the Dutch, Lithuanian, Polish and Spanish fleets. The pie charts presented in Figure 4.8 indicate the proportion of days at sea, landings weight and value for the Member State fleets and by fishing activity operating in the North Atlantic in 212. With 3,314 vessels, the Portuguese fleet comprised the largest fleet in number. The data available also suggests that the EU North Atlantic fleet spent a total of around 1 million days at sea in 212, 9% of which were actual fishing days. Collectively, the Portuguese, French and UK North Atlantic fleets accounted for 94% of the days at sea in the region (Figure 4.8) The weight and value of landings generated by the EU North Atlantic fleet in 212 amounted to almost 1.2 million tonnes and 1.9 billion, respectively. In terms of landed weight, the UK (33.5 thousand tonnes), French (31 thousand tonnes) and Irish (235 thousand tonnes) were the leading national fleets, together accounting for 72% of the total weight landed. The French ( 655 million), UK ( 492 million) and Portuguese ( 358 million) fleets together accounted for around 8% of the total value of landings in 212; indicating that the Irish fleet has a relatively low value species composition while conversely, landings by the French and Portuguese fleets have higher value species compositions (Figure 4.8). SSF vessels accounted for 52% of the total number of days at sea in the North Atlantic area but only 9% of the landed weight and 14% of the landed value share. It should be noted that these values exclude the Polish fleet fishing in the North Atlantic and days at sea figures for Ireland were only provided for the over 1m fleet (Figure 4.8). 118
). Figure 4.")

, jack and horse mackerels (131 thousand tonnes) and")
,")


120 214 Annual Economic Report on the EU Fishing Fleet Data source: Member State data submissions under the DCF 214 Fleet Economic (MARE/A3/AC(214)). Figure North Atlantic fleet capacity, effort and landings by MS and fishing activity: 212. Note: excludes Polish vessels and capacity for the Spanish fleet In 212, the main species landed by the North Atlantic fleet in terms of weight were small pelagic species, including Atlantic mackerel (182 thousand tonnes), jack and horse mackerels (131 thousand tonnes) and European pilchard (98 thousand tonnes) (Figure 4.9). In terms of value, Atlantic mackerel was also the most important species in 212 ( 25 million), followed by Norway lobster ( 169 million) and European hake ( 161 million). Data source: Member State data submissions under the DCF 214 Fleet Economic (MARE/A3/AC(214)). Figure List of the top 1 species in terms of weight landed for MS fleets operating in the North Atlantic region, 212 Socio-Economic performance Table 4.8 to Table 4.1 contain a summary of economic performance of the North Atlantic fleet by Member State, fishing activity and fleet segment, respectively. 119
121 EU REGIONAL ANALYSIS Performance by Member State Revenue (income from landings and other income) generated by the EU North Atlantic fleet in 212 was estimated at 1.9 billion, 91% of which was split between four Member States France ( 673 million), UK ( 59 million), Portugal ( 357 million) and Ireland ( 238 million). These figures exclude the Spanish fleet due to insufficient data provided. Revenue increased 3% compared to 211, driven mainly by increased revenue generated by the Irish, Dutch and UK fleets, as revenue decreased significantly for the Danish (-24%) and German (-21%) fleets (Table 4.8). GVA produced by the North Atlantic fleet in 212 was estimated at 951 million and, after accounting for operating costs, 327 million in gross profit. All MS fleets operating in the North Atlantic fleet generated gross profits. The development trend of all MS fleets operating in the region, with the exception of the Danish and Portuguese fleets, improved over the period However, when compared to the previous year, the performance of five MS fleets deteriorated in 212 (Table 4.8). Performance by fishing activity 1 By fishing activity, the North Atlantic small-scale fleet generated 296 million in revenue, while the large-scale fleet generated 1.6 billion in revenue (excluding Spain). The French small-scale fleet, consisting of 1,278 vessels and employing 1,837 FTEs, generated the highest revenue ( 162 million) in the SSF segment, followed by UK and Portuguese SSF fleets 66 and 62 million, respectively (Table 4.9). Similarly for the large-scale fleet, the French North Atlantic fleet, consisting of 1,63 vessels and employing 3,289 FTEs, generated the highest revenue ( 511 million), followed by the UK ( 443 million) and Portuguese ( 274 million) large-scale fleets. The North Atlantic small-scale fleet generated 171 million in GVA and 42 million in gross profit. The Irish small-scale fleet suffered a gross loss estimated at 1 million in 212, deteriorating further compared to 211, when losses amounted to 3 million. Collectively, the large-scale fleet (excluding Spain) generated 76 million in GVA and a gross profit of 271 million in 212 (Table 4.9). Additionally, three distant water fleets (Lithuanian, Portuguese and Spanish fleets) were also active in the region in 212, with landings in weight reported at 12.8 thousand tonnes, corresponding to 22.5 million in landed value; 73% of which was landed by the Spanish DWF fleet. Performance by fleet segment Table 4.1 provides results for the top 35 MS fleet segments in terms of landed value operating in the North Atlantic region in 212. These 35 MS fleet segments represented 53% of the effort (528 thousand days at sea), 71% of the landed weight (833 thousand tonnes) and 73% of the landed value ( 1.4 billion) generated by the North Atlantic fleet in 212. Again, Spanish fleet segments are not included due to insufficient data provided and necessary to disaggregate economic data at the regional level. At fleet segment level, the UK purse seiners over 4m operating in the North Atlantic region generated the most revenue in 212 ( 147 million), amounting to 7.6% of the total, followed by the French demersal trawl and seine m segment ( 13 million) and the Irish pelagic trawler over 4m segment ( 87 million) (Table 4.1). The most important fleets in terms of gross profit generated were again the UK purse seiners over 4m ( 63 million), followed by the Irish pelagic trawl over 4 m ( 33 million) and the Portuguese demersal trawl and seine over 4 m segment ( 2 million). However, the most important fleet with 1,193 vessels (PGP 1) in Portugal had a general decreasing economic performance (Table 4.1). 12
.")
122 214 Annual Economic Report on the EU Fishing Fleet 4.4. North Sea & Eastern Arctic area The North Sea & Eastern Arctic area includes ICES areas IIIa, IV, VIId, I and II. The analysis includes reported landings from 11 MS fleets: Belgium, Denmark, Germany, France, Ireland, Lithuania, The Netherlands, Portugal, Spain, Sweden and the UK (Figure 4.1). Spanish and French data were missing or incomplete and thus are only partially covered in the analysis. In addition, for confidentiality reasons, data on the German pelagic trawl segment is not available. Trends should therefore be interpreted with care. For simplicity from this point on we will refer to the EU vessels operating in the aforementioned ICES areas as the EU North Sea fleet. It has to be born in mind, though, that the Eastern Arctic (ICES areas I and II) is included as well. Data source: Member State data submissions under the DCF 214 Fleet Economic (MARE/A3/AC(214)). Figure Regional map, highlighting the North Sea and Eastern Arctic MS fleets and FAO fishing areas. Fisheries management The management plans in force in 212 that impacted on the North Sea and Eastern Arctic included: Long term plan for cod stocks and the fisheries exploiting those stocks (Council Regulation (EC) No 1342/28). Multiannual plan for fisheries exploiting stocks of plaice and sole in the North Sea (Council Regulation (EC) No 676/27). Recovery plan for the Northern hake stock covering the areas Kattegat, Skagerrak, North Sea, the Channel, West of Scotland, all around Ireland and Bay of Biscay (Council Regulation (EC) No 811/24). Measures for the recovery of eel Area covered includes EU estuaries and rivers that flow into seas in ICES areas III, IV, VI, VII, VIII, IX and the Mediterranean (Council Regulation (EC) No 11/27 of 18 September 27). The long term plan for cod impacts on all fleets that have quota for cod and that interact with the cod fisheries. Days at sea restrictions are becoming more constraining to the fleets that will have an effect on economic performance. Other management measures that may affect economic performance of the fleets operating in the North Sea and Eastern Arctic include marine protected areas and other national legislation. North Sea & Easter Arctic fishing fleet, effort and landings Member State fleets operating in the North Sea & Eastern Arctic region in 212, for which data was available numbered 5,861 vessels. This value is underreported as data (number of vessels operating in the region) was not provided for the Irish and Lithuanian fleets. The UK North Sea fleet comprised the largest fleet in number (2,95 vessels), accounting for 5% of the total reported (Figure 4.11). Overall the North Sea fleet saw declines in capacity and effort deployed over the period Landed value also increased steadily from 21 onwards while landed weight increased between 21 and 211, remaining rather stable in 212. The latest official DCF data suggests that the EU North Sea fleet spent over 471 thousand days at sea in 212. The weight and value of landings generated by the fleet amounted to approximately 1,94 thousand tonnes and almost 1.5 billion, respectively. 121

, UK (36 thousand tonnes), The Netherlands (121 thousand tonnes) and France (112 thousand tonnes) were the leading MS fleets, together")
123 EU REGIONAL ANALYSIS The pie charts presented in Figure 4.11 also indicate the proportion of days at sea, landings weight and value attributable to each North Sea Member State fleet and by fishing activity in 212. Denmark, France and UK together accounted for around 73% of the total days at sea (mostly generated by large-scale fisheries). In terms of landed weight, Denmark (413 thousand tonnes), UK (36 thousand tonnes), The Netherlands (121 thousand tonnes) and France (112 thousand tonnes) were the leading MS fleets, together accounting for 87% of the total reported landings. The same MS fleets: UK ( 436 million); Denmark ( 327 million); The Netherlands ( 241 million) and France ( 196 million), also collectively accounted for 81% of the total value of landings in the North Sea in 212. These figures suggest that the Danish fleet landings are composed mainly of low valued species (Figure 4.11). According to the data reported, the North Sea fisheries are dominated by large-scale vessels; although accounting for only 41% of the number, LSF vessels deployed 61% of the effort and landed 97% of the weight and 92% of the value (Figure 4.11). Data source: Member State data submissions under the DCF 214 Fleet Economic (MARE/A3/AC(214)). Figure 4.11 North Sea and Eastern Artic fleet capacity, effort and landings by MS and fishing activity: 212. Note: number of vessels missing for Ireland, Lithuanian and Spain. Based on the data provided, in 212 Atlantic herring (29 thousand tonnes) was the most important species in terms of weight. Landings of sandeel, which had been the most important species in the region in 211, fell 82% in 212 due to significant cuts in the TAC for this quota species. Landed weight of Atlantic mackerel (149 thousand tonnes) overtook European sprat (11 thousand tonnes), becoming the third most important species in terms of weight in the North Sea. Landings of relatively low value industrial species (sandeel, sprat, herring, Norway pout) appears to have decreased substantially, the majority being landed by the Danish fleet. In terms of demersal species, plaice (77 thousand tonnes) and cod (71 thousand tonnes) were the most prevalent in terms of weight landed (Figure 4.12). In terms of value, Atlantic cod was the most important species in 212 ( 173 million) followed by Atlantic herring ( 172 million), common sole ( 141 million), common shrimp ( 123 million) and Atlantic mackerel ( 121 million). 122

124 214 Annual Economic Report on the EU Fishing Fleet Figure 4.12 List of the top 1 species in terms of weight landed of MS fleets operating in the North Sea and Eastern Artic region, 212 Socio-Economic performance Table 4.11 to Table 4.13 contain a summary of economic performance of the North Sea & Eastern Arctic fleet by Member State, fishing activity and fleet segment, respectively. Performance by Member State The revenue (income from landings and other income) generated by the North Sea fleet in 212 was an estimated 1.6 billion, 86% of which was split between five Member States UK ( 451 million), Demark ( 333 million), The Netherlands ( 244 million), France ( 21 million) and Germany ( 16 million). Revenue decreased 2% compared to 211, largely driven by decreased revenue in the UK fleet (-11%). Conversely, the Portuguese fleet saw its revenue almost double in 212 while the German fleet saw a 35% increase (Table 4.11). Data on the Spanish fleet is not included due to insufficient data provided. However, according to the data available, the Spanish fleet contribution to the region is insignificant with landings equating to only 23 tonnes and 1.1 thousand reported in 212. GVA produced by the North Sea fleet in 212 was estimated at 774 million. After accounting for operating costs, the fleet made 385 million in gross profit and when deducting for capital costs, the fleet was profitable, generating 161 million in net profits (Table 4.11). Danish fishers were the most productive in 212, with a labour productivity (GVA per FTE) estimated at around 184 thousand per FTE, followed by the German ( 11 thousand per FTE) and then Dutch ( 76 thousand per FTE) fishers. Results suggest that the UK fishers were the least productive, generating 47 thousand per FTE (Table 4.11). Performance by fishing activity 1 By fishing activity, the North Sea small-scale fleet generated 122 million in revenue, a 5% increase on 211 results, while the large-scale fleet generated 1.5 billion in revenue, a.3% increase compared to 211. There were six MS small-scale fleets operating in the North Sea region. The UK small-scale fleet, consisting of 2,75 vessels and employing 1,12 FTEs (indicating high part-time activity), generated the highest revenue ( 58 million) in the SSF segment. Additionally, the UK North Sea large-scale fleet, consisting of 83 vessels, generated the highest revenue ( 393 million) in the LSF segment, followed by the Danish ( 319 million) and Dutch ( 4 million) large-scale fleets (Table 4.12). Although the German small-scale fleet generated gross losses in 212, overall the SSF segment was profitable in 212; generating 16 million in gross profit (a 12% decrease compared to 211). All North Sea MS largescale fleets generated gross profits in 212 (Table 4.12). 123
125 EU REGIONAL ANALYSIS Performance by fleet segment Table 4.13 provides results for the top 35 MS fleet segments in terms of landed value operating in the North Sea in 212. These 35 MS fleet segments represented 6% of the effort (284 thousand days at sea), 84% of the landed weight (915 thousand tonnes) and 83% of the landed value generated by the regional fleet in 212. At fleet segment level, the Danish pelagic trawl over 4m segment operating in the North Sea region generated the most revenue in 212 ( 121 million), followed by the UK purse seiners over 4m ( 15 million) and the Dutch beam trawlers over 4m ( 11 million) (Table 4.13). The most important fleets in terms of GVA were again the Danish pelagic trawlers and UK purse seiners over 4m followed by the Portuguese demersal trawler/seiners over 4m Other Fishing Regions (OFR) EU Distant-water fleet Although the main fishing grounds for the EU fishing fleet are the Baltic Sea, North Sea, North Atlantic and Mediterranean Sea, parts of the EU fleet operate much further afield. This analysis is concentrated on all the other fishing regions where the EU fleets are present and operational. These regions, collectively termed other regions (or OFR) encompass all fishing areas outside the North Atlantic (FAO AREA 21 & 27) and Mediterranean & Black Sea (FAO AREA 37), including EU-waters in outermost regions and non-eu waters (international waters/high seas and EEZs of non-eu countries). While the majority of the production in Other Regions is the result of Member States high seas fleets (usually over 4m), EU Member States also have a substantial fleet, consisting mainly of small to large-scale coastal vessels, operating in EU outermost regions. EU outermost Region fleet - There are seven "EU outermost regions": Guadeloupe, French Guyana, Martinique, Réunion, Saint Martin and Saint-Barthélemy (the French overseas departments), the Canaries (autonomous community belonging to Spain), and the Azores and Madeira (autonomous regions of Portugal). Their respective geographical locations (Atlantic, Caribbean and Indian Ocean) enable the EU to have the world's largest maritime territory with an exclusive economic zone covering 25 million km². The Portuguese Azores region is not included in Other Fishing Regions as it is located in the North Atlantic (AREA 27). EU high seas or distant-water fleet - The EU distant-water fleet operates in international waters (high seas) and through bilateral agreements with countries outside the EU. These include fishing areas in the South and Central Atlantic, Indian, Pacific and Antarctic (or Southern) Oceans. The EU has 2 types of fishing agreements with non-eu countries: (1) fisheries partnership agreements (FPA) the EU gives financial and technical support in exchange for fishing rights, generally with southern partner countries and (2) the "northern agreements" these are excluded from the Other Fishing Regions analysis and instead included, by definition, in either the North Atlantic or the North Sea & Eastern Arctic Regions. According to the definition applied in the AER, the EU distant-water fleet is defined as vessels over 24 m predominately operating in Other Fishing Regions. Due to the limited data provided for many EU fleet segment operating in Other Fishing Regions, this analysis is complemented with FAO statistics. Fisheries management Outermost regions/national regional fisheries regulations Apart from TACs for all main species/stocks, EU regulations comprise specific fishery technical regulatory measures, such as mesh sizes, minimum landing sizes, by-catch limitations as well as periods and areas closed for fishing. Coastal and offshore fisheries are mainly regulated by each MS country through their national legislation (France, Spain and Portugal). Fisheries Partner Agreements (FPAs) with 3rd countries these are fisheries agreements with non-eu countries, negotiated and concluded by the Commission on behalf of the EU. They are intended to allow EU vessels to fish for surplus stocks in other country's exclusive economic zone (EEZ), in a legally regulated 124
126 214 Annual Economic Report on the EU Fishing Fleet environment. In return, the EU pays the partner countries a financial contribution composed of 2 distinct parts: access rights to the EEZ and "sectoral" financial support. There are currently 16 FPA in force, which can be divided into two main forms: 1 - Tuna agreements 11 bilateral tuna agreements that allow EU vessels to pursue migrating tuna stocks as they move along the shores of Africa and through the Indian and Pacific Oceans; 2 - Mixed agreements 5 bilateral agreements that provide access to a wide range of fish stocks in the partner country's exclusive economic zone. More information on these fisheries agreements can be found in Annex Table X. Regional Fisheries Management Organisations (RMFOs) - Fishing in international waters outside the EEZ is regulated by RFMOs and their member countries. These members include bordering states as well as countries that are heavily involved in fishing in a given marine region. EU Member States are represented in numerous RFMOs through the European Commission. Annual negotiations are held to determine which countries are allowed to catch how much of a species. Almost all commercially relevant fish species are covered by the RFMOs. There are specific RFMOs for the management of certain fish species, for example, tuna, salmon and pollock. RFMOs that manage fish stocks by region include: North Atlantic Salmon Conservation Organization (NASCO); South East Atlantic Fisheries Organisation (SEAFO); South Indian Ocean Fisheries Agreement (SIOFA); South Pacific Regional Fisheries Management Organisation (SPRFMO); Commission for the Conservation of Antarctic Marine Living Resources (CCAMLR), etc. RFMOs that manage highly migratory fish species, mainly tuna include: International Commission for the Conservation of Atlantic Tunas (ICCAT); Indian Ocean Tuna Commission (IOTC); Western and Central Pacific Fisheries Commission (WCPFC); Inter-American Tropical Tuna Commission (IATTC); Commission for the Conservation of Southern Bluefin Tuna (CCSBT), etc. EU fishing fleet, effort and landings in Other Fishing Regions For the analysis both DCF data provided by Member States and FAO capture production by country and area are presented so as to provide as much information as possible. Due to several reasons, the DCF data on the EU fleet fishing in other regions is rather limited. However, with the inclusion of Spanish landings data, submitted for the year 212, the coverage of DCF data compared to corresponding FAO statistics improved significantly and was estimated at 94% in 212. Although the UK provided effort and landings data for other regions, due to the small number of vessels involved (less than ten) the economic performance data for those vessels is allocated to supra region 27, where the vast majority of UK vessels operate. In addition, Estonia, Poland, Germany and Latvia, who collectively account for around 17% of catches in other regions (FAO data), could not provide any economic data, mainly due to confidentiality reasons. Poland provided the number of vessels, effort, and landings, but not the corresponding value due to confidentiality reasons. Additionally, due to missing effort data for France and Spain, economic data on these MS fleets could not be disaggregated to the region. According to FAO fisheries statistics, there were 12 EU fleets operating in Other Fishing Regions in 212: Estonia, France, Germany, Greece, Italy, Latvia, Lithuania, Netherlands, Poland, Portugal, Spain and United Kingdom (no landings data was recorded for Ireland in 212). However, under the DCF, data was available for only nine Member State fleets operating in Other Regions and often only incomplete data sets were provided. Eight EU Member States provided landed weight and value data for 212 under the DCF, while Poland only provided weight landed due to confidentiality issues. Furthermore, data for Estonia and Germany were lacking. 125
.")
.")
127 EU REGIONAL ANALYSIS According to FAO, the majority (71%) of the landings is taken in the Atlantic Ocean (36 thousand tonnes), followed by the Indian Ocean (19%) and then the Pacific Ocean (9%). Only 1% of the fishing activity in Other Regions occurs in the Antarctic or Southern Ocean (Figure 4.13). The total landed weight in Other Regions in 212 reported by FAO for the EU fleet amounted to 826 thousand tonnes, a 23% decrease compared to 211. Fishing in non-eu waters or outermost regions is led by Spain, whose fleet catches 64% of the catches in other countries' exclusive economic zones or on the high seas (Figure 4.13). Source: FAO statistics Figure Landings (in weight) in Other Fishing Regions by Region (left) and MS (right): 212 According to FAO data, there was a sharp decline in landings from the Atlantic region in 212 compared to record high value in 211. Decreases in landings also reported for all the other regions. Landings in weight decreased in 212 when compared to 28 for all MS with the exception of Spain, who saw landings increase by 3%, from 43 thousand tonnes in 28 to 525 thousand tonnes in 212 (Figure 4.14). No landings reported for Estonia in 28 and for Ireland in 212. Figure Trend of landings (in weight) by major fishing area and MS fleet in Other Fishing Regions: Source: FAO statistics The weight of landings reported under the DCF for the eight Member States fleets covered was 78 thousand tonnes in 212, suggesting a coverage of around 94% of the landings weight reported in FAO statistics. The corresponding landed value, which excludes Polish fleet landings, was 1.2 billion. The DWF fleet accounted for 8% of the landed weight and 92% of the landed value (Figure 4.15). 126

 (Figure 4.16).")

 represented 23% of the total weight while yellowfin tuna (147.6 thousand tonnes) contributed to 19% of the weight.")
128 214 Annual Economic Report on the EU Fishing Fleet Figure 4.15 Other fishing region fleet capacity, effort and landings by MS and fishing activity: 212. According to FAO statistics, 781 thousand tonnes of marine fishes, 4.7 thousand tonnes of molluscs and almost 5 thousand tonnes of crustaceans were landed by EU fleets operating in OFR in 212. Of the marine fishes, tunas, bonitos and billfishes accounted for 47%, followed by small pelagics such as herrings, sardines and anchovies (14%) (Figure 4.16). Source: FAO statistics Figure List of the top 1 species in terms of weight landed in the for MS fleets operating in Other Fishing Regions, 212 According to the DCF data, the 3 most important species in terms of weight were several highly migratory species. Landings of skipjack tuna (178 thousand tonnes) represented 23% of the total weight while yellowfin tuna (147.6 thousand tonnes) contributed to 19% of the weight. Blue sharks came in third, amounting to 49 thousand tonnes (Figure 4.17). In terms of value, large pelagics were also the most important species; yellowfin tuna ( 335 million), followed by skipjack tuna ( 21 million) and swordfish ( 117 million). Figure List of the top 1 species in terms of weight landed in the for MS fleets operating in Other fishing regions :
129 EU REGIONAL ANALYSIS Socio-Economic performance Table 4.14 to Table 4.16 contain a summary of economic performance of the Other Fishing Region fleet by Member State, fishing activity and fleet segment, respectively. Due to the incompleteness of the data, an overall regional assessment is not presented. Results for the top 35 MS fleet segments in terms of value of landings operating in Other Regions in 212 are presented in Table These 35 MS fleet segments represented 93% of the landed weight reported for the OFR fleet in 212. At fleet segment level, the Spanish pelagic seiners over 4m generated the highest landed value in 212, amounting to 422 million (54% of the total), followed at a distance by the Spanish demersal trawler over 4m segment ( 263 million) and then the French purse seiners over 4m ( 148 million) (Table 4.16). Summary of some major MS fleet segments operating in OFR FRANCE: The French industrial fleet of Purse Seiners consisted of 17 vessels in 212, operating in Indian Ocean and Western Africa. The average age of the vessels in this fleet segment was 17.5 years in 212 and average length was 75.3 meters. The average full time employment is 19.5 employees by vessel in 212 (fishermen employees come from both France and foreign countries (mostly African). In 212, total volumes of landings of tropical tuna amounted more than 78 5 tons, (down 8.7% compared to 211). The overwhelming majority of this fleet is made of freezer tuna seiners operating in the Indian Ocean and Atlantic Ocean. Tuna species caught are yellowfin tuna (YFT around 43 9 tons), skipjack tuna (SKJ around 29 3 tons), big eye tuna (BET around 4 9 tons) and albacore (ALB around 5 tons). Total values of landings for the whole 17 vessels reached 148,1 million in 212. Total income increased significantly between 211 and 212 (+21.6%). This good economic year is due to an increase of the average prices, especially for the yellowfin tuna. This favorable situation is explained both by the stability of the global production and the development of new markets. Yellowfin tuna represented 55.9% of the total catches both in the Indian Ocean and in the Atlantic. The ratio gross profit / turnover reached 2.4% in 212 for this fleet segment. The profitability is nevertheless impacted by the high fuel prices (fuel costs represent 21.1% of the income in 212). During the year 212, the frequency of piracy has decreased significantly in the Indian Ocean. In addition, the instability of access to the resources (non-renewal of EU bilateral fisheries agreements with some African countries for example) may have an impact on the economic sustainability of this fleet in the coming years. A significant proportion of the catch is indeed caught in exclusive economic zone. LATVIA: There were five Latvian distant seas over 4m trawlers operating in CECAF area (EEZ of Mauritania and Morocco) in 212. All the vessels belong to the three fishing companies and economic data could not be provided due the confidentiality reasons. The total volume landed by the Latvian fleet operating in the Other Regions in 212 was over 3 thousand tonnes of fish. Volume landed in the Mauritanian fishing zone 3.31 was 19 thousand tonnes. The main landed species were Atlantic chub mackerel (3 thousand tonnes), Madeiran sardinella (2 thousand tonnes) and sardine (over 6 thousand tonnes). The total landed weight in the Mauritanian fishing zone 3.11 was 3 thousand tonnes. The main landed species were Atlantic chub mackerel (1 thousand tonnes). The total landed weight in the Morocco fishing zone was 8 thousand tonnes. The main landed species were chub mackerel (3 thousand tonnes) and jack and horse mackerels (2 thousand tonnes). In 212 Mauritania and Morocco did not define quotas for their fishing area. There is no official agreement between Latvia and Mauritanian and Morocco. However, it was possible to buy permission from native princes who are fishing rights owners for fishing in their territorial waters. To obtain the permits it is necessary to arrangement a job on-board for local people from Mauritania and Morocco but the largest part of crew on board is usually Latvian citizens. The salary is higher than Latvian national average and average salary in the fishery sector. There were no landings from Other Regions into the Latvian ports. The catches from Latvian vessels are usually landed in the ports of Mauritania or Morocco. Thus for previous years information on days at sea, catches and value of landings were received directly from the vessel owners or from Latvian observers. 128
130 214 Annual Economic Report on the EU Fishing Fleet LITHUANIA: In 213, around 86% of the total value landed by Lithuanian national fleet was contributed by the long distance segment, which employs around 355 FTEs. In 212 landing volume of Lithuanian long distance fleet decreased significantly, from thousand tons in 211 to 58.5 thousand tons in 212. This drop was related to compulsory termination of fishing operations in CECAF area due to missing contracts between EU and Morocco as well as delayed agreement and severe conditions with Mauritania. In 213 fishing volume for long distance fleet recovered to 89.3 thousand tones, but in the long term trend, it continues to decrease. Significant part of landings in 213 was generated from fisheries in Pacific Ocean. The crew for long distance vessels consists mostly from Lithuanian employees as well as mixed foreign employees from non EU countries including from the area where the vessel operates. In 213 the main species for long distance segment landings were Cunene horse mackerel (HMZ), Chub mackerel (MAS) from CECAF area and Chilean jack mackerel (CJM) from Southeast Pacific. Other important regions are NAFO and NEAFC where vessels target mainly demersal species. All catches from the long distance fleet are landed and sold solely in other countries. Lithuanian ports fish supplies are only from Baltic Sea and coastal area. THE NETHERLANDS: In 212 the Dutch pelagic fleet consisted of 13 vessels. The vessels were mainly operating in the Northeast Atlantic Ocean and some vessels also (partly) in the North Sea. However, according to an EUagreement with the Mauritanian government some Dutch vessels (limited capacity) were allowed to fish in Mauritanian waters. In the first months of 212 five vessels of the fleet operated in African waters (approximately four hundred days at sea, 17% of total days at sea). The pelagic fleet themselves paid for licences also to get final access to the Mauritanian waters. Catches were quota restricted. Total FTE in the fleet is around 44 of which approximately 17% (75 FTE) can be accounted to Mauritanian waters. Fishing in Mauritanian waters: the crew partly consisted of Mauritanian fishermen. Approximately 55% of the crew was Dutch nationality, 2% Mauritanian, 15% Portuguese and 1% Russian/Lithuanian. The salary for crew (depending on function and the share in revenues) is on par with the national average. The vessels in Mauritanian waters mainly targeted sardines. Other by-catch can be more profitable but these quantities are very small (less than 1%). Almost all landings in Mauritanian waters are sold to African countries. In 212 the fishery agreement with the Mauritanian government ended and a new agreement could not be established. Some vessels were timely tied up during summertime because of lack of other fishing rights and opportunities in Northeast Atlantic waters and in the Pacific. As at June 213 a new agreement is still not foreseen and it is expected that vessels will be tied up during summertime again. POLAND: After termination of fisheries in Pacific waters (outside Chilean EEZ) caused by poor Chilean jack mackerel stocks the economic performance of the Polish long distance fleet is highly dependent on access to Moroccan and Mauritanian fishing grounds and quotas available. If the EU efforts to reach an agreement that will allow the EU fleet to return to the Moroccan waters fail, the Polish fleet will probably consider moving to Atlantic-Antarctic fishing grounds to commence a krill fishery. This however may happen only if a ready market for krill products is found. PORTUGAL: The Portuguese fleet is highly diversified with a broad range of vessel types targeting different species predominantly in the Portuguese Exclusive Economic Zone (27.9.a for the mainland fleet, 27.1 for the Azores s fleet and CECAF for the Madeira s fleet). 18 vessels make up the hooks 24-4m segment which operates in the Africa Coast and Indian Ocean (FAO 34, 41, 51, 57). The fleet targets a variety of species but in particular large pelagic fishes, such as blue shark, bigeye tuna and swordfish. ITALY: At 1st of January 212, 14 vessels were included in the vessel register as vessels operating outside the Mediterranean Sea. However, only 5 vessels actually operated in other regions in 212. This fleet operates around Mauritania waters (CECAF Region). The vessels are classified as demersal trawlers targeting shrimps and cephalopods. In 212, they fished only 331 days and generated an income of landings of 6.5 million. The total employment was equal to 75 units. The gross value added was 5 million in 212, with a decrease of 38% compared with the previous year. This negative trend was mainly due to the strong reduction in activity and production ESTONIA AND IRELAND: There is only one Irish and one Estonian company operating in other regions. Economic information could therefore not be provided due the confidentiality reasons. 129
131 EU REGIONAL ANALYSIS References
132 214 Annual Economic Report on the EU Fishing Fleet Table EU Baltic Sea fleet structure and economic performance estimates by MS in 212 Region / Member State N % Trend 28- % Days at Sea % Landings % Trend 28- Value of % Trend 28- % Trend 28- % Development Gross Profit % Development FTE (#) Revenue ( ) GVA ( ) Vessels (days) 211 weight (kg) landings ( ) Trend ( ) 211 Trend Baltic Sea Denmark 648 Deteriorated ,947 62,21,714 Deteriorated 43,86,73 Stable 45,113,343 Stable 18,793,872 Deteriorated 1,37,178 Improved Baltic Sea Estonia 36 Deteriorated 178 4,187 44,544,772 Deteriorated 9,381,18 Deteriorated 9,191,99 Deteriorated 4,647,313 Deteriorated 1,16,661 Deteriorated Baltic Sea Finland 1,952 Improved ,96 132,917,219 Improved 35,67,493 Improved 43,168,816 Improved 19,479,243 Improved 9,131,511 Improved Baltic Sea Germany 917 Deteriorated ,63 22,85,933 Deteriorated 18,39,594 Deteriorated 2,82,91 Deteriorated 6,13,191 Deteriorated - 1,89,578 Deteriorated Baltic Sea Latvia 279 Deteriorated ,48 57,472,974 Deteriorated 23,374,298 Improved 24,744,286 Improved 8,445,98 Deteriorated 4,62,526 Deteriorated Baltic Sea Lithuania 94 Deteriorated 211 8,563 16,827,266 Deteriorated 7,94,769 Improved 7,537,62 Stable 3,11,646 Improved 1,759,59 Improved Baltic Sea Poland 765 Stable 1,52 66,449 12,19,793 Improved 55,299,145 Improved 55,475,32 Improved 27,262,482 Improved 1,96,319 Improved Baltic Sea Sweden 66 Deteriorated ,36 89,42,77 Deteriorated 51,195,682 Improved 53,759,919 Deteriorated 22,46,15 Deteriorated 9,256,578 Deteriorated Baltic Sea fleet 5,297 4,75 398, ,211, ,411, ,73,296 11,59,742 36,944,253 Table 4.3 EU Baltic Sea fleet structure and economic performance estimates by MS and fishing activity in 212 Region / MS Fishing activity % 211 Share % N 211 Vessels FTE (#) Days at Sea (days) % 211 Share % 211 Share % 211 Share % Landings Value of 211 weight (kg) landings ( ) Revenue ( ) Development Trend % 211 % Development 211 Trend % 211 % Development 211 Trend % 211 % Development 211 Trend BS DEU SSF % ,656 99% 7,942,496 1% 8,794,711 1% 9,636,63 Improved 3,555, Stable 671, Improved - 772, Improved 5,355 Stable BS DNK SSF % ,576 56% 5,669,778 5% 11,846,688 49% 12,856,879 Stable 4,996, Deteriorated - 1,657, Improved - 4,39, Improved 35,494 Improved BS FIN SSF 1,89 1% ,78 1% 13,128,67 1% 1,47,339 1% 14,417,75 Improved 8,16, Improved 2,84, Improved 1,714, Improved 46,86 Improved BS LTU SSF 69 1% 49 5,595 1% 564,473 1% 561,9 1% 661,93 Deteriorated 362, Improved 174, Improved 141, Improved 7,475 Improved BS LVA SSF 27 1% 154 1,891 1% 2,849,341 1% 1,441,62 1% 1,447,523 Improved 1,291, Stable 1,195, Improved 1,157, Improved 8,385 Improved BS POL SSF 558 1% ,461 1% 12,64,24 1% 11,969,113 1% 12,5,799 Improved 7,742, Stable 2,16, Deteriorated 1,465, Deteriorated 16,64 Stable % Development 211 Trend BS SWE SSF % 211 3,487 62% 3,521,721 68% 6,82,428 47% 8,264,67 Deteriorated 1,817, Deteriorated - 2,857, Deteriorated - 5,27, Stable 8,621 Deteriorated BS DEU LSF 72 23% 81 6,947 16% 14,143,437 2% 9,514,883 7% 1,446,37 Deteriorated 2,457, Deteriorated - 1,76, Deteriorated - 3,69, Deteriorated 3,445 Deteriorated BS DNK LSF % 22 12,371 19% 56,54,936 12% 31,239,386 9% 32,256,464 Stable 13,797, Stable 2,964, Stable - 6,971, Improved 68,176 Improved BS EST LSF 36 1% 178 4,187 1% 44,544,772 1% 9,381,18 1% 9,191,99 Deteriorated 4,647, Deteriorated 1,16, Deteriorated 54, Deteriorated 26,19 Deteriorated BS FIN LSF 57 1% 19 6,71 1% 119,748,952 1% 25,15,639 1% 28,751,111 Improved 11,372, Stable 6,291, Improved 4,62, Improved 14,335 Improved BS LTU LSF 25 1% 163 2,968 1% 16,262,793 1% 6,533,68 1% 6,876,527 Stable 2,649, Improved 1,584, Improved 1,194, Improved 16,285 Improved BS LVA LSF 72 1% 199 8,589 1% 54,623,633 1% 21,932,678 1% 23,296,763 Improved 7,154, Deteriorated 3,46, Deteriorated 1,837, Deteriorated 35,953 Deteriorated BS POL LSF 27 1% 1,38 22,988 1% 17,55,589 1% 43,33,33 1% 43,469,53 Improved 19,519, Stable 8,854, Improved 4,75, Improved 18,85 Improved BS SWE LSF % 232 1,873 37% 85,52,987 65% 44,393,254 4% 45,495,312 Stable 2,588, Stable 12,114, Deteriorated 4,423, Improved 88,57 Stable GVA ( ) GVA to revenue (%) Gross Profit ( ) Gross Profit margin (%) Net Profit ( ) Net Profit margin (%) GVA per FTE ( ) Data source: Member State data submissions under the DCF 214 Fleet Economic (MARE/A3/AC(214)). 131
133 EU REGIONAL ANALYSIS Table 4.4 EU Baltic Sea fleet structure and economic performance estimates of the top 25 MS Fleet Segment in terms of revenue in 212 Region / MS fleet segment N Vessels % 211 Share Days FTE (#) % 211 at Sea (days) % 211 Share Landings weight (kg) % 211 Share Value of landings ( ) % 211 Share Revenue ( ) % 211 BS POL AREA27 TM VL % 38 6,717 1% 79,712,132 1% 24,189,866 1% 24,21,631 Improved 9,598,846 Improved 39.7 Stable 3,73,343 Improved 12.7 Deteriorated 25,26 Improved BS SWE AREA27 DTS VL % 11 3,212 42% 66,349,29 62% 23,467,152 37% 23,597,312 Deteriorated 8,834,673 Deteriorated 37.4 Deteriorated 5,152,494 Deteriorated Deteriorated 8,162 Deteriorated BS FIN AREA27 TM VL % 76 3,554 16% 96,25,229 1% 2,47,1 1% 23,289,399 Improved 8,8,511 Improved 34.7 Deteriorated 4,74,38 Improved 2.35 Improved 16,323 Improved BS LVA AREA27 TM VL % 138 5,158 1% 43,722,412 1% 17,369,795 1% 17,486,569 Improved 6,746,473 Stable 38.6 Deteriorated 4,21,566 Deteriorated 24.3 Deteriorated 48,887 Deteriorated BS POL AREA27 DTS VL % 317 8,254 1% 16,877,281 1% 1,586,42 1% 1,67,515 Improved 5,687,539 Improved 53.6 Stable 3,682,59 Improved Stable 17,942 Deteriorated BS SWE AREA27 DTS VL % 74 3,477 48% 12,374,278 81% 1,322,811 47% 1,539,58 Improved 3,814,174 Stable 36.2 Deteriorated 1,725,211 Deteriorated Deteriorated 51,418 Deteriorated BS DNK AREA27 DTS VL % 64 5,168 27% 12,971,21 5% 9,99,18 28% 9,35,177 Deteriorated 4,91,38 Deteriorated 52.7 Stable 1,187,95 Deteriorated Deteriorated 76,72 Stable BS FIN AREA27 PG VL1 1,834 1% ,75 1% 1,77,782 1% 9,559,223 1% 12,323,249 Stable 6,96,45 Improved 56. Improved 2,254,43 Improved Improved 43,434 Improved BS EST AREA27 TM VL % 169 3,796 1% 43,482,772 1% 9,172,878 1% 8,978,295 Deteriorated 4,514,91 Deteriorated 5.3 Deteriorated 947,291 Deteriorated 1.55 Deteriorated 26,715 Deteriorated BS POL AREA27 PG VL % ,334 1% 8,216,934 1% 8,59,29 1% 8,75,627 5,662, ,684, ,53 BS DNK AREA27 PGP VL % 79 17,49 52% 2,693,85 49% 7,7,81 5% 7,462,782 Stable 3,686,677 Improved 49.4 Stable - 611,988 Improved -8.2 Improved 46,91 Improved BS SWE AREA27 DTS VL % 27 1,819 23% 5,13,428 82% 6,97,68 42% 7,34,959 Improved 5,66,86 Improved 69.4 Improved 3,343,43 Improved Improved 188,79 Improved BS DEU AREA27 PG VL % ,939 1% 4,722,259 1% 6,132,437 1% 6,65,278 Improved 2,49,132 Stable 36.5 Stable 498,16 Deteriorated 7.54 Deteriorated 3,919 Stable BS POL AREA27 DTS VL % 13 3,257 1% 8,52,11 1% 5,687,682 1% 5,746,838 3,89, ,947, ,763 BS DNK AREA27 DTS VL % 38 1,655 15% 5,635,933 14% 5,65,85 14% 5,83,257 Stable 2,797,936 Deteriorated 48. Deteriorated 754,92 Deteriorated Deteriorated 73,98 Deteriorated BS DNK AREA27 DTS VL % % 4,942,875 12% 4,83,794 9% 5,28,545 Stable 2,53,265 Deteriorated 49.8 Deteriorated 1,18,55 Deteriorated Deteriorated 11,568 Deteriorated BS SWE AREA27 DFN VL % ,967 62% 1,66,663 73% 4,99,755 51% 5,177,332 Deteriorated 1,345,7 Deteriorated 26. Deteriorated - 2,214,654 Deteriorated Deteriorated 8,77 Deteriorated BS LTU AREA27 TM VL % % 13,473,514 1% 3,986,462 1% 3,15,96 Stable 1,586,17 Improved 51.1 Improved 1,296,815 Improved Improved 63,441 Improved BS POL AREA27 PG VL % 159 8,127 1% 4,387,27 1% 3,99,94 1% 3,93,172 Improved 2,8,424 Improved 52.9 Deteriorated 421,641 Deteriorated 1.73 Deteriorated 13,84 Deteriorated BS DEU AREA27 DTS VL % 27 1,647 49% 5,5,885 62% 3,574,386 36% 3,879,71 Stable 1,526,24 Deteriorated 39.3 Deteriorated - 452,72 Deteriorated Deteriorated 56,95 Improved BS FIN AREA27 TM VL % 18 1,179 15% 15,632,88 1% 3,23,36 1% 3,27,654 Improved 2,323,477 Improved 71. Improved 1,188,92 Improved Improved 129,82 Improved BS LVA AREA27 TM VL % 27 2,32 1% 9,679,548 1% 3,217,47 1% 4,27,377 Improved 313,519 Deteriorated 7.3 Deteriorated - 658,73 Deteriorated Deteriorated 11,612 Deteriorated BS DNK AREA27 PMP VL % 25 1,784 39% 2,929,997 53% 3,9,759 37% 4,31,784 Improved 1,745,652 Improved 43.3 Stable 262,612 Improved 6.51 Improved 7,34 Improved BS DEU AREA27 DTS VL % 24 2,996 98% 4,98,236 1% 2,97,743 96% 3,381,497 Stable 1,743,43 Stable 51.6 Stable 491,543 Improved Improved 73,842 Improved BS DNK AREA27 PGP VL % 29 4,958 74% 1,566,282 68% 2,922,165 6% 2,639,695 Deteriorated 965,745 Deteriorated 36.6 Deteriorated - 244,57 Improved Improved 33,359 Improved BS POL AREA27 DFN VL % 211 4,76 1% 2,414,164 1% 2,866,442 1% 2,913,52 1,144, , ,423 BS SWE AREA27 DTS VL % 11 1,9 2% 1,27,438 68% 2,735,74 41% 3,21,617 Improved 2,299,179 Improved 76.1 Improved 1,547,67 Improved Improved 22,571 Improved BS SWE AREA27 DFN VL % 58 6,52 62% 1,861,58 65% 2,72,674 42% 3,87,275 Deteriorated 472,953 Deteriorated 15.3 Deteriorated - 643,51 Deteriorated Deteriorated 8,224 Deteriorated BS DEU AREA27 PG VL % 49 6,717 93% 3,22,237 99% 2,662,274 1% 3,31,325 Improved 1,146,215 Improved 37.8 Stable 173,11 Improved 5.71 Improved 23,292 Improved BS LTU AREA27 DTS VL % 138 2,23 1% 2,789,279 1% 2,547,217 1% 3,77,567 Stable 1,62,993 Deteriorated 28.2 Deteriorated 287,452 Deteriorated 7.62 Deteriorated 7,721 Deteriorated BS DNK AREA27 TM VL4XX 6 2% % 1,686,724 5% 2,55,931 2% 2,591,921-41, , ,69 BS DNK AREA27 TM VL % % 6,44,213 34% 2,38,81 33% 2,195,48 1,23, , ,813 Development Trend BS FIN AREA27 TM VL % 15 1,338 12% 8,9,915 1% 1,873,278 1% 2,191,58 Improved 968,512 Improved 44.2 Deteriorated 363,342 Improved Deteriorated 64,567 Deteriorated BS DEU AREA27 DTS VL % % 2,457,685 25% 1,746,793 11% 1,765,24 Deteriorated - 1,48,967 Deteriorated Deteriorated - 1,888,884 Deteriorated -17 Deteriorated - 111,117 Deteriorated BS DNK AREA27 DRB VL % % 1,913,974 42% 1,469,556 31% 1,63,117 Improved 1,9,537 Improved 61.9 Stable 416,179 Improved Improved 138,483 Improved GVA ( ) % 211 Development Trend GVA to revenue (%) % 211 Development Trend Gross Profit ( ) % 211 Development Trend Gross Profit margin (%) % 211 Development Trend GVA per FTE ( ) % 211 Development Trend Data source: Member State data submissions under the DCF 214 Fleet Economic (MARE/A3/AC(214)). 132
134 214 Annual Economic Report on the EU Fishing Fleet Table EU Mediterranean & Black Sea fleet structure and economic performance estimates by MS and fishing activity in 212 Region / Member State N Vessels % 211 Trend FTE (#) % 211 Days at Sea (days) % 211 Landings weight (kg) % 211 Trend % 211 Trend % Trend Revenue ( ) GVA ( ) % 211 Development Trend % Development 211 Trend Med & Black Sea Bulgaria 1,192 Improved 2,872 25,118 7,744,136 Stable 4,283,583 Improved 4,94,982 Stable 771,365 Improved - 669,419 Improved Med & Black Sea Croatia 2,815 Improved ,393 62,285,563 Improved 41,586,456 Improved 37,582,993 Improved 21,562,77 Improved 12,326,999 Improved Med & Black Sea Cyprus 467 Stable 697-1,77,96 Deteriorated 6,71,28 Deteriorated 6,368,258 Deteriorated - 57,725 Improved - 1,921,131 Stable Med & Black Sea France 1,74 Improved ,92 12,279,349 Stable 51,278,822 Improved 7,255,691 Improved 39,253,889 Improved 8,1,612 Deteriorated Med & Black Sea Italy 12,897 Stable 2,691 1,555,75 195,838,525 Deteriorated 925,3,351 Deteriorated 99,981,115 Deteriorated 453,262,331 Deteriorated 232,116,232 Deteriorated Med & Black Sea Malta 776 Improved ,662 2,23,859 Improved 12,672,432 Improved 13,128,335 Improved 5,139,95 Improved 1,165,924 Improved Med & Black Sea Romania 183 Deteriorated 39 3,32 88,79 Improved 928,527 Improved 937,226 Improved 576,737 Improved 259,912 Improved Med & Black Sea Slovenia 88 Stable 63 7, ,22 Deteriorated 1,463,958 Deteriorated 2,314,592 Deteriorated 1,64,695 Improved 318,699 Improved Med & Black Sea Spain 2,48 6,672-78,995, ,29, Med & Black Sea fleet 21,972 32,58 1,894, ,562,437 1,38,983,711 1,44,663, ,663,94 251,697,829 Value of landings ( ) Gross Profit ( ) Data source: Member State data submissions under the DCF 214 Fleet Economic (MARE/A3/AC(214)). Table EU Mediterranean & Black Sea fleet structure and economic performance estimates by MS and fishing activity in 212 Region / MS Fishing activity % 211 Share % N 211 Vessels FTE (#) Days at Sea (days) % 211 Share % 211 Share % 211 Share % Landings Value of 211 weight (kg) landings ( ) Revenue ( ) Development Trend % 211 % Development 211 Trend % Development 211 Trend % Development 211 Trend % Development 211 Trend MBS BGR SSF 934 1% 2,451 14,985 1% 1,822,649 1% 1,23,78 1% 1,352,436 Deteriorated 462, Improved - 226,373 Improved Improved 189 Improved MBS CYP SSF 437 1% ,667 1% 4,381,665 1% 4,39,895 Deteriorated - 44, Deteriorated - 1,36,326 Deteriorated Deteriorated - 72 Deteriorated MBS FRA SSF % ,369 16% 2,476,218 3% 14,779,638 8% 32,681,29 Deteriorated 23,3, Deteriorated 6,624,181 Deteriorated 2.27 Deteriorated 36,919 Deteriorated MBS HRV SSF 1,424 1% ,814 1% 1,37,424 1% 3,133,188 1% 59, , , ,55 MBS ITA SSF 8,638 1% 9,733 1,3,77 1% 31,56,455 1% 241,47,85 1% 241,47,85 Deteriorated 147,161, Deteriorated 82,556,58 Deteriorated Deteriorated 15,12 Deteriorated MBS MLT SSF 7 1% ,199 1% 717,219 1% 4,339,544 1% 4,444,225 Improved 1,336, Improved - 499,376 Improved Improved 5,683 Deteriorated MBS ROU SSF 179 1% 35 3,199 1% 731,338 1% 836,842 1% 845,54 Improved 534, Deteriorated 248,71 Improved Improved 15,322 Stable MBS SVN SSF 67 1% 44 6,237 1% 58,469 1% 512,126 1% 8,69 Stable 54, Stable - 134,54 Deteriorated Deteriorated 11,5 Stable MBS ESP SSF 1,265 7% 1,398 7,73,117 56% 33,522,258 78%.86 MBS BGR LSF 38 1% 421 4,627 1% 5,11,44 1% 2,458,476 1% 2,742,546 Improved 38, Improved - 443,46 Improved Improved 732 Improved MBS CYP LSF 3 1% 85 56,293 1% 2,328,363 1% 2,328,363 Deteriorated - 66, Improved - 56,85 Improved Improved Improved MBS FRA LSF 133 9% ,152 5% 8,568,82 2% 34,629,632 5% 37,574,41 Deteriorated 15,953, Stable 1,476,432 Deteriorated 3.93 Deteriorated 5,874 Stable MBS HRV LSF 1,93 1% ,517 1% 61,43,589 1% 37,796,82 1% 37,4,645 21,44, ,558, ,499 MBS ITA LSF 4,244 1% 1, ,764 1% 164,699,25 1% 682,981,547 1% 682,981,574 Deteriorated 319,8, Deteriorated 156,65,817 Deteriorated Deteriorated 29,35 Deteriorated MBS MLT LSF 71 1% 131 5,349 1% 1,479,55 1% 8,283,439 1% 8,634,661 Improved 3,812, Improved 1,665,3 Improved Improved 29,24 Improved MBS ROU LSF 4 1% % 76,741 1% 91,686 1% 91,686 42, , ,571 MBS SVN LSF 21 1% 19 1,376 1% 27,751 1% 951,832 1% 1,513,92 Deteriorated 1,1, Improved 453,239 Improved Improved 58,752 Improved MBS ESP LSF 1,215 95% 5,445 71,292,629 9% 231,57,294 95% 48.7 GVA ( ) GVA to revenue (%) Gross Profit ( ) Gross profit margin (%) GVA per FTE ( ) Data source: Member State data submissions under the DCF 214 Fleet Economic (MARE/A3/AC(214)). 133
135 EU REGIONAL ANALYSIS Table EU Mediterranean & Black Sea fleet economic performance estimates for top 35 MS fleet segment in 212 Region / MS fleet segment N Vessels % 211 Share FTE (#) % 211 Days at Sea (days) % 211 Share Landings weight (kg) MBS ITA AREA37 PGP VL612 5,872 1% 7,35 761,219 1% 25,552,934 1% 196,675,96 1% 196,675,96 Deteriorated 118,14,978 Deteriorated 6.1 Deteriorated 67,474,82 Deteriorated Stable 16,172 Deteriorated MBS ITA AREA37 DTS VL1218 1,315 1% 3,4 181,66 1% 25,976,99 1% 168,942,777 1% 168,942,84 Deteriorated 75,46,233 Deteriorated 44.6 Deteriorated 36,367,276 Deteriorated Deteriorated 24,85 Deteriorated MBS ITA AREA37 DTS VL % 2,459 14,79 1% 24,336,223 1% 165,997,245 1% 165,997,245 Deteriorated 68,231,67 Deteriorated 41.1 Deteriorated 32,891,468 Deteriorated Deteriorated 27,752 Deteriorated MBS ITA AREA37 DTS VL % 1,299 33,667 1% 9,824,847 1% 87,354,67 1% 87,354,67 Deteriorated 38,652,77 Deteriorated 44.3 Improved 22,588,55 Improved Improved 29,746 Stable MBS ESP AREA37 DTS VL % 1,784 12,274,189 1% 67,277,74 1% MBS ITA AREA37 DRB VL % 33 54,64 1% 21,96,117 1% 51,959,313 1% 51,959,313 Deteriorated 35,98,678 Deteriorated 67.6 Deteriorated 19,14,399 Deteriorated Deteriorated 16,434 Deteriorated MBS ITA AREA37 PGP VL6 2,766 1% 2, ,488 1% 5,53,521 1% 44,794,989 1% 44,794,989 Deteriorated 29,2,33 Deteriorated 64.8 Deteriorated 15,81,76 Deteriorated Deteriorated 11,952 Deteriorated MBS ESP AREA37 DTS VL % 63 6,38,784 1% 4,791,43 1% MBS ITA AREA37 PGP VL % 1,78 48,991 1% 4,39,962 1% 35,435,134 1% 35,435,134 Deteriorated 12,852,483 Deteriorated 36.3 Deteriorated 6,424,241 Deteriorated Deteriorated 11,918 Deteriorated MBS ESP AREA37 PS VL % 892 2,925,247 1% 32,987,556 1% MBS ITA AREA37 TM VL % ,659 1% 25,168,63 1% 31,515,364 1% 31,515,364 Stable 13,668,533 Deteriorated 43.4 Deteriorated 5,289,51 Deteriorated Deteriorated 37,729 Deteriorated MBS ESP AREA37 PGP VL % 96 5,48,216 99% 23,654,34 99% MBS ESP AREA37 PS VL % ,672,752 1% 21,829,43 1% MBS ITA AREA37 PS VL % 259 5,417 1% 1,92,51 1% 21,135,293 1% 21,135,293 Improved 13,321,151 Stable 63. Stable 6,196,911 Stable Deteriorated 51,53 Improved MBS ESP AREA37 PS VL % 251 5,64,394 1% 2,351,287 1% MBS ITA AREA37 HOK VL % ,92 1% 2,27,217 1% 2,36,699 1% 2,36,699 Deteriorated 9,877,892 Deteriorated 49.3 Deteriorated 4,147,152 Deteriorated 2.7 Deteriorated 23,135 Deteriorated MBS ESP AREA37 DTS VL % 333 4,734,811 1% 19,53,35 1% MBS ITA AREA37 PS VL4XX 1 1% 2 1,166,61 1% 15,49,263 1% MBS HRV AREA37 PS VL % 53 7,839 1% 33,744,65 1% 14,719,536 1% 26,374,58 18,98, ,733, ,41 MBS ITA AREA37 PS VL % ,196 1% 5,455,952 1% 14,197,384 1% 14,197,384 5,953, ,444, ,494 MBS FRA AREA37 DTS VL % 111 5,353 1% 4,414,936 1% 13,512,264 1% 15,38,33 3,863, , ,695 MBS ITA AREA37 TM VL % 169 7,719 1% 11,345,265 1% 11,56,233 1% 11,56,233 Improved 6,426,4 Improved 55.9 Improved 3,694,815 Improved Improved 37,961 Stable MBS ITA AREA37 HOK VL % 28 5,475 1% 1,471,143 1% 11,83,41 1% 11,83,41 Deteriorated 4,79,57 Deteriorated 43.2 Deteriorated 2,42,563 Deteriorated Deteriorated 23,46 Deteriorated MBS ITA AREA37 PS VL % 156 3,867 1% 6,116,521 1% 1,714,627 1% 1,714,627 Deteriorated 6,677,664 Deteriorated 62.3 Deteriorated 3,9,68 Deteriorated 28.9 Deteriorated 42,773 Deteriorated MBS ITA AREA37 DTS VL % ,18 1% 1,595,4 1% 1,362,568 1% 1,362,568 Deteriorated 3,878,38 Deteriorated 37.4 Deteriorated 1,14,19 Deteriorated 9.79 Deteriorated 15,977 Deteriorated MBS ESP AREA37 HOK VL % 24 1,582,791 98% 9,394,86 99% MBS FRA AREA37 PS VL % % 719,523 1% 9,341,311 1% 7,29,977 5,357, , ,925 MBS FRA AREA37 DTS VL % 71 4,673 1% 2,332,76 1% 9,7,868 1% 1,363,791 3,42, , ,478 MBS ITA AREA37 TBB VL % 151 3,488 1% 2,395,7 1% 8,464,186 1% 8,464,186 Deteriorated 3,466,884 Deteriorated 41. Deteriorated 1,77,188 Deteriorated 2.17 Deteriorated 22,946 Deteriorated MBS HRV AREA37 PS VL % 24 5,216 1% 17,26,657 1% 7,498,727 1% 4,649,637 2,258, , ,91 MBS ITA AREA37 TM VL % 117 5,225 1% 7,625,87 1% 7,183,93 1% 7,183,93 Improved 3,817,88 Improved 53.1 Stable 1,394,768 Stable Deteriorated 32,712 Deteriorated MBS ESP AREA37 HOK VL % 225 1,55,556 75% 6,84,738 82% % 211 Share Value of landings ( ) % 211 Share Revenue ( ) % 211 GVA to % revenue (%) 211 MBS ITA AREA37 TBB VL % 118 3,667 1% 888,933 1% 5,67,78 1% 5,67,78 Deteriorated 919,9 Deteriorated 18.1 Deteriorated - 128,149 Deteriorated Deteriorated 7,82 Deteriorated MBS HRV AREA37 DTS VL % 14 13,145 1% 2,9,61 1% 4,931,341 1% 814,147 43, , ,184 Development Trend MBS FRA AREA37 DFN VL % ,539 1% 73,978 99% 4,7,52 1% 13,569,863 Deteriorated 9,26,898 Deteriorated 68.3 Deteriorated 2,443,25 Deteriorated 18 Deteriorated 33,977 Deteriorated GVA ( ) % 211 Development Trend Development Trend Gross Profit ( ) % 211 Development Trend Gross Profit margin (%) % 211 Development Trend GVA per FTE ( ) % 211 Development Trend Data source: Member State data submissions under the DCF 214 Fleet Economic (MARE/A3/AC(214)). 134
136 214 Annual Economic Report on the EU Fishing Fleet Table EU North Atlantic fleet economic performance by MS fleets in 212 N % Trend % Days at Sea % Landings weight % Trend Value of % Trend % Trend % Development Gross Profit % Development Region / Member State FTE (#) Revenue ( ) GVA ( ) Vessels (days) 211 (kg) landings ( ) Trend ( ) 211 Trend North Atlantic Belgium 4 Deteriorated 119 5,219 7,663,571 Improved 32,632,29 Improved 34,367,944 Improved 13,834,13 Improved 2,971,32 Improved North Atlantic Denmark 7 Deteriorated ,99,779 Deteriorated 7,276,6 Stable 7,344,998 Improved 3,776,96 Deteriorated 2,634,695 Deteriorated North Atlantic France 2,342 Improved 4, ,41 3,727,553 Improved 654,699,53 Improved 672,799,299 Improved 339,499,571 Improved 93,424,294 Improved North Atlantic Germany 1 Deteriorated 92 1,3 1,257,15 Improved 24,4,788 Stable 24,418,931 Stable 13,493,394 Improved 4,782,264 Improved North Atlantic Ireland 789 Improved 1,511 52, ,44,65 Improved 233,431,628 Improved 237,557,864 Improved 118,296,18 Improved 31,8,344 Improved North Atlantic Lithuania 683 3,276,373 Deteriorated 5,59,995 Improved 35,89,915 Deteriorated 9,93,68 Stable 6,763,587 Improved North Atlantic Netherlands 5,49 86,453,731 Deteriorated 64,314,424 Improved 65,511,24 Improved 25,592,124 Improved 8,71,25 Improved North Atlantic Portugal 3,314 Stable 13,476 37, ,852,59 Deteriorated 358,134,61 Improved 356,645,97 Stable 194,48,213 Deteriorated 67,855,929 Deteriorated North Atlantic Spain - 1,465,3 19,936, North Atlantic UK 1,668 Stable 5, ,414 33,53,679 Improved 492,36,678 Improved 59,19,438 Improved 232,847,23 Improved 19,161,897 Improved North Atlantic fleet 8,17 25,221 1,5,955 1,167,549,978 1,892,245,277 1,943,556, ,291, ,312,293 Data source: Member State data submissions under the DCF 214 Fleet Economic (MARE/A3/AC(214)). Table EU North Atlantic fleet economic performance by MS and fishing activity small-scale (SSF), large-scale (LSF) and distant-water (DWF) fleets in 212 Region / MS Fishing activity % 211 Share % N 211 Vessels FTE (#) Days at Sea (days) % 211 Share % 211 Share % 211 Share % Landings weight Value of landings 211 (kg) ( ) Revenue ( ) Development Trend % 211 % Development 211 Trend % 211 % Development 211 Trend NA FRA SSF 1,278 52% 1, ,631 71% 61,435,791 85% 13,34,711 73% 162,199,467 Stable 11,78, Stable 29,44,591 55,11 Deteriorated NA GBR SSF 1,98 35% 1,21 16,242 49% 24,553,397 55% 62,82,288 54% 66,238,773 Improved 33,912, Deteriorated 11,817,793 33,223 Improved NA IRL SSF 497 1% 35 8,5 1% 5,255,774 1% 5,845,897 1% 6,243,188 Deteriorated - 3,581, Deteriorated - 1,75,969-11,754 Deteriorated NA NLD SSF % 6,423 1% 16,252 1% 2,162-1, ,427-7,43 NA PRT SSF 2,589 1% 7,128 25,759 99% 18,293,854 97% 7,4,186 98% 61,787,564 Deteriorated 4,3, Deteriorated 11,252,123 5,612 Deteriorated NA ESP SSF 2,37 367,578 3% 1,47,55 3% NA BEL LSF 4 35% 119 5,219 32% 7,663,571 35% 32,632,29 43% 34,367,944 Improved 13,834, Improved 2,971,32 116,262 Improved NA DEU LSF 9 3% 92 1,3 3% 1,248,358 15% 24,392,219 17% 24,41,272 Stable 13,493, Improved 4,782, ,19 Improved NA DNK LSF 7 1% % 23,99,779 5% 7,276,6 2% 7,344,998 Improved 3,776, Deteriorated 2,634, ,81 Deteriorated NA FRA LSF 1,63 69% 3, ,391 74% 234,661,119 67% 513,79,183 72% 51,599,832 Stable 238,421, Stable 63,983,73 72,496 Stable NA GBR LSF 57 4% 4, ,171 59% 278,95,281 48% 43,278,389 52% 442,78,665 Improved 198,934, Improved 97,344,13 44,776 Improved NA IRL LSF 245 1% 1,153 37,92 97% 221,961,949 89% 215,784,836 97% 219,493,169 Improved 122,212, Improved 41,84,314 16,34 Improved NA NLD LSF 255 5,457 12% 86,447,38 26% 64,298,172 18% 65,491,78 Improved 25,62, Improved 8,729,677 1,553 Improved NA PRT LSF % 6, ,258 94% 167,217,641 94% 286,651,258 84% 274,27,391 Improved 143,662, Deteriorated 49,295,548 21,47 Stable NA ESP LSF 5, ,11 1% 2,77,64 1% NA LTU DWF % 3,276,373 8% 5,59,995 15% 35,89,915 Deteriorated 9,93, Improved 6,763,587 27,898 Stable NA PRT DWF 8 22% % 341,14 2% 1,82,617 3% 2,831,15 Deteriorated 1,381, Improved 7,38,258 35,72 Deteriorated NA ESP DWF 2,493 9,224,441 2% 16,389,181 2% GVA ( ) GVA to revenue (%) Gross Profit ( ) GVA per FTE ( ) Data source: Member State data submissions under the DCF 214 Fleet Economic (MARE/A3/AC(214)). 135
137 EU REGIONAL ANALYSIS Table 4.1: EU North Atlantic fleet economic performance of the top 35 MS fleet segments in 212 Region / MS fleet segment N Vessels % 211 Share FTE (#) % 211 Days at Sea (days) % 211 Share Landings weight (kg) % 211 Share Value of landings ( ) % 211 Share Revenue ( ) % Development 211 Trend NA GBR AREA27 PS VL4XX 14 44% 157 1,92 48% 136,471,394 47% 144,811,416 58% 146,795,881 Improved 9,253,592 Improved 61.5 Improved 63,346,537 Improved Improved 576,369 Improved NA FRA AREA27 DTS VL % 63 3,79 81% 41,787,63 73% 117,238,36 81% 13,346,649 34,231, ,441, ,755 NA IRL AREA27 TM VL4XX 21 1% 176 1,982 89% 127,931,181 85% 85,88,928 94% 86,775,68 Improved 61,6,183 Improved 7.3 Improved 33,42,635 Improved 38.8 Improved 347,238 Improved NA FRA AREA27 DTS VL % ,674 84% 32,463,115 79% 84,796,889 87% 72,794,339 25,922, ,696, ,317 NA FRA AREA27 DTS VL % ,879 89% 19,15,11 83% 72,356,264 89% 72,511,74 33,924, ,185, ,23 NA PRT AREA27 DTS VL4XX 13 68% 349 2,684 96% 17,395,93 74% 63,384,32 58% 64,98,257 Improved 28,545,981 Improved 44.5 Improved 2,116,864 Improved Improved 81,864 Improved NA IRL AREA27 DTS VL % ,261 99% 22,388,62 96% 48,574,29 1% 5,899,871 Improved 21,458,469 Improved 42.2 Improved 8,812,757 Improved Improved 53,758 Improved NA GBR AREA27 DTS VL % ,43 74% 2,643,628 74% 46,627,653 71% 48,331,125 Improved 19,488,946 Improved 4.3 Improved 7,584,83 Improved Improved 21,251 Improved NA PRT AREA27 DTS VL % ,959 11% 23,76,17 1% 44,187,413 1% 46,164,18 Stable 12,617,18 Deteriorated 27.3 Deteriorated - 424,3 Deteriorated -.92 Deteriorated 22,38 Deteriorated NA GBR AREA27 DTS VL % 46 6,27 35% 17,49,65 27% 43,991,53 33% 45,13,14 Improved 16,413,815 Improved 36.4 Improved 7,138,665 Improved Improved 4,46 Improved NA IRL AREA27 DTS VL % 249 7,89 1% 21,2,987 96% 4,754,611 1% 4,916,39 Improved 15,946,792 Improved 39. Improved 6,872,234 Improved 16.8 Improved 64,85 Improved NA PRT AREA27 PS VL % 943 9,989 1% 51,78,28 1% 4,597,689 1% 39,336,669 3,766, ,989, ,641 NA NLD AREA27 TM VL4XX % 76,859,838 3% 35,8,969 33% 36,76,334 Deteriorated 13,72,928 Deteriorated 35.6 Improved 2,716,373 Deteriorated 7.39 Improved 15,299 Improved NA GBR AREA27 DTS VL % ,972 44% 12,983,27 31% 35,31,5 34% 37,472,958 Improved 8,488,88 Improved 22.7 Improved - 128,754 Improved -.34 Improved 12,8 Improved NA GBR AREA27 FPO VL % ,889 46% 13,244,697 52% 34,286,615 51% 36,618,73 Improved 18,3,451 Deteriorated 49.2 Deteriorated 5,121,39 Deteriorated Deteriorated 33,44 Stable NA FRA AREA27 DFN VL % ,253 86% 6,548,929 87% 33,141,484 87% 3,868,714 Stable 18,191,697 Stable 58.9 Stable 4,84,929 Stable Stable 73,725 Deteriorated NA FRA AREA27 DTS VL % ,494 83% 9,87,676 77% 31,679,658 82% 3,742,866 14,581, ,135, ,462 NA FRA AREA27 DFN VL % 27 17,32 58% 7,156,67 64% 29,993,267 59% 32,46,458 Improved 19,172,453 Improved 59.2 Stable 5,317,366 Stable Stable 71,112 Improved NA FRA AREA27 DFN VL % 273 4,577 1% 12,391,222 1% 28,711,524 1% 39,226,627 25,113, ,549, ,34 NA BEL AREA27 TBB VL % 13 4,416 55% 6,532,93 44% 28,492,659 55% 29,815,346 Improved 11,28,313 Improved 37.8 Stable 1,721,233 Improved 5.77 Stable 19,475 Improved NA FRA AREA27 DFN VL % 243 7,548 95% 6,881,64 97% 28,169,724 97% 36,942,269 22,413, ,771, ,165 NA PRT AREA27 PGP VL1 1,193 1% 2,415 89,864 1% 6,266,34 1% 26,185,527 1% 27,672,93 Deteriorated 19,13,761 Deteriorated 69. Deteriorated 7,2,796 Deteriorated Deteriorated 7,91 Improved NA FRA AREA27 TM VL % 16 5,13 89% 9,858,826 77% 23,6,216 88% 22,429,774 Improved 9,898,964 Improved 44.1 Improved 2,182,6 Improved 9.73 Improved 93,625 Deteriorated NA DEU AREA27 DTS VL4XX 5 38% % 9,742,265 38% 22,651,133 52% 22,651,312 Improved 13,11,18 Improved 57.8 Stable 5,654,94 Improved Improved 2,415 Improved NA IRL AREA27 TM VL % 112 1,867 96% 35,233,429 96% 2,686,41 98% 2,862,869 Improved 11,356,58 Improved 54.4 Improved - 12,543,857 Deteriorated Deteriorated 11,493 Improved NA FRA AREA27 PS VL % 144 4,223 1% 2,255,222 1% 2,39,29 1% 19,624,245 14,391, ,47, ,792 NA GBR AREA27 DRB VL % 32 9,259 87% 15,85,124 93% 19,767,399 91% 2,297,639 Improved 9,857,243 Improved 48.6 Stable 4,447,582 Improved Stable 32,634 Stable NA FRA AREA27 HOK VL % ,189 88% 2,81,334 9% 18,593,97 9% 19,262,878 12,443, ,17, ,17 NA PRT AREA27 PS VL % 416 3,29 1% 18,714,487 1% 17,93,9 1% 18,979,41 12,311, , ,594 NA FRA AREA27 FPO VL % ,643 84% 6,21,87 78% 17,588,32 8% 21,894,362 Deteriorated 13,794,57 Deteriorated 63. Stable 4,44,549 Deteriorated Stable 57,85 Stable NA GBR AREA27 TBB VL % 279 4,23 7% 5,76,849 38% 17,79,713 48% 17,341,14 Stable - 6,828,236 Deteriorated Deteriorated - 12,882,291 Deteriorated Deteriorated - 24,467 Deteriorated NA FRA AREA27 DFN VL % 22 31,441 85% 3,36,46 75% 16,528,271 78% 17,562,315 Deteriorated 1,56,891 Deteriorated 6.1 Stable 2,83,438 Improved Improved 52,238 Improved NA PRT AREA27 PMP VL % 341 2,542 87% 6,51,783 99% 15,929,325 99% 2,727, , ,67, ,613 NA GBR AREA27 TBB VL % 177 4,314 96% 4,96,944 97% 15,51,817 96% 16,98,386 Improved 7,4,16 Improved 43.7 Improved 3,21,22 Improved Improved 39,71 Improved NA NLD AREA27 TBB VL4XX 1,122 1% 4,847,928 13% 15,72,772 13% 15,118,633 8,192, ,551, ,722 GVA ( ) % Development 211 Trend GVA to revenue (%) % 211 Development Trend Gross Profit ( ) % 211 Development Trend Gross Profit margin (%) % 211 Development Trend GVA per FTE ( ) % 211 Development Trend Data source: Member State data submissions under the DCF 214 Fleet Economic (MARE/A3/AC(214)). 136
138 214 Annual Economic Report on the EU Fishing Fleet Table 4.11 EU North Sea and Eastern Arctic fleet structure, landings and revenue by MS in 212 N % Trend 28- % Days at % Landings weight % Trend 28- Value of % Trend 28- % Trend 28- % Development Gross Profit % Development Region / Member State FTE (#) Revenue ( ) GVA ( ) Vessels Sea (days) 211 (kg) landings ( ) Trend ( ) 211 Trend North Sea Belgium 75 Deteriorated ,242 14,23,234 Stable 43,718,426 Deteriorated 46,18,217 Deteriorated 15,975,6 Deteriorated 73,554 Deteriorated North Sea Denmark 1,23 Deteriorated 1,195 75,7 413,132,117 Deteriorated 327,57,567 Improved 333,284,111 Improved 219,92,828 Improved 133,18,181 Improved North Sea France 555 1,28 83,1 111,86,982 Improved 196,258,827 Improved 2,962,595 Improved 95,578,716 Improved 27,446,261 Improved North Sea Germany 247 Deteriorated ,229 45,527,118 Deteriorated 17,75,273 Improved 16,255,329 Improved 54,331,153 Improved 2,921,847 Improved North Sea Ireland - 1,24 27,245,589 Improved 7,84,99 Deteriorated 7,931,439 Deteriorated 3,862,4 Deteriorated 98,547 Deteriorated North Sea Lithuania ,143,179 Improved 3,88,323 Improved 35,89,915 Deteriorated 9,93,68 Stable 6,763,587 Improved North Sea Netherlands 558 Stable 1,27 41,948 12,683,836 Deteriorated 24,95,596 Deteriorated 244,253,28 Deteriorated 96,53,191 Deteriorated 34,997,326 Deteriorated North Sea Portugal 4 Deteriorated ,72,216 Stable 45,387,591 Improved 45,886,647 Improved 4,376,39 Improved 34,342,75 Improved North Sea Spain , North Sea Sweden 494 Deteriorated ,457 47,46,669 Deteriorated 73,17,186 Improved 76,73,45 Improved 34,156,771 Deteriorated 16,967,15 Deteriorated North Sea United Kingdom 2,95 Stable 4, ,452 36,466,132 Improved 436,3,765 Stable 45,948,675 Improved 21,56,786 Deteriorated 95,57,556 Deteriorated North Sea fleet 5,861 9, ,18 1,93,768,32 1,48,399,652 1,547,54, ,96, ,224,953 Data source: Member State data submissions under the DCF 214 Fleet Economic (MARE/A3/AC(214)). Table 4.12 EU North Sea and Eastern Arctic fleet economic performance estimates by MS and fishing activity Small-scale (SSF) and Large-scale (LSF) in 212 Fishing N % activity 211 Share % Days at % Share Landings % 211 Share Value of % 211 Share % Development Region / MS FTE (#) Revenue ( ) GVA ( ) Vessels Sea (days) weight (kg) landings ( ) 211 Trend % 211 % Development 211 Trend % Development 211 Trend % Development 211 Trend NS DEU SSF 8 1% % 31,83 % 11,74 % 12,356 Deteriorated - 134, Deteriorated - 138,48 Deteriorated - 33,84 Deteriorated NS DNK SSF 68 55% ,2 44% 5,646,135 5% 12,381,51 51% 14,7,22 Improved 7,922, Stable 781,377 Improved 71,525 Improved NS FRA SSF 225 9% ,454 13% 8,267,16 11% 34,68,389 19% 37,566,36 Stable 23,44, Stable 7,181,427 Deteriorated 72,436 Stable NS GBR SSF 2,75 65% 1,12 19,686 51% 2,76,13 45% 53,695,471 46% 57,588,427 Improved 24,871, Deteriorated 5,533,38 Improved 24,586 Improved NS NLD SSF 199 1% 115 2,57 99% 446,262 99% 3,62,616 99% 3,799,41 Deteriorated 1,467, Deteriorated - 176,252 Deteriorated 12,734 Deteriorated NS SWE SSF 32 41% ,67 38% 1,634,179 32% 7,76,125 53% 9,285,376 Improved 5,332, Deteriorated 327,589 Deteriorated 41,279 Improved NS BEL LSF 75 65% ,242 68% 14,23,234 65% 43,718,426 57% 46,18,217 Deteriorated 15,975, Deteriorated 73,554 Deteriorated 74,299 Deteriorated NS DEU LSF % ,681 81% 45,495,288 65% 17,64,199 76% 16,242,973 Improved 54,465, Improved 21,6,327 Improved 12,478 Improved NS DNK LSF % 1,85 53,87 81% 47,485,982 84% 314,676,517 89% 319,213,99 Improved 211,98, Stable 132,236,84 Improved 195,428 Improved NS FRA LSF % 96 53,396 2% 13,32,9 3% 16,845,894 22% 163,396,235 Stable 72,173, Deteriorated 2,264,834 Deteriorated 75,193 Deteriorated NS GBR LSF 83 59% 3,286 75,766 4% 286,39,2 5% 382,38,293 46% 393,36,248 Stable 176,635, Deteriorated 89,524,518 Deteriorated 53,756 Stable NS IRL LSF % 27,134,9 11% 7,86,219 3% 7,896,668 Deteriorated 3,862, Deteriorated 98,547 Deteriorated 99,546 Deteriorated NS NLD LSF 359 1% 1,155 39,441 85% 12,237,574 36% 237,887,98 67% 24,453,797 Deteriorated 95,36, Deteriorated 35,173,578 Deteriorated 82,293 Improved NS PRT LSF 4 1% % 6,67,56 3% 45,375,554 13% 45,886,647 Improved 4,376, Stable 34,342,75 Improved 747,18 Improved NS SWE LSF % 37 18,787 63% 45,772,49 35% 65,311,62 6% 66,787,669 Stable 28,823, Deteriorated 16,639,426 Deteriorated 77,915 Deteriorated NS LTU DWF % 1,143,179 3% 3,88,323 9% 35,89,915 Deteriorated 9,93, Improved 6,763,587 Improved 27,898 Stable GVA to revenue (%) Gross Profit ( ) GVA per FTE ( ) Data source: Member State data submissions under the DCF 214 Fleet Economic (MARE/A3/AC(214)). 137
139 EU REGIONAL ANALYSIS Table 4.13 EU North Sea and Eastern Arctic fleet economic performance estimates for top 35 MS fleet segments in 212 Region / MS fleet segment N Vessels % 211 Share FTE (#) % 211 Days at Sea (days) % 211 Share Landings weight (kg) % 211 Share Value of landings ( ) % 211 Share Revenue ( ) % Development 211 Trend NS DNK AREA27 TM VL4XX 17 57% 1 1,911 77% 184,878,174 87% 116,934,423 93% 12,947, 99,914, ,753, ,66 NS GBR AREA27 PS VL4XX 16 5% 155 1,82 48% 147,449,372 51% 13,849,753 41% 15,272,888 Improved 49,239,62 Deteriorated 46.8 Deteriorated 29,943,551 Deteriorated Deteriorated 317,36 Deteriorated NS NLD AREA27 TBB VL4XX 64 1% 336 1,35 9% 31,944,538 87% 1,471,894 87% 1,777,596 Deteriorated 37,177,92 Deteriorated 36.9 Deteriorated 19,574,372 Deteriorated Deteriorated 11,57 Deteriorated NS GBR AREA27 DTS VL % ,622 65% 47,158,383 73% 88,641,282 67% 9,936,526 Improved 37,164,969 Improved 4.9 Stable 18,475,686 Improved 2.32 Stable 48,86 Improved NS GBR AREA27 DTS VL % ,291 56% 29,411,232 69% 69,468,84 66% 73,723,428 Deteriorated 37,323,23 Deteriorated 5.6 Stable 2,369,7 Deteriorated Improved 44,811 Improved NS NLD AREA27 TBB VL % ,786 9% 15,351,269 91% 54,92,531 92% 55,876,731 Improved 26,987,631 Improved 48.3 Improved 6,89,852 Improved Improved 61,976 Improved NS DNK AREA27 DTS VL % 219 7,733 91% 37,331,61 88% 5,329,72 91% 52,684,437 Stable 28,213,39 Stable 53.6 Stable 14,349,934 Improved Improved 128,587 Improved NS PRT AREA27 DTS VL4XX 4 21% % 6,67,56 26% 45,375,554 42% 45,886,647 Improved 4,376,39 Improved 88. Stable 34,342,75 Improved Improved 747,18 Improved NS SWE AREA27 DTS VL % 15 4,368 58% 4,964,419 38% 39,45,187 63% 39,668,998 Stable 19,593,279 Deteriorated 49.4 Deteriorated 13,43,237 Deteriorated Deteriorated 13,735 Deteriorated NS DNK AREA27 DTS VL % 216 9,45 85% 33,931,95 86% 36,165,45 86% 37,313,654 Deteriorated 19,999,72 Deteriorated 53.6 Deteriorated 6,923,767 Deteriorated Deteriorated 92,597 Stable NS DNK AREA27 DTS VL4XX 12 92% 6 1,788 96% 79,855,135 92% 35,657,815 95% 32,538,483 Deteriorated 22,182,367 Deteriorated 68.2 Deteriorated 15,16,127 Deteriorated Deteriorated 372,125 Deteriorated NS GBR AREA27 FPO VL % ,893 54% 12,352,637 48% 32,984,313 49% 35,227,215 Improved 13,651,442 Improved 38.8 Deteriorated 1,258,678 Deteriorated 3.57 Deteriorated 21,853 Deteriorated NS DEU AREA27 TBB VL % ,711 1% 8,993,917 99% 31,37,486 1% 3,64,214 Improved 19,81,778 Improved 64.7 Improved 9,989,512 Improved 32.6 Improved 122,728 Improved NS FRA AREA27 DRB VL % ,161 83% 13,41,271 79% 3,44,959 87% 33,936,398 15,995, ,373, ,445 NS FRA AREA27 DTS VL4XX 7 7% 92 1,595 65% 19,38,41 73% 3,27,184 67% 26,657,215 Improved 9,915,22 Improved 37.2 Improved 2,148,486 Improved 8.6 Improved 17,238 Improved NS FRA AREA27 DTS VL % 144 7,326 19% 15,624,664 27% 27,875,773 19% 24,572,752 8,127, ,281, ,629 NS DNK AREA27 DTS VL % 17 13,632 73% 12,9,261 5% 25,456,957 72% 23,711,819 Deteriorated 12,94,296 Deteriorated 51. Deteriorated 2,631,656 Deteriorated 11.1 Deteriorated 71,164 Deteriorated NS NLD AREA27 TBB VL % 135 4,2 92% 8,587,36 94% 25,,53 94% 25,16,226 Stable 8,339,945 Deteriorated 33.2 Stable 1,178,41 Deteriorated 4.69 Deteriorated 61,695 Improved NS BEL AREA27 TBB VL % 84 3,598 45% 8,259,912 56% 23,761,661 45% 24,864,725 Deteriorated 9,763,39 Deteriorated 39.3 Deteriorated 1,791,175 Deteriorated 7.2 Deteriorated 116,282 Stable NS DEU AREA27 TBB VL % 125 9,69 99% 6,66,341 98% 23,585,58 99% 22,382,841 Improved 12,715,56 Improved 56.8 Improved 6,7,227 Improved Improved 11,659 Improved NS GBR AREA27 DTS VL4XX 1 8% 19 1,834 77% 19,324,443 72% 21,392,741 62% 21,625,456 Deteriorated 4,143,1 Deteriorated 19.2 Deteriorated 319,815 Deteriorated 1.48 Deteriorated 21,762 Deteriorated NS NLD AREA27 DTS VL % 84 3,71 77% 8,376,374 79% 2,915,854 78% 21,3,358 Improved 8,117,944 Deteriorated 38.6 Deteriorated 3,142,44 Deteriorated Deteriorated 96,196 Improved NS DEU AREA27 DTS VL4XX 7 54% 1 1,163 6% 15,854,21 62% 2,849,826 48% 2,849,991 Stable 6,235,665 Deteriorated 29.9 Deteriorated - 618,387 Deteriorated Deteriorated 62,338 Deteriorated NS FRA AREA27 DFN VL % ,18 42% 3,957,569 36% 2,692,439 41% 22,357,36 Improved 12,949,27 Stable 57.9 Deteriorated 3,39,544 Deteriorated Deteriorated 67,56 Stable NS NLD AREA27 TM VL4XX 13 1% % 49,912,49 2% 18,996,61 18% 19,55,12 Deteriorated 5,171,38 Deteriorated 26.5 Stable - 324,169 Deteriorated Deteriorated 68,828 Improved NS GBR AREA27 DTS VL % 316 9,99 26% 7,44,48 26% 18,75,41 29% 19,388,42 Stable 9,448,393 Deteriorated 48.7 Deteriorated 4,672,665 Deteriorated 24.1 Deteriorated 29,894 Stable NS GBR AREA27 TBB VL % 118 1,783 3% 9,419,353 62% 18,581,64 52% 18,866,55 Stable 8,678,349 Deteriorated 46. Deteriorated 2,91,923 Deteriorated 11.9 Deteriorated 73,77 Deteriorated NS DEU AREA27 DTS VL % 28 1,442 69% 7,481,417 75% 14,273,977 89% 14,424,721 Stable 7,339,262 Improved 5.9 Improved 3,417,6 Improved Improved 259,155 Improved NS GBR AREA27 DRB VL % 16 2,529 43% 7,99,929 33% 13,932,797 5% 14,148,29 Improved 8,16,745 Improved 57.7 Stable 4,871,842 Improved Stable 51,46 Deteriorated NS FRA AREA27 DTS VL % 61 3,52 16% 8,869,847 21% 12,461,98 13% 1,698,53 1,571, ,253, ,64 NS BEL AREA27 TBB VL % 73 4,693 96% 3,244,746 96% 11,612,45 94% 11,984,974 Deteriorated 3,59,39 Deteriorated 3. Deteriorated - 37,85 Deteriorated Deteriorated 49,325 Deteriorated NS SWE AREA27 DTS VL % 82 3,828 52% 2,997,153 19% 11,62,71 53% 11,846,346 Improved 4,442,17 Deteriorated 37.5 Deteriorated 2,94,5 Deteriorated Deteriorated 54,39 Deteriorated NS DNK AREA27 PGP VL % 68 4,35 84% 3,938,4 93% 1,551,145 94% 9,667,432 Deteriorated 6,54,874 Deteriorated 62.6 Stable 1,928,291 Deteriorated Improved 88,56 Improved NS FRA AREA27 DRB VL % 69 5,557 52% 4,31,48 36% 1,186,398 61% 1,169,59 6,55, ,387, ,548 NS DNK AREA27 PMP VL % 66 2,424 1% 3,473,481 1% 9,892,179 1% 1,53,647 Deteriorated 6,48,959 Deteriorated 6.2 Stable 2,318,98 Stable 23.7 Improved 92,41 Stable GVA ( ) % Development 211 Trend GVA to revenue (%) % Development 211 Trend Gross Profit ( ) % Development 211 Trend Gross Profit margin (%) % Development 211 Trend GVA per FTE ( ) % Development 211 Trend Data source: Member State data submissions under the DCF 214 Fleet Economic (MARE/A3/AC(214)). 138
140 214 Annual Economic Report on the EU Fishing Fleet Table EU OFR fleet structure and economic performance estimates by MS in 212 (REGIONAL_LEVEL ANALYSIS) N % Trend 28- % Days at % Landings % Trend 28- Value of % Trend 28- % Trend 28- % Development Gross Profit % Development Region / Member State FTE (#) Revenue ( ) GVA ( ) Vessels Sea (days) 211 weight (kg) landings ( ) Trend ( ) 211 Trend Other Regions France 1,232 Improved 435-8,464,174 Improved 156,953,936 Improved - Deteriorated - Deteriorated - Deteriorated Other Regions Italy - Deteriorated , Deteriorated 4,445,31 Deteriorated 6,524,191 Deteriorated 5,219,198 Deteriorated 4,888,37 Stable Other Regions Lithuania 1 Stable 355 1,445 37,249,163 Deteriorated 25,27,699 Deteriorated 35,89,915 Deteriorated 9,93,68 Stable 6,763,587 Improved Other Regions Netherlands - 1, ,83,68 Improved 53,72,197 Improved 54,494,383 Improved 8,184,253 Deteriorated - 7,168,548 Deteriorated Other Regions Poland 2 Deteriorated ,788,163 Stable Other Regions Portugal 85 Improved ,611 18,7,626 Deteriorated 48,16,768 Deteriorated 51,335,676 Stable 25,358,194 Stable 14,71,93 Improved Other Regions Spain 868 6, ,593,64 94,859, Other Regions United Kingdom 9 Deteriorated 17 1,175 1,498,94 Deteriorated 11,796,2 Improved 11,958,299 Improved 1,359,972 Improved - 789,25 Improved OFR fleet 2,26 8,584 2,38 78,41,352 1,24,54,661 16,23,463 5,25,297 18,44,297 Data source: Member State data submissions under the DCF 214 Fleet Economic (MARE/A3/AC(214)). Table EU OFR fleet structure and economic performance estimates by MS and fishing activity in 212 (REGIONAL_LEVEL ANALYSIS) Region / MS Fishing activity % 211 Share % N 211 Vessels FTE (#) Days at Sea (days) % 211 Share % 211 Share % 211 Share % Landings Value of 211 weight (kg) landings ( ) Revenue ( ) OFR FRA SSF 2,79 % 15,468 % Development Trend % 211 % Development 211 Trend OFR IRL SSF % 211 % Development 211 Trend OFR PRT SSF 2,95 1% 558,979 3% 1,121,495 2% 886,371 Deteriorated 311, Deteriorated - 13,897 1,945 Deteriorated OFR ESP SSF 536 3% 1,45 5,744,996 42% 7,959,191 19% OFR FRA LSF 22 1% 32 1,426,663 % 6,889,168 1% OFR GBR LSF 9 1% 17 1,175 1% 1,498,94 2% 11,796,2 1% 11,958,299 Improved 1,359, Improved - 789,25 12,674 Improved OFR IRL LSF OFR NLD LSF 1,366 3% 127,83,68 38% 53,72,197 15% 54,494,383 Improved 8,184, Deteriorated - 7,168,548 33,719 Deteriorated OFR PRT LSF 56 7% 387 6,385 5% 3,925,748 2% 1,251,2 3% 12,885,657 Deteriorated 7,356, Deteriorated 2,226,598 19,5 Deteriorated OFR ESP LSF 68 5% 3,52 7,227,971 9% 9,893,23 4% OFR FRA DWF 18 1% ,525,154 1% 148,118,341 1% OFR ITA DWF 331 1% 944, 1% 4,445,31 1% 6,524,191 Deteriorated 5,219, Improved 4,888,37 21,197 Improved OFR LTU DWF 1 1% 355 1,445 59% 37,249,163 89% 25,27,699 76% 35,89,915 Deteriorated 9,93, Improved 6,763,587 27,898 Stable OFR PRT DWF 29 78% 457 6,321 93% 13,585,899 98% 36,734,73 97% 37,563,648 Improved 17,69, Improved 12,614,392 38,79 Stable OFR ESP DWF 264 1% 5, ,62,97 98% 923,7,328 98% GVA ( ) GVA to revenue (%) Gross Profit ( ) GVA per FTE ( ) Data source: Member State data submissions under the DCF 214 Fleet Economic (MARE/A3/AC(214)). 139
141 EU REGIONAL ANALYSIS Table EU OFR fleet structure and economic performance estimates of the top 25 MS Fleet Segment in terms of revenue in 212 (REGIONAL_LEVEL ANALYSIS) Region / MS fleet segment N Vessels % 211 Share FTE (#) % 211 Days at Sea (days) % 211 Share Landings weight (kg) OFR ESP OFR PS VL4XX 32 1% 1, ,448,72 1% 422,196,839 1% OFR ESP OFR DTS VL4XX 35 1% ,779,984 99% 263,156,328 99% OFR FRA OFR PS VL4XX 18 1% ,525,154 1% 148,118,341 1% Improved Improved Improved Improved Improved Improved OFR ESP OFR HOK VL % 1,581 66,775,629 89% 11,41,695 89% OFR ESP OFR DTS VL % ,882,619 1% 73,416,11 1% OFR ESP OFR HOK VL4XX 3 1% 1,13 2,733,145 1% 53,827,455 1% OFR NLD AREA27 TM VL4XX 1,366 55% 127,83,68 5% 53,72,197 49% 54,494,383 Improved 8,184,253 Deteriorated 15. Deteriorated - 7,168,548 Deteriorated Deteriorated 33,719 Deteriorated OFR LTU OFR TM VL4XX 1 1% 355 1,445 59% 37,249,163 89% 25,27,699 76% 35,89,915 Deteriorated 9,93,68 Stable 27.6 Improved 6,763,587 Improved Improved 27,898 Stable OFR PRT OFR HOK VL % 296 3,751 91% 7,551,137 96% 17,8,16 94% 2,831,15 Deteriorated 1,381,389 Improved 49.8 Improved 7,38,258 Improved 35.8 Improved 35,72 Deteriorated OFR PRT OFR HOK VL4XX 5 1% 8 1,529 14% 5,64,113 1% 14,465,64 1% 11,773,262 Improved 7,473,467 Improved 63.5 Improved 6,484,447 Improved 55.8 Improved 93,418 Improved OFR GBR AREA27 DTS VL4XX 4 33% % 5,594,77 21% 9,124,175 26% 9,223,43 Improved 6,659,545 Improved 72.2 Improved 5,28,883 Improved Improved 238,522 Improved OFR PRT OFR HOK VL1218 3,474 1% 2,213,952 1% 5,95,92 1% 7,249,925 Deteriorated 4,65,768 Deteriorated 64.2 Deteriorated 1,537,348 Deteriorated Deteriorated 22,687 Stable OFR ESP OFR PGP VL % 671 3,541,78 92% 5,581,46 82% OFR PRT OFR DTS VL % 81 1,41 13% 97,649 1% 4,468,993 1% 4,959, , ,178, ,35 OFR ITA OFR DTS VL4XX 331 1% 944, 1% 4,445,31 1% 6,524,191 Deteriorated 5,219,198 Deteriorated 8. Improved 4,888,37 Deteriorated Improved 21,197 Improved OFR FRA OFR HOK VL % 5 865,195 1% 4,186,626 1% OFR ESP OFR HOK VL % 12 2,357,123 8% 3,811,138 81% OFR ESP OFR HOK VL % 94 2,954,637 1% 3,659,363 1% OFR FRA OFR HOK VL % ,243 1% 2,56,517 1% OFR GBR AREA27 PS VL4XX 2 6% % 4,721,28 2% 2,365,847 1% 2,398,268 Deteriorated - 2,883,542 Deteriorated Deteriorated - 3,323,134 Stable Deteriorated - 197,98 Improved OFR ESP OFR HOK VL % 49 1,513,51 1% 1,555,227 96% OFR PRT AREA27 HOK VL % % 36,534 8% 1,319,42 1% 1,412,223 Deteriorated 764,33 Deteriorated 54.1 Deteriorated 164,42 Deteriorated Deteriorated 28,919 Stable OFR ESP OFR PS VL % 91 1,546,385 1% 1,294,67 1% OFR FRA OFR HOK VL % - 287,899 1% 1,18,98 1% OFR PRT AREA27 HOK VL % % 242,38 5% 982,126 9% 1,133,572 Deteriorated - 171,637 Deteriorated Deteriorated - 51,286 Deteriorated Deteriorated - 6,65 Deteriorated OFR ESP OFR PGP VL % , 1% 8,611 1% OFR PRT OFR HOK VL1 2,329 1% 391,24 1% 767,27 1% 48,87 16, , OFR PRT OFR HOK VL % 45,275 1% 757,195 1% 1,875,627 Deteriorated 1,363,458 Deteriorated 72.7 Improved 994,75 Stable 53.3 Improved 32,463 Improved OFR PRT OFR MGP VL % 526,138 1% 729,342 1% 74, , , ,412 OFR ESP AREA37 HOK VL ,863 13% 723,8 9% OFR PRT OFR MGP VL % 16,718 1% 375,151 1% 326,338 Deteriorated 231,332 Deteriorated 7.9 Stable 28,27 Deteriorated 8.64 Deteriorated 5,932 Deteriorated OFR PRT OFR HOK VL % 165,846 1% 343,197 1% 399, , , ,97 OFR ESP OFR FPO VL % 4 16,167 1% 333,769 1% OFR FRA OFR HOK VL % - 7,293 1% 321,916 1% % 211 Share Value of landings ( ) % 211 Share Revenue ( ) % Development 211 Trend OFR GBR AREA27 HOK VL % % 118,121 2% 168,835 1% 195,94 Deteriorated - 2,52,85 Deteriorated Deteriorated - 2,57,92 Deteriorated Deteriorated - 39,235 Deteriorated GVA ( ) % Development 211 Trend GVA to revenue (%) % Development 211 Trend Gross Profit ( ) % Development 211 Trend Gross Profit margin (%) % Development 211 Trend GVA per FTE ( ) % Development 211 Trend Data source: Member State data submissions under the DCF 214 Fleet Economic (MARE/A3/AC(214)). 14
142 214 Annual Economic Report on the EU Fishing Fleet Table 4.6 Fisheries Agreements Country Period Fishing opportunities Cape-Verde Comoros Ivory Coast Gabon Kiribati Madagascar Tuna: 25 seiners 48 surface longliners 11 pole-and-line Reference tonnage Total EU finance 5, tonnes 385, Main EU fleets involved ESP, PRT, FRA t./year 435, Tuna: 6, tonnes 39, 4 seiners, 17 surface longliners ESP, FRA, PRT t./year 6, Tuna: 7, tonnes 595, EU vessels 25 seiners, mainly from 15 surface longliners ESP, FRA and ,5 t./year 68, / year PRT Tuna: 11, tonnes 86, 24 seiners, 16 surface longliners ESP and FRA , t./year 1,325, Tuna: 6,4 tonnes 478,4 4 seiners, 12 longliners ESP, FRA, PRT , t./year 1,325,/year Tuna: 13,3 tonnes 1,197, 43 seiners, 5 longliners (> 1 GT), 26 longliners (< 1 ESP, FRA, PRT GT), 5 demersal History and Current status of agreement First partnership agreement 199; Renewed First partnership agreement 1988; Tacitly renewed for a period of 7 years First partnership agreement 199; Tacitly renewed for a period of 6 years First partnership agreement 1998; Tacitly renewed for a period of 6 years First partnership agreement 23; Renewed, 6 years First partnership agreement 1986; Renewed, 2 years Mauritius Mauritania , t./year 1,525,/year ,5 t./year 66,/year Tuna: 22 seiners, 22 surface longliners and pole-and-liners; 86,, (1st year) 76,, (2nd year) 73,, (3rd year) 7,, (4th year) ESP, FRA, PRT, ITA and UK New partnership agreement 212; 6 years, renewable for 3 years various crustaceans and demersal species Mozambique Solomon Islands Sao Tomé e Principe Seychelles Micronesia Tuna: 44 purse seiners, 45 longliners 1, tonnes , t./year 98, Tuna: 6, tonnes 4, 4 seiners 1 longliners No protocol in force since 9 October Tuna: 8,5 tonnes seiners, 18 longliners , t./year 71,/year (3years) 675, (4 th year) Tuna: 63, tonnes seiners, 12 longliners , t./year 1 st 2 nd years: 5,53,/year 3 rd to 6 th years: 5,,/year Tuna: 8,6 tonnes seiners, 12 longliners ESP, FRA, PRT, ITA, UK ESP, FRA and PRT ESP, PRT, ITA, FRA EU and Senegal agree new sustainable fisheries partnership (25/4/214) First partnership agreement 1987; Renewed, 3 years Agreement tacitly renewed for the period ; First partnership agreement 1984; Tacitly renewed for a period of 4 years; First partnership agreement 1987; Renewed for a period of 6 years 141
143 EU REGIONAL ANALYSIS Table 4.6 Mixed fisheries agreements Country Period Fishing opportunities Total EU finance History and Current status of agreement Greenland Guinea Conakry Cod: 3 5 t, redfish: 8 t, Greenland halibut: 1 t, shrimp: 11 t, Atlantic halibut: 1 4 t, capelin: 55 t, snowcrab: 5 t, by-catches: 2 3 t Cod: 2,2 t Pelagic redfish: 3, t Demersal redfish: 2, t Greenland halibut - west: 2,5 t Greenland halibut - east: 4,315 t Shrimp - west: 3,4 t Shrimp - east: 7,5 t Atlantic halibut - west: 2 t Atlantic halibut - east: 2 t capelin: 6, t snowcrab: 25 t Grenadier west: 1 t Grenadier east: 1 t TOTAL: 85,765 t grt/month for fish and cephalopods, 1 5 grt/month for shrimps; tuna: 34 seiners, 14 pole-and-line vessels, 9 longliners The first fisheries agreement concluded between the EU and Greenland which dates back to 1985 was concluded for an initial period of ten years and thereafter extended for additional six-year periods until it was replaced by the fisheries partnership agreements. The first fisheries agreement was implemented by successive protocols. 15,14, This may be increased gradually to 3,995, depending on fishing possibilities Guinea- Bissau grt for shrimps and 4 4 grt for fish and cephalopods; tuna: 23 seiners, 14 pole-and-line vessels small-scale pelagic seiners North, 3 small-scale longliners North, 2 small-scale fishing south, 22 demersal fishing, 27 tuna pole-and-liners, 6 tonnes small pelagics (max 18 vessels) 7,5, First partnership agreement 198; There is currently no protocol in force. EU vessels are not allowed to fish in the EEZ of Guinea-Bissau 36,1, First partnership agreement 1995; Morocco Mauritania Provisionally applied until New protocol signed on 18 Nov 213 Tuna: 22 seiners, 22 surface longliners and pole-and-liners; various crustaceans and demersal species 3 million/year the parties did not reach an agreement to renew the protocol in 1999 and there was no agreement until the current Fisheries Partnership Agreement came into force in February 27. Will enter into force when Morocco will have completed its ratification The current Fisheries Partnership Agreement between the EU and Morocco entered into force on 28 February 27 for a period of four years. It has been tacitly renewed, from 28 February 211 to 27 February 215. The first Protocol to this Agreement ran until 27 February 211 and provided for a financial contribution of 36.1 million out of which 13.5 million was dedicated to the support of the fisheries policy of Morocco. Vessels from 11 EU Member States could obtain fishing authorisations from Morocco under the Agreement and this Protocol. A second Protocol, extending its predecessor by one year under essentially the same terms, was negotiated in February 211 and provisionally applied until December 211, when the European Parliament decided not to consent to its conclusion. 142
144 214 Annual Economic Report on the EU Fishing Fleet A new protocol was signed on 18 November 213 and adopted by Council and European Parliament. It will enter in force once Morocco will have completed its ratification Table 4.6 Mixed fisheries agreements by MS SPAIN FRANCE PORTUGAL ITALY UK TOTAL Cape Verde Tuna seiners vessels Surface longliners vessels Pole and line vessels Comoros Tuna seiners vessels Surface longliners vessels Côte d'ivoire Tuna seiners vessels Surface longliners vessels Gabon Tuna seiners vessels Poles and lines vessels vessels Kiribati Tuna seiners vessels Surface longliners vessels Mauritius Tuna seiners vessels Surface longliners vessels Micronesia Tuna seiners vessels Surface longliners vessels São Tomé and Principe Tuna seiners vessels Surface longliners 4 / 5* - 2 / 1* 6 vessels Seychelles Tuna seiners Surface longliners
145 213 Annual Economic Report on the EU Fishing Fleet 5. NATIONAL CHAPTERS KEY FINDINGS Facts and Figures for EU Member State fleets in 212: Belgium: 86 vessels of which 4 inactive; employed 334 FTE fishers and generated 29.8 million in GVA, 3.7 million in gross profit and a profit margin of -7.2%; deteriorated performance expected to continue in 213. Bulgaria: 2,387 vessels of which 1,195 inactive; generated 2 million in GVA,.5 million in gross profit and a profit margin of 3.3%; insufficient data for trend analysis. Croatia: 4,236 vessels of which 1,421 inactive; employed 163 FTE fishers and generated 266,5 million in GVA, million in gross profit and a profit margin of 88.7 (economic data are to some extent unreliable); insufficient data for trend analysis. Denmark: 2,52 vessels of which 515 inactive; employed 1,556 FTE fishers and generated million in GVA, 137. million in gross profit and a net profit margin of 13.1%; improved economic performance. Estonia: 923 vessels of which 1 inactive; employed 2,46 FTE fishers and generated 7.7 million in GVA, 2.7 million in gross profit and a net profit margin of 15%; a slight deteriorated performance but expected to improve in 213. Finland: 3,359 vessels of which 1,47 inactive; employed 282 FTE fishers and generated 19.5 million in GVA, 9.1 million in gross profit and a net profit margin of 15.2%; improved economic performance but a slightly deteriorated performance is expected in 213. France: 5,83 vessels employing 7,375 FTE fishers generated million in GVA, million in gross profit and a profit margin of.7%; deteriorated economic performance expected to continue in 213. Germany: 1,564 vessels of which 411 inactive, employed 1,372 FTE and generated 73.9 million in GVA, gross profit of 24.6 million and a net profit margin of 4%; improved economic performance and expected to improve further in 213. Greece: 16,63 vessels employing 23,944 FTE. Economic performance could not be calculated due to missing data. Ireland: 2,23 vessels of which 179 inactive, employed 2,233 FTE and generated million in GVA, a 13.5 million gross profit and a net profit margin of 2.6%; improved economic trend expected to continue 213. Italy: 14,433 vessels of which 1,545 inactive; employed 2,716 FTEs and generated million in GVA, 244 million gross profit and a net profit margin of 5.3%; deteriorated performance expected to continue in 213. Latvia: 279 vessels of which 77 inactive; employed 353 FTE fishers and generated 8.5 million in GVA, 4.6 million in gross profit and a net profit margin of 12.1%; deteriorated performance expected to continue in 213. Lithuania: 151 vessels of which 47 inactive; employed 566 FTE and generated 12.9 million in GVA, 8.5 million in gross profit and a net profit margin of 12.7%; development trend improving but expected to deteriorate in 213. Malta: 1,6 vessels of which 276 inactive; employed 413 FTE fishers and generated 4.2 million in GVA and a gross profit of.1 million; economic development trend improving but expected to deteriorate in 213. Netherlands: 74 vessels of which 182 inactive; employed FTE and generated 13.3 million in GVA, a 36.5 million gross profit and a profit margin of -.8%; deteriorated performance but expected to improve in 213. Poland: 86 vessels of which 38 inactive; employed 1,737 FTE fishers and generated 27.3 million in GVA, 11 million in gross profit and a profit margin of 11.1%; economic development trend improving but not clear (slight decrease in profit margin) and expected to continue in 213. Portugal: 8,398 vessels of which 4,75 inactive; employed 14,931 FTE fishers, generated million in GVA, million gross profit and net profit margin of 2.5%; deteriorated performance expected to continue in 213. Romania: 261 vessels of which 78 inactive; employed 39 FTE fishers and generated.6 million in GVA, a.3 million gross profit and a net profit margin of 9%; deteriorated performance expected to continue in 213. Slovenia: 181 vessels of which 92 inactive; employed 63 FTE fishers and generated 1.6 million in GVA, a.3 million gross profit and a net margin of.4%; economic development trend improving expected to continue 213. Spain: 1,544 vessels of which 1,66 inactive, employed 3,32 FTE, and generated million in GVA, 26.6 million in gross profit and a net profit margin of 6.2%; economic development trend improving expected to continue 213but insufficient data for complete trend analysis. Sweden: 1,322 vessels of which 33 inactive, employed 942 FTE fishers, generated 56.6 million in GVA, 26.2 million gross profit and net profit margin of 1.7%; economic development trend improving but not clear (slight decrease in GVA and gross profit) and expected to continue in 213. United Kingdom: 6,413 vessels of which 1,83 inactive; employed 9,868 FTE, generated million in GVA, 23.4 million in gross profit and a net profit margin of 16%; development trend improving and expected to continue in 213. This chapter provides an overview of the structure and economic performance of the EU fishing fleet by Member State and highlights some key trends between 28 and 213, based on data obtained from the latest DCF fleet economic data call. 143
146 National Chapters 5.1 BELGIUM Fleet Structure, Fishing Activity and Production In 213, the Belgian fishing fleet consisted of 83 registered vessels with a combined gross tonnage (GT) of 15.1 thousand tonnes, a total engine power of 47.6 thousand kilowatts (kw) and an average age of 26 years. The size of the Belgian fleet decreased between 212 and 213; vessel numbers decreased by 3%, GT by 4% and kw by 2% (Figure 5.1.1). The size of the fleet in terms of vessel numbers has decreased 19% since 28. The Belgian fleet comprised 8 fishing enterprises in 213, with the vast majority (96%) owning a single vessel. Total employment in 212 was estimated at 351 jobs, corresponding to 334 FTEs. Employment levels decreased between 28 and 212; total employed decreased by 23% and FTEs by 12% over the period. The data suggest that the number of FTEs per vessel has remained stable since 28, and the average wage per FTE has been relatively steady between 211 and 213. Table Belgian national fleet structure, activity and production trends: Arrows indicate change ( ) 212 to 211: ( ) increase; ( ) decrease and ( ) stable/no change ( between -1 and +1%) Variable NATIONAL FLEET % Output Fishing Effort Employment Structure Total No. Vessels (#) % 8 No. of Inactive vessels (#) % 4 Average vessel age (year) % 27 Vessel tonnage (thousand GT) % 15 Vessel power (thousand kw) % 47 No. of Enterprises (#) % Total employed (#) % FTE (#) % Average wage per employed (thousand ) % Average wage per FTE (thousand ) % Days at sea (thousand days) % Fishing days (thousand days) % Energy consumption (milion litres) % Energy consumption per landed tonne (l/t) % Landings weight (thousand tonnes) % Landings value (million ) % Data source: DCF 214 Fleet Economic (MARE/A3/AC(214)); data for 213 and 214 are provisional. In 213, the Belgian fleet spent 16.3 thousand days at sea, a decrease of approximately 17% compared to 28 and 3% in comparison to 212. The quantity of fuel consumed in 212 amounted to 4 million litres, a decrease of 1% from 211. The decrease in fuel consumption is believed to be influenced by increasing fuel prices. The total weight of seafood landed by the Belgian fleet in 212 was 21.9 thousand tonnes (+9% compare to 211), with a landed value of 76.4 million (-4% compare to 211). The total weight increased by 1% over the period while the value of landings has decreased over the same period, indicating lower average first sale prices. In 212, common sole generated the highest landed value ( 3 million), followed by European plaice ( 8.5 million), anglerfishes ( 5.5 million), common shrimp ( 4 million) and then turbot ( 3.5 million). Common shrimp appeared in 211 replacing Crangon shrimps. In terms of landings weight, the order differs with European plaice in first with 6.4 thousand tonnes, followed by common sole (2.9 thousand tonnes) and Atlantic cod (1 thousand tonnes) (Figure 5.1.1). 144
147 214 Annual Economic Report on the EU Fishing Fleet 8 Landings weight (tousand tonnes) Landings value (million ) GT, kw (thousands) Vessel tonnage Vessel power No. Vessels FTE Total employed no. of vessels, employment thousand days Days at sea Fishing days Energy consumption million litres 8 15 million / thousand tonnes Landings value Landings weight Landings income Averag price ( /kgs) Anglerfishes Common shrimp Common sole European plaice Turbot Anglerfishes Common shrimp Common sole European plaice Turbot Anglerfishes Common shrimp Common sole European plaice Turbot Data source: DCF 214 Fleet Economic (MARE/A3/AC(214)); data for 213 are provisional. Figure Belgian fleet: main trends Top left capacity and employment; top right fishing effort and fuel consumption; middle left landings in value and weight; middle right average landed prices of top 5 species in terms of landed value in 212; bottom left - top 5 species in terms of value landed in 212; and bottom right landed weight of top 5 species in terms of value landed in 212. Prices were relatively stable between 21 and 211 for the five key species landed by the Belgian fleet. However, prices decreased between 211 and 212 for most species except common shrimp (+67%). Common sole achieved the highest average price per kilo in 212 ( 1 per kg), followed by anglerfishes ( 9.2 per kg) and turbot ( 9 per kg). Common sole accounted for 47% of the total value of landings in 211, decreasing to 39% in 212, while European plaice remained stable at 11% for both years. Compared to 211, the landed value of common sole and turbot decreased in 212 by 21% and 12%, respectively, while the landed value of common shrimp and anglerfish increased 175% and 28%, respectively. Only common shrimp prices increased; by 67% between 211 and 212. National Fleet Economic performance The amount of income generated by the Belgian national fleet in 212 was 8.4 million. This consisted of 76.4 million in landings value and 4 million in non-fishing income. The Belgian fleet s income has remained relatively steady over the period , albeit demonstrating a slight deterioration in 29. Total 145
148 National Chapters operating costs incurred by the Belgian national fleet in 212 equated to 74 million, amounting to 86% of total income. Crew cost and fuel costs, the two major expenses, amounted to 26.1 and 27.4 million, respectively (Table 5.1.2). Between 212 and 213, total operating costs decreased 4% due to lower fishing effort in 213. Table Belgian national fishing fleet economic performance in and projections for 213. Development trend based on % net profit margin 212 to average net profit margin Arrows indicate change ( ) 212 to 211: ( ) increase; ( ) decrease and ( ) stable/no change ( between -1 and +1%) Variable (million ) National Fleet % Income Costs Economic Indicators Capital value Profitability and development trends Landings income % Other income % Labour costs % Energy costs % Repair costs % Other variable costs % Other non-variable costs % Capital costs % GVA % Gross profit % Net profit % Depreciated replacement value % Investments % Net profit margin (%) % development trend Stable % RoFTA (%) % development trend Deteriorated -36% GVA per FTE (thousand ) % development trend Stable 1% Data source: DCF 214 Fleet Economic (MARE/A3/AC(214)); data for 213 are provisional. Note: other income for 28 includes only TBB fleet segments The total amount of Gross Value Added (GVA), gross profit and net profit generated by the Belgium fleet in 212 were 29.8 million, 3.7 million and million, respectively. Gross Value Added (GVA) and gross profit decreased by 17% and 61% respectively, between 211 and 212, and further decrease is expected in 213. In 212, the Belgian fleet moved, once again, into a net loss making position (- 1.8 million), a situation that is expected to be continued into 213 (Figure 5.1.2). In 212, the (depreciated) replacement value of the Belgian fleet was estimated at 49 million and investments amounted to 1.4 million, a decrease of 24% compared to
 9 7 5 3 1-1 -3 28 29 21 211 212 213 Revenue GVA Gross profit Net profit")

149 214 Annual Economic Report on the EU Fishing Fleet million Landings income Other income million Crew wage costs Unpaid labour Energy costs Repair costs Other variable costs Other non-variable costs Annual depreciation Performance indicators (million ) Revenue GVA Gross profit Net profit Performance indicators (miilion ) Income GVA Net profit Data source: DCF 214 Fleet Economic (MARE/A3/AC(214)); data for 213 are provisional. Figure Belgian fleet main economic performance trends Top left income structure; top right cost structure; bottom left economic performance indicators; bottom right performance indicators as a % of revenue (landings income + other income) (projected figures for 213). Fleet Segment Level Economic performance The Belgian fleet is composed of seven fleet segments operating in the North Sea, English Channel and other areas of the North Atlantic (Figure 5.1.3). Beam trawlers dominate the fleet, representing 83% of the active vessels. Figure Belgian fleet fishing effort by main FAO fishing areas, 212. Colour shows fishing days (thousand days) and landings in weight (thousand tonnes); Value shows days-at-sea (thousand days) and landings in value (thousand ). Source: DCF 214 Fleet Economic (MARE/A3/AC(214)) The Belgium fleet is composed mainly of large-scale vessels. In fact, according to the data there was only one small-scale vessel (1-12m) active in 212. The structure of the large-scale fleet segment has remained stable, 147
150 National Chapters while its economic situation has deteriorated with a general increase in costs, particularly, labour and energy costs, showing overall non profitability. Table contains economic performance indicators for each of the main Belgian fleet segments in 212, and highlights low profitability in most of the segments. The 24-4m beam trawlers, which generated a reasonable 4 million profit in 211, performed at a loss in 212. The total value landed and days at sea decreased by 4% while, at the same time, energy costs increased. Beam trawl 18-24m 34 vessels make up this segment and operate predominantly in Area Even with the addition of 2 vessels in 212, the days at sea decreased by 13%, with an associated decrease of energy costs (-11%). However, the revenue decreased by 17% because of lower landings and lower fish prices. The fleet targets a variety of species including common sole ( 5 million), common shrimp ( 4 million) and European plaice ( 1.8 million). These three main species represented 73% of the total of landings by this segment in 212. In 212, the total value of landings reached almost 13 million, employing almost 76 FTEs and contributing to 16% and 23% of the total income from landings and FTEs generated by the Belgian fleet, respectively. This fleet segment reported a negative gross profit of around.1 million and a net loss of 1.6 million in 212. Beam Trawl 24-4m there were 31 vessels registered in this segment in 212, targeting a variety of species, particularly common sole, European plaice and lemon sole. In 212, the total value of landings amounted to almost 54 million and 187 FTEs were employed in this fleet segment, contributing to 68% and 56% of the total income from landings and FTEs generated by the Belgian fleet, respectively. In 212, this fleet segment reported a gross profit of 3.5 million, decreasing by 63% from 211 and a net loss of 3 million. Demersal trawl and seine 24-4m 4 vessels made up this segment in 212. This fleet operates in the North Sea and English Channel and has remained stable in terms of numbers. However, in terms of profitability the fleet deteriorated in 212. The increase in energy costs (+15%) and decrease in landings (-3%) contributed to this negative performance. The fleet targets a variety of species including common sole, surmullet and European plaice. In 212, this fleet segment achieved almost 5.2 million in landed value and employed 26 FTEs, contributing to 8% of the income from landings and 7% of total FTEs generated by the Belgian national fleet. The fleet segment generated a gross profit of around 1 million and a negligible net profit in 212. Assessment and Future Trends General trend: The economic performance of the Belgian fleet has deteriorated. Even with fleet segments continuing to limit energy consumption, if fish prices do not increase it will be difficult to improve profitability, except perhaps for some beam trawlers, which managed to improve their net profit margin. Development in flatfish fishery: Development of technical innovation in the flatfish fishery in Belgium is stagnating. Contrary to the Dutch fleet, no Belgian commercial vessel is currently using innovative fishing techniques as an alternative for the conventional beam trawl. The Flemish government issued three permits to commence pulse technique; however these are still to be implemented. One of the reasons behind this is that the reduced quota for sole in the North Sea (the only area where pulse is partly permitted) does not justify such an investment. Quota for sole in other areas cannot be targeted using the pulse technique as it is prohibited. Development in shrimp fishery: The supply industry and research institutes are ready to introduce new and more sustainable fishing techniques but the sector is not willing to implement these. Fishermen are hesitant due to uncertainty in the impact of the techniques and the possible market effects. Longer trends on the main indicators analysed, including data from the Data Collection Regulation (DCR, 22-27), are provided at the end of this chapter. Data issues No major issues detected. However, a national expert was not present at both EWGs to further comment on the data and developments of the Belgian fleet. 148
151 214 Annual Economic Report on the EU Fishing Fleet Table Main socio-economic performance indicators by fleet segment in the Belgian national fishing fleet in 212. Development trend based on % net profit margin 212 to average net profit margin Arrows indicate change ( ) 212 to 211: ( ) increase; ( ) decrease and ( ) stable/no change ( between -1 and +1%) Fleet segment No. of vessels (N) % FTE (N) % Days at sea (days) % Energy consumption (litres) % Value of landings (thousand ) % Weight of landings (thousand tonnes) % GVA (thousand ) % GVA per FTE ( /FTE) % Gross profit (thousand ) % Net profit (thousand ) % Net profit margin (%) % Profitability (212) Net profit margin % average (28-11) Economic development trend BELAREA27DFNVL % 6-4% % 72-6% % 93-26% % % % -1 Weak 98% Improved BELAREA27DTSVL % 25 56% % % % % % % % % % Weak -12% Deteriorated BELAREA27DTSVL244 4 % 26 4% % % % % 268 9% % 98 35% % 174% Reasonable 131% Improved BELAREA27TBBVL % 11 % % % % % % % % % -65-7% Weak -13% Deteriorated BELAREA27TBBVL % 76-12% 49-13% % % % % % % % % Weak -1% Stable BELAREA27TBBVL % 187 1% 814 % 283 3% % % % % % % % Weak -48% Deteriorated Data source: DCF 214 Fleet Economic (MARE/A3/AC(214)). 149
152 million Performance indicators (miilion ) % Landings value (million ) GT, kw (thousands) No. of vessels, FTE Thousand days Million litres million / thousand tonnes National Chapters Vessel power Vessel GT Employed No. Vessels Days at sea Fishing days Energy consumption Landings value Landings weight Landings income Averag price ( /kgs) Anglerfishes nei Common sole European plaice Turbot Common shrimp Lemon sole Landings income Direct income subsidies Other income Fishing rights income Anglerfishes Common shrimp Common sole European plaice Turbot Lemon sole Income GVA Net profit Landings weight (thousand tonnes) Anglerfishes Common shrimp Common sole European plaice Turbot Lemon sole 5% 4% 3% 2% 1% % -1% -2% -3% GVA to Revenue Net profit margin 15
153 214 Annual Economic Report on the EU Fishing Fleet 5.2 BULGARIA 1 Fleet Structure, Fishing Activity and Production In 212, the Bulgarian fishing fleet consisted of 2,387 registered vessels, of which 1,192 were active and the remaining 1,195 vessels were inactive. The active fleet had a combined gross tonnage of 5.1 thousand tonnes, total power of 37.6 thousand kw and an average age of 24 years. The overall size of the Bulgaria fishing fleet decreased between 212 and 213; the active fleet remained stable while inactive vessels decreased by 1%. In the active fleet, GT and kw decreased by 2% and 1%, respectively between 211 and 212 (Table 5.2.1). Through the use of the European Fisheries Fund (EFF) aid, 2 Bulgarian vessels were scrapped before the end of 211. Capacity data appears somewhat inconsistent as the total number of vessels (active and inactive) in the national fleet normally varies from one year to the next. Generally, less than half of the fleet is active throughout the year. For example, in 211 there were 2,345 in the fleet register but only 11 vessels were active, i.e. with at least one recorded day at sea (Table 5.2.1). In 212, there were 184 fishing enterprises; with the majority (68%) owning a single vessel and 3% of the enterprises owning two to five fishing vessels. Total employment in 212 was estimated at 5,638 jobs, corresponding to 2,872 FTEs, but data submitted are not reliable. Thus, the accuracy of data and indicator calculation do not allow for the assessment of the employment situation at national level, and consequently any related indicators (Table 5.2.1). Table Bulgarian national fleet structure, activity and production trends: Arrows indicate change ( ) 212 to 211: ( ) increase; ( ) decrease and ( ) stable/no change ( between -1 and +1%) Output Fishing Effort Employment Structure Variable NATIONAL FLEET % Total No. Vessels (#) 2,68 2,421 2,692 2,345 2,387 2,54 2% 243 No. of Inactive vessels (#) 1,826 1,33 1,39 1,335 1, % 862 Average vessel age (year) % 2 Vessel tonnage (thousand GT) % 8.5 Vessel power (thousand kw) % 77.7 No. of Enterprises (#) ,955 86% Total employed (#) 1,433 1,732 3,933 3,276 13,466 11, % FTE (#) 1,57 1,43 2,889 1,668 7,18 6,689 33% Average wage per employed (thousand ) % Average wage per FTE (thousand ) % Days at sea (thousand days) % Fishing days (thousand days) % Energy consumption (milion litres) Energy consumption per landed tonne (l/t) Landings weight (thousand tonnes) % Landings value (million ) % Data source: DCF 214 Fleet Economic (MARE/A3/AC(214)); data for 213 and 214 are provisional. The Bulgarian fleet spent just over 25 thousand days at sea in 212, a 56% increase compared to 211. Data on fuel consumption is missing for 212. However, given the increase in the number of active vessels and effort variables it may be assumed that fuel consumption also increased in This National Chapter is built on data that by experts has been judged as questionable regarding both coverage and quality. Results should therefore be treated carefully! 151
154 GT, kw (thousands) No. of vessels, FTE (thousand) thousand days million litres National Chapters The total landed weight by the Bulgarian fleet in 212 was 8.1 thousand tonnes of seafood, with a landed value of 4.4 million. The total volume and value of landing increased by 6% and 64% respectively over the period analysed (Figure 5.2.1) Vessel power Vessel tonnage No. Vessels FTE Days at sea Fishing days Energy consumption million / thousand tonnes Landings value Landings weight Landings income Average price ( /kg) Bluefish European sprat Med. horse mackerel Sea snails Turbot Landings value (million ) Bluefish European sprat Med. horse mackerel Sea snails Turbot Figure Bulgarian fleet: main trends for the period Landings weight (thousand tonnes) Bluefish European sprat Med. horse mackerel Sea snails Turbot Data source: DCF 214 Fleet Economic (MARE/A3/AC(214)); data for 213 are provisional Top left capacity and employment; top right fishing effort and fuel consumption; middle left landings in value and weight; middle right average landed prices of top 5 species in terms of landed value in 212; bottom left - top 5 species in terms of value landed in 212; and bottom right landed weight of top 5 species in terms of value landed in 212. Regarding the top species in terms of value, the average first sale price for European sprat, Mediterranean horse mackerel and picked dogfish remained stable while for turbot it increased between 28 and 212. Turbot achieved the highest average price per kilo in 212 ( 6.94 per kg), followed by picked dogfish ( 1.8 per kg) (Figure 5.2.1). 152
155 214 Annual Economic Report on the EU Fishing Fleet National Fleet Economic performance The amount of income generated by the Bulgaria national fleet in 212 was 5.3 million. This consisted of 4.7 million in landings value and 6 thousand in non-fishing income. The Bulgarian fleet s income increased 75% between 211 and 212. However, official data suggests that total operating costs incurred by the Bulgarian fleet in 212 equated to 5.2 million, amounting to 111% of income (Table 5.2.2, Figure 5.2.2). 2 The economic performance, based on the data submitted, suggests that the Bulgarian fleet was barely profitable in 212, moving from a loss making position (in 29 to 211) to generating 2 million in GVA, 5 thousand in gross profit and a net profit of 2 thousand in 212 (Figure 5.2.2). Data inconsistencies and substantial inter-annual variations should, however, be considered with care. Table Bulgarian national fishing fleet economic performance in and projections for 213. Development trend based on % net profit margin 212 to average net profit margin Arrows indicate change ( ) 212 to 211: ( ) increase; ( ) decrease and ( ) stable/no change ( between -1 and +1%) Variable (million ) National Fleet % Income Costs Economic Indicators Capital value Profitability and development trends Landings income % Other income Labour costs % Energy costs % Repair costs % Other variable costs % Other non-variable costs % Capital costs % GVA % Gross profit % Net profit % Depreciated replacement value Investments % Net profit margin (%) % development trend Improved 14% RoFTA (%) , % development trend Improved 11% GVA per FTE (thousand ) % development trend Improved 33% Data source: DCF 214 Fleet Economic (MARE/A3/AC(214)); data for 213 and 214 are provisional. 2 The realibility of the data submitted, in particular for 212, is questionable and hence, the accuracy of the analysis is doubtful. 153
156 National Chapters million million Landings income Other income Crew wage costs Unpaid labour Energy costs Repair costs Other variable costs Other non-variable costs Annual depreciation Performance indicators (million ) % Revenue GVA Gross profit Net profit GVA to Revenue Gross profit margin Net Profit margin RoFTA Figure Bulgarian fleet main economic performance trends for the period Top left income structure; top right cost structure; middle left cost items as a percentage of income (fishing income and other income); middle right economic performance indicators; bottom performance indicators as a % of revenue (landings income + other income) (projected figures for 213). Fleet Segment Level Economic performance The Bulgarian fleet is diverse with a broad range of vessel types targeting different species predominantly in the Black Sea. The national fleet consisted of 18 (DCF) fleet segments in 212, with a further 1,195 inactive vessels. Most of the vessels under 12m are mainly engaged in small-scale coastal fishing with gillnets (anchored). These vessels are mainly operated solely by the owner, for whom fishing is an additional income stream. The profit is the actual remuneration (wages) of the working effort of the owner. The large-scale fleet is active also only in the EU Black Sea waters, including Romanian and Bulgarian community waters (Table 5.2.3; Table 5.2.4) Table provides a breakdown of key performance indicators for all fleet segments in 212. A short description of the three most important segments in terms of total value of landings is provided below. Pelagic trawl 18-24m In 212, 22 vessels made up this segment that targets a variety of species but in particular European sprat, Mediterranean horse mackerel and picked dogfish. In 212, the total value of landings was 1.5 million and around 61 FTEs were employed in this fleet segment. Polyvalent mobile and passive gears 12-18m In 212, 16 vessels make up this segment that targets a variety of species but in particular sea snails and picked dogfish. In 212, the total value of landings was.98 million and the fleet segment employed around 36 FTEs. This fleet segment was unprofitable in 212, with a reported gross and net loss of around 2.3 million and.3 million, respectively. Polyvalent mobile and passive gears 6-12m In 212, 174 vessels make up this segment which targets a variety of species but in particular sea snails and picked dogfish. In 212, the total value of landings was 1,41 million and around 241 FTEs were employed in this fleet segment. 154
157 214 Annual Economic Report on the EU Fishing Fleet Table Bulgarian national fleet structure, activity and production trends by operational scale: Arrows indicate change ( ) 212 to 211: ( ) increase; ( ) decrease and ( ) stable/no change ( between -1 and +1%) Structure Employment Fishing Effort Output Variable Small scale Fleet % Large scale fleet No. Vessels (#) , ,112 1,137 2% % Vessel tonnage (thousand GT) % % Vessel power (thousand kw) % % Total employed (#) 1,96 1,372 3,555 2,823 4,87 5,848 73% FTE (#) 1,293 1,151 2,64 1,423 2,451 72% % Average wage per employed (thousand ) % % Average wage per FTE (thousand ) % % Days at sea (thousand days) % % Fishing days (thousand days) % % Energy consumption (milion litres) Energy consumption per landed tonne (l/t) 6, % Landings weight (thousand tonnes) % % Landings value (million ) % % Table Economic performance of the Bulgarian national fishing fleet by operational scale: Arrows indicate change ( ) 212 to 211: ( ) increase; ( ) decrease and ( ) stable/no change ( between -1 and +1%) Variable (million ) Small scale Fleet % Large scale fleet % Income Costs Economic Indicators Capital value Profitability and development trends Landings income % % Other income Labour costs % % Energy costs % % Repair costs % % Other variable costs % % Non-variable costs % % Capital costs % % GVA % % Gross profit % % Net profit % % Depreciated replacement value Investments % % Net profit margin (%) , % , % development trend Improved 91% Improved 91% RoFTA (%) % % development trend Improved 99% Improved 99% GVA per FTE (thousand ) % % development trend Improved 39% Improved 1818% Assessment and Future Trends National Fleet The main factors that influenced the economic status of the Bulgarian fish catching sector in 212 were: absence of bank credit lending policy, something which is desperately needed to facilitate the development of the sector; a comparatively large number of ageing vessels; poor weather conditions and poor domestic consumption demand due to lack of affordability. Bulgaria has a 378 km coastline, a continental shelf of 1,886 km² and an Exclusive Economic Zone in the Black Sea of about 25,699 km². Most of the fishing activities are carried out in territorial waters up to 12 nm. There are quotas for two species in Bulgaria, turbot and sprat. The Black Sea TAC (quota regime) was introduced in 28, following the accession of Bulgaria and Romania to the European Union (EU). A decreasing trend in turbot biomass indices has been observed since 28, despite 155
158 National Chapters the presence of the quotas regime for turbot in community waters. For this reason, implementation of additional and more effective management measures for restricting turbot exploitation are necessary. In compliance with the Operational Program for the development of the Bulgarian fisheries sector for Programming period , priority axis 1 (Measures for adaptation of the fishing fleet), Measure 1.1. (Public aid for permanent cessation of fishing activities) states that the decrease of capacity will be achieved, based on the national plans for adjustment of the fishing effort in direction of restructuring of the fishing fleet and conservation of its sustainable management, in compliance with the principles of the Common Fisheries Policy. Bulgaria has therefore made significant efforts in withdrawing vessels from the fleet, particularly in the 6-12m, 12-18m and 18-24m length classes. Data issues The Bulgarian expert consulted before the meeting stated: There are limited human resources available and procedures to work with the data in Bulgaria; there is a difficulty in analysing the fishing effort data because of the large number of vessels under 12m engaged in mixed fisheries that are fishing for several species at the same time using different fishing gears throughout the year. There is an absence of established automatic system for fleet management and an absence of separate fish markets; the presence of very small landing ports and the fact that the majority of the fleet is under 12m creates difficulties with the accuracy of landings and their monitoring. Joint research conducted with Romanian scientists on turbot and sprat stocks in Community waters in 21 and 211 is a big step forward because it gives a more accurate picture of the stocks. Amendments have also been adopted in national legislation enabling effective measures to be taken against inactive vessels. According to the changes in the Bulgarian Fisheries and Aquaculture Act in 212, all Bulgarian fishermen are obliged to become enterprises. This will allow collection of economic information by two sources - from balance sheets and from questionnaires on economic statistics. There will be a single authority responsible for the management of fisheries resources and the fishing fleet, assuring accurate and continuous updates of the fleet register, sufficient monitoring of fleet entries and exits and all the other necessary information related to fleet management. Other assumptions cannot be made based on data transmitted by the member state and strong actions are needed to underline to the member state to resubmit reliable, sound and complete data as per EU Decision 93/21, and the Regulation 199/28 requirements. 156
159 214 Annual Economic Report on the EU Fishing Fleet Table Main socio-economic performance indicators by fleet segment in the Bulgarian national fishing fleet in 212. Development trend based on % net profit margin 212 to average net profit margin Arrows indicate change ( ) 212 to 211: ( ) increase; ( ) decrease and ( ) stable/no change ( between -1 and +1%) Fleet segment No. of vessels (N) % FTE (N) % Days at sea (days) % Energy consumption (litres) % Value of landings (thousand ) % Weight of landings (thousand tonnes) % GVA (thousand ) % GVA per FTE ( /FTE) % Gross profit (thousand ) % Net profit (thousand ) % Net profit margin (%) % Profitability (212) Net profit margin % average (28-11) Economic development trend BGRAREA37DFNVL % 68-52% % % %.3 149% % % -1 99% Weak 97% Improved BGRAREA37DFNVL % % 6 1% BGRAREA37HOKVL6 7 6% % % 3 661% BGRAREA37HOKVL % % 27 11% 16 17% BGRAREA37HOKVL BGRAREA37HOKVL BGRAREA37PGVL Weak BGRAREA37PGVL BGRAREA37PMPVL % % 89 57% % BGRAREA37PMPVL % % % % BGRAREA37PMPVL % 36 87% % % % %.5 15% % % % Weak 91% Improved BGRAREA37TMVL BGRAREA37TMVL % % % % BGRAREA37TMVL % 61 18% % % % % % % Data source: DCF 214 Fleet Economic (MARE/A3/AC(214)). 157
160 National Chapters 5.3 CROATIA 1 Fleet Structure, Fishing Activity and Production In 213, the Croatian fishing fleet consisted of 4,368 registered commercial vessels, with a combined gross tonnage of 45,792 GT, a total power of 347,544 kw and an average age of 32 years. The size of the Croatian fishing fleet increased between 212 and 213, with the number of vessels rising by 3% and GT and kw increasing by 2% and 6% respectively (Table 5.3.1; Figure 5.3.1). During 212 and first half of 213 the Fleet Register in the Fisheries Information System in Croatia underwent a revision, which resulted in an increase of the number of vessels in the Fleet Register. Additionally, from the previous category of subsistence fisheries 3,5 vessels have entered into the commercial fleet register, following the provisions of the Accession Treaty of Croatia. In 213, the number of fishing enterprises in the Croatian fleet totalled 3,682, with the majority (78%) owning a single vessel. Total employment in 211 was estimated at 1,15 jobs, corresponding to 168 FTEs. The level of employment decreased between 211 and 212, with total employed decreasing by just 2% and the number of FTEs decreasing by 3% over the period. Factors causing employment to decrease is uncertain due to lack of information, in particular since the data does not correlate to the increase of number of vessels. The employments figures are very low and appear unreliable. With 2,739 vessels in the fleet in 213 there are only 1,22 employed and 177 FTE. This can t be with 78% of the fleet comprising of single vessel ownership. In relation to number of vessels and fishing day, an average employee should work on 3 vessels and an average FTE create around 15 fishing days. Table Croatian national fleet structure, activity and production trends: Arrows indicate change ( ) 212 to 211: ( ) increase; ( ) decrease and ( ) stable/no change ( between -1 and +1%) Variable NATIONAL FLEET % Output Fishing Effort Employment Structure Total No. Vessels (#) 3,912 4,236 4,368 8% 4,368 No. of Inactive vessels (#) 1,69 1,421 1,629 33% 3,923 Average vessel age (year) % 33 Vessel tonnage (thousand GT) % 46 Vessel power (thousand kw) % 348 No. of Enterprises (#) 2,768 3,62 3,682 3% Total employed (#) 1,15 1,125 1,22-2% FTE (#) % Average wage per employed (thousand ) % Average wage per FTE (thousand ) % Days at sea (thousand days) % Fishing days (thousand days) % Energy consumption (milion litres) % Energy consumption per landed tonne (l/t) % Landings weight (thousand tonnes) % Landings value (million ) % Recreactional catches of selected species (T) % Note: FTE values are incomplete due to error in estimation methodology Data source: DCF 214 Fleet Economic (MARE/A3/AC(214)); data for 213 and 214 are provisional. 1 This National Chapter is built on data that, in part, has been judged by experts as questionable regarding both coverage and quality. Results should therefore be treated carefully! 158
161 214 Annual Economic Report on the EU Fishing Fleet The Croatian fleet spent a total of around 198 thousand days at sea in 213 according to preliminary data. The total number of days at sea decreased 3% between 211 and 212 and a further 11% between 212 and 213. The main factor causing the decrease in days at sea is related to the increase in fuel price. The quantity of fuel consumed in 211 totalled 14.8 million litres, decreasing 26% in 212, totalling 11 million litres. The major factors causing the decrease in fuel consumption include increasing fuel efficiency of newer engines and the rising cost of fuel. GT, kw (thousands) million / thousand tonnes Landings value (million ) Vessel tonnage Vessel power No. Vessels FTE Total employed Landings value Landings income Landings weight European anchovy European hake European pilchard Norway lobster Pelagic fishes nei Figure Croatian fleet main trends for the period no. Vessels, employment (thousand) thousand days Average price ( /kg) Landings weight (thousand tonnes) Days at sea Fishing days Energy consumption European anchovy European pilchard(=sardine) Pelagic fishes nei European hake Norway lobster European anchovy European hake European pilchard Norway lobster Pelagic fishes nei Top left capacity and employment; top right fishing effort and fuel consumption; middle left landings in value and weight; middle right average landed prices of top 5 species in terms of landed value in 212; bottom left - top 5 species in terms of value landed in 212; and bottom right landed weight of top 5 species in terms of value landed in million litres The total weight landed by the Croatian fleet in 212 was 62,286 tonnes of seafood, with a landed value of 41.6 million. The total weight and value of landings decreased by 1% over the period analysed. In 212, European pilchard (sardine) generated the highest landed value ( 15.5 million), followed by European anchovy ( 6 million), European hake ( 2.7 million), Norway lobster ( 2.3 million) and common sole ( 1.2 million). In terms of weight, landings of European pilchard (sardine) reached 43.8 thousand tonnes, followed by European anchovy (8.3 thousand tonnes). The major factors causing the changes in volume and value of landings include a decline in the landings of the main commercial small pelagic fish, e.g. sardine and anchovy. 159
162 National Chapters The changes in prices obtained for these key species varied slightly between 211 and 212. The decline in the landings of anchovy was followed by a slight increase in the average price, while the average price of sardine decreased in 212. Of main commercial fish species, Norway lobster achieved the highest average price per kilo in 212 ( 1,16 per kg), followed by scallops ( 6,52 per kg). While the inverse relationship between price and quantity largely prevails, it does not explain the fall in price of sardine and the price increase of anchovy. The value of landings of European pilchard (sardine) varied slightly from 211 to 213, from 37% of the total landings value in 212 to 4% in 213. Norway lobster remained more or less stable, increasing from 15% in 211 to 16% in 212. The decline in importance of European pilchard (sardine) in 212 reflects both the decrease in landings and average price, while there is a definite rising trend in 213. National Fleet Economic performance According to the data submitted, the amount of income (income from landings and non-fishing income) generated by Croatian national fleet appears grossly overestimated when compared to the declared landings value and are not presented and analysed further. Table Croatian national fishing fleet economic performance in and projections for 213. Development trend based on % net profit margin 212 to average net profit margin Arrows indicate change ( ) 212 to 211: ( ) increase; ( ) decrease and ( ) stable/no change ( between -1 and +1%) Variable (million ) National Fleet % Income Costs Economic Indicators Capital value Profitability and development trends Income from landings % Other income % Labour costs % Energy costs % Repair & maintenance costs % Other variable costs % Other non-variable costs % Capital costs Gross Value Added (GVA) % Gross Profit % Net Profit Tangible asset value (replacement) % Investment (Capital value) % Net profit margin (%) development trend RoFTA (%) % development trend GVA per FTE (thousand ) 1,276 1,632 1,64 28% development trend Data source: DCF 214 Fleet Economic (MARE/A3/AC(214)); data for 213 are provisional. Total operating costs incurred by the Croatian fleet in 212 equated to 25.2 million, amounting to 6.5% of the value of landings. Crew cost and fuel costs, the two major fishing expenses, were 9.2 and 7.5 million respectively. Between 211 and 212, all major cost items decreased with the exception of repair and maintenance costs (Table 5.3.2, Figure 5.3.2). The Croatian fleet had an estimated (depreciated) replacement value of 73.5 million in 212. Investments by the fleet amounted to 2.6 million in 212, a decrease of 26% when compared to 211 (Table 5.3.2, Figure 5.3.2). 16
163 214 Annual Economic Report on the EU Fishing Fleet 4 3 million Crew wage costs Unpaid labour Energy costs Repair costs Other variable costs Other non-variable costs Annual depreciation Figure Cost structure of the Croatian fleet for the period Fleet Segment Level Economic performance The Croatian fleet is highly diversified with a broad range of vessel types targeting different species predominantly in the Adriatic Sea. Table and Table provide a breakdown of the key performance indicators for the Croatian fleet by main fishing activity (small and large-scale). Table 5.3.5provides a breakdown of key performance indicators for all Croatian fleet segments in 212. However, due to inconsistent data of questionable reliability, the data has not been analysed further in this chapter. Table Croatian national fleet structure, activity and production trends by operational scale: Arrows indicate change ( ) 212 to 211: ( ) increase; ( ) decrease and ( ) stable/no change ( between -1 and +1%) Structure Employment Fishing Effort Output Variable Small scale Fleet % Large scale fleet No. Vessels (#) 1,722 1,712 1,683-1% 1,121 1,13 1,56-2% Average vessel age (year) % % Vessel tonnage (thousand GT) % % Vessel power (thousand kw) % % Total employed (#) % 1,5 1,3 97-4% FTE (#) % % Average wage per employed (thousand ) % % Average wage per FTE (thousand ) % % Days at sea (thousand days) % % % Fishing days (thousand days) % % Energy consumption (milion litres) % % Energy consumption per landed tonne (l/t) % % Landings weight (thousand tonnes) % % Landings value (million ) % % 161
164 National Chapters Table Economic performance of the Croatian national fishing fleet by operational scale: Arrows indicate change ( ) 212 to 211: ( ) increase; ( ) decrease and ( ) stable/no change ( between -1 and +1%) Variable (million ) Small scale Fleet % Large scale fleet % Income Costs Economic Indicators Capital value Profitability and development trends Landings income % % Other income % % Labour costs % % Energy costs % % Repair costs % % Other variable costs % % Non-variable costs % % Capital costs % % GVA % % Gross profit % % Net profit Depreciated replacement value % % Investments.1.1 3% % Net profit margin (%) development trend RoFTA (%) development trend GVA per FTE (thousand ) % % development trend Data issues There are some questionable data, in particular related to income values at the national level. Income values appear to be grossly overestimated in particular when compared to landings value. A problem with the estimation procedure was identified by the expert during the first AER meeting. However, in the meantime this issue was not addressed by HRV and a national expert was not available to comment further on data related issues during the second meeting. The reader should note that Croatian fleet revenues and costs do not include trade in quota. Quota trades take two forms; transfer in perpetuity and transfers for a defined period, usually one year - generally called leasing. There are two components within each of these. First, there is the windfall accruing to those enjoying the initial allocation of the resource in 29 and secondly the normal capital gain or loss arising on transfer of the asset. Only the latter should be included in the accounts used in this report. However, it is impossible to identify the contribution of each component, but as the proportion of the total value is declining with each transfer of the original allocation, the problem will disappear as time goes by. Initially, however, the windfall component will be by far the greater proportion and hence for the time being omission of transfers limits any distortion of the fleet profitability figures. The data related to employment might not be representative of the small scale fleet and estimation methodology will be revised. 162
165 214 Annual Economic Report on the EU Fishing Fleet Table Main socio-economic performance indicators by fleet segment in the Croatian national fishing fleet in 212. Arrows indicate change ( ) 212 to 211: ( ) increase; ( ) decrease and ( ) stable/no change ( between -1 and +1%) Fleet segment No. of vessels (N) % FTE (N) % Days at sea (days) % Energy consumption (litres) % Value of landings (thousand ) % HRVAREA37DFNVL % 3 22% % % % 157-1% 4 86% 2 52% -5 8% Weak HRVAREA37DFNVL % 14 9% % % % 61-14% % 7 194% % Weak HRVAREA37DFNVL Weak Weight of landings (thousand tonnes) HRVAREA37DRBVL HRVAREA37DRBVL Weak HRVAREA37DTSVL6 1-9% 1 56% 453-2% 1-9% 1 233% 13 4% 9 116% 14 39% -4 8% Weak HRVAREA37DTSVL % 5-7% % % 29-4% 928-5% 26-48% 39-44% 37-76% -3-1 Weak HRVAREA37DTSVL % 14-9% % % % 29 1% 44-79% 3-77% % Weak HRVAREA37DTSVL Weak HRVAREA37DTSVL % 9-27% % % 298 5% 588-3% % % % Weak HRVAREA37FPOVL HRVAREA37FPOVL HRVAREA37HOKVL6 87-5% 17% % 5 14% 3-49% 2-1% -6% 1-19% HRVAREA37HOKVL Weak HRVAREA37PGPVL % 1-14% % 8-39% % 17-31% 1-94% 1-94% HRVAREA37PMPVL HRVAREA37PMPVL HRVAREA37PSVL % 1 285% % 32-1% 22-41% % % % % Weak HRVAREA37PSVL % 5-9% % 18-11% % 53-19% % % % Weak HRVAREA37PSVL % 24-1% % % % % % 93-12% % Weak HRVAREA37PSVL % 53 % % % % % % % % High % GVA (thousand ) % GVA per FTE ( /FTE) % Gross profit (thousand ) % Net profit (thousand ) % Net profit margin (%) % Profitability (212) Data source: DCF 214 Fleet Economic (MARE/A3/AC(214)) 163
166 National Chapters 5.4 CYPRUS 1 Fleet Structure, Fishing Activity and Production In 213, the Cypriot fishing fleet 2 consisted of 1,463 registered vessels, with a combined gross tonnage of 9 thousand GT, a total engine power of 65 thousand kw and an average age of 5 years. The number of vessels of the Cypriot fishing fleet decreased between 28 and 213 by 1%, but remained stable between 211 and 212, increasing again in 213. Although the fleet remained stable in terms of number between 211 and 212, it increased in GT by 39% and engine power by 5% over the same period. The number of inactive vessels increased 25% between 211 and 212, and by a further 2% in 213 (Table 5.4.1; Figure 5.4.1). In 213, the number of fishing enterprises in the Cypriot fleet totalled 925, with the vast majority (96%), owning a single vessel. Total employment in 213 was estimated at 1,431 jobs, corresponding to 99 FTEs. The level of employment increased between 28 and 213, with total employees increasing by 44% and the number of FTEs increasing by 1% over the period. Table Cypriot national fleet structure, activity and production trends: Arrows indicate change ( ) 212 to 211: ( ) increase; ( ) decrease and ( ) stable/no change ( between -1 and +1%) Output Fishing Effort Employment Structure Variable NATIONAL FLEET % Total No. Vessels (#) % 732 No. of Inactive vessels (#) % Average vessel age (year) % Vessel tonnage (thousand GT) % 3.1 Vessel power (thousand kw) % 33.6 No. of Enterprises (#) % Total employed (#) % FTE (#) % Average wage per employed (thousand ) % Average wage per FTE (thousand ) % Days at sea (thousand days) Fishing days (thousand days) Energy consumption (milion litres) Energy consumption per landed tonne (l/t) Landings weight (thousand tonnes) % Landings value (million ) % Data source: DCF 214 Fleet Economic (MARE/A3/AC(214)); data for 213 and 214 are provisional. In 213 the Cypriot fishing fleet spent a total of around 67 thousand days at sea. The total number of sea days has decreased between 28 and 213 by about 29%. The total volume of landings achieved by the Cypriot fleet in 213 was around.9 thousand tonnes of seafood, a fall of around 57% compared to 28. The total value of seafood landed by the Cypriot fleet in 213 was 5.3 million, a decrease of around 56% compared to 28 results. 1 This National Chapter is built on data that by experts has been judged as questionable regarding both coverage and quality. Results should therefore be treated carefully! 2 There was no national expert present at both EWG meetings to assess the final data and to provide insight on the development trends of the Cypriot fishing fleet. 164
167 GT, kw (thousands) no. of vessels, employment thousand days million litres 214 Annual Economic Report on the EU Fishing Fleet In 212, albacore obtained the highest landed value (.78 million), followed by bogue (.74 million) and surmullets (.69 million). In terms of volume, in 212 albacore was also the most common species landed in terms of weight (317 tonnes), followed by picarels (95 tonnes) and bogue (89 tonnes) million / thousand tonnes Landings value (million ) Vessel tonnage Vessel power No. Vessels FTE Total employed Landings value Landings weight Landings income Landings weight (thousand tonnes) Average price ( /kg) Days at sea Fishing days Energy consumption Albacore Bogue Picarels Spinefeet Surmullet Albacore Bogue Picarels Spinefeet Surmullet Albacore Bogue Picarel Spinefeet Surmullet Figure Cypriot fleet: main trends for the period Data source: DCF 214 Fleet Economic (MARE/A3/AC(214)); data for 213 are provisional. Top left capacity and employment; top right fishing effort and fuel consumption; middle left landings in value and weight; middle right average landed prices of top 5 species in terms of landed value in 212; bottom left - top 5 species in terms of value landed in 212; and bottom right landed weight of top 5 species in terms of value landed in 212. The average first sale price of the key value species landed by the Cypriot fleet registered an overall increase in 212 compared to 211, apart from picarels and spinefeet. Surmullet and spinefeet attained the highest average prices, around 2 and 15 per kilo in 212, respectively. National Fleet Economic performance The total amount of income generated by the Cypriot national fleet in 212 was 6.7 million. The total income of the Cypriot fleet decreased 49% between 28 and 212. Total operating costs amounted to 11.1 million in 212. The largest expenditure items were other variable costs ( 4.5 million) and energy costs ( 3 million). 165
168 National Chapters In 212 the total operating costs of the Cypriot fleet increased 18% from 211 from 29 essentially due to a significant increase in labour costs (Table 5.4.2; Figure 5.4.2). In terms of profitability, the Cypriot national fleet in 212 generated a negative GVA of 2.7 million and a gross loss of 4.4 million. The data indicates that the profitability of the Cypriot fleet has significantly deteriorated since 28. However, this deterioration coincides with a sharp increase in capital costs, which increased by 325% between 28 and 29, and further increased substantially over the period Furthermore, estimates provided on the replacement value of the Cypriot fleet also appear to be grossly overestimated (for example, they are higher than the values estimated for the Danish fleet). These data inconsistencies do not confer data reliability, especially in regards to the estimates of net profit. Table Cypriot national fishing fleet economic performance in and projections for 213. Development trend based on % net profit margin 212 to average net profit margin Arrows indicate change ( ) 212 to 211: ( ) increase; ( ) decrease and ( ) stable/no change ( between -1 and +1%) Variable (million ) National Fleet % Income Costs Economic Indicators Capital value Profitability and development trends Landings income % Other income Labour costs % Energy costs % Repair costs % Other variable costs % Other non-variable costs % Capital costs % GVA % Gross profit % Net profit % Depreciated replacement value % Investments % Net profit margin (%) % development trend Deteriorated -141% RoFTA (%) % development trend Improved 38% GVA per FTE (thousand ) % development trend Deteriorated -2% Data source: DCF 214 Fleet Economic (MARE/A3/AC(214)); data for 213 are provisional. Fleet Segment Level Economic performance The Cypriot national fleet consisted of 6 (DCF, clustered) fleet segments in 212, targeting different species predominantly in the Mediterranean Sea. A breakdown of the key performance indicators for 212 by main fishing activity is provided in Table and Table Table provides a breakdown of key performance indicators for each fleet segment in 212. A short description of the two most important is provided below. Passive gears 6 12m 437 vessels make up this segment and are based in the Mediterranean Sea. These vessels usually target species such as bogue, surmullet and parrotfish. The total value of landings in 212 was about 4.38 million and around 612 FTEs were employed in the fleet segment in 212. This segment made losses in 212, generating a negative GVA of.44 million and a net loss of 4 million. 166
169 214 Annual Economic Report on the EU Fishing Fleet PGP VL vessels based in the Mediterranean Sea make up this segment and target species such as sargo breams, albacore and swordfish. The total value of landings was around 1.29 million and around 64 FTEs were employed in the fleet segment in 212. This segment made losses in 212, generating a net loss of 3 million. Performance indicators (million ) million Landings income Other income Revenue GVA Gross profit Net profit million Crew wage costs Unpaid labour Energy costs Repair costs Other variable costs Other non-variable costs Annual depreciation % GVA to Revenue Gross profit margin Net Profit margin RoFTA Data source: DCF 214 Fleet Economic (MARE/A3/AC(214)); data for 213 are provisional. Figure Cypriot fleet main economic performance trends for the period Top left income structure; top right cost structure; bottom left economic performance indicators; bottom right performance indicators as a % of revenue (landings income + other income) (projected figures for 213). Assessment and Future Trends There was no national expert present at both EWG meetings to comment on and provide insight on the development trends of the Cypriot fishing fleet over the time series analysed. A longer trend of the main indicators analysed, including data from the Data Collection Regulation (DCR, 22-27) is provided at the end of this chapter. Data issues Data quality and completeness is questionable. However, there was no national expert present at both EWG meetings to assess the quality of the final data submitted and to provide insight on the development trends of the Cypriot fishing fleet. 167
170 Table Cypriot national fleet structure, activity and production trends by operational scale: Arrows indicate change ( ) 212 to 211: ( ) increase; ( ) decrease and ( ) stable/no change ( between -1 and +1%) Structure Employment Fishing Effort Output Variable Small scale Fleet % Large scale fleet National Chapters No. Vessels (#) % % Vessel tonnage (thousand GT) % % Vessel power (thousand kw) % % Total employed (#) 1, ,288 1,191 1,25 1,229 1% FTE (#) 1, % % Average wage per employed (thousand ) % % Average wage per FTE (thousand ) % Days at sea (thousand days) % Fishing days (thousand days) Energy consumption (milion litres) Energy consumption per landed tonne (l/t) 975 2,129 1,728 2,718 4,186 2,571 % Landings weight (thousand tonnes) % % Landings value (million ) % % Data source: DCF 214 Fleet Economic (MARE/A3/AC(214)); data for 213 are provisional. Table Economic performance of the Cypriot national fishing fleet by operational scale: Arrows indicate change ( ) 212 to 211: ( ) increase; ( ) decrease and ( ) stable/no change ( between -1 and +1%) Variable (million ) Small scale Fleet % Large scale fleet % Income Costs Economic Indicators Capital value Profitability and development trends Landings income % % Other income Labour costs % % Energy costs % % Repair costs % % Other variable costs % % Non-variable costs % % Capital costs % % GVA % % Gross profit % % Net profit % % Depreciated replacement value % % Investments % % Net profit margin (%) % % development trend Deteriorated -134% Deteriorated -45% RoFTA (%) % % development trend Deteriorated -19% Improved 4% GVA per FTE (thousand ) % % development trend Deteriorated -296% Improved 92% Data source: DCF 214 Fleet Economic (MARE/A3/AC(214)); data for 213 are provisional. 168
171 214 Annual Economic Report on the EU Fishing Fleet Table Main socio-economic performance indicators by fleet segment in the Cypriot national fishing fleet in 212. Development trend based on % net profit margin 212 to average net profit margin Arrows indicate change ( ) 212 to 211: ( ) increase; ( ) decrease and ( ) stable/no change ( between -1 and +1%) Fleet segment No. of vessels (N) % FTE (N) % Days at sea (days) % Energy consumption (litres) % Value of landings (thousand ) % Weight of landings (thousand tonnes) % GVA (thousand ) % GVA per FTE ( /FTE) % Gross profit (thousand ) % Net profit (thousand ) % Net profit margin (%) % Profitability (212) Net profit margin % 212 average (28-11) Economic development trend CYPAREA37DTSVL % 21 % 143 3% 124-8% % % % % % Weak -82% Deteriorated CYPAREA37PGOVL % 57 % CYPAREA37PGOVL % 15 % CYPAREA37PGPVL % 64 % % % 12 15%.2 15% % % % Weak -8% Deteriorated CYPAREA37PGVL % 48-1% % % % % % Weak -25% Deteriorated CYPAREA37PGVL % 612 3% % % % % % % % Weak -128% Deteriorated Data source: DCF 214 Fleet Economic (MARE/A3/AC(214)) 169
172 million Performance indicators (miilion ) % Landings value (million ) GT, kw (thousands) Vessel power Vessel tonnage No. Vessels FTE Albacore Bogue Picarel Spinefeet Surmullet Landings income Other income Direct income subsidies Fishing rights income No. of vessels, FTE (thousand) Thousand days Landings value (million ) Days at sea Fishing days Energy consumption Albacore Bogue Picarel Spinefeet Surmullet Income GVA Gross profit Net profit 1 Million litres million / thousand tonnes Landings weight (tousand tonnes) National Chapters Landings value Landings weight Landings income Albacore Bogue Picarel Spinefeet Surmullet 1% % -1% -2% -3% -4% GVA to Revenue Net profit margin 17
173 214 Annual Economic Report on the EU Fishing Fleet 5.5 DENMARK Fleet Structure, Fishing Activity and Production In 212, the Danish fishing fleet consisted of 2,52 registered vessels, with a combined gross tonnage of 62 thousand GT, engine power of 213 thousand kw and an average age of 3 years. The number of registered fishing vessels decreased 23% between 211 and 212, with GT and kw decreasing 8% and 11% respectively (Table 5.5.1, Figure 5.5.1), due to a cleaning up of inactive vessels in the register. The regulation that initiated this process was the introduction of a yearly fee for registering. The total landings decreased 3% between 211 and 212, caused mainly by a large reduction in the quota of sandeel. This also affected the total value of landings, which decreased by 9%. In 212, the number of fishing enterprises in the Danish fleet totalled 1,492, with the vast majority (95%), owning a single vessel. Total employment in 212 was estimated at 1,469 jobs, corresponding to 1,556 FTEs. The reason that the FTE is higher than the number of jobs is that the FTE s is estimated based on the DKstandard that a full working year consists of 1,665 working hours. However, in reality the yearly working hours in the Danish fishing fleet is more likely to be around 2 hours. The total employed increased by 1% between 211 and 212 and the number of FTEs decreased by 6%. Table Danish national fleet structure, activity and production trends: Arrows indicate change ( ) 212 to 211: ( ) increase; ( ) decrease and ( ) stable/no change ( between -1 and +1%) Output Fishing Effort Employment Structure Variable NATIONAL FLEET % Total No. Vessels (#) % No. of Inactive vessels (#) % Average vessel age (year) % Vessel tonnage (thousand GT) % Vessel power (thousand kw) % No. of Enterprises (#) % Total employed (#) % FTE (#) % Average wage per employed (thousand ) % Average wage per FTE (thousand ) % Days at sea (thousand days) % Fishing days (thousand days) % Energy consumption (milion litres) % Energy consumption per landed tonne (l/t) % Landings weight (thousand tonnes) % Landings value (million ) % Data source: DCF 214 Fleet Economic (MARE/A3/AC(214)); data for 213 and 214 are provisional. In 212, the Danish fleet spent a total of around 114 thousand days at sea. The total number of days at sea decreased 1% between 211 and 212. In 212, the total volume landed by the Danish fleet was 499 thousand tonnes of seafood, with a landed value of 378 million. The total volume and value of landings decreased from 211 to 212 by 3% and 9% respectively. The major factor causing the volume and value to decrease was a significant decrease (around 8%) in the sandeel quota in 212. Sandeel is an important species for the Danish industrial fisheries. Price decreases for Atlantic mackerel and Norway lobster also played a part (Figure 5.5.1). In 212, Atlantic herring generated the highest landed value ( 86 million) by the national fleet, followed by Atlantic cod ( 5 million), Atlantic mackerel ( 36 million), European sprat ( 33 million) and Norway lobster 171
174 Average price ( /kg) GT, kw (thousands) no. of vessels, employment thousand days Energy consumption (million litres) National Chapters ( 29 million). In terms of landings weight in 212, Atlantic herring accounted for 125 thousand tonnes, European sprat for 112 thousand tonnes and Atlantic mackerel for 36 thousand tonnes (Figure 5.5.1) million / thousand tonnes Landings value (million ) Vessel tonnage Vessel power No. Vessels Landings value Landings weight Landings income Atlantic cod Atlantic herring Atlantic mackerel European sprat Norway lobster Figure Danish fleet: main trends for the period Landings weight (thousand tonnes) Days at sea Fishing days Energy consumption Atlantic cod Atlantic mackerel Norway lobster Atlantic herring European sprat Atlantic cod Atlantic herring Atlantic mackerel European sprat Norway lobster Data source: DCF 214 Fleet Economic (MARE/A3/AC(214)); data for 213 are provisional. Top left capacity and employment; top right fishing effort and fuel consumption; middle left landings in value and weight; middle right average landed prices for top 5 species in terms of value landed in 212; bottom left - top 5 species in terms of value landed in 212; and bottom right landed weight of top 5 species in terms of value landed in 212. The prices obtained for herring and sprat increased both by 24% between 211 and 212, while the prices for mackerel, Norway lobster and cod decreased by 4%, 21% and 9% respectively. A minor explanation for the price increase of mackerel was a 5% decrease in landed mackerel in the North East Atlantic from 211 to 212, which changed the balance between supply and demand and increased the prices. Norway lobster achieved the highest average price per kilo in 212 ( 7.8 per kg), followed by Atlantic cod ( 1.7 per kg). 172
175 214 Annual Economic Report on the EU Fishing Fleet National Fleet Economic performance The total amount of income generated by the Danish fleet in 212 was 385 million. This consisted of 378 million in landings value and 7 million in non-fishing income. The Danish fleet s total income decreased 2% between 211 and 212. Total operating costs incurred by the Danish national fleet in 212 equated to 248 million, amounting to 66% of total income. Labour cost and fuel costs, the two major fishing expenses, accounted for 16 and 56 million respectively (Table 5.5.2). Between 211 and 212, total operating costs decreased by 5%, largely due to decreased labour. Table Danish national fishing fleet economic performance in Development trend based on % net profit margin 212 to average net profit margin Arrows indicate change ( ) 212 to 211: ( ) increase; ( ) decrease and ( ) stable/no change ( between -1 and +1%) Variable (million ) National Fleet % Income Landings income % Other income % Labour costs % Energy costs % Costs Repair costs % Other variable costs % Other non-variable costs % Capital costs % Economic Indicators Capital value Profitability and development trends GVA % Gross profit % Net profit % Depreciated replacement value % Investments % Net profit margin (%) % development trend Improved 35% RoFTA (%) % development trend Improved 87% GVA per FTE (thousand ) % development trend Improved 28% Data source: DCF 214 Fleet Economic (MARE/A3/AC(214)); data for 213 are provisional. In terms of economic performance, the total amount of Gross Value Added (GVA), gross profit and net profit generated by the Danish national fleet in 212 were 242 million, 137 million and 5 million, respectively. Gross Value Added (GVA) decreased 3% between 211 and 212, while gross profit and net profit increased 2% and 11% respectively in the same period. In 212, the Danish fleet had an estimated (depreciated) replacement value of 514 million and an estimated value of fishing rights of 1.3 billion. Investments by the fleet amounted to 73 million in 212. Factors causing a change in the capital value of the fleet include variation in investments from year to year and the variation in the value of fishing rights (Table 5.5.2). 173


176 Performance indicators (million ) million Landings income Other income Revenue GVA Gross profit Net profit million % National Chapters Crew wage costs Unpaid labour Energy costs Repair costs Other variable costs Other non-variable costs Annual depreciation GVA to Revenue Gross profit margin Net Profit margin RoFTA Data source: DCF 214 Fleet Economic (MARE/A3/AC(214)); data for 213 are provisional. Figure Danish fleet main economic performance trends for the period Top left income structure; top right cost structure; middle left cost items as a percentage of income (fishing income and other income); middle right economic performance indicators; bottom performance indicators as a % of revenue (landings income + other income). Fleet Segment Level Economic performance The Danish fleet is highly diversified with a broad range of vessel types operating and targeting different species predominantly in the North Sea, Baltic Sea and North Atlantic (Figure 5.5.3). The national fleet consisted of 19 DCF fleet segments in 212, consisting of 1,537 active vessels. 13 of the active fleets made losses in 212, while 6 made an overall profit. Figure Danish fleet fishing effort by FAO fishing area, 212 Colour shows fishing days (thousand days) and landings in weight (thousand tonnes); Value shows days-at-sea (thousand days) and landings in value (thousand ). Source: DCF 214 Fleet Economic (MARE/A3/AC(214)) 174
177 214 Annual Economic Report on the EU Fishing Fleet A breakdown of the key performance indicators by main fishing activity is provided in Table and Table Table provides a breakdown of key performance indicators for all 19 fleet segments in 212. A short description of the three most important segments in terms of total value of landings is provided below (Table 5.5.5). Demersal trawl / seine 18-24m 64 vessels make up this segment which operates predominantly in the North Sea and Skagerrak. The fleet targets a variety of species but in particular demersal species, such as cod, plaice and Norway lobster. In 212, the total value of landings was around 42 million and 254 FTEs were employed in this fleet segment, contributing to 11% and 16% of the total income from landings generated and FTEs in the Danish fishing fleet, respectively. This fleet had a gross profit of 7.7 million and net profit of -45 thousand in 212. The gross profit of the fleet decreased with 32% from Demersal trawl / seine 24-4m 38 vessels make up this segment which operates predominantly in the North Sea and Skagerrak. The fleet targets a variety of species but in particular cod, saithe and Northern Prawn. In 212, the total value of landings was around 55 million and 242 FTEs were employed in this fleet segment, contributing to 15% and 16% of the total income from landings and FTEs generated by the Danish fishing fleet, respectively. This fleet had a gross profit of 15.5 million and net profit of -.2 million in 212. The gross profit of the fleet increased with 11% from , while the net profit went from positive to negative. Pelagic trawl >4m 17 vessels make up this segment which operates predominantly in the North Sea and in the Norwegian Sea. The fleet targets pelagic species for consumption (mackerel and herring) as well as reduction species such as sandeel, sprat and blue whiting. In 212, the total value of landings was around 125 million and 131 FTEs were employed in this fleet segment, contributing to 33% and 8% of the total income from landings and FTEs generated by the Danish fishing fleet, respectively. This fleet segment was profitable, with a reported gross profit of around 84 million and net profit of 46 million in 212. Small scale / large scale fleet The small scale fleet, which is defined as vessels below 12 meters using static gears, operate mostly in the Baltic Sea, the sounds and Kattegat. In 212, the small scale fishing fleet consisted of 1,75 registered vessels, with a combined gross tonnage of 4.1 thousand tonnes and engine power of 43 thousand kw. The size of the small scale fleet decreased between 211 and 212 regarding number of vessels, GT and kw, all decreasing 2% (Table 5.5.3). The total amount of income generated by the small scale fleet accounted for 27 million in 212, which is 7% of the national income for fisheries. The landings value generated by the Danish small scale fleet has increased with 5% from Total operating costs incurred by the small scale fleet in 212 equated to 28 million, amounting for more than the total income. Crew costs are a major fishing expense for the small scale fleet and accounted for 14 million in 212. Between 211 and 212, total operating costs increased by 4%, largely due to an increase in other variable costs ( Table 5.5.4). The small scale fleet made a loss in 212 with gross profit and net profits of -.9 million and million respectively. The loss in gross profit decreased 52% from 211 to 212, while the net loss decreased 15%. The reduction in loss is mainly due to increased productivity, in terms of CPUE. The Danish large scale fleet target a large variety of species including codfish, flatfish, Norway lobster, herring, mackerel, sprat and sandeel in the Baltics Sea, the sounds, Kattegat, Skagerrak, the North Sea and the Norwegian Sea. In 212, the large scale fishing fleet consisted of 462 registered vessels, with a combined gross tonnage of 56.2 thousand GT and engine power of thousand kw. The size of the large scale fleet decreased between 211 and 212, with the number of vessels and vessel power decreasing 8% and with GT decreasing 5% (Table 5.5.3). The total amount of income generated by the large scale fleet accounted for 353 million in 212, which is 93% of the national income for fisheries ( Table 5.5.4). The landings value generated by the Danish large scale fleet has decreased by 3% from Total operating costs incurred by the small scale fleet in 212 equated to 221 million. Of these, crew costs and energy costs are the major fishing expenses for the large scale fleet and accounted for 92 million and 54 million in 212. Likewise, capital costs are a major expense for the large scale fleet and amount to 82 million. Between 211 and 212, total operating costs decreased by 5%, while capital costs decreased by 3% ( 175
178 National Chapters Table 5.5.4). The large scale fleet have in 212 increased their gross profit and net profit of 1.9 million and 4. million, corresponding to an increase in gross profit of 1.4% and 7.8% respectively. A major reason for the increasing profitability is the increased prices on Atlantic herring. Another reason is the decreasing capital costs that arise as a result of decreasing fishing capacity. Table Danish small and Large scale fleet structure, activity and production trends: Arrows indicate change ( ) 212 to 211: ( ) increase; ( ) decrease and ( ) stable/no change ( between -1 and +1%) Output Fishing Effort Employment Structure Variable Small scale Fleet % Large scale fleet % No. Vessels (#) 1,228 1,23 1,118 1,12 1,75-2% % Vessel tonnage (thousand GT) % % Vessel power (thousand kw) % % Total employed (#) % 1,38 1,317 1,195 1,119 1,123 % FTE (#) % 1,682 1,535 1,523 1,385 1,34-6% Average wage per employed (thousand ) % % Average wage per FTE (thousand ) % % Days at sea (thousand days) % % Fishing days (thousand days) % % Energy consumption (milion litres) % % Energy consumption per landed tonne (l/t) % % Landings weight (thousand tonnes) % % Landings value (million ) % % Table Danish small scale and large scale fishing fleet economic performance in Arrows indicate change ( ) 212 to 211: ( ) increase; ( ) decrease and ( ) stable/no change ( between -1 and +1%) Variable (million ) Small scale Fleet % Large scale fleet % Income Costs Economic Indicators Capital value Profitability and development trends Landings income % % Other income % % Labour costs % % Energy costs % % Repair costs % % Other variable costs % % Non-variable costs % % Capital costs % % GVA % % Gross profit % % Net profit % % Depreciated replacement value % % Investments % % Net profit margin (%) % % development trend Improved 41% Improved 158% RoFTA (%) % % development trend Improved 45% Improved 9% GVA per FTE (thousand ) % % development trend Improved 23% Improved 27% Assessment and Future Trends Overall, the Danish fleet consists of 19 fleet segments, covering both static and active gears and targeting both demersal and pelagic species. The capacity of the Danish fleet has decreased from , when 176
179 214 Annual Economic Report on the EU Fishing Fleet measured in terms of number of active vessels, total gross tonnage or total kilowatt. The same did the employment, measured in terms of Full Time Equivalents (FTE). Thereby, the trend of decreasing FTE from continued. If the current trend towards fewer vessels and less fishing capacity continue, the employment in the Danish fishery is also likely to decrease. In economic terms, the profitability (in terms of both gross and net profits) has increased by 2% and 11% respectively from This gain is driven by the large scale fleet, whereas the small scale fleet is experiencing a minor loss. However, the profitability of the small scale fleet has improved during the last 5 years. The same positive trend of increasing profitability is the case for the large scale fisheries and could be the effect of the Vessel Quota Share (VQS) system that was introduced in 1st January 27. A longer trend of the main indicators analysed, including data from the Data Collection Regulation (DCR, 22-27), is provided at the end of this chapter. Data issues The 212 value of fishing rights has been calculated based on all registered privately owned quota shares. Previously the calculation has been based on a sample. The new comprehensive gives a much better coverage of the quota value, and has changed the level from 74 million to 1.3 billion. But the result has to be seen as preliminary, as the shadow prices used in the estimations are based on the calculated gain in profit on the individual level instead of the macro level 177
180 National Chapters Table Main socio-economic performance indicators by fleet segment in the Danish national fishing fleet in 212. Development trend based on % net profit margin 212 to average net profit margin Arrows indicate change ( ) 212 to 211: ( ) increase; ( ) decrease and ( ) stable/no change ( between -1 and +1%) Fleet segment No. of vessels (N) % FTE (N) % Days at sea (days) % Energy consumption (litres) % Value of landings (thousand ) % Weight of landings (thousand tonnes) % GVA (thousand ) % GVA per FTE ( /FTE) % Gross profit (thousand ) % Net profit (thousand ) % Net profit margin (%) % Profitability (212) Net profit margin % average (28-11) Economic development trend DNKAREA27DRBVL % 15-12% % 424-3% % % % % % % -1 77% Weak 88% Improved DNKAREA27DRBVL % 3 37% 234 1% % % % % % % % -9 33% Weak 65% Improved DNKAREA27DTSVL1 1-29% 3-73% 552-7% 81-75% 298 4% % % 5.8-2% -24 5% -88 7% -24 2% Weak 54% Improved DNKAREA27DTSVL Weak 41% Improved DNKAREA27DTSVL % % % % % % % % % % % Weak 44% Improved DNKAREA27DTSVL % 254-5% 1116 % % % % % % % % -12% Weak -117% Deteriorated DNKAREA27DTSVL % 242 % 8531 % 259 4% % % % % % % -112% Weak -114% Deteriorated DNKAREA27DTSVL4XX 12-61% 62-73% % % % % % % % % 31 3% High 8% Improved DNKAREA27PGPVL % 15-28% % % 147-9% 552-1% % % % % % Weak 48% Improved DNKAREA27PGPVL % 39-9% % % % 237-1% % % % % % Weak 38% Improved DNKAREA27PGPVL % 81-3% % % % % 639-3% 74.6 % % % % Weak 22% Improved DNKAREA27PMPVL Weak DNKAREA27PMPVL % 27 4% % % % % 1398 % % 7-89% -745 % % Weak 51% Improved DNKAREA27PMPVL % 63 3% % % % % % % % % -4 51% Weak 51% Improved DNKAREA27PMPVL % 66-23% % % % % % % % % 4-2% Reasonable 27% Improved DNKAREA27TBBVL % 3 9% % % % % % % % % 1 134% Reasonable 153% Improved DNKAREA27TBBVL % 55 59% % % % % % % % % 1 139% High 158% Improved DNKAREA27TMVL Reasonable DNKAREA27TMVL4XX High Data source: DCF 214 Fleet Economic (MARE/A3/AC(214)). 178
181 Landings weight (tousand tonnes) million % GT, kw (thousands) no. vessels, employed (thousands) thousand days Energy consumption (million litres) million / thousand tonnes 214 Annual Economic Report on the EU Fishing Fleet Vessel power Vessel tonnage FTE No. Vessels Days at sea Fishing days Energy consumption Landings value Landings weight Landings income Landings value (million ) Atlantic cod Atlantic mackerel Norway lobster Atlantic herring European sprat 212 Performance indicators (miilion ) Income GVA Net profit 212 Landings value (million ) Atlantic cod Atlantic herring Atlantic mackerel European sprat Norway lobster 8% 5 5 6% % 2% 1 1 % -2% Atlantic cod Atlantic herring Atlantic mackerel European sprat Norway lobster Landings income Direct income subsidies Other income Fishing rights income GVA to Revenue Net profit margin 179
182 National Chapters 5.6 ESTONIA 1 Fleet Structure, Fishing Activity and Production In 213, the Estonian fishing fleet consisted of 1,349 registered vessels, with a combined gross tonnage of 15.2 thousand GT, a total power of 46.6 thousand kw and an average age of 2 years. The size of the Estonian fishing fleet decreased between 28 and 212; the number of vessels decreased by 3% and GT and kw decreased by 36% and 27%, respectively (Table 5.6.1; Figure 5.6.1). The main reason for changes in the structure of the national fleet was capacity reduction due to a decommissioning program aimed at achieving balance between the size of the fishing fleet and available fishing opportunities. The decrease mainly took place among trawlers, explaining why the decrease in total fleet GT and kw is greater than the total number of vessels. The number of vessels started to increase in 213, mainly in the small scale fleet. As an amount of fishing capacity had been released in other fleet segments, the Ministry of Agriculture decided to use that capacity to meet the additional need of small scale fishing boat entry into the register. Due to confidentiality issues, only capacity data for the deep sea fleet (DTS VL4XX) are reported. In 213, the number of fishing enterprises in the Estonian fleet totalled 1,5, with the vast majority (8%) owned a single vessel. Around 2% of the enterprises owned two to five fishing vessels. Total employment in 212 was estimated at 2,46 jobs, corresponding to 54 FTEs. The level of employment decreased between 28 and 212, with total employed decreasing by 32%. There was a significant drop in the total number employed between 28 and 29. The decline occurred mainly in the small scale coastal sector, due to the fact that it became compulsory for all fishermen dealing with commercial fishing to hold a professional certificate. However, the number of employed shows slight increase since 29 (Table 5.6.1). Table Estonian national fleet structure, activity and production trends: Arrows indicate change ( ) 212 to 211: ( ) increase; ( ) decrease and ( ) stable/no change ( between -1 and +1%) Variable NATIONAL FLEET % Output Fishing Effort Employment Structure Total No. Vessels (#) ,349-1% 1,447 No. of Inactive vessels (#) % 6 Average vessel age (year) % 2 Vessel tonnage (thousand GT) % 13.4 Vessel power (thousand kw) % 44.1 No. of Enterprises (#) ,5 % Total employed (#) 3,2 1,895 1,948 1,993 2,46 2,88 3% FTE (#) % Average wage per employed (thousand ) % Average wage per FTE (thousand ) % Days at sea (thousand days) % Fishing days (thousand days) % Energy consumption (milion litres) % Energy consumption per landed tonne (l/t) % Landings weight (thousand tonnes) % Landings value (million ) % % Data source: DCF 214 Fleet Economic (MARE/A3/AC(214)); data for 213 are provisional. 1 This National Chapter is built on data that has been judged, at least in part, as questionable by experts regarding both coverage and quality. Results should therefore be treated carefully! 18
183 GT, kw (thousands) no. Vessels, employment (thousand) thousand days million litres 214 Annual Economic Report on the EU Fishing Fleet The weight landed by the Estonian Baltic Sea fleet in 212 was 53 thousand tonnes of seafood, with a landed value of 14 million. The total volume of landings decreased over the period analysed. However, the total value of landings was stable compared to 211. In 212, European sprat generated the highest landed value ( 5.7 million) by the national fleet, followed by Atlantic herring ( 4.9 million) and European perch ( 1.3 million). In terms of landings weight, European sprat landings were 28.3 thousand tonnes, Atlantic herring landings were 22.5 thousand tonnes and Atlantic cod landings were.7 thousand tonnes. The decrease in quotas for the internationally TAC regulated species (European sprat and Atlantic herring) was the main reason for decreases in total weight landed. The decrease in total landings weight and persistent demand were the main reasons for price rises in key species. The decrease in quotas also affected vessel energy consumption levels (Figure 5.6.1). million / thousand tonnes Landings value (million ) Vessel power Vessel tonnage No. Vessels FTE Total employed Landings value Landings weight Landings income Atlantic cod Atlantic herring European perch European sprat Pike-perch Figure Estonian fleet: main trends for the period Average price ( /kg) Landings weight (thousand tonnes) Days at sea Fishing days Energy consumption Atlantic cod Atlantic herring European perch European sprat Pike-perch Atlantic cod Atlantic herring European perch European sprat Pike-perch Data source: DCF 214 Fleet Economic (MARE/A3/AC(214)); data for 213 are provisional. Top left capacity and employment; top right fishing effort and fuel consumption; middle left landings in value and weight; middle right average landed prices of top 5 species in terms of value landed in 212; bottom left landed value of top 5 species in terms of value landed in 212; and bottom right landed weight of top 5 species in terms of value landed in The prices obtained for these key species generally increased between 28 and 212. Pike-perch achieved the highest average price per kilo in 212 ( 4.39 per kg), followed by European perch ( 2.42 per kg). In terms 181
184 National Chapters of turnover, sprat accounted for 41% of the total landings value in 212, followed by Atlantic herring at 35% and European perch with 1%. National Fleet Economic performance The total amount of income generated by the Estonian national fleet in 212 was 13.9 million. This consisted of 13.8 million in landings value and.1 million in non fishing income (Table 5.6.2). The total income of the Estonian fleet decreased 11.5% between 28 and 212 (Figure 5.6.2). Decreases in landing volumes were the main reason for this trend. Total expenditure by the Estonian national fleet in 212 was 12 million, amounting to 86% of total income. The largest expenditure items were crew wages ( 5 million) and fuel costs ( 3.1 million) (Table 5.6.2). Between 28 and 212, the total expenditure of the Estonian remained relatively stable. In terms of profitability, the total amount of GVA, gross profit and net profit generated by the Estonian national fleet in 212 was 7.7 million, 2.7 million and 2.1 million, respectively (Table 5.6.2; Figure 5.6.2). Compared to 28, the total amount of GVA and net profit decreased 21% and 4% in 212, respectively. In 212, the Estonian fleet had an estimated capital value of 16.6 million and an investment of 1.6 million. Table Estonian national fishing fleet economic performance in and projections for 213. Development trend based on % net profit margin 212 to average net profit margin Arrows indicate change ( ) 212 to 211: ( ) increase; ( ) decrease and ( ) stable/no change ( between -1 and +1%) Variable (million ) National Fleet % Income Costs Economic Indicators Capital value Profitability and development trends Landings income % Other income % Labour costs % Energy costs % Repair costs % Other variable costs % Other non-variable costs % Capital costs % GVA % Gross profit % Net profit % Depreciated replacement value % Investments % Net profit margin (%) % development trend Improved 14% RoFTA (%) % development trend Deteriorated -32% GVA per FTE (thousand ) % development trend Stable -1% Data source: DCF 214 Fleet Economic (MARE/A3/AC(214)); data for 213 are provisional. 182


185 214 Annual Economic Report on the EU Fishing Fleet million 1 million 5 Performance indicators (million ) Landings income Other income Direct income subsidies Fishing rights income Revenue GVA Gross profit Net profit % Crew wage costs Unpaid labour Energy costs Repair costs Other variable costs Other non-variable costs Annual depreciation GVA to Revenue Gross profit margin Net Profit margin RoFTA Data source: DCF 214 Fleet Economic (MARE/A3/AC(214)); data for 213 are provisional. Figure Estonian fleet main economic performance trends for the period Top left income structure; top right cost structure; middle left cost items as a percentage of income (fishing income and other income); middle right economic performance indicators; bottom performance indicators as a % of revenue (landings income + other income) (projected figures for 213). Fleet Segment Level Economic performance The Estonian fleet is highly diversified with a broad range of vessel types operating and targeting different species predominantly in the Baltic Sea and North Atlantic (data provided on the fleet operating in the North Atlantic is limited). Figure Estonian fleet effort and landings by FAO fishing area, 212. Colour shows fishing days (thousand days) and landings in weight (thousand tonnes); Value shows days-at-sea (thousand days) and landings in value (thousand ). Source: DCF 214 Fleet Economic (MARE/A3/AC(214)) Figure provides a spatial distribution of effort and landings by the Estonian fleet in 212. Table and Table provide a breakdown of the main performance indicators by small and large-scale fleet segments. 183
186 National Chapters A short description of both main fishing activities is provided below. The national fleet consisted of 5 active fleet segments in 212. Table provides a further breakdown of the key performance indicators for all the Estonian fleet segments in 212. Small-scale fleet The number of vessels in the small scale fleet remained stable between 28 and 212 (around 88 vessels), but increased 5% in 213 (1,3 vessels). This was a result of fishermen getting additional possibilities to bring vessels into the fishing vessel register. There was a significant drop in the total number employed in 28 (from 2,727 to 1,646). The decline occurred because it became mandatory for all fishermen to hold a professional certificate. The number of employed has demonstrated increases since 29. Generally the total weight of landings decreased over the period, but the value of landings increased. This shows rise in average prices of key species. Energy prices have increased. The fleet has been profitable (Table 5.6.3; Table 5.6.4). Large-scale fleet The size of the fleet has decreased 42% between 28 and 213 (from 64 to 37 vessels). The main reason for that change was capacity reduction to achieve balance between the size of the fishing fleet and fishing opportunities. The decrease in quotas for the internationally regulated species (European sprat and Atlantic herring) was the main reason for decreases in total weight landed. Compared to previous years economic indicators (GVA, net profit) decreased in 212. The energy prices have increased. The fleet has been profitable (Table 5.6.3; Table 5.6.4). A short description of the two most important segments in the Baltic Sea is provided below. The 24 4m pelagic trawlers are the most important segment in the Estonian fishing fleet in the Baltic Sea. In 212 this fleet segment consisted of 29 active vessels accounting for a total of 3836 GT and 9485 kw. The number of vessels decreased 9% between 211 and 212 and total kw and GT followed a broadly similar trend. The employment in 212 was estimated at 174 jobs, corresponding to 169 FTEs. The segment targets pelagic species such as European sprat and Atlantic herring. The total value of landings was 9.2 million in 212. The fleet segment was profitable, with a reported gross profit of around 947 thousand and net profit of 441 thousand in 212. The segment with the highest number of vessels and employment in the Estonian fleet is the 1m passive gears segment that operates in the coastal fishery. In 212 this segment consisted of 786 vessels accounting for a total 1,133 GT and 9939 kw. The number of vessels in this segment was stable between 211 and 212. The employment in 212 was estimated at 1,538 jobs, corresponding to 256 FTEs. The fleet targets mostly freshwater species, such as Pike perch, European perch, but also marine species such as European flounder and Atlantic herring. The total value of landings was 3.3 million in 212. This fleet segment was profitable, with a reported gross profit of around 1.2 million and net profit of 1 million in 212. Assessment and Future Trends The main management measures in Estonia are volume quotas (ITQs) in the open water fisheries (both Baltic and Atlantic trawling) and gear usage quotas (ITE; individual transferable effort) in the Baltic coastal fisheries. The Estonian experience shows that ITQs can be considered an effective method for increasing the allocation of fishing rights to the most effective enterprises and speeding the process of reducing excessive fleet capacity. The number of trawlers decreased significantly during the ITQ period, since 21. There were 189 vessels in the trawling sector in 2, and after 14 years this number decreased to 38 and is likely to decrease even further. However, the total number of vessels in the Estonian national fleet increased in 213. The increase took place in the small scale fleet. As an amount of fishing capacity was released in other fleet segments the Ministry of Agriculture decided to use that in order to meet the additional need for the entry of small scale fishing vessels into the register. The year 212 was characterised by a continued decrease in fishing quotas (in particular, European sprat) and an increase in operating expenses. However, the decrease in sales was offset by the rise in first sales prices of fish (sprat and herring) compared to the preceding year. The higher first sales prices were primarily due to 184
187 214 Annual Economic Report on the EU Fishing Fleet good export conditions. To increase sales and profits and alleviate the shortage of raw material, several Estonian fishing companies acquired subsidiaries in Finland and Lithuania. While no significant catch figures can be reported for the Lithuanian subsidiaries in 212, in Finland the fishing vessels owned by Estonians caught nearly a third of the sprat and herring quota of Finland, i.e. around 4 thousand tonnes of fish. Herring caught in Bothnian Bay accounted for most of the catch (around 3 thousand tonnes). Fisheries subsidies paid in 212 to fishing companies for permanent cessation of fishing activities by scrapping or permanent reassignment of fishing vessels amounted to 25,946 euros. In addition, 339,69 was paid for investments in fishing vessels. Although a slight increase in quotas is expected in 214, this year will be particularly difficult to sell fish production because of the problems on the eastern market. Therefore, efforts are being made to find additional markets so as to diversify risks. Also the rise in fuel prices will be an important factor influencing fleet economic performance in the coming years. A longer trend of the main indicators analysed, including data from the Data Collection Regulation (DCR, 22-27), is provided at the end of this chapter. Data issues Due to confidentiality issues, only capacity data for the deep sea fleet (DTS VL4XX) were reported. There are only two companies operating with 5 vessels in this segment. The effort data are missing for the coastal fisheries segments (PG VL1 and PG VL112) because they were not available. The data concerning economic variables were collected as listed and defined in Appendix VI of Commission Decision 28/949/EC. For economic variables included in Estonian Fisheries Information System (EFIS) (includes log book data, fishing vessel register) data were collected on all members of the population. For other economic variables questionnaires were sent out. It is important to mention that all these surveys have been carried out on a voluntary basis. 185
188 National Chapters Table Estonian national fleet structure, activity and production trends by operational scale: Arrows indicate change ( ) 212 to 211: ( ) increase; ( ) decrease and ( ) stable/no change ( between -1 and +1%) Output Fishing Effort Employment Structure Variable Small scale Fleet % Large scale fleet % DWF No. Vessels (#) ,3 % % Vessel tonnage (thousand GT) % % Vessel power (thousand kw) % % Total employed (#) 2,727 1,646 1,721 1,777 1,858 2,543 5% FTE (#) % % Average wage per employed (thousand ) % % Average wage per FTE (thousand ) % % Days at sea (thousand days) % Fishing days (thousand days) % Energy consumption (milion litres) % Energy consumption per landed tonne (l/t) % Landings weight (thousand tonnes) % % Landings value (million ) % % % Most of vessels from the distant-water fleet (all vessels over 4m in Estonian case - DTS VL4XX), according to the definition used here in the AER, are inserted under the large scale fleet (only structure data is available for this fleet). 186
189 214 Annual Economic Report on the EU Fishing Fleet Table Economic performance of the Estonian national fishing fleet by operational scale: Arrows indicate change ( ) 212 to 211: ( ) increase; ( ) decrease and ( ) stable/no change ( between -1 and +1%) Income Costs Economic Indicators Capital value Profitability and development trends Variable (million ) Small scale Fleet % Large scale fleet % Landings income % % Other income % % Labour costs % % Energy costs % % Repair costs % % Other variable costs % % Non-variable costs % % Capital costs % % GVA % % Gross profit % % Net profit % % Depreciated replacement value % % Investments % % Net profit margin (%) % % development trend Improved 118% Deteriorated -56% RoFTA (%) % % development trend Improved 197% Deteriorated -65% GVA per FTE (thousand ) % % development trend Improved 27% Deteriorated -5% Table Main socio-economic performance indicators by fleet segment in the Estonian national fishing fleet in 212. Development trend based on % net profit margin 212 to average net profit margin Arrows indicate change ( ) 212 to 211: ( ) increase; ( ) decrease and ( ) stable/no change ( between -1 and +1%) Fleet segment No. of vessels (N) % FTE (N) ESTAREA27DTSVL4XX 4 % % Days at sea (days) % Energy consumption (litres) % Value of landings (thousand ) % Weight of landings (thousand tonnes) % GVA (thousand ) % GVA per FTE ( /FTE) % Gross profit (thousand ) % Net profit (thousand ) % Net profit margin (%) % Profitability (212) Net profit margin % 212 average (28-11) Economic development trend ESTAREA27PGVL % 256 2% % % % % % % 32 2% High 94% Improved ESTAREA27PGVL % 16-1% 14 21% 5-31% 97 35% % % 55 4% 36 16% High 191% Improved ESTAREA27TMVL % 9 % % 37-22% 28 2% % 132 6% % 69 5% 63 39% 3 38% High ESTAREA27TMVL % % % 381-6% % % % % % % 5-63% Reasonable -62% Deteriorated ESTOFRDTSVL4XX 1 % Data source: DCF 214 Fleet Economic (MARE/A3/AC(214)). 187
190 National Chapters GT, kw (thousands) million Performance indicators (million ) % # of vessels, employed (thousand) thousand days Energy consumption (million litres) million / thousand tonnes Vessel power Vessel GT No. Vessels Employed Days at sea Fishing days Energy consumption Landings value Landings weight Landings income Price /kg Atlantic cod Atlantic herring European perch European sprat Pike-perch Landings value (million ) Atlantic cod Atlantic herring European perch European sprat Pike-perch Landings weight (tousand tonnes) Atlantic cod Atlantic herring European perch European sprat Pike-perch Landings income Direct income subsidies Other income Fishing rights income Revenue GVA Net profit GVA to Revenue Net Profit margin 188
191 214 Annual Economic Report on the EU Fishing Fleet 5.7 FINLAND Fleet Structure, Fishing Activity and Production In 212 the Finnish fishing fleet consisted of 3,359 registered vessels of which 1,47 were inactive. The active fleet consisted of 1,952 vessels, with a combined gross tonnage of 15.6 thousand GT and a total power of 17 thousand kw. The vast majority of the vessels were small scale. The number of active vessels increased in 212 by 3 vessels due to a change in statistical recordings: in 212 fishermen recorded all vessels that they used in fishing during that year. In 213 the number of active vessels dropped again by 55 vessels. The number of fishing enterprises in 212 totalled 1,5, with the vast majority owning a single vessel. Only 3% of the enterprises owned two to five fishing vessels. Total employment in 212 was estimated at 2,16 jobs. The majority of the jobs are created by the small scale fleet that is a seasonal fishery. Therefore, the employment in that sector is usually only part-time and in terms of FTE the total fleet added up to only 282 FTEs (Table 5.7.1). Table Finnish national fleet structure, activity and production trends: Arrows indicate change ( ) 212 to 211: ( ) increase; ( ) decrease and ( ) stable/no change ( between -1 and +1%) Output Fishing Effort Employment Structure Variable NATIONAL FLEET % Total No. Vessels (#) 3,24 3,24 3,27 3,365 3,359 3,241 % 3,21 No. of Inactive vessels (#) 1,687 1,79 1,662 1,716 1,47 1,344-18% Average vessel age (year) % 27 Vessel tonnage (thousand GT) % 16.5 Vessel power (thousand kw) % No. of Enterprises (#) 1,549 1,531 1,579 1,613 1,5 1,897-7% Total employed (#) 1,613 1,69 1,73 1,722 2,16 1,764 17% FTE (#) % Average wage per employed (thousand ) % Average wage per FTE (thousand ) % Days at sea (thousand days) % Fishing days (thousand days) % Energy consumption (milion litres) % Energy consumption per landed tonne (l/t) % Landings weight (thousand tonnes) % Landings value (million ) % % Data source: DCF 214 Fleet Economic (MARE/A3/AC(214)); data for 213 and 214 are provisional. In 212, the total effort in days at sea was around 137,6 1 thousand days at sea. The small scale fleet accounted for 96% of the total effort. The total effort dropped in small-scale in 212 due to a long winter shortening the fishing season in small scale fishing significantly. At the same time the fishing effort increased for trawlers. The total weight landed by the Finnish fleet in 212 was 133 thousand tonnes of seafood, with a landed value of 35.7 million. The total value and weight of landings increased by around 1% compared to 211, even though the average landing price decreased slightly. One reason for the increase in the volume of landings was an EFF project to remove nutrients from fish through intensive fishing on non-commercial species. 1 This value does not correspond to the value provided in Table An error in the DCF data provided by Finland was detected just prior to the publishing of the report. 189

, followed by European sprat ( 1.")
.")


); data for 213 are")
192 National Chapters Therefore the landings in small-scale fishing increase 3%. Landings of the pelagic trawler segment increased due to a high demand for fishmeal. Pelagic species are the most important species for Finnish fisheries in terms of landing weight and value. In 212, Baltic herring accounted for the highest landed value ( 23 million), followed by European sprat ( 1.5 million). European whitefish and pike-perch were the most important species for the small scale fleet (Figure 5.7.1). The market situation for pelagic species improved in 211 and the prices for Baltic herring and sprat increased. The development in prices of the main small scale fleet species varied. Prices have mostly showed an increasing trend. However, the price of the most valuable species, pikeperch, decreased after several years of increases. Figure Finnish fleet: main trends /14 Data source: DCF 214 Fleet Economic (MARE/A3/AC(214)); data for 213 are provisional. Top left capacity and employment; top right fishing effort and fuel consumption; middle left landings in value and weight; middle right average landed prices of top 5 species in terms of value landed in 212; bottom left landed value of top 5 species in terms of value landed in 212; and bottom right landed weight of top 5 species in terms of value landed in
193 214 Annual Economic Report on the EU Fishing Fleet National Fleet Economic performance The total amount of income generated by the Finnish national fleet in 212 was 43.2 million; a marked improvement from the previous year. Income consisted of 38.6 million in landings income and 4.6 million in other income. Profitability increased with the income; gross value added was 19.5 million that was 6% more than the year before. Gross profit margin doubled and was high enough to turn net profit positive to 6.6 million (Table 5.7.2; Figure 5.7.2). The economic performance increased in both the small scale and the large scale fleet (Table 5.7.3; Table 5.7.4). Table Finnish national fishing fleet economic performance in and projections for 213. Development trend based on % net profit margin 212 to average net profit margin Arrows indicate change ( ) 212 to 211: ( ) increase; ( ) decrease and ( ) stable/no change ( between -1 and +1%) Variable (million ) National Fleet % Income Costs Economic Indicators Capital value Profitability and development trends Landings income % Other income % Labour costs % Energy costs % Repair costs % Other variable costs % Other non-variable costs % Capital costs % GVA % Gross profit % Net profit % Depreciated replacement value % Investments % Net profit margin (%) % development trend Improved 416% RoFTA (%) % development trend Improved 295% GVA per FTE (thousand ) % development trend Improved 38% Data source: DCF 214 Fleet Economic (MARE/A3/AC(214)); data for 213 are provisional. 191


194 National Chapters 5 4 million Performance indicators (million ) Landings income Other income Revenue GVA Gross profit Net profit % million Crew wage costs Unpaid labour Energy costs Repair costs Other variable costs Other non-variable costs Annual depreciation GVA to Revenue Gross profit margin Net Profit margin RoFTA Data source: DCF 214 Fleet Economic (MARE/A3/AC(214)); data for 213 are provisional. Figure Finnish main economic performance trends : Top left income structure; top right cost structure; bottom left economic performance indicators; bottom right performance indicators as a % of revenue (landings income + other income) (projections figures for 213). Fleet Segment Level Economic performance The Finnish fleet operates exclusively in the Baltic Sea and is based on two main fisheries: pelagic trawlers and small scale fleet. Pelagic trawlers are divided into three size groups. The small scale fleet is highly diversified with a range of vessel types targeting species in the coastal waters along Finnish coastline (Table 5.7.3). All fleet segments were making profits in 212. Figure Finnish effort and landings by FAO fishing area, 212. Colour shows fishing days (thousand days) and landings in weight (thousand tonnes); Value shows days-at-sea (thousand days) and landings in value (thousand ). Source: DCF 214 Fleet Economic (MARE/A3/AC(214)) 192
195 214 Annual Economic Report on the EU Fishing Fleet Figure provides a spatial distribution of effort and landings by the Finnish fleet in 212. Passive gears -1m and 1-12 The coastal small scale fleet is the biggest Finnish fleet segment with 1,834 vessels. The small scale fleet consists of diversified vessels targeting mainly freshwater fish species; European whitefish, pike-perch and perch. In 212, the total value of landings of small-scale fishery (including 1-12m vessels) was 11.8 million making a significant positive gross value added of 8.1 million. Increased landing value with in general reduction in costs made the segment profitable. The coastal fleet is highly seasonal, and there is also a high variation in the activity of the vessels; the 5 most active fishing units make up around 9% of the total landings. The average vessel landings value is only 5, while the average landing value of the 5 most active vessels has an average landing value of 17,. Evidently the economic performance of the most active part of the segment is quite different than that of all vessels. The implication of this is reflected when comparing segments -1m and Longer vessels are more active and have a higher average size and are making net profit double as high as the -1 segment. The economic performance of small scale segment as whole improved from 211 and the profitability turned positive (Table 5.7.3; Table 5.7.4; Table 5.7.5). Pelagic trawlers 24-4m This fleet are economically the most important fleet. The fleet targets Baltic herring and sprat in the Baltic Sea. In 212 these 2 vessels accounted for more than half of the total value landed by the Finnish fleet and employed 76 FTE. On average these vessels landing income are around one million euro, employing 3.5 FTEs. The fleet segment made profits of 3.3 million with a reasonable met profit margin of 14%. Pelagic trawlers 18-24m This fleet segment consists of 13 vessels. They also target Baltic herring and sprat. The average vessel landings value were 249,, second highest in the Finnish fleet and average on-board employment is 1.5 FTE. The segment had a remarkable profitability with 35% net profit margin making profits of 1.1 million. Pelagic trawlers 12-18m This is the smallest pelagic trawler segment in terms of individual vessel size and consists of 24 vessels. The average vessel landings value was significantly lower than that of the bigger vessels, only 78,. An average vessel employed less than one FTE. However, the segment was making profits resulting in a 7% net profit margin. Assessment and future trends Baltic herring stocks are currently exceptionally strong especially in the most important fishing grounds in Botnian Bay. Catches of herring have been increasing and 213 catches were at record high. The market situation has also been favourable with high demand in the fishmeal industry due to the cuts in sandeel quotas. Therefore the economic performance of the pelagic trawlers has been strong. However the Russian markets are important for the pelagic fish and uncertainty in there may turn down the positive development of the pelagic segment. Increased seal populations have strongly influenced the Finnish coastal fishery for several years. Many fishermen have had to stop fishing in traditional grounds. There has been a subsidy scheme in place under EFF to support fishermen to continue fishing elsewhere. There has also been an EFF pilot project to subsidise intensive fishing for low value fish (mostly cyprinid fish) to remove nutrients from the water system. This has contributed to a new method of fishing and created new markets for non-commercial species. Data issues Capacity, logbook and landings data are derived from sources which are covered by different legislations. All these data are available exhaustively. The bigger vessels are covered by log-books and smaller vessels are covered by the coastal fishing report. Economic data collection is based on a hierarchical multi-stage survey that combines information from different data sources. The main sources were the central control register on commercial fishery (includes landing data, vessel register, first hand sales of quota species), the financial database in Statistic Finland (SF) and the account survey. Starting in 29, new account data became available for the coastal fishermen collected by Ministry of Agriculture and Forestry in connection to seal damage compensation applications. 193
196 National Chapters Due to the good coverage of the data collection and an efficient estimation method the achieved precision of the economic variables are satisfactory. However there is a break in the time series in number of active vessels in small scale fishing in 212 when the recording of active vessels was re-specified. This increased the active number of vessels in the fleet. Table Finnish national fleet structure, activity and production trends by operational scale: Arrows indicate change ( ) 212 to 211: ( ) increase; ( ) decrease and ( ) stable/no change ( between -1 and +1%) Output Fishing Effort Employment Structure Variable Small scale Fleet % Large scale fleet % No. Vessels (#) 1,486 1,465 1,559 1,589 1,89 1,835 19% % Vessel tonnage (thousand GT) % % Vessel power (thousand kw) % % Total employed (#) 1,486 1,465 1,56 1,589 1,878 1,831 18% % FTE (#) % % Average wage per employed (thousand ) % % Average wage per FTE (thousand ) % % Days at sea (thousand days) % % Fishing days (thousand days) % % Energy consumption (milion litres) % % Energy consumption per landed tonne (l/t) % % Landings weight (thousand tonnes) % % Landings value (million ) % % Data source: DCF 214 Fleet Economic (MARE/A3/AC(214)); data for 213 are provisional. Table Economic performance of the Finnish national fishing fleet by operational scale: Development trend based on % net profit margin 212 to average net profit margin Arrows indicate change ( ) 212 to 211: ( ) increase; ( ) decrease and ( ) stable/no change ( between -1 and +1%) Variable (million ) Small scale Fleet % Large scale fleet % Income Costs Economic Indicators Capital value Profitability and development trends Landings income % % Other income % % Labour costs % % Energy costs % % Repair costs % % Other variable costs % % Non-variable costs % % Capital costs % % GVA % % Gross profit % % Net profit % % Depreciated replacement value % % Investments % % Net profit margin (%) % % development trend Improved 124% Improved 737% RoFTA (%) % % development trend Improved 16% Improved 1218% GVA per FTE (thousand ) % % development trend Improved 3% Improved 34% Data source: DCF 214 Fleet Economic (MARE/A3/AC(214)); data for 213 are provisional. 194
197 214 Annual Economic Report on the EU Fishing Fleet Table Main socio-economic performance indicators by fleet segment in the Finnish national fishing fleet in 211. Development trend based on % net profit margin 212 to average net profit margin Arrows indicate change ( ) 212 to 211: ( ) increase; ( ) decrease and ( ) stable/no change ( between -1 and +1%) Fleet segment No. of vessels (N) % FTE (N) % Days at sea (days) % Energy consumption (litres) % Value of landings (thousand ) % Weight of landings (thousand tonnes) FINAREA27DFNVL % % 48 14% 113-3% 4-43% % FINAREA27TMVL % 76 3% % % % % 881 5% % % % % High 349% Improved Data source: DCF 214 Fleet Economic (MARE/A3/AC(214)) GVA (thousand ) % GVA per FTE ( /FTE) % Gross profit (thousand ) % Net profit (thousand ) % Net profit margin (%) % Profitability (212) Net profit margin % average (28-11) Economic development trend FINAREA27PGVL % % % % % % % % % % 1 282% High 72% Improved FINAREA27PGVL % 14 1% % 37 47% % % % % % % % High 57% Improved FINAREA27TMVL % 15 % % 317-6% % % % % % % 7 14% Reasonable 18% Improved FINAREA27TMVL % 18 % % 523 2% 323 2% % % % % % % High 17% Improved 195
198 National Chapters 5.8 FRANCE 1 Fleet Structure, Fishing Activity and Production In 212 the French fishing fleet consisted of 5,83 registered active vessels, with a combined gross tonnage of 157 thousand GT, a total power of 864 thousand kw and an average age of 22 years. The size of the French fishing fleet decreased between 28 and 212, with the number of vessels decreasing by 12% (or 775 vessels) and GT and kw decreasing by 16% and 1% respectively. The major factor causing the fleet to decrease in size is vessel decommissioning, entry barriers and natural wastage due to age. The number of active fishing vessels less than 12m in 212 was 4,899 with on-board employment of 4,695 jobs. Active less than 12m vessels represented 84% of the number of vessels and 49% of total jobs in the French fishing fleet in 212. Among vessels less than 12m, 86% used passive gears in 212 (corresponding to the definition of small-scale fleet according to the European Commission). Vessels less than 12 meters using active gears included mainly demersal trawlers, dredgers, polyvalent vessels and some purse seiners (in the Mediterranean area and overseas territories). The small-scale fleet represented 72% of the national fleet in terms of active vessel numbers (4,29 vessels), 48% in terms of engine power (41 thousand kw) and 9,7% in terms of GT (15 thousand GT) (Table 5.8.3). On 1 st January 212, the French fishing fleet consisted of 7,144 vessels (including non active vessels) with a total power of 999 thousand kw. Vessel distribution was as follows: (a) 4,556 vessels in Metropolitan France; 3,7 in the Atlantic area, including vessels less than 12 meters as netters, trawlers, vessels using pots, vessels using hooks, dredgers and polyvalent vessels; vessels more than 12 meters were mainly trawlers, netters and dredgers; (b) 1,486 in the Mediterranean area, mainly small scale fleet (around 9%) including netters and polyvalent vessels; vessels more than 12 meters were trawlers and purse seiners and (c) 2,588 vessels in overseas territories (French West Indies: Martinique & Guadeloupe, French Guiana and Reunion), mainly (more than 9%) small scale fleets as polyvalent vessels, vessels using hooks or pots, netters, some purse seiners less than 12 meters, and some vessels more than 12 meters as demersal trawlers, tropical purse seiners targeting tuna in South Atlantic and Ocean India and vessels using hooks (Reunion). Table French national fleet structure, activity and production trends: Arrows indicate change ( ) in relation to 21: ( ) increase; ( ) decrease and ( ) stable/no change ( between -1 and +1%) Output Fishing Effort Employment Structure Variable NATIONAL FLEET Total No. Vessels (#) 6,65 6,475 6,1 6,3 5,83 5,77-3% No. of Inactive vessels (#) Average vessel age (year) % Vessel tonnage (thousand GT) % Vessel power (thousand kw) % No. of Enterprises (#) 4,166 5,93 5,185 5,59 4,993 4,956-1% Total employed (#) 11,14 11,96 1,872 1,713 9,678 9,948-1% FTE (#) 7,841 9,58 8,43 7,447 7,375 7,391-1% Average wage per employed (thousand ) % Average wage per FTE (thousand ) % Days at sea (thousand days) Fishing days (thousand days) 452 % Energy consumption (milion litres) % Energy consumption per landed tonne (l/t) % Landings weight (thousand tonnes) % Landings value (million ) ,51 1,68 2% Data source: DCF 214 Fleet Economic (MARE/A3/AC(214)); data for 213 and 214 are provisional. 1 This National Chapter is built on data that has been judged as questionable in terms of coverage. 196
199 Landings weight (thousand tonnes) million / thousand tonnes 214 Annual Economic Report on the EU Fishing Fleet In 212, the number of fishing enterprises in the French fleet totalled 4,993, with the vast majority (88%), owning a single vessel. Only 12% of the enterprises owned two to five fishing vessels. Total employment in 212 was estimated at 9,678 jobs, corresponding to 7,375 FTEs. The level of employment decreased between 29 and 212, with total employed decreasing by 19% (2282 jobs) and FTEs decreasing by 18,5% (1683 FTE) over the period (Table 5.8.1; Figure 5.8.1). The major factor causing employment to decrease was the decrease in vessels numbers. The small-scale fleet represented 32% of national fleet in terms of FTEs (2,378 FTEs) in 212. In 212 the French fleet spent a total of around 495 thousand days at sea; 46% of those were attributable to the small-scale fleet (which represented 72% of active vessels). The quantity of fuel consumed in 212 totalled around 36 million litres, a decrease of around 11% from 211, 2% from 29. The major factors causing the decrease in fuel consumption included the decrease in vessel numbers and the increase in fuel price. The average consumption of fuel by vessel decreased of 11% from 29 (Figure 5.8.1). GT, kw (thousands) Vessel tonnage Vessel power No. Vessels FTE Total employed no. Vessels, employment (thousand) thousand days Days at sea Fishing days Energy consumption 15. Energy consumption (million litres) Average price ( /kg) Landings value Landings weight Common sole European hake Great Atlantic scallop Monkfishes nei Yellowfin tuna 4 15 Landings value (million ) Common sole European hake Great Atlantic scallop Monkfishes nei Yellowfin tuna Common sole European hake Great Atlantic scallop Monkfishes nei Data source: DCF 214 Fleet Economic (MARE/A3/AC(214)); data for 213 are provisional. Figure French fleet: main trends /13 Top left capacity and employment; top right fishing effort and fuel consumption; middle left landings in value and weight; middle right average landed prices of top 5 species in terms of value landed in 212; bottom left landed value of top 5 species in terms of value landed in 212; and bottom right landed weight of top 5 species in terms of value landed in
200 National Chapters The small-scale fleet consumed 25 million litres of fuel in 212, representing 8% of total fuel consumption. The average consumption of fuel by vessel decreased of 17% from 29 for SSCF. The total weight of seafood landed by the French fleet in 212 was 56 thousand tonnes, with a landed value of 1,71 million. The total weight landed increased between 211 and 212 (9%) while the value remained relatively stable (2%) showing that the prices in 212 were globally not as high as in 211. Indeed, between 21 and 211 the landings increased by 14% in value and only 4% in weight thanks to a global price increase in 211. In 212, albacore tuna generated the highest landed value by the national fleet ( 93 million), followed by monkfish ( 91 million), then sole ( 9 million), and then European hake and scallops ( 66 million each). In terms of landings weight, between 211 and 212, weight of landings of albacore tuna (44 thousand tonnes), European hake (28 thousand tonnes) and monkfish (22 thousand tonnes) increased by 13%, 18% and 19%, while landings weight of scallops (27 thousand tonnes) and sole (8 thousand tonnes) decreased slightly. The prices obtained for these key species decreased between 211 and 212 from 5% to 1% excepted scallops price which remained stable and albacore tuna price which increased for 22%. Among those 5 species, sole achieved the highest average price per kilo in 211 ( 11.3 per kg), followed by monkfishes ( 4.12 per kg) (Figure 5.8.1). The total weight landed by the French small-scale fleet in 212 was 73 thousand tonnes of seafood with a landed value of 183 million. That represented 14% of the total weight and 17% of the total value of the national fleet. In terms of species, sole generated the highest landed value by the small-scale fleet ( 33 million), followed by bass ( 24 million), whelk ( 18 million). In terms of landed weight, in 212 seaweeds and whelk generated the highest landings with 27 and 11 thousand tonnes, respectively, which together represented 53% of total weight landed by French small-scale fleet. National Fleet Economic performance The total amount of income generated by the French national fleet in 212 was 1,8 million. This consisted of 1,65 million in landings value and 15 million in non-fishing income. Income generated by the French fleet decreased 6% between 211 and 212. Total operating costs incurred by the French national fleet in 211 equated to 925 million, amounting to 85% of total income. Crew cost and fuel cost, the two major fishing expenses, were 378 and 222 million respectively, see Table and Figure Between 211 and 212, total operating costs decreased 5% while fuel costs increased 4% which amounted to almost 2% of total income in 212. The landings income generated by the French small-scale fleet in 212 was 29 million, around 2% of national landings income. It decreased 15% between 211 and 212. Total operating costs incurred by the French small-scale fleet in 212 equated to 172 million, amounting to 82% of the total income of the smallscale fleet, representing 19% of total operating costs at national level. Between 211 and 212, total operating costs globally decreased 14%. The fuel cost for the French small-scale fleet was 19 million and represented only 8% of national fuel cost. Fuel cost represented 9% of total income by the small-scale fleet in 212 and decreased around 8% between 211 and 212 while it increased 4% for the national fleet. In terms of economic performance, the total amount of Gross Value Added (GVA) and gross profit generated by the French national fleet in 212 were 532 million and 155 million, respectively. Gross Value Added (GVA) and gross profit decreased 1% and 15% respectively between 211 and 212. The major factor causing the degradation in economic performance was a bigger decrease for income (due to prices) than for operating costs. For the small-scale fleet, the amount of Gross Value Added (GVA) and gross profit generated in 212 were 133 million and 39 million respectively, amounting to 25% of the national total. Economic indicators also degraded for the small-scale fleet between 211 and
201 214 Annual Economic Report on the EU Fishing Fleet Table French national fishing fleet economic performance in Development trend based on % net profit margin 211 to average net profit margin Arrows indicate change ( ) in relation to 21: ( ) increase; ( ) decrease and ( ) stable/no change ( between -1 and +1%) Variable (million ) National Fleet % Income Costs Economic Indicators Capital value Profitability and development trends Landings income ,7.6 1,11.4 1, ,64.5-6% Other income % Labour costs % Energy costs % Repair costs % Other variable costs % Other non-variable costs % Capital costs % GVA % Gross profit % Net profit % Depreciated replacement value 1,38.1 1, % Investments % Net profit margin (%) % development trend Improved 167% RoFTA (%) % development trend Improved 314% GVA per FTE (thousand ) % development trend Improved 1% Data source: DCF 214 Fleet Economic (MARE/A3/AC(214)); data for 213 are provisional. Note: capital costs for 28 and 29 excludes opportunity costs of capital 199


202 Performance indicators (million ) million million National Chapters Landings income Other income Revenue GVA Gross profit Net profit % Crew wage costs Unpaid labour Energy costs Repair costs Other variable costs Other non-variable costs Annual depreciation GVA to Revenue Gross profit margin Net Profit margin RoFTA Data source: DCF 214 Fleet Economic (MARE/A3/AC(214)); data for 213 are provisional. Figure French fleet main economic performance trends Top left income structure; top right cost structure; bottom left cost items as a percentage of income (fishing income and other income); bottom right economic performance indicators (projected figures for 212). Figure FRA effort (days-at-sea and fishing days) and landings (weight and value) by FAO fishing area, 212. Colour shows fishing days and landings in value ( ) and size shows days-at-sea and landings in weight (kg). Source: DCF 214 Fleet Economic (MARE/A3/AC(214)) Fleet Segment Level Economic performance The French fleet is highly diversified with a broad range of vessel types targeting different species predominantly in the North East Atlantic, but also in the Mediterranean and in more distant fisheries. Indeed, the national fleet consisted of 1 (DCF) fleet segments in 212 (DCF gear*length class). 1,132 vessels were inactive that year. Table contains a breakdown of key performance indicators for the fleet segments active in 212. A short description of the 5 most important segments in terms of total landings value is provided below. 2
203 214 Annual Economic Report on the EU Fishing Fleet Drift and fixed nets 1 12m 193 vessels make up this segment which operates predominantly in the North East Atlantic (excluding overseas). The fleet targets a variety of species but in particular common sole, anglerfish and European sea bass (respectively 48.4%, 9.% and 5.3% of the total value of landings of this fleet segment). In 212, total income from landings was almost 55 million (landings and other income) and around 461 FTEs were employed in this fleet segment, contributing to 5.1% and 6.3% of the total income from landings generated and FTEs in the national fishing fleet, respectively. This fleet segment produced a gross profit of around 8.8 million in 212, decreasing by 18% between 211 and 212. Total of operating costs represents 84% of income generated by this fleet segment in 212. Analysis of the net profit is not performed because the recommended method used to assess the economic depreciation (indicator used in the calculation of net profit) did not give consistent results in 212. Drift and fixed nets 12 18m 86 vessels make up this segment (73 in the North East Atlantic and 13 in the Mediterranean excluding overseas). The fleet targets a variety of species but in particular common sole (44% and 35% of the total values of landings of this fleet segment respectively in the North East Atlantic and the Mediterranean Sea), anglerfish, turbot and European sea bass. In 212, total landings value was almost 38 million and around 298 FTEs were employed in this fleet segment, contributing to 3.5% and 4.% of the total income from landings generated and FTEs in the national fishing fleet, respectively. The North East Atlantic fleet generated a gross profit of around 5.3 million in 212, and remained relatively stable between 211 and 212. Total of operating costs represents 85% of income generated by this fleet segment in 212. Analysis of the net profit is not performed because the recommended method used to assess the economic depreciation (indicator used in the calculation of net profit) did not give consistent results in 212. Demersal trawl / seine 12 18m 187 vessels make up this segment and they are all based in the North East Atlantic. These vessels target a variety of species; the top three in terms of value landed in 212 were Norway lobster, anglerfish and sole (respectively 26%, 1% and 1% of the total values of landings of this fleet segment). Total value of landings was almost 82 million and 545 jobs were supported by this segment in 212, accounting for 7.6% and 7.4% of the national fleet income and national fleet FTEs respectively. This fleet segment generated a gross profit of around 9.2 million in 212, decreasing by 16% between 211 and 212. Total of operating costs represents 89% of income generated by this fleet segment in 212. Analysis of the net profit is not performed because the recommended method used to assess the economic depreciation (indicator used in the calculation of net profit) did not give consistent results in 212. Demersal trawl / seine 18-24m 22 vessels made up this segment in % of the vessels in this segment operate in the Atlantic, North Sea and the Channel, 14% of the vessels operate in the Mediterranean Sea and 9% in French Guyana (no data available for this supra region). Depending on the supra region, vessels have different fishing activities in terms of target species or number of days at sea. The vessels operating in the Atlantic, North Sea and the Channel target a variety of species, such as anglerfish (22% of the total values of landings of this fleet segment), squids, cod and Common cuttlefish. In the Mediterranean Sea the vessels target hake (17% of the total values of landings of this fleet segment), squids and common octopus. In 212 turnover decreased by 13% and 15% respectively on the Atlantic area and in the Mediterranean Sea. This fleet segment produced a gross profit down of around 6.8 million in the Atlantic area and.7 million in the Mediterranean in 212. Total of operating costs represents respectively 95% and 94% of income generated by this fleet segment in 212, on the Atlantic area and in the Mediterranean Sea. Analysis of the net profit is not performed because the recommended method used to assess the economic depreciation (indicator used in the calculation of net profit) did not give consistent results in 212. Dredgers 12-18m 9 vessels made up this segment in 212 which operates exclusively in the North Atlantic. The fleet mainly targets great Atlantic scallop (67% of the total values of landings of this fleet segment in 212) but also a variety of species as sole, mussel, cuttlefish and warty venus. In 212, total income from landings was around 38 million, remaining stable in 212, and around 293 FTEs were employed in this fleet segment, accounting for 3.6% and 4.% of national fleet and national FTEs respectively. This fleet segment generated gross profit of around 4.3 million in 212. Total of operating costs represents 89% of income generated by this fleet segment in 212. Analysis of the net profit is not performed because the recommended method used to assess the economic depreciation (indicator used in the calculation of net profit) did not give consistent results in
204 Assessment and Future Trends National Chapters In terms of economic activity, 212 remained broadly stable with a slight decrease of 6% - compared to 211 in terms of landed value. Economic performance differs nevertheless significantly between fleet segments and supra regions. In the Atlantic area, situations are different depending ports, fishing gear used and target species. Weigth of landings were generally correct in 212, however resulting in a reduction in average prices for some of species (monkfish, hake, etc.). French fishing sector is trying to find solution to increase the average fish prices paid to fishermen. Economic situation in the Mediterranean Sea, which was particularly worrying in 211, remains fragile due to the lack of abundance of pelagic species in 212 (anchovy, pilchard). Year 212 was also the last year of "European payback" from the French purse seiners. Thereby, quotas 213 of bluefin tuna for Mediterranean seiners have returned to normal levels in 213 (2471 tons). At the same time, fuel prices remained high in 212, and had a direct negative impact on vessel profitability, especially for demersal, pelagic trawlers and dredgers. Investment in new fuel-efficient vessels, less fuel intensive fishing techniques (e.g. Danish seine) can become solutions to maintain profitability for the vessels. More generally, fleet adaptation (by improving the selectivity of fishing gear) is particularly important during this intense regulatory period (i.e. moving toward MSY, discards bans, etc.). This adaptation of vessels (in terms of innovation) will be essential to ensure the economic sustainability of the fishing fleet. A longer trend of the main indicators analysed, including data from the Data Collection Regulation (DCR, 22-27), is provided at the end of this chapter. Data issues For the first time, a method of probability sampling has been applied: vessels have been selected by systematic random sampling, the fleet having been classified, inside each segment, by size and maritime quartier, to assure a good representativeness of the overall diversity of the French fleet. Not all data have been collected because of total or partial non responses: a statistical method has been used for the first time to know the criteria (explanatory variables) that could explain the response rate and then to increase the weight of vessels for which data have been collected. In a very limited number of cases, cluster names are identical for two different years however the composition of the cluster is different. Care should be taken when making comparisons, even when the name cluster is identical. This problem will be corrected in the following years, the idea being to retain the same clusters (name and composition) for each year requested under the data call. The 18 over 4m purse seine vessels operating in other fishing regions are based and registered in a French metropolitan port but they operate in the Indian ocean. Only data for French hooks 12-18m and 18-24m in the Indian Ocean is available for 212. The existing small-scale fleet definition could be extended in the French case to include all vessels less than 12 meters even if they use active gears as trawls, dredges or various active gears because they concern small vessels fishing in coastal areas with trips during less than 24 hours (646 French vessels are concerned in North Atlantic and 39 vessels in Mediterranean Sea in 212). The capital value and depreciation parameters have been calculated with the recommended method. The implementation of this method needs improvements so data should be used with caution. 22
205 214 Annual Economic Report on the EU Fishing Fleet Table French national fleet structure, activity and production trends by operational scale: Arrows indicate change ( ) 212 to 211: ( ) increase; ( ) decrease and ( ) stable/no change ( between -1 and +1%) Output Fishing Effort Employment Structure Variable Small scale Fleet % Large scale fleet % Distant water & othermost region % No. Vessels (#) 4,589 4,629 4,244 4,36 4,29-2% 2,11 1,826 1,835 1,68 1,63-5% % Vessel tonnage (thousand GT) % % % Vessel power (thousand kw) % % % Total employed (#) 4,37 4,27 3,828 3,973 3,525-11% 6,833 7,21 6,628 6,32 5,74-9% % FTE (#) 2,931 3,15 2,743 2,647 2,378-1% 4,91 5,555 5,245 4,362 4,646 7% % Average wage per employed (thousand ) % % % Average wage per FTE (thousand ) % % % Days at sea (thousand days) % % 5 Fishing days (thousand days) % % 4 Energy consumption (milion litres) % % % Energy consumption per landed tonne (l/t) % 1,32 1, % % Landings weight (thousand tonnes) % % % Landings value (million ) % % % 23
206 National Chapters Table Economic performance of the French national fishing fleet by operational scale: Development trend based on % net profit margin 212 to average net profit margin Arrows indicate change ( ) 212 to 211: ( ) increase; ( ) decrease and ( ) stable/no change ( between -1 and +1%) Variable (million ) Small scale Fleet % Large scale fleet Distant water & othermost region % % Income Costs Economic Indicators Capital value Profitability and development trends Landings income % % % Other income % % Labour costs % % % Energy costs % % % Repair costs % % % Other variable costs % % % Non-variable costs % % % Capital costs % % GVA % % % Gross profit % % % Net profit % % Depreciated replacement value % % Investments % % Net profit margin (%) % % development trend Deteriorated -46% Improved 1% RoFTA (%) % % development trend Deteriorated -46% Improved 7% GVA per FTE (thousand ) % % % development trend Stable % Stable 3% Improved 184% 24
207 214 Annual Economic Report on the EU Fishing Fleet Table Main socio-economic performance indicators by fleet segment in the French national fishing fleet in 212 Development trend based on % net profit margin 211 to average net profit margin Arrows indicate change ( ) in relation to 21: ( ) increase; ( ) decrease and ( ) stable/no change ( between -1 and +1%) Fleet segment No. of vessels (N) % FTE (N) % Days at sea (days) % Energy consumption (litres) % Value of landings (thousand ) % Weight of landings (thousand tonnes) % GVA (thousand ) % GVA per FTE ( /FTE) % Gross profit (thousand ) % Net profit (thousand ) % Net profit margin (%) % Profitability (212) Net profit margin % average (21-11) Economic development trend FRAAREA27DFNVL % 238-2% % % % % % 6.2 1% % 33 21% 1 241% Reasonable 134% Improved FRAAREA27DFNVL % 461 6% % % % % % % % % 2-58% Reasonable -16% Deteriorated FRAAREA27DFNVL % % % % % % % % % % % Weak -24% Deteriorated FRAAREA27DFNVL Reasonable 146% Improved FRAAREA27DFNVL % 273-1% % % % % % % % % 6 163% Reasonable FRAAREA27DFNVL4XX FRAAREA27DRBVL % 53-19% % 532-9% % % % % % % 1 8% Reasonable 68% Improved FRAAREA27DRBVL Weak -13% Deteriorated FRAAREA27DRBVL Weak FRAAREA27DRBVL FRAAREA27DTSVL1 13 1% 96 21% % % 927 7% % 618-6% % % % 5 932% Reasonable FRAAREA27DTSVL Weak FRAAREA27DTSVL % % % % % % % % % % -7-12% Weak FRAAREA27DTSVL % 747 1% % % % % % % % % % Weak FRAAREA27DTSVL % % % % % % % % % % -2-3% Weak FRAAREA27DTSVL4XX 1-9% % % % % % % % % FRAAREA27FPOVL % % 342 2% % % % % % % % 7 98% Reasonable 145% Improved FRAAREA27FPOVL % % % % % % 71-29% % % % % Weak -745% Deteriorated FRAAREA27FPOVL Weak FRAAREA27HOKVL % 28 7% 32 16% % % % % % % % 5 723% Reasonable FRAAREA27HOKVL Reasonable FRAAREA27HOKVL FRAAREA27MGPVL1 17 6% 1-26% % % 892-5% % % % % % 12 18% High 766% Improved FRAAREA27MGPVL % 53-11% % % % % % % % Reasonable FRAAREA27MGPVL % 57-3% % % % % % % 11-53% Weak FRAAREA27PGOVL1 18-9% 71-42% % % % % % % % % % Weak FRAAREA27PGPVL % 63-38% % % % % % % % % % Weak -78% Deteriorated FRAAREA27PGPVL % 9-65% 9-29% 15-77% % % % % 97-83% FRAAREA27PMPVL1 78 3% 73 11% 813 3% % % % % % 86-39% % -16% Weak -18% Deteriorated FRAAREA27PMPVL % 122-2% % % % % % % % % 3 187% Reasonable -6% Deteriorated FRAAREA27PMPVL % 32 21% % 72 2% % % % % % Weak 25
208 National Chapters Fleet segment No. of vessels (N) % FTE (N) % Days at sea (days) % Energy consumption (litres) % Value of landings (thousand ) % FRAAREA27PSVL % % % % 239 4% % % % % % % High Weight of landings (thousand tonnes) % GVA (thousand ) % GVA per FTE ( /FTE) % Gross profit (thousand ) % Net profit (thousand ) % Net profit margin (%) % Profitability (212) Net profit margin % average (21-11) Economic development trend FRAAREA27TMVL % 11 32% % % % % % % % % 1 525% Reasonable 568% Improved FRAAREA27TMVL % 5 72% % % % % % % % % 5 444% Reasonable 421% Improved FRAAREA27TMVL % % % % % % % % 272-8% % -2 48% Weak 72% Improved FRAAREA27TMVL4XX 3 % 11-15% 539 4% % % % % % % FRAAREA37DFNVL6 8 1% 39-8% % 139-4% 889-5% % % % 71-14% % 15-29% High -8% Deteriorated FRAAREA37DFNVL % % % % % % % % % % % Weak -144% Deteriorated FRAAREA37DFNVL % 12 1% % % % % % % 2-49% FRAAREA37DRBVL % 3-37% % 5-94% 48-41% 7-53% 86-59% % 29-53% FRAAREA37DTSVL % 71-12% % % 91-6% % % % % FRAAREA37DTSVL FRAAREA37FPOVL6 8 % 67 31% % 89-23% % 221 6% % % % % 17-14% High 24% Improved FRAAREA37FPOVL % 31-34% % 276-6% % % % % % 52-52% 2-34% Reasonable FRAAREA37HOKVL6 1 67% 1-58% % 5-75% 13-6% 12-78% 56-45% % 16-54% % % Weak FRAAREA37HOKVL % 23-2% % % 727-1% 97-1% % % % % % Weak FRAAREA37PGOVL % 21-42% 43-35% 51-35% % 61-37% % % % 1-64% 1-46% High -46% Deteriorated FRAAREA37PGOVL % 3-42% % 98-44% % 2-59% % % % -25 3% % Weak -29% Deteriorated FRAAREA37PGPVL % 47 24% % % % 216 2% % % 445-8% % 1-39% Reasonable -3% Deteriorated FRAAREA37PGPVL % 78 22% % 57 39% % % % % 641-1% % -3 6% Weak FRAAREA37PMPVL Weak -162% Deteriorated FRAAREA37PSVL % 22-17% % % % 247-7% % % % % % High 644% Improved FRAAREA37PSVL Weak FRAAREA37PSVL % % 597-4% % 72-4% % % FRAAREA37TMVL FRAOFRHOKVL % FRAOFRHOKVL % FRAOFRHOKVL % 5-4% % % % % FRAOFRHOKVL FRAOFRPGOVL1 61-5% FRAOFRPGPVL % FRAOFRPSVL4XX 18 13% 351-2% % % % % % % Data source: DCF 214 Fleet Economic (MARE/A3/AC(214)). 26


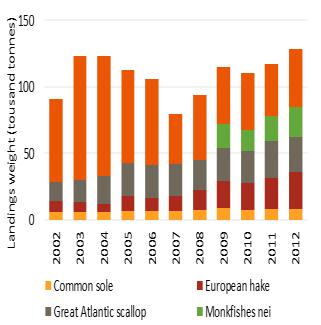
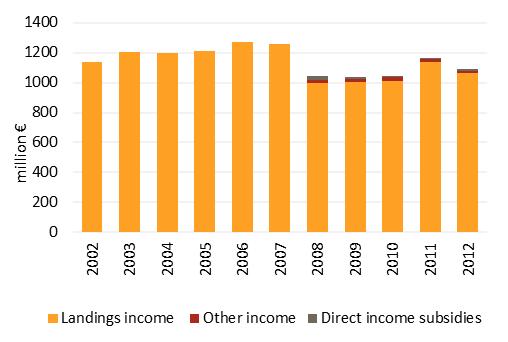
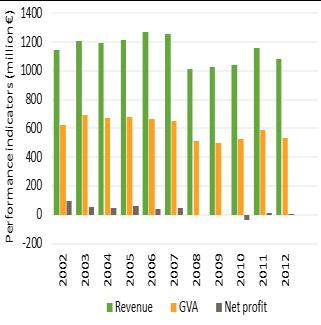
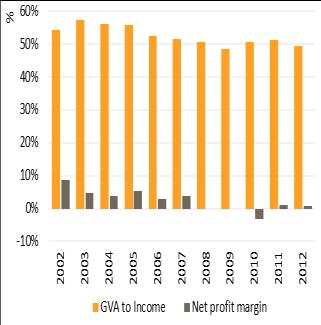
209 214 Annual Economic Report on the EU Fishing Fleet 27
210 National Chapters 5.9 GERMANY Fleet Structure, Fishing Activity and Production On January 1st, 213 the German fishing fleet consisted of 1,543 registered vessels, with a combined gross tonnage of 62 thousand GT, a total power of 142 thousand kw and an average age of 3 years. The size of the German fishing fleet decreased between 28 and 213, with the number of vessels decreasing by 17% and GT and kw by 7% and 8%, respectively (Table 5.9.1). The major factors causing the fleet to decrease include low profitability of certain fisheries coinciding with a high number of fishermen close to the age of retirement with no successors to the business. A one off special arrangement occurred in 211, actuating some additional decommissioning: A time limited option to permanently transfer quota from one vessel to another if the vessel then left the fleet. Vessels which targeted blue mussels were excluded from the analysis because they are defined as operating in the aquaculture sector. Moreover, the pelagic trawler fleet is excluded from the analysis except for capacity data as practically the entire segment is owned by one parent company. For confidentiality reasons the data cannot be published. In 213 the number of fishing enterprises in the German national fleet totalled 1.37, with the vast majority (71%) owning a single vessel. Only 28% of enterprises owned two to five fishing vessels. Total employment in 212 was estimated at 1,752 jobs, corresponding to 1,372 FTEs. The level of employment decreased between 28 and 212 by about 15%. The major factors causing employment to decrease are the same as for the decrease in fleet size. In 212 the German fleet spent a total of around 119 thousand days at sea, a decrease of around 1% between 28 and 212. The major factor causing the decrease in days at sea was the decrease in capacity. The quantity of fuel consumed in 212 totalled around 47 million litres, a decrease of around 4% from 28. The major factors causing the decrease in fuel consumption were the reduction in total effort and the increase in the fuel price (Table 5.9.1; Figure 5.9.1). Table German national fleet structure, activity and production trends: Arrows indicate change ( ) 212 to 211: ( ) increase; ( ) decrease and ( ) stable/no change ( between -1 and +1%)Data Structure Employment Fishing Effort Output Variable NATIONAL FLEET % Total No. Vessels (#) 1,861 1,817 1,759 1,664 1,564 1,543-6% 1527 No. of Inactive vessels (#) % 372 Average vessel age (year) % 3 Vessel tonnage (thousand GT) % 6 Vessel power (thousand kw) % 139 No. of Enterprises (#) 1,293 1,245 1,198 1,128 1,53 1,37-7% Total employed (#) 2,68 1,529 1,744 1,639 1,752 1,589 7% FTE (#) 1,615 1,238 1,365 1,258 1,372 1,236 9% Average wage per employed (thousand ) % Average wage per FTE (thousand ) % Days at sea (thousand days) % Fishing days (thousand days) % Energy consumption (milion litres) % Energy consumption per landed tonne (l/t) % Landings weight (thousand tonnes) % Landings value (million ) % 2,54 2,158 2,974 2,862 3,824 3,464 34% source: DCF 214 Fleet Economic (MARE/A3/AC(214)); data for 213 and 214 are provisional. 28
211 million / thousand tonnes Average price ( /kg) GT, kw (thousands) no. of vessels, employment thousand days million litres 214 Annual Economic Report on the EU Fishing Fleet The total volume landed by the German (non-pelagic) fleet in 213 was 79 thousand tonnes of seafood, with a landed value of 144 million. The total volume and value of landings decreased over the period analysed. In 213, brown shrimp generated the highest landed value by the national fleet ( 59.5 million), followed by cod ( 21.8 million), Greenland halibut ( 14.6 million), saithe ( 11.1 million) and then plaice ( 6.1 million). In terms of landings weight, in 213 the total amount of cod landed was 14.5 thousand tonnes, brown shrimp was 16.2 thousand tonnes) and saithe was 1.9 thousand tonnes. The trend in landed volume shows no clear tendency. The major factor influencing the value of landings of brown shrimp is the price. While prices decreased considerably in 211, they recovered remarkably in 212 and 213; this is thought to be due to the formation of a producer organisation which took over the first sale of catches, achieving a much stronger position against the first buyers. The buyer market is dominated by two companies (Table 5.9.1; Figure 5.9.1). Landings value (million ) ,5 2, 1,5 1, 5 Vessel tonnage Vessel power No. Vessels FTE Total employed Landings value Landings weight Landings income Atlantic cod Common shrimp European plaice Greenland halibut Saithe(=Pollock) Data source: DCF 214 Fleet Economic (MARE/A3/AC(214)); data for 213 are provisional. Figure German fleet: main trends for the period Landings weight (thousand tonnes) Days at sea Fishing days Energy consumption Atlantic cod European plaice Saithe(=Pollock) Common shrimp Greenland halibut Atlantic cod Common shrimp European plaice Greenland halibut Saithe(=Pollock) Top left capacity and employment; top right fishing effort and fuel consumption; middle left landings in value and weight; middle right average landed prices of top 5 species in terms of landed value in 212; bottom left - top 5 species in terms of value landed in 212; and bottom right landed weight of top 5 species in terms of value landed in 212. The prices obtained for the other key species varied slightly between 28 and 213. Brown shrimp achieved the highest average price per kilo in 212 ( 3.5 per kg), followed by Greenland halibut ( 2.75 per kg). Brown shrimp accounted for 22% of the total landings value obtained by the German non-pelagic fleet in 211, 29
212 National Chapters increasing to 38% of total income in 212, while the Greenland halibut share decreased from 17% in 211 to 12% in 212. National Fleet Economic performance The total amount of income generated by the German national (non-pelagic) fleet in 212 was 15.8 million. This consisted of million in landings value and 2.6 million in non-fishing income. The German (nonpelagic) fleets total income decreased by less than 1% between 28 and 212. Total operating costs incurred by the German national (non-pelagic) fleet in 212 equated to 126 million, 84% of total income. Labour cost and fuel costs, the two major fishing expenses, were 49 and 31 million, respectively (Table 5.9.2; Figure 5.9.1). Between 211 and 212, total operating costs increased by about 1%. Table German national fishing fleet economic performance in and projections for 213. Development trend based on % net profit margin 212 to average net profit margin Arrows indicate change ( ) 212 to 211: ( ) increase; ( ) decrease and ( ) stable/no change ( between -1 and +1%) Variable (million ) National Fleet % Income Landings income % Other income % Labour costs % Energy costs % Costs Repair costs % Other variable costs % Other non-variable costs % Capital costs % Economic Indicators Capital value Profitability and development trends GVA % Gross profit % Net profit % Depreciated replacement value % Investments % Net profit margin (%) % development trend Improved 2% RoFTA (%) % development trend Improved 282% GVA per FTE (thousand ) % development trend Improved 16% Data source: DCF 214 Fleet Economic (MARE/A3/AC(214)); data for 213 are provisional. In terms of economic performance, the total amount of Gross Value Added (GVA), gross profit and net profit generated by the German (non-pelagic) fishing fleet in 212 were 74 million, 25 million and 6 million, respectively. Gross Value Added (GVA) and gross profit increased by 28% and 67% from 211 to 212 while net profit turned from negative to positive. The major reason causing the recovery in economic performance was the considerable increase of the price of brown shrimp after deteriorating conditions in 211. In 212, the German non-pelagic fishing fleet had an estimated (depreciated) replacement value of 88 million. Investments by the fleet amounted to 21 million in 212 (Table 5.9.2; Figure 5.9.1). There was no major activity in building new vessels, and investments refer mainly to replacement of worn or written off assets. 21
213 214 Annual Economic Report on the EU Fishing Fleet Performance indicators (million ) million Landings income Other income Revenue GVA Gross profit Net profit % million Crew wage costs Unpaid labour Energy costs Repair costs Other variable costs Other non-variable costs Annual depreciation GVA to Revenue Gross profit margin Net Profit margin RoFTA Data source: DCF 214 Fleet Economic (MARE/A3/AC(214)); data for 213 are provisional. Figure German fleet main economic performance trends for the period Top left income structure; top right cost structure; bottom left economic performance indicators; bottom right performance indicators as a % of revenue (landings income + other income) (projected figures for 213). Fleet Segment Level Economic performance The German fishing fleet is highly diversified with a broad range of vessel types targeting different species predominantly in the North Sea with Eastern Arctic, the Baltic Sea and the Western Atlantic (see Figure 5.9.3). In contrast to previous years, the high seas pelagic fleet no longer operated in the Pacific and in Mauritanian and Moroccan waters. Beam trawlers operate exclusively in the coastal North Sea, whereas almost all smaller vessels using fixed gear operate in the Baltic Sea. Smaller demersal trawlers mainly fish in the Baltic Sea, while larger ones (>3m) fish in the North Sea, Eastern Arctic and Greenland waters. Few larger drift netters fish in Western Atlantic waters (Figure 5.9.3). The small scale fleet of vessels < 12m operates almost exclusively in the Baltic Sea using passive gear. In previous years economic performance remained relatively stable, but on a very low level. The segment is dominated by sideline fishermen who often do not run the business for the purpose of generating the main income of the household. Thus the income per fisherman is rather low. The average weight of landings has remained stable at around 8. tons/a. The price per kg was around 1 /kg. The number of vessels decreased, but the gross tonnage remained rather stable (Table and Table 5.9.4). 211
 and landings in weight (thousand tonnes); Value shows days-at-sea (thousand days) and landings in value (thousand ).")

214 National Chapters Figure German fleet effort and landings by FAO fishing area, 212. Colour shows fishing days (thousand days) and landings in weight (thousand tonnes); Value shows days-at-sea (thousand days) and landings in value (thousand ). Source: DCF 214 Fleet Economic (MARE/A3/AC(214)) The economic performance of non-pelagic vessels >12m has varied over the years. Both number and tonnage of all vessels has decreased, the total weight of landings also showed a decreasing trend. However, the value of landings was quite variable. This is to a large extent due to the price development for brown shrimp prices (Table and Table 5.9.4). The national fleet consisted of 21 active (DCF) fleet segments in 212, with 4 inactive vessels in all six length classes (213). Several of the segments contain too few vessels to be presented individually and have therefore been clustered. Thus, Table contains economic data for 13 vessel groups, excluding the pelagic segments for confidentiality reasons. Eleven of the active fleet segment clusters made an overall gross profit in 212 while three made losses. Table provides a breakdown of key performance indicators. The main change in German fisheries in 212 affected the segments Beam trawl 12-18m and 18-24m 181 vessels made up these two segments in 212, operating exclusively in coastal areas of the North Sea, targeting mainly brown shrimp and employing around 19 FTEs. In 212 the total value landed by these vessels was about 55 million, accounting for approximately 37% of the total landings income generated by the German non-pelagic fishing fleet. These fleet segments were profitable in 212, with a reported gross profit of around 16.1 million and an estimated net profit of around 1.8 million. These segments were significantly affected by a doubling in price compared to 211 when the prices had dropped considerably. In 213 prices remained at the 212 level. Assessment and Future Trends National Fleet The German fishing fleet decreased further in size in 213 in terms of vessels numbers. One vessel from the high seas fleet was sold outside Germany. The number of cutters and small scale fishing vessels decreased, thus continuing the long term trend. Fleet segments were affected differently by price and quota developments (see Table and Table 5.9.4). Small scale and cutter Fleet The most striking development for the cutter fleet was the considerable increase in revenues from brown shrimp landings; the price more than doubled in 212 after the 211 market-crash and basically remained at that level in 213. Therefore, the economic situation became satisfactory again for the shrimp beam trawl fleet. As a consequence, owners increased investments. The North Sea plaice stock was assessed at another all-time high, and thus quota increased again as well. However, the benefit for the fleet was limited due to decreasing prices. Temporarily it even dropped to the intervention price. Saithe fisheries in the North Sea were satisfactory. The lower quota was fully exploited, but decreasing prices affected the profitability in 213. The MSC certification of this fishery has been renewed in 212 and again 212
215 214 Annual Economic Report on the EU Fishing Fleet proven conducive for marketing. The Nephrops fishery has become increasingly important for the German cutter fleet due to the possibility of international quota exchange. The Cod fishery in the North Sea was regarded satisfactory due to stock recovery. Baltic cod quota had increased, but was not fully exploited. The considerable stock increase led to a lack of food. Thus the fish showed sign of malnutrition which resulted in decreasing prices. Moreover, Baltic cod did not aggregate as usual, according to the fisheries, thus leading to lower hourly catches in spite of increased stock. The coastal fishery on Baltic herring was satisfactory, and the considerably increased quota could be fully exploited in short time in 213. Due to the still pending long-term management plan Baltic herring could not be MSC certified. As several buyers only accept certified herring, prices were not always at a satisfactory level. High Seas Fleet According to the German fishing industry, 213 was a mediocre year for both pelagic and demersal trawlers, particularly due to the unresolved dispute on Atlantic mackerel. One large demersal trawler exited the German fleet due to decreasing fishing opportunities in Greenland waters, according to information from the sector. On the other hand, considerable investment has been undertaken for modernising the high seas fleet. This mainly referred to on-board processing facilities and cooling technology. In 213 the construction of a new pelagic trawler has been initiated which is expected to be operational in 215. The MSC certification for the cod, saithe and haddock fisheries in the North Sea and in Norwegian waters was successfully renewed. The annual audit for fisheries on North Sea herring (including Norwegian waters) was passed successfully. Due to the ongoing uncertainties on quota allocation on Atlantic mackerel the certification was cancelled causing negative consequences for the participating industry. Cod fisheries in the Svalbard, Barents Sea and Norwegian areas were efficient. However, decreasing prices had a negative impact on profitability. The saithe fishery in the North Sea did not entirely fulfil the expectations. The Greenland halibut fishery was efficient and led to positive results. The demersal high seas fleet did not perform any fishing activities in the North Sea. Quota was exchanged with the cutter fleet. The pelagic fleet experienced good results in the North Sea and North Atlantic fisheries on herring, jack mackerel and mackerel. The quota for blue whiting was unsatisfactory, but as in 212 partial compensation could be achieved through fishery on argentine. Some fisheries for both pelagic and demersal redfish were opened up in 212. In 213 no fishery took place in African or pacific waters. A longer trend of the main indicators analysed, including data from the Data Collection Regulation (DCR, 22-27), is provided at the end of this chapter. Data issues Capacity, logbook and landings data are derived from sources which are covered by different legislations. All these data are available exhaustively. That means that all capacity, landings and effort data are represented at 1%. The only exception is the group of vessels <8m without logbook obligation. These vessels are sampled for effort data. The remaining variables (cost, employment, fuel consumption) are estimated based upon results from an accountants network and from surveys with questionnaires. The data basis for fleet segment level estimations has become broad over the years. All fleet segments with major contribution to the total catches of the German fleet have been sampled with satisfactory response rates. As segments are not necessarily homogeneous, the results can be quite variable which is reflected in higher coefficients of variation. Some leaps in time series might be due to an improvement in data coverage, with the latest data being most reliable as the raising procedure is based on more comprehensive information. The improvement of the estimation procedure is an on-going process. All data for the pelagic fleet except for capacity have been collected but not published for confidentiality reasons. As in previous years, this affects regional analyses. The pelagic fleet mainly operates in the North Sea and North Atlantic (herring, mackerel, blue whiting), temporary activities in the Pacific as in previous years have been ceased. Data on pelagic fisheries in the Baltic are hardly affected, as they are performed on a seasonal basis, and vessels are assigned to the DTS segment, which reflects their major activity during the year. 213
216 National Chapters The German fishing fleet contains a small number of pelagic vessels which are owned by a reduced number of companies and therefore, for confidentiality reasons, it is impossible to publish this data by segment. Clustering the pelagic vessels with other vessels is not feasible as the pelagic vessels have unique characteristics that would completely bias pure segments when clustered. Therefore, the only pelagic fleet data in this report is capacity data, which is public, so please consider this when interpreting national totals; the German pelagic fleet accounts for a substantial part of the national fleets costs and earnings. Vessels which targeted blue mussels were excluded from the analysis because they are defined as operating in the aquaculture sector. Table German national fleet structure, activity and production trends by operational scale: Arrows indicate change ( ) 212 to 211: ( ) increase; ( ) decrease and ( ) stable/no change ( between -1 and +1%) Output Fishing Effort Employment Structure Variable Small scale Fleet % Large scale fleet No. Vessels (#) % % Vessel tonnage (thousand GT) % % Vessel power (thousand kw) % % Total employed (#) 1, % 1, % FTE (#) % % Average wage per employed (thousand ) % % Average wage per FTE (thousand ) % % Days at sea (thousand days) % % % Fishing days (thousand days) % % Energy consumption (milion litres) % % Energy consumption per landed tonne (l/t) % % Landings weight (thousand tonnes) % % Landings value (million ) % % Table Economic performance of the German national fishing fleet by operational scale: Arrows indicate change ( ) 212 to 211: ( ) increase; ( ) decrease and ( ) stable/no change ( between -1 and +1%) Income Costs Economic Indicators Variable (million ) Small scale Fleet % Large scale fleet % Landings income % % Other income % % Labour costs % % Energy costs % % Repair costs % % Other variable costs % % Non-variable costs % % Capital costs % % GVA % % Gross profit % % Net profit % % Capital value Profitability and development trends Depreciated replacement value % % Investments % % Net profit margin (%) % % development trend Improved 34% Improved 256% RoFTA (%) % % development trend Improved 17% Improved 316% GVA per FTE (thousand ) % % development trend Stable % Improved 2% 214
217 214 Annual Economic Report on the EU Fishing Fleet Table Main socio-economic performance indicators by fleet segment in the German national fishing fleet in 212. Development trend based on % net profit margin 212 to average net profit margin Arrows indicate change ( ) 212 to 211: ( ) increase; ( ) decrease and ( ) stable/no change ( between -1 and +1%) Fleet segment No. of vessels (N) % FTE (N) % Days at sea (days) % Energy consumption (litres) % Value of landings (thousand ) % Weight of landings (thousand tonnes) % GVA (thousand ) % GVA per FTE ( /FTE) % Gross profit (thousand ) % Net profit (thousand ) % Net profit margin (%) % Profitability (212) Net profit margin % average (28-11) Economic development trend DEUAREA27DFNVL % 14 % % 35-34% % 69 18% % % % % % High 458% Improved DEUAREA27DFNVL244 9 % 63-9% % % % % % % % % % Weak -31% Deteriorated DEUAREA27DTSVL % 5-38% % % 69-41% % % % % % -15-4% Weak 5% Improved DEUAREA27DTSVL % 24-14% 346-4% 17-7% 397-5% % 186 3% % % -2 1% 1% Weak 99% Improved DEUAREA27DTSVL % 55-23% % % % % % % 442-8% % % Weak -262% Deteriorated DEUAREA27DTSVL % 41-23% 288-6% % % % % % % % 2-91% Reasonable 127% Improved DEUAREA27DTSVL4XX 8 % 166 % % % % 2566 % % % % % -6 7% Weak 52% Improved DEUAREA27PGVL % 615 % % 882-7% % % % % % % -8 38% Weak 32% Improved DEUAREA27PGVL % 53 4% % 47 61% % 325 4% 19 24% % % % % Weak 36% Improved DEUAREA27TBBVL % 11 % % 74-49% 81 76% 225-9% % % % % % High 376% Improved DEUAREA27TBBVL % % % % % 974-9% % % % % % High 222% Improved DEUAREA27TBBVL % % % % % % % % % % 17 25% High 1541% Improved DEUAREA27TBBVL % 37 6% % % % % % % % -2 1% 1% Weak -11% Deteriorated Data source: DCF 214 Fleet Economic (MARE/A3/AC(214)). 215
218 National Chapters Price /kg GT, kw (thousands) Vessel power Employed Atlantic cod European plaice Saithe(=Pollock) million Performance indicators (miilion ) % Vessel tonnage No. Vessels Common shrimp Greenland halibut 212 no. of vessels, FTE thousand days Landings value (million ) Days at sea Fishing days Energy consumption Atlantic cod Common shrimp European plaice Greenland halibut Saithe(=Pollock) Energy consumption (million litres) million / thousand tonnes Landings weight (tousand tonnes) Landings value Landings income Landings weight Atlantic cod Common shrimp European plaice Greenland halibut 7% 5% 3% 1% -1% Saithe(=Pollock) Landings income Direct income subsidies Other income Fishing rights income Income GVA Net profit GVA to Revenue Net profit margin 216
219 214 Annual Economic Report on the EU Fishing Fleet 5.1 GREECE Fleet Structure, Fishing Activity and Production In 212, the Greek fishing fleet consisted of 16,63 registered vessels, with a combined gross tonnage of 79,678 GT, a total engine power of 462,429 kw and an average age of 26.8 years. The size of the Greek fishing fleet decreased between 28 and 212, with the number of vessels falling by 9% and GT and kw by 6% and 9%, respectively (Table 5.1.1). The main factor causing the fleet to decrease was the implementation of the fisheries policy to reduce of the number and capacity of vessels according to the Multiyear Orientation Programs for the Greek fishing fleet. In 212, the number of fishing enterprises totalled 13,918, with the vast majority (88%) owning a single vessel. The number of enterprises decreased between 28 and 212 by 11%. Total employment in 212 was estimated at 27,558 jobs, corresponding to 23,944 FTEs. The level of employment slightly increased between 28 and 212. This increase in employment may be related to different data collecting methodologies used over the time period, and it is possible that employment in FTE is underestimated for previous years (28-211). The Greek fishing fleet spent an estimated 2,815 thousand days at sea 1 in 212 and the quantity of fuel consumed totalled around 115 million litres. The total weight of landings was estimated at 93 thousand tonnes while the total value of landings was estimated at 427 million 2. Therefore, the average value of landings was 4.57 /kg. Table Greek national fleet structure, activity and production trends: NATIONAL FLEET Total No. Vessels (#) 17,657 17,185 17,6 16,555 16,63 Average vessel age Vessel tonnage (thousand GT) Vessel power (thousand kw) No. Enterprises 15,634 15,326 14,898 14,412 13,918 Total employed 27,558 FTE 23,862 23,944 Average wage (total employed) 6. Average wage (FTE) 6.9 Days at sea (thousand) 2,721 2,816 Energy consumption (million litres) Landings weight (thousand tonnes) Landings weight (million ) Data source: DCF 214 Fleet Economic (MARE/A3/AC(214)). 1 In 212 transversal variables were not collected using the standard methodologies described in the Greek National program and in the European Commission decision 21/93. The data provided for the transversal variables, i.e. days at sea, weight and value of landings were estimated from the socio-economic data questionnaires. 2 The total value of landings was estimated based on the average value of daily landings collected using the socioeconomic data questionnaires. Therefore, it is only an estimate of the total value of landings, since detailed data on the weight and selling price per catch was not collected in

220 thousand National Fleet Economic performance National Chapters The only source of income for Greek fishing vessels is the income from landings since they don t receive direct subsidies or income from fishing rights. Moreover, there is no income from other activities other than fishing, since that requires a special permit. The total amount of income generated by the Greek national fleet in 212 was 427 million (Table 5.1.2). Costs incurred by the Greek fleet in 212 totalled 458 million. According to data collected for the year 212, there is no net profit for Greek fishing vessels (Table 5.1.2). However, this result maybe downward biased since a common methodology for estimating total weight and value of landings was not followed. Nonetheless, the income generated from landings was enough to cover all expenses except for the imputed value of unpaid labour and, hence the activity produced a positive income for fishermen in 212. The main cost items were energy costs and wages, as well as the imputed value of unpaid labour (Table 5.1.2; Figure 5.1.1). Specifically, wages and salaries amounted to over 73 million and derived mainly from the large-scale vessels. On the other hand, imputed labour costs were estimated at 91 million and derive mainly from small-scale vessels. Table Greek national fishing fleet economic performance indicators in 212. Variable (million ) National Fleet 212 % of total costs Total income Crew wages % Unpaid labour costs % Energy costs % Repair costs % Other variable costs % Other non-variable costs % Annual depreciation % Opearting costs (without imputed value of unpaid labour) Opearting costs (without annual depreciation) Total costs Profit + unpaid labour 6.87 Net Profit -31. Depreciated replacement value Investments % 11% 18% 9% 24% 16% 2% -1 Wages and salaries Energy costs Total costs Total income Profit + unpaid labour Net Profit Variable costs Annual depreciation Data source: DCF 214 Fleet Economic (MARE/A3/AC(214)); data for 213 are provisional. Figure Greek fleet income and cost structure in 212 Unpaid labour Repair and maintenance costs Non variable costs 218
221 214 Annual Economic Report on the EU Fishing Fleet Crew and fuel costs, the two major fishing expenses, totalled and 19.1 million, respectively (Table 5.1.2). Energy costs accounted for 24% of total expenses. It is estimated that energy costs are particularly high due to increased fuel prices during 212. Other variable costs, including lubricants and marketing costs, are also important. These costs were estimated at almost 84 million. Non-variable costs were significantly lower ( 7 million), representing less than 2% of total expenses, while repair and maintenance costs reached 4 million. Finally, annual depreciation costs accounted for 12% of total costs ( 53.5 million). The Greek fleet had an estimated (depreciated) replacement value of million in 212. Investments were 3.2 million in 212. Fleet Segment Level Economic performance The Greek fleet is highly diversified with a broad range of vessel types targeting different species (Table 5.1.3). The national fleet consisted of 11 (DCF) fleet segments and 16,63 vessels in 212. Seiners 6-12m (DTS 6-12m): The total number of vessels in this category is 236. The total value of landings is estimated at 4.1 million, representing 1% of national total income from landings. Moreover, this segment employs 328 FTEs, which represents 1% of total FTEs engaged in the fishing sector. The main cost of this fleet segment is the annual depreciation cost, accounting for 26% of total costs. Additionally, energy costs and the imputed value of unpaid labour represent 19% and 17% of the total expenses, respectively. Finally, it should be noted that the vessels of this class exhibit negative net profit. Bottom trawlers 12-18m (DTS 12-18): This fleet segment includes only 32 vessels. The total tonnage is 476 GT, and the total power is 3,415kW. No additional information regarding the economic indicators of this fleet segment is available. Bottom trawlers 18-24m (DTS 18-24): This fleet segment includes 12 vessels. The total value of landings is 35.8 million while the total FTEs are 64. The share of this fleet segment, in value of landings and total employment (FTEs) is 8% and 3%, respectively. Energy costs are the main costs in this segment (38% of total costs). Other important costs are wages and salaries costs as well as other variable costs (22% and 2% of the total cost, respectively). On the other hand, the imputed value of unpaid labour is very small in this fleet segment. Finally, it should be noted that this fleet segment represents 5% of the total value of physical capital, and less than 1% for total investments in 212 while the vessels of this class have positive net profits. Bottom trawlers 24-4m (DTS 24-4): There are 184 vessels in this fleet segment with a total value of landings equal to 76.1 million and 753 total FTEs. It represents 18% of the national total value of landings and 3% of the national FTEs, indicating a high productivity level. As in the case of trawlers with smaller vessel length, the main cost is energy cost that represents 35% of the total costs of the vessels. Other important expenses are wages and salaries (25%) as well as other variable costs (18%). As mentioned in the previous fleet segment, the imputed value of unpaid labour is low. As far as the value of physical capital is concerned, it represents 16% of the total national value of physical capital, while it represents only 3% of total national investment for 212. Finally, it should be noted that the vessels of this class yield positive net profit. Longliners 12-18m (HOK 12-18): The total number of vessels in this fleet segment is 152. The total value of landings is 17.1 million, and employment corresponds to 443 FTEs. Thus, this fleet segment represents 4% of the national value of landings and 2% of the national FTEs. Variable costs appeared to be high for this fleet segment representing 34% of the total expenses. Salaries and wages of the crew are also important since they represent 25% of total costs. Finally, this fleet segment yields high net profits, equal to 4.4 million. Polyvalent passive gears -6m (PGP -6): This fleet segment includes 5,866 small vessels. The value of landings is 65.4 million, representing 15% of the national total value of landings. Moreover, this fleet segment employs 5,882 FTEs, which corresponds to about 1 FTE per vessel. The share of the segment in both the national total value of landings and the national FTEs indicates its high importance for the Greek fishing sector. Unlike large-scale fisheries, the main cost in this fleet segment is the imputed value of unpaid labour, which, in fact, represents the value of the work of the owner. Though this fleet segment is characterized by negative net profit, the net profit plus the imputed value of unpaid labour is equal to 3.8 million. 219
222 National Chapters Polyvalent passive gears 6-12m (PGP 6-12m): This is the largest fleet segment since it contains 9,37 vessels. The total value of landings is million and the total FTEs employed in this fleet segment is 13,513. The value of landings represents 39% of the national value of landings, while the FTEs of the segment represent 56% of the total FTEs. The main cost of this segment is the imputed value of unpaid labour (31% of total expenses). Finally, as in the previous segment, the net profit is negative. Polyvalent passive gears 12-18m (PGP 12-18m): There are 184 vessels in this fleet segment, representing a total value of landings of 7.2 million (2% of the national total value of landings). Moreover, this fleet segment employs 342 FTEs (1% of the national FTEs). The main cost in this segment is the wages and salaries of the crew (26% of total costs). Other important costs are energy costs, other variable costs and annual depreciation costs. The net profit of this fleet segment is negative. Purse seiners 12-18m (PS 12-18m): There are 91 vessels in this segment. The total value of landings is 17.9 million (4% of the national total value of landings). The segment employs a total of 572 FTEs, thus contributing by 2% in the total employment of the sector. The main costs of the purse seiners of this segment are wages and salaries and other variable costs which represent 31% and 26% of total costs respectively. This segment yields a high net profit of 4.6 million. Purse seiners 18-24m (PS 18-24m): This segment includes 131 vessels with a value of landings equal to 29.7 million (7% of the national total value of landings). It employs a total of 1,214 FTEs, thus contributing by 5% in the national total employment of the sector. Wages and salaries are important cost elements of this segment, but the main costs are other variable costs, representing 38% of the total cost. The negative profit estimated for this fleet segment may be the result of overestimated variable costs or underestimated value of landings. Purse seiners 24-4m (PS 24-4m): The total number of vessels in this segment is 3 vessels, while the total value of landings is 7.9 million (2% of the national total). This segment employs 257 FTEs, which corresponds to 1% of the national total FTEs. The main costs of the vessels of this segment are wages and salaries of the crew (37% of total costs) and other variable costs (32% of total costs). This fleet segment is characterized by negative net profit, which as explained in the previous segments, may be the result of overestimated variable costs or underestimated value of landings. Assessment and Future Trends National Fleet The number of vessels continues to fall steadily from 17,657 in 28 to 16,63 in 212 but the average age increases. Total jobs remained almost stable at 23,862 in 28 to 23,944 in 212, and suggested that the cost of labour continues to be the main factor. According to data collected for the year 212, there is no net profit for Greek fishing vessels. However, this result maybe downward biased since the common methodology for the estimation of total weight and value of landings was not followed. In any case, the income from landings covers all expenses except the imputed value of unpaid labour and, therefore, the activity produces a positive income for fishermen. The main expenses of the fishing vessels are wages and the imputed value of unpaid labour as well as the energy costs. Small Scale Fleet In Greece, the majority of vessels (93%) are small-scale vessels. There are 14,93 small scale vessels with a combined gross tonnage of 28,834 GT and a total power of 274,75 kw. The large scale contains 1,16 vessels with a combined gross tonnage of 47,375 GT and a total power 18,934 kw. The small scale fleet employs a total of 19,394 FTEs, thus contributing by 81% in the national total employment of the sector. The small scale vessels consume 49.4 million litres while the large scale vessels consume 65.6 million litres of fuel. Energy costs are higher for small scale vessels (56.6%) than large scale vessels (52.4%). Large scale vessels benefit from the reduced price for fuel while the small scale fisheries do not have the flexibility to buy their fuel in advance; instead they buy a limited amount to cover very short term needs (Table and Table 5.1.4). Table Greek national fleet structure, employment and activity trends by fishing activity:
223 214 Annual Economic Report on the EU Fishing Fleet Arrows indicate change ( ) 212 to 211: ( ) increase; ( ) decrease and ( ) stable/no change ( between -1 and +1%) Variable SSF 212 LSF Activity Employment Structure No. Vessels (#) 14,93 1,16 Vessel tonnage (tonne) Vessel power (kw) Total employed (#) 21,78 5,778 FTE (#) 19,396 4,548 Average wage per employed (thousand ) Average wage per FTE (thousand ) Fishing days (thousand days) Energy consumption (milion litres) Landings weight (thousand tonnes) Data source: DCF 214 Fleet Economic (MARE/A3/AC(214)). Table Costs and capital value of the Greek national fishing fleet by fishing activity: 212. Arrows indicate change ( ) 212 to 211: ( ) increase; ( ) decrease and ( ) stable/no change ( between -1 and +1%) 212 Variable (million ) SSF LSF Costs Capital value Labour costs Energy costs Repair costs Other variable costs Non-variable costs Capital costs Depreciated replacement value Investments Data source: DCF 214 Fleet Economic (MARE/A3/AC(214)). Data issues There have been significant data issues in producing this chapter. The implementation of the National Programme has faced some difficulties during the last years which resulted in interrupted time series on the economic data. The lack of data and time series has created many shortfalls in the presentation of the fleet economic performance. The reader should note that Greek fleet revenues were estimated through the socioeconomic data questionnaires and not through the standard methodologies described in European Commission Decision 21/93. The figures for costs come from a survey based on probability sampling. Finally, the response-rate was low for 212 and since Greece has 16, km of coastline and hundreds of small and bigger ports, collecting data is not an easy task. 221

224 National Chapters Table Main socio-economic performance indicators by fleet segment in the Greek national fishing fleet in 212 Data source: Greek Socio economic survey 222
225 214 Annual Economic Report on the EU Fishing Fleet 5.11 IRELAND Fleet Structure, Fishing Activity and Production In 214 the Irish fishing fleet consisted of 2,22 registered vessels (as of 1/1/214), with a combined gross tonnage of 64.3 thousand GT, a total power of thousand kw and an average age of 26 years. The size of the Irish fishing fleet decreased between 213 and 214. In this period, the number of vessels decreased by around 2% (or 45 vessels) and total GT and kw of the fleet maintained relatively stable during the same period (Table ) While there was a decrease between 213 and 214 vessel numbers have shown consistent growth since 28 with the fleet increasing from 1,972 to 2,247 in 213. The major factors causing the fleet to increase during this period was the introduction of smaller vessels into the national fleet following the decommissioning scheme in 28 and new entries into the industry. However, overall tonnage and power has decreased in the same period. In 212, the number of fishing enterprises in the Irish fleet totalled 1,91, with the vast majority (87%), owning a single vessel and 13% of the enterprises owned two to five fishing vessels. Only.1% fishing enterprises owned six or more fishing vessels. However, it is possible, that individuals can own multiple vessels, which are registered under different company names so there may be, in reality, less single vessel enterprises. The number of vessels in the Small Scale Fleet (SSF) rose by 4% every year from 211 and prior increased by 2% between the years 212 and 213 with 1,313 vessels now classified as SCF (Table ). Table Irish national fleet structure, activity and production trends: Arrows indicate change ( ) 212 to 211: ( ) increase; ( ) decrease and ( ) stable/no change ( between -1 and +1%) Producti Fishing Effort Employment Structure Variable NATIONAL FLEET % Total No. Vessels (#) 1,972 2,44 2,119 2,162 2,23 2,247 2% 2,22 No. of Inactive vessels (#) % Average vessel age (year) % 27 Vessel tonnage (thousand GT) % 64 Vessel power (thousand kw) % 195 No. of Enterprises (#) 1,833 1,866 1,929 1,846 1,91 2,217 3% Total employed (#) 3,114 2,978 3,3 3,8 3,392 3,293 1% FTE (#) 2,27 1,993 2,84 2,262 2,233 2,28-1% Average wage per employed (thousand ) % Average wage per FTE (thousand ) % Days at sea (thousand days) % Fishing days (thousand days) % Energy consumption (milion litres) % Energy consumption per landed tonne (l/t) % Landings weight (thousand tonnes) % Landings value (million ) % % Note: energy consumption estimated from energy costs Data source: DCF 214 Fleet Economic (MARE/A3/AC(214)); data for 213 and 214 are provisional. Total employment in 212 was estimated at 3,392 jobs, corresponding to 2,233 FTEs. The level of employment increased between 211 and 212, with total employed increasing by 1% and the number of FTEs decreased by 1% over the same period. The major factors for this increase are due, in part, to the introduction of more vessels in the small scale fisheries. This increase in employment in the small scale fleet is estimated at 15% which can be explained by the corresponding increase in vessel numbers. The overall 223
226 National Chapters decline (1%) in FTE can be explained by the increase in total jobs in the SSF as these jobs are usually part time and do not equate to full time jobs. The large scale fisheries demonstrated an increase in total jobs figures of 6% with a decrease in the number of FTEs (2%). This trend mirrors reports from the fishers that crew are needed but are hard to find and that those that are hired are often hired part time which has an impact on the FTE figures. The decrease in average wage per FTE for the SSF is not a realistic trend. Wage data for the small scale fishery for 212 was sparse and total estimates are probably not indicative of the real figure. GT, kw (thousands) million / thousand tonnes Average price ( /kg) Landings value (million ) Vessel tonnage Vessel power No. Vessels FTE Total employed Landings value Landings weight Landings income Anglerfishes Atlantic mackerel Atlantic horse mackerel Jack and horse mackerels Figure Irish fleet: main trends no. vessels, employment (thousand) thousand days Landings weight (thousand tonnes) Days at sea Fishing days Energy consumption Anglerfishes Atlantic mackerel Norway lobster Anglerfishes million litres Atlantic horse mackerel Jack and horse mackerels Atlantic horse mackerel Atlantic mackerel Jack and horse mackerels Data source: DCF 214 Fleet Economic (MARE/A3/AC(214)); data for 213 are provisional. Top left capacity and employment; top right fishing effort and fuel consumption; middle left landings in value and weight; middle right average landed prices of top 5 species in terms of value landed in 212; bottom left landed value of top 5 species in terms of value landed in 212; and bottom right landed weight of top 5 species in terms of value landed in 212. In 212 the Irish over 1m fleet spent a total of around 53.6 thousand days at sea. The total number of days at sea increased by 1% between 211 and 212 and decreased again to 52.4 thousand days in 213. Days at sea in 212 increased to 56.4 thousand. Estimates of total days at sea for vessels under 1m LOA are around 18,393 and 126,182 for 211 and 212, respectively. These totals are estimated from a very small sample size of the less than 1m fleet and compensate for inactivity in the fleet by using an estimate of inactivity by 224
227 214 Annual Economic Report on the EU Fishing Fleet segment (which equals the inactivity of the 1-12m segments). The lack of logbook data from the under 1m fleet means that the reporting of transversal, landings, activity and true economic performance of this segment (which makes up a large proportion of the Irish fleet) is based solely on the limited results from the sentinel vessel survey (Table ; Figure ). The quantity of fuel consumed in 212 totalled 69.5 million litres, an increase of 8% from 211. The major factor causing the increase in fuel consumption is the associated increase in days at sea in 212. The total weight landed by the Irish fleet in 212 was 262 thousand tonnes of seafood, with a landed value of 241 million. The total weight and value of landings increased over the period analysed. The increase in total weight of landings from 28 to 21 can be explained by the increase in pelagic catches, especially boarfish which increased by over 66 thousand tonnes in the same period. The catches of boarfish reduced dramatically between 21 and 211 by 63 thousand tonnes and count predominantly for the reduction in overall landings between these years. The increase in landed weight from to thousand tonnes, an increase of 32%, between 211 and 212 is explained by a corresponding increase in pelagic landings in the same period. There were increased landings of boarfish, herring, jack and horse mackerel, sprat and blue whiting. Together these species totalled 58.5 thousand tonnes in 212 accounting for 93% of the increase in landed weight from 211 to 212 (Figure ). The prices obtained for the 3 key pelagic species landed by volume (mackerel, horse mackerel and herring), showed contrasting trends between 211 and 212: a decrease in the price for Atlantic mackerel (.75 to.71 /kg) and an increase for horse mackerel (.45 to.52 /kg) and herring (.33 to.4 /kg). Boarfish (BOR) was the third largest landed species by volume and received prices of.13 /kg in 212 and an increase from prices in 211 from.9 /kg. This trend has continued for 213 with process increasing to.14 /kg and.18 /kg for BOR and BOC respectively. Overall the most important species by landings volume and value remains the pelagic species, Nephrops and monkfish. Mackerel, and horse mackerel accounted for 38% of the total landings value in 212 and 41% of total volume. Nephrops, while only accounting for 4% of the total volume of landings made up 18% of the total value in 212 with a value of 18 million. This indicates stable trends between 21, 211 and 212 despite slight decreases in price of Norway lobster. National Fleet Economic performance The total amount of income generated by the Irish national fleet in 212 was 35 million. This consisted of 3 million in landings value and 5.2 million in non-fishing income. The Irish fleet s total landings income increased 22% between 211 and 212. Total fishing income is composed of the total value of landings from logbooks and estimated totals on other income taken from financial statements completed by accountants on behalf of a sample of fishermen. Total landing income also estimates, where possible, income for vessels under 1m in length. This introduces data for vessels under 1m and as such results in a higher estimate of income value from landings values. As sample data are raised to population level variability in the data can, in some cases, inflate or reduce the overall landings income estimate. The high increase in landing income in 212 can in part be explained by the sampling framework and the low survey return for 212. The increase in landing value can also be explained by the slight increase in active vessels. Total operating costs incurred by the Irish national fleet in 211 amounted to 261 million, or more than 85% of total income. Crew cost and fuel costs, the two major fishing expenses, were 9.5 and 52.1 million respectively. Between 212 and 211, total operating costs decreased by 13%. The share of total income represented by each operating cost is relatively stable between 212 and 211, except for labour costs, whose share increased by 34%. In terms of economic performance, the total Gross Value Added (GVA), gross profit and net profit generated by the Irish national fleet in 212 were 178 million, 87 million and 44 million, respectively. Gross Value Added (GVA) and gross profit increased between 211 and 212. The major factor driving this overall increase economic performance was the higher estimate of total income, reductions in non-variable and capital costs experienced in 212. As there are uncertainties surrounding estimated income and costs, economic performance indicators may not be as positive as presented here. In 212, the Irish fleet had an estimated 225
228 National Chapters (depreciated) replacement value of 362 million. Investments by the fleet amounted to 82 million in 212 (Table ; Figure ). The depreciation and investment differ starkly from other years. This is largely due to the small sample size and the total estimates that were imputed form these samples. In terms of the profitability and development trends the national fleet improved for net profit margin (%), RoFTA (%) and remained stable for GVA per FTE (thousand ). However, the dramatic trends for net profit margin (%) and RoFTA (%) presented in Table are most likely not realistic. These high increases are due, in part, to the decrease in estimates of total costs from 211 to 212 and the associated estimate of net profit. Table Irish national fishing fleet economic performance in and projections for 213. Development trend based on % net profit margin 212 to average net profit margin Arrows indicate change ( ) 212 to 211: ( ) increase; ( ) decrease and ( ) stable/no change ( between -1 and +1%) Variable (million ) National Fleet % Income Costs Economic Indicators Capital value Profitability and development trends Landings income % Other income % Labour costs % Energy costs % Repair costs % Other variable costs % Other non-variable costs % Capital costs % GVA % Gross profit % Net profit % Depreciated replacement value % Investments % Net profit margin (%) % development trend Improved 674% RoFTA (%) % development trend Improved 214% GVA per FTE (thousand ) % development trend Improved 66% Data source: DCF 214 Fleet Economic (MARE/A3/AC(214)); data for 213 are provisional. Note: Capital value (replacement value and Investment) estimated for active vessels only 226


229 214 Annual Economic Report on the EU Fishing Fleet 35 3 million Performance indicators (million ) Landings income Other income Revenue GVA Gross profit Net profit Figure Irish main economic performance trends : million % Crew wage costs Unpaid labour Energy costs Repair costs Other variable costs Other non-variable costs Annual depreciation GVA to Revenue Gross profit margin Net Profit margin RoFTA Top left income structure; top right cost structure; bottom left economic performance indicators; bottom right performance indicators as a % of revenue (landings income + other income) (projected figures for 213). Fleet Segment Level Economic performance The Irish fleet is highly diversified with a broad range of vessel types targeting different species predominantly in areas VIIa, VIIb, VIIg and VIIj (Figure ). The national fleet consisted of 23 (DCF) fleet segments in 213, with inactive vessel across five length classes consisting of 179 vessels for segments over 1m in length. For the nine segments that have sufficient data to calculate profitability three have high profitability, two reasonable and four weak profitability classifications. Figure Irish fleet effort and landings by FAO fishing area, 212. Colour shows fishing days (thousand days) and landings in weight (thousand tonnes); Value shows days-at-sea (thousand days) and landings in value (thousand ). Source: DCF 214 Fleet Economic (MARE/A3/AC(214)) 227
230 National Chapters Table and Table provide a breakdown of key performance indicators by main fishing activity (small and large-scale) in 212. Table provides a breakdown of key performance indicators for these segments in 212. A short description of the 3 most important segments in terms of total value of landings is provided below. Pelagic Trawl over 4m 21 vessels made up this segment in 212 which operates predominantly in VIa and VIIj. The fleet targets a variety of species but in particular pelagic species, including mackerel, horse mackerel and Atlantic herring. In 212, the total value of landings was almost 91.6 million and around 197 FTEs were employed in this fleet segment, contributing 37% and 8.8% of the total income from landings (over 1m) and FTEs generated by the Irish fishing fleet, respectively. This fleet segment was highly profitable, with a reported gross profit of around 45 million and net profit of 33 million in 212. Employment in this sector increased slightly by 5% but this is accounted for by the increase of in total active vessels from 19 to 21 from 211 to 212. Crew numbers range per vessel has fallen from 11 to 9 as raw material allocations and consequent fishing seasons have become more truncated. There is high profitability for 212 with an improved economic development trend. In 29 all Irish pelagic vessels implemented a Seafood Environmental Management System on-board their vessels. As part of this process they identified potential environmental risks from fishing and implemented measures to eliminate or reduce these risks to acceptable levels. The SEMS manual on each vessel has records that they complete during each trip and this provides proof that they are operating to the pre-agreed standards. Boarfish landings initially were very small and typically fluctuated between 1 and 7 t per year from 21 to 29. As the demand for fishmeal raw material grew and fishermen perfected their ability to target and pump boarfish ashore, the volumes increased, peaking at 89 thousand tonnes in 21. In 211 a precautionary Total Allowable Catch of 33 thousand tonnes was set for the first time. This was subsequently raised to 88 thousand tonnes in 212 and 213 and rose again in 214 to 127,59 tonnes of which Ireland has the majority of this TAC share with 88,115 tonnes representing 69% of the total TAC. Demersal Trawl 18m-24m 64 vessels make up this segment which operates predominantly in VIa, VIIb and VIIg. The fleet targets a variety of species but in particular demersal species, such as Norway lobster, anglerfish and whiting. In 212, the total value of landings was almost 4 million and around 43 FTEs were employed in this fleet segment, contributing to 16% and 18% of the total income from landings and FTEs generated by the Irish fishing fleet, respectively. This fleet segment presented a gross profit of around 8.6 million and net profit of 3 million in 212. Indicates reasonable profitability for 212 with an improved economic development trend with improved GVA and Gross profit. Demersal Trawl 24m-4m 37 vessels make up this segment which operates predominantly in VIa, VIIb and VIIg. The fleet targets a variety of species, such as Norway lobster, anglerfish and mackerel. In 212, the total value of landings was almost 4 million and around 313 FTEs were employed in this fleet segment, contributing to 16% and 11% of the total income from landings and FTEs generated by the Irish fishing fleet, respectively. This fleet segment generated a gross profit of around 6.8 million and net profit of 1.4 million in 212. Indicates reasonable profitability for 212 with an improved economic development trend. Assessment and Future Trends National Fleet The composition, by segment, of the Irish national fleet (i.e. >1m and <1m LOA) in 212 and 213 reflects that reported for 211. No significant removals or additions to the national fleet occurred other than adjustments due to accidental loss, damage and occasional redundancy. There has been a 2% increase in vessel numbers in the <1m LOA segments. Running costs continue to be a key driver influencing the economic performance of the Irish national fleet in 212, particularly those associated with the identification and retention of crew and the cost of fuel and oils. Although marine gas oil prices throughout 212 and into 213 have shown some volatility they have 228
231 214 Annual Economic Report on the EU Fishing Fleet maintained a slow annual increase in average price, which is consistent with the 5 year trend in the prices of crude, bunker and marine gas oil. While there has been a general improvement in the economic performance of the Irish fleet there is concern that these could be offset by reduced profits and increased costs resulting from the landing obligation under the new CFP (Article 15). Small Scale Fleet The number of vessels (under 1m) rose by 3% every year from 211 and prior to 211 increased by 8% and 5% between the years 28/29 and 29/21 respectively. Overall, this represents a 25% increase in the number of under 1m vessels from 1337 to 1677 between the years 28 and 213. The number of the small scale fleet demonstrates a similar trend (under 12m passive gears). This segment consisted of 1317 vessels in 213, an increase from 1159 vessels in 29 (Table and Table ). The division of the fleet into small scale and large scale fisheries may not be a satisfactory aggregation for the Irish Fleet. This is because the small scale group includes both vessels with log book data (1-12 metres in length) and those without (under 1 metres in length); the latter reply on a limited sentinel survey for their estimates. The increase in vessels numbers under 1m has been driven in part by the economic downturn in Ireland and the increase in unemployment which has attracted more entries into this sector, re-entry into the segment after the decommissioning scheme in (25-28) may also have occurred. These new and re-entries into the fisheries often target lobster and crab and there are worries that this could have an adverse effect on the stocks. The small scale fishery is very sensitive to market prices. Whelk prices have fluctuated greatly over the last number of years. Prices had fallen to below.7/kg but have risen, over the last couple of years, to over 1.5/kg due to a competitive market with landings been exported for human consumption to the Far East including Taiwan and Europe. This 114% increase in price has attracted more vessels into the fishery. The increase in the new entrants to the fishery has also been augmented by the low cost of investment with whelk pots costing less than lobster pots. The rise in vessels targeting whelk has increased the pressure on the fishery with effort increasing dramatically and putting the stock in treat of collapse. The razor fishery is experiencing a similar trend. Due to reducing lobster catch rates and a fear of fishermen of losing pots in storms (as experienced in 214) some pot fishermen are turning to the razor fishery. The price for frozen razors has increased driving this trend further. Standards and accreditation The MS launched an internationally recognised, third party accredited; Responsibly Sourced standard for wild seafood in 21. This programme is now fully accredited to ISO65 and to date 8 vessels have achieved certification. A requirement in the achievement of this standard is the provision of economic data in compliance with the DCF regulation. As vessels of the national fleet engage with this programme, the rate of DCF survey returns is expected to increase. Increasingly strong market demands for certified seafood products continue to generate a positive industry response to this opportunity with increased national and overseas interest capitalising growth in this area. The ISO65 Responsibly Sourced Standard is considered to be of particular significance to vessels of the pelagic and polyvalent fleets targeting mackerel, which formerly held Marine Stewardship Council (MSC) certification. MSC certification of the herring fishery in the Celtic sea was achieved in 212 and is prosecuted by a small fleet of 34 Irish registered vessels. The internationally accredited (ISO65) Responsibly Sourced Standard has provided a national certification programme for Wild Seafood, which has been successfully achieved by a number of segments of the Irish fleet and a smaller number of related onshore facilities. Increasingly strong market demands for certified seafood products continue to generate a positive industry response to this opportunity with increased national and overseas interest capitalising growth in this area. The ISO65 Responsibly Sourced Standard is considered to be of particular significance to vessels of the pelagic and polyvalent fleets targeting mackerel, which formerly held Marine Stewardship Council (MSC) certification. 229
232 23 National Chapters MSC certification of the herring fishery in the Celtic sea was achieved in 212 and is prosecuted by a small fleet of 34 Irish registered vessels. The MSC defines the unit of certification (UoC) as The fishery or fish stock (biologically distinct unit) combined with the fishing method / gear and practice (= vessel(s) pursuing the fish of that stock) and management framework. To take into account the mixed demersal fishery context in which the majority of Irish fisheries operate a métier approach was used to define the Unit of Certification. A total of 19 métiers were identified for mixed demersal fisheries. The MSC unit of certification was defined for each fish stock and therefore a number of units of certification were defined for a given metier. Overall the project examined 8 fishing gear, fishing 18 species, over several ICES areas (stock management units) creating a total of 79 Units of Certification. Information from this study feeds directly into the development of BIM s responsibly sourced standard and general work programme. Bio-marine Ingredients Facility A proposal for the construction of the world s largest marine food ingredients facility in Killybegs in County Donegal is the result of a partnership between KFO (Killybegs Fishermen s Organisation) and BST (Biomarine Science Technology). The plant plans to extract high-end proteins, oils and calcium from fish for use as food ingredients. The final outputs of the plant will be bioactive peptides/lipids (oils) and amino acids which will supply the high growth sectors of premium pet foods and sports nutrition. The construction of this plant will see an investment of 35M in the local economy and could see the creation of 5 jobs in the construction phase and a further 7 direct and indirect jobs when the plant goes into production. The plant will have the capacity to process up to 5, tonnes of raw material annually. Boarfish will be the primary source of raw material for this plant but it will be capable of processing other pelagic species such as blue whiting. Currently boarfish is processed into fishmeal for the aquaculture sector and hence receives a low price at auctions. It is expected that this new market for boarfish will lead to an increase in fish prices received by the pelagic fleet. Added to this there will be a cost reducing effect as the fleet will now land their boarfish catches in Killybegs rather than travelling to distant ports to receive better prices. In 29 total landings increased from 21 thousand tonnes to 68.6 thousand tonnes, with only 6 thousand tonnes of this increase being landed in Ireland (23 thousand tonnes in Denmark; +19 thousand tonnes in Faroes). The trend of increased Landings of Boarfish (BOC and BOR) continued in 211 with landings increasing to 89 thousand tonnes. In 211 this trend ceased and landings decreased dramatically in 211 to 2.6 thousand tonnes with the introduction of quota, catches increase in 212 and 213 to landings above 5 thousand tonnes corresponding to an increase in TAC. The Irish fleet has a quota of 88 thousand tonnes of boarfish in 214. Seal predation A recent study led by Board Iascaigh Mhara (BIM), (Cosgrove et al., 213) has investigated concerns that there have been increased interactions between seals and fisheries in Irish waters. The study monitored fisheries utilising gill nets for hake and pollack, trammel nets for turbot and tangle nets for crawfish and other species. The study concluded that an average of 18% of pollack, 1% of hake and 59% of monkfish landings were depredated by seals. The proportions of fish damaged and related economic impact of seal depredation in set net fisheries has substantially increased since the 199 s. The total loss of landings could rise to over 5% in both the pollack and hake fisheries when potential numbers of fish entirely removed from nets are taken into account. The upper limit of the total annual value of seal damaged fish in pollack and hake set net fisheries is estimated 1.7m. The study primarily focussed on the direct effects of seal depredation on catches in Irish set net fisheries the indirect effects of a potential economic impact of increasing seal populations on the same resources targeted by fishermen was not a focus of the study. The overall proportion of visually observable seal depredated pollack in the current study (18%) was considerably higher than the proportion of cod (1%) observed in a 199 s study suggesting that the economic impact of seal depredation on inshore gill netting may have increased substantially. Insufficient data are available to permit extrapolations regarding the total value of seal depredated fish in tangle or trammel net fisheries but estimations of the daily loss experienced by the study suggest that predation on monkfish can reduce daily landings considerably typically representing a 15-25% decrease of
233 214 Annual Economic Report on the EU Fishing Fleet daily gross landed value. It is thought that directed set net fisheries for monkfish are no longer commercially feasible off the south west coast of Ireland due to seal depredation. Based on an overall depredation rate of 18%, the total value of pollack depredated by seals is thought to be in the region of.4m for 212. Taking into account potential hidden losses the value of depredated fish could range from.72 to 1.18m. The overall proportion of visually observable depredation of 1% of potential hake landings in the study represents a 3% increase observed in the same fishery in the mid 199 s. Based on an overall depredation rate of 1%, the total value of Hake depredated by seals is estimated at 114, for 212. Taking into account potential hidden losses the total value of seal depredated fish could range from 286, up to 526,. The total loss of fish taken by seals from nets could rises to over 5% of the catch in both the pollack and hake fisheries when potential hidden losses are taken into account. A longer trend of the main indicators analysed, including data from the Data Collection Regulation (DCR, 22-27), is provided at the end of this chapter. Data issues The effort data in the tables and graphs is not complete. The figures for days at sea and fishing days reported are those for vessels over 1m only for which there is logbook declaration data. The exclusion of the less than 1m fleet was due to the fact that this segment is not mandated to carry and complete logbooks for fishing operations. Estimates of days at sea for this segment have been calculated from a small sample of this fleet but have not been included in the data call due to the uncertainty surrounding these data. Although the operation of the economic aspect of the data collection framework has been much improved relative to previous years, the MS sampling targets were not fully achieved in 213 (for 212 data) albeit at a much higher level than in previous years. This situation is far from ideal and as a result, survey response rates are highly variable and unpredictable. Survey target rates vary between fleet segments with a high achievement of sampling targets in a number of segments and an under- achievement of targets in other segments. The MS continues to rely on the goodwill of the seafood industry to provide data on a voluntary basis. Response to the annual fisheries economic survey is slow and returns are received throughout the year past the deadline for submission. This is an annual issue and in 212 the data collection (211 data) had an average overall sample rate of 6%. Continued data collection throughout 213 meant that this rate had increased to 11% by the time of the 214 data call for data. The MS has planned to review the timing of the national economic fishery survey to address this issue. Table Irish national fleet structure, activity and production trends by operational scale: Arrows indicate change ( ) 212 to 211: ( ) increase; ( ) decrease and ( ) stable/no change ( between -1 and +1%) Structure Employment Fishing Effort Output Variable Small scale Fleet % Large scale fleet No. Vessels (#) 1,3 1,159 1,19 1,23 1,281 1,317 4% % Average vessel age (year) % % Vessel tonnage (thousand GT) % % Vessel power (thousand kw) % % Total employed (#) 1,293 1,98 1,26 1,438 1,648 1,528 15% 1,821 1,88 1,77 1,642 1,744 1,818 FTE (#) % 1,526 1,443 1,454 1,414 1,392-2% Average wage per employed (thousand ) % % Average wage per FTE (thousand ) % % Days at sea (thousand days) % % % Fishing days (thousand days) % % Energy consumption (milion litres) % % Energy consumption per landed tonne (l/t) % % Landings weight (thousand tonnes) % % Landings value (million ) % % 231
234 National Chapters Table Economic performance of the Irish national fishing fleet by operational scale: Development trend based on % net profit margin 212 to average net profit margin Arrows indicate change ( ) 212 to 211: ( ) increase; ( ) decrease and ( ) stable/no change ( between -1 and +1%) Variable (million ) Small scale Fleet % Large scale fleet % Income Costs Economic Indicators Capital value Profitability and development trends Landings income % % Other income % % Labour costs % % Energy costs % % Repair costs % % Other variable costs % % Non-variable costs % % Capital costs % % GVA % % Gross profit % % Net profit % % Depreciated replacement value % % Investments % % Net profit margin (%) % % development trend Deteriorated -124% Improved 92% RoFTA (%) % % development trend Deteriorated -1165% Improved 87% GVA per FTE (thousand ) % % development trend Deteriorated -8% Improved 93% 232
235 214 Annual Economic Report on the EU Fishing Fleet Table Main socio-economic performance indicators by fleet segment in the Irish national fishing fleet in 212. Development trend based on % net profit margin 212 to average net profit margin Arrows indicate change ( ) 212 to 211: ( ) increase; ( ) decrease and ( ) stable/no change ( between -1 and +1%) Fleet segment No. of vessels (N) % FTE (N) % Days at sea (days) % Energy consumption (litres) % Value of landings (thousand ) % Weight of landings (thousand tonnes) IRLAREA27DFNVL % % % 33 86% % % % % % % % Weak IRLAREA27DFNVL % 16-15% 183 9% 21-55% 3273 % 233 7% % % % IRLAREA27DRBVL % % % % % IRLAREA27DRBVL % 29 22% 1327 % 269 3% 64-94% 51-4% % % IRLAREA27DRBVL % % % % % GVA (thousand ) % GVA per FTE ( /FTE) % Gross profit (thousand ) % Net profit (thousand ) % Net profit margin (%) % Profitability (212) Net profit margin % average (28-11) Economic developmen t trend IRLAREA27DRBVL % 5-83% % 13-99% % % % % 444-9% 19-93% 31 27% High -32% Deteriorated IRLAREA27DTSVL % % % % % % % % % % % Weak -26% Deteriorated IRLAREA27DTSVL % 43 8% % % % % % % % % 6 117% Reasonable 133% Improved IRLAREA27DTSVL % 25-33% % % % % % % % % 3 121% Reasonable 14% Improved IRLAREA27FPOVL % 59-11% % % % IRLAREA27FPOVL % 111 % 6837 % % % % % % % % % Weak IRLAREA27FPOVL % 44 52% % % % % % % % % % High 1277% Improved IRLAREA27HOKVL % 28 98% IRLAREA27HOKVL % 1-81% % 142-8% % % % % IRLAREA27PMPVL IRLAREA27PSVL1 8 % IRLAREA27TBBVL1 1-5% 1-47% IRLAREA27TBBVL % % % % IRLAREA27TMVL1 61 3% 14 IRLAREA27TMVL IRLAREA27TMVL % % % % % % % % % % % Weak -341% Deteriorated IRLAREA27TMVL4XX 21 11% 197 5% % % % % % % % % % High 129% Improved Data source: DCF 214 Fleet Economic (MARE/A3/AC(214). 233
236 GT, kw (thousands) Landings value (million ) Vessel tonnage Employed 24 Anglerfishes 25 Atlantic mackerel Vessel power No. Vessels million Performance indicators (miilion ) % Atlantic horse mackerel no. of vessels, employed (thousand) Jack and horse mackerels thousand days Landings value (million ) Energy consumption (million litres) Days at sea Fishing days Energy consumption Anglerfishes Atlantic mackerel Norway lobster Atlantic horse mackerel Jack and horse mackerels million / thousand tonnes Landings weight (tousand tonnes) % 5% 4% 3% 2% 1% -1% National Chapters 213 Landings value Landings weight Landings income Anglerfishes Atlantic mackerel % Atlantic horse mackerel Jack and horse mackerels Landings income Direct income subsidies Other income Fishing rights income Income GVA Net profit GVA to Revenue Net profit margin 234
237 214 Annual Economic Report on the EU Fishing Fleet 5.12 ITALY Fleet Structure, Fishing Activity and Production In 212, the Italian fishing fleet consisted of 14,433 registered vessels, with a combined gross tonnage of 166 thousand GT, a total power of 1,176 thousand kw and an average age of 28 years. The size of the Italian fishing fleet decreased between 22 and 212, with the number of vessels decreasing 11% and kw 9%. Over the same period total employed decreased 26%. The largest part of the fleet is the small scale fleet, which is composed of vessels under 12m using passive gears only. They mainly use set nets, long-lines, pots and traps and are managed on a family and artisanal basis. This part contains around two thirds of all Italian fishing vessels (8,652), but due to their small size on average around 2 GT per vessel - they only account for 9% of the total tonnage of the national fleet. In 212, the number of fishing enterprises in the Italian fleet amounted 9,142, with the vast majority (84%), owning a single vessel. Only 14% of the enterprises owned two to five fishing vessels and 1% owned more than six vessels (most of them represented by fishing cooperatives). Total employment in 212 was estimated at 28,292 jobs, corresponding to 2,716 FTEs (Table ; Figure ). Table Italian national fleet structure, activity and production trends: Arrows indicate change ( ) in relation to 21: ( ) increase; ( ) decrease and ( ) stable/no change ( between -1 and +1%) Variable NATIONAL FLEET % Product Fishing Effort Employment Structure Total No. Vessels (#) 15,38 14,977 14,969 14,715 14,433 14,139-2% No. of Inactive vessels (#) 1,568 1,63 1,685 1,396 1,545 11% Average vessel age (year) % Vessel tonnage (thousand GT) % Vessel power (thousand kw) 1,273 1,271 1,119 1,237 1,176 1,145-5% No. of Enterprises (#) 9,96 8,663 8,782 9,274 9,142-1% Total employed (#) 29,64 29,222 29,222 28,966 28,292 27,716-2% FTE (#) 21,817 22,242 21,838 2,665 2,716 2,261 % Average wage per employed (thousand ) % Average wage per FTE (thousand ) % Days at sea (thousand days) 1,591 1,783 1,668 1,748 1,556 1,494-11% Fishing days (thousand days) 1,53 1,752 1,646 1,742 1,538 1,581-12% Energy consumption (milion litres) % Energy consumption per landed tonne (l/t) 1,97 1,85 1,792 1,922 1,78-11% Landings weight (thousand tonnes) % Landings value (million ) 1,16 1,22 1,115 1, % Data source: DCF 214 Fleet Economic (MARE/A3/AC(214)); data for 213 are provisional. Note: capacity data refers to the average fleet over the reference year (28-212); capacity data for 213 includes fleet at 1 st January and refers to active and inactive vessels. In 212, the Italian fleet spent a total of around 1,556 thousand days at sea, a decrease of 11% from 211 and a decrease of 39% from 22. One of the main factors causing the decrease in effort was the reduction in capacity. Other factors are related to the type of activity organisation, where operators spontaneously adopted strategies to optimise time spent at sea, for commercial reasons and in order to cut operation costs associated to fishing and landing activities. The quantity of fuel consumed in 212 totalled around 336 million litres, a decrease of 54% from 22. The major factor causing the decrease in fuel consumption was the reduction in total effort, see Figure
238 National Chapters The total weight landed by the Italian fleet in 212 was around 197 thousand tonnes of seafood, with a landed value of million. The total value of landings decreased 35% between 22 and 212. Over the same period the total weight of landings decreased 38%. In 212, European anchovy and European hake generated the highest landed values ( 75 million and 74 million respectively), followed by other marine fish ( 65 million), deep water rose shrimp ( 56 million) and swordfish ( 45 million). In terms of landings weight, in 212 the volume of European anchovy landed amounted to 43 thousand tonnes, other marine fish 1 thousand tonnes, European hake 9 thousand tonnes, deep water rose shrimp 8 thousand tonnes and swordfish 4 thousand tonnes. GT, kw (thousands) million / thousand tonnes Landings value (million ) Vessel power Vessel tonnage No. Vessels FTE Total employed Data source: DCF 214 Fleet Economic (MARE/A3/AC(214)); data for 213 are provisional. Figure Italian fleet main trends / no. vessels, employment (thousand) Landings value Landings weight Landings income Deep-water rose shrimp European hake Swordfish European anchovy Marine fishes nei thousand days Average price ( /kg) Landings weight (thousand tonnes) Top left capacity and employment; top right fishing effort and fuel consumption; middle left landings in value and weight; middle right average landed prices; bottom left - top 5 species in terms of value landed; and bottom right top 5 species in terms of weight landed Days at sea Fishing days Energy consumption Deep-water rose shrimp European hake Swordfish European anchovy Marine fishes nei Deep-water rose shrimp European hake Swordfish European anchovy Marine fishes nei million litres Between 211 and 212, landed weight and value show decreasing tendencies for all top species. Prices decreased considerably in 212, with only one exception being the average price of European anchovy, which increased slightly by 1%. 236
239 214 Annual Economic Report on the EU Fishing Fleet Between 22 and 212 landings of deep water rose shrimp decreased 43% in value and 31% in weight. Over the same period, landings of European anchovy and European hake both decreased by around 15% in weight and 4% in value. Swordfish landings (in weight and value) increased by 14% from 22 to 212. National Fleet Economic performance The total amount of income (exclusively composed of income from landings) generated by the Italian national fleet in 212 was around 932 million, a decrease of 15% from 211. Total operating costs incurred by the Italian national fleet in 212 amounted to 688 million. Crew cost and fuel costs, the two major cost items, were 228 and 27 million, respectively ( Table ). Between 211 and 212, total operational costs decreased 16%, largely due to the significant decrease in fishing activities. The percentage incidence of operational cost on total income has in fact increased from 72% in 211 to 74% in 212, reaching the highest level during the last five years. The general deterioration in economic performance of the fleet has also had a negative impact on labour costs; in 212 crew salaries, due to the share system contract, fell considerably compared to previous years (e.g. -18% compared to 211). Table Italian national fishing fleet economic performance in 212 and projections for 213. Development trend based on % net profit margin 211 to average net profit margin Arrows indicate change ( ) in relation to 21: ( ) increase; ( ) decrease and ( ) stable/no change ( between -1 and +1%) Variable (million ) National Fleet % Income Costs Economic Indicators Capital value Profitability and development trends Landings income 1,15.6 1,22. 1, , % Other income Labour costs % Energy costs % Repair costs % Other variable costs % Other non-variable costs % Capital costs % GVA % Gross profit % Net profit % Depreciated replacement value 1, % Investments % Net profit margin (%) % development trend Deteriorated -5% RoFTA (%) % development trend Deteriorated -45% GVA per FTE (thousand ) % development trend Deteriorated -23% Data source: DCF 214 Fleet Economic (MARE/A3/AC(214)); data for 213 are provisional. In terms of economic performance, the total amount of Gross Value Added (GVA), gross profit and net profit generated by the Italian national fleet in 212 were 472 million, 244 million and 47 million, respectively. Gross Value Added (GVA), gross profit and net profit decreased by 19%, 2% and 41% respectively between 211 and 212, reaching the lowest values over the last five years. The general crisis in the sector is also confirmed by the trend observed in the profitability indicators. In 212 net profit margin and the RoFTA indicators decreased considerably. Trends of the main profitability indicators also show a clear decreasing tendency between 28 and
240 Performance indicators (million ) % million million National Chapters In 212, the Italian fleet had an estimated (depreciated) replacement value of 882 million, a decrease of 4% compared to the previous year, a reduction which is mainly due to the decline in vessel number. The costs and earnings of the small-scale fleet followed a similar trend to that of the national fleet: between 211 and 212, landings value decreased 19%; energy costs decreased 17% with total operating costs decreasing 18%. In terms of profitability, even if deteriorating, the net profit margin and RoFTA estimated values show lower decreases, when compared to national fleet indicators Landings income Other income Revenue GVA Gross profit Net profit Figure Italian fleet main economic performance trends Data source: DCF 214 Fleet Economic (MARE/A3/AC(214)); data for 213 are provisional. Top left Landing income; top right cost structure; bottom left cost items as a percentage of income (fishing income and other income); bottom right economic performance indicators Crew wage costs Unpaid labour Energy costs Repair costs Other variable costs Other non-variable costs Annual depreciation GVA to Revenue Gross profit margin Net Profit margin RoFTA Fleet Segment Level Economic performance The Italian fleet is highly diversified with a broad range of vessel types targeting different species predominantly in the Adriatic and South Tyrrhenian Seas (Figure ). The national fleet consisted of 24 (DCF) fleet segments in 212 and six inactive length classes consisting of 1,428 vessels. Ten of the active fleet segments made losses in 212, while sixteen made overall net profits. Table and Table provide a breakdown of the main performance indicators by fishing activity (small, large and distant-water fleets). Table provides a breakdown of key performance indicators for all Italian fleet segments in 212. A short description of the five most important segments in terms of total value of landings is provided below. 238
 and landings in weight (thousand tonnes); Value shows days-at-sea (thousand days) and landings in value (thousand ).")

241 214 Annual Economic Report on the EU Fishing Fleet Figure Italian fleet effort and landings by FAO fishing area, 212. Colour shows fishing days (thousand days) and landings in weight (thousand tonnes); Value shows days-at-sea (thousand days) and landings in value (thousand ). Source: DCF 214 Fleet Economic (MARE/A3/AC(214)) Passive gears polyvalent 6 12m: In 212, the landings of passive gears 6-12m amounted to 21% of total national landings in value and 12% in volume. Landings from this segment amounted to 25,553 tonnes, corresponding to almost 197 million. This fleet segment is the most relevant from a social and job-related point of view, with 5,875 vessels and employing around 5,919 FTEs. In 212, the level of activity equated to 13 average days at sea, a decrease of 5% compared to 211. Catch is dominated by cuttlefish, which amounted to 1,9 tonnes and a landed value of 17 million, accounting for 9% of the volume of landings and 7% of revenues. In 212, common octopus accounted for 6% of landings in weight and value. European hake is the third most important species, accounting for almost 6% of total volume and 5% of total revenues of this fleet segment. This fleet segment was not particularly profitable in 212, with a reported gross profit of around 67 million and an estimated net profit of around 28 million, a reduction of 9% and 12% respectively from 211. Demersal trawl / seine 12 18m: The second most productive fleet in the Italian fishery is made up of 1,343 vessels operating mostly with bottom trawls and beam trawls. These vessels represent 9% of the entire Italian fleet, contributing 13% of the volume and 18% of the overall revenue. Between 211 and 212, landings generated by this segment decreased 15% in weight and 21% in value. The level of activity further decreased 4% in 212, with an average of 135 days at sea per vessel. Gross profit and net profit decreased 49% and 32%, respectively from 211. The main species for this segment is European hake with 3,233 tonnes landed at a value of 24 million in 212. The second most important species in terms of landed weight is red mullet, with 2,959 tonnes and a value of 15 million. The deep-water rose shrimp is the third most important species, with landings totalling 2,286 tonnes, 9% of total landings in terms of weight and value. The main production area for this species is the Sicilian Channel. Demersal trawl / seine 18 24m: In 212, 693 vessels made up this segment, showing a reduction of 5% compared to 211. These vessels target demersal species such as deep water rose shrimp, European hake, red mullet, Norway lobster and musky octopus. The total value of landings amounted to 166 million and contributed to 18% of the total Italian landings income, decreasing 1% from 211. Around 2,312 FTEs were employed in this fleet segment in 212, contributing 13% of the national total. In 212, this fleet segment reported a loss of 6.6 million, confirming the decreasing trend of the previous years. Demersal trawl / seine 24 4m: These vessels, which are managed by a more industrial approach, in 212 represented 1.5% of the total Italian fleet in terms of vessels numbers and accounted for 12% of the total landing weight and 18% of total national revenues. The target species are mainly composed by deep water rose shrimp, giant red shrimp, European hake and Norway lobster, which respectively accounted for 18%, 35%, 8% and 15% of the landings value of this fleet segment. 239
242 24 National Chapters Around 1,278 FTEs were employed in this fleet segment in 212, with a further reduction of 2% compared to 211. In 212, this fleet segment registered a loss of 6.2 million, following the same trend observed in previous years. Over the last few years vessels above 24 meters have been suffering a deep crisis due mostly to high fuel costs and substantial reductions in landings, which decreased 17% in terms of weight and 2% in value. Dredges 12 18m: In 212, there were 72 vessels operating predominantly around the Central-Northern Adriatic coast (GSA 17), employing around 263 FTEs. This fishery almost exclusively targets clams and is comanaged at compartment level by local consortia. In 212, total landings amounted to almost 21,96 tonnes corresponding to 22 million. The performance of this fleet is highly variable due to cyclic abundance of clams. In 212, hydraulic dredges operated for 78 days on average, an 8% decrease from 211. Between 211 and 212, production levels remained relatively stable. However, income decreased 17% and gross profit decreased 23%. Assessment and Future Trends National Fleet In 213, the number of active vessels continues to fall steadily from 12,897 in 212 to 12,63 in 213 with a 2% reduction in number and 5% in gross tonnage. According to 213 data, a decrease in economic performance can be expected due mainly to the decrease in income levels. The weight landed by the Italian fleet amounted to 171 thousand tonnes of seafood, with a landed value of 813 million. 213 landings decreased 13% in value and weight compared to 212. Domestic market for fresh fish products fell steadily between 28 and 213, causing a general decline in prices of most keys species such as European anchovy, cuttlefish and clams. A negative trend in employment is also observed due to the reduced number of fishing vessels but also to the decline in their physical and economic productivity. The increase in production costs, especially in the past two years, contributed to a decline in the economic performance of fishing enterprises and, thus, the workers. The annual cost of labour per worker fell 1% over the period In the last years, several factors greatly reduced profit margins of fishing enterprises. The overexploitation status of some assessed stocks could have had an impact on this trend. However, other factors seems to have affected the fall in total captures and unitary productivity even more deeply than the decrease in abundance of the stocks, including: increases in fuel price, changes in fishing zones due to increased production costs, and different catch compositions, which targeted the most sought-after species in domestic and International markets Small scale Fleet The size of the small scale fishing fleet decreased between 212 and 213, with the number of vessels falling 2% and both GT and kw decreasing 1%. The general stagnation of the sector seems destined to further reduce landings and GVA as well as employment. Small-scale fishing is the most relevant sector from a social and job-related point of view, followed by trawling and purse seining. However, the level of annual income registered in the small-scale fleet is still low compared to other productive activities. Over the years, the persistence of such standards of revenues has even lead fishermen, who are socially and culturally close to seafaring life, to quit the activity. This phenomenon is mainly reported in areas where the fishery industry has a greater significance, for example, the Sicilian provinces and the largest Adriatic fisheries centres. Given the inadequate level of revenues, it is only the high degree of ownership share due to the artisan feature of fisheries that prevents fishermen from quitting the activity. The sustained increase of intermediate costs, together with decreases in production levels, has eroded added value and profits, further weakening a sector already in economic recession. Several factors affected the decrease in total captures and unitary productivity, such as high fuel prices and restrictions set by Council Regulation (EC) n. 1967/26 concerning management measures for the sustainable exploitation of fishery resources in the Mediterranean Sea. In particular some measures such as the ban to catch juvenile pilchard (bianchetto) has affected many fishing communities in which it was carried out. The seasonal component of
243 214 Annual Economic Report on the EU Fishing Fleet this type of fishery allowed small boats to achieve a considerable income during the winter season. Hence, this type of fishery represented a significant source of income integration for many coastal communities, and therefore has a socio-economic and employment importance. In recent years, there has been a significant global development of co-management experiences regarding coastal resources. In particular, at the end of December 213, 11 Local Management Plans were in force. They are a completely innovative intervention tool from the range of available management measures. They contain restrictive management measures in order to reduce fishing effort, to improve the state of fishery resource, to limit the conflict between other users (sport and recreational fisheries, tourism). A longer trend of the main indicators analysed, including data from the Data Collection Regulation (DCR, 22-27), is provided at the end of this chapter. Data issues There were no significant data issues in producing this chapter, and the coverage and quality appear to be good. Some data missing for the distant-water fleet in 21 and 211 (days at sea, energy consumption). 241
244 National Chapters Table Economic performance of the Italian national fishing fleet by operational scale: Development trend based on % net profit margin 212 to average net profit margin Arrows indicate change ( ) 212 to 211: ( ) increase; ( ) decrease and ( ) stable/no change ( between -1 and +1%) Variable Small scale Fleet % Large scale fleet % Distant water fleet % Output Fishing Effort Employment Structure No. Vessels (#) 8,872 8,84 8,813 8,875 8,663 8,513-2% 4,581 4,516 4,456 4,428 4,283 4,9-3% % Vessel tonnage (thousand GT) % % % Vessel power (thousand kw) % % % Total employed (#) 13,722 13,698 14,94 14,5 13,856 13,589-1% 15,627 15,269 14,888 14,676 14,361 9,83-2% % FTE (#) 9,666 1,193 1,4 9,996 9,779-2% 12,3 11,952 11,772 1,63 1,913 3% % Average wage per employed (thousand ) % % % Average wage per FTE (thousand ) % % % Days at sea (thousand days) , ,7. 1, , % % Fishing days (thousand days) , ,69.9 1, ,33. 1,78-11% % Energy consumption (milion litres) % % % Energy consumption per landed tonne (l/t) 1,729 1,662 1,76 2,33 1,829-1% 2,12 1,887 1,814 1,914 1,689-12% 2,328 1, ,52 82% Landings weight (thousand tonnes) % % % Landings value (million ) % % % Data source: DCF 214 Fleet Economic (MARE/A3/AC(214)). 242
245 214 Annual Economic Report on the EU Fishing Fleet Table Main socio-economic performance indicators by fleet segment in the Italian national fishing fleet in 212. Development trend based on % net profit margin 212 to average net profit margin Arrows indicate change ( ) 212 to 211: ( ) increase; ( ) decrease and ( ) stable/no change ( between -1 and +1%) Variable (million ) Small scale Fleet Distant water and othermost region fleet % Large scale fleet % % Income Costs Economic Indicators Capita l value Profitability and development trends Landings income % % % Other income Labour costs % % % Energy costs % % % Repair costs % % % Other variable costs % % % Non-variable costs % % % Capital costs % % % GVA % % % Gross profit % % % Net profit % % % Depreciated replacement value % % % Investments % % % Net profit margin (%) % % % development trend Deteriorated -24% Deteriorated -79% Improved 71% RoFTA (%) % % % development trend Deteriorated -4% Deteriorated -81% Deteriorated -31% GVA per FTE (thousand ) % % % development trend Deteriorated -21% Deteriorated -23% Improved 74% Data source: DCF 214 Fleet Economic (MARE/A3/AC(214)). Note: In 212, replacement value has been calculated only on active vessels. 243
246 National Chapters Table Main socio-economic performance indicators by fleet segment in the Italian national fishing fleet in 212, percentage change to 211. Development trend based on % net profit margin 211 to average net profit margin Arrows indicate change ( ) in relation to 21: ( ) increase; ( ) decrease and ( ) stable/no change ( between -1 and +1%) Fleet segment No. of vessels (N) % Data source: DCF 214 Fleet Economic (MARE/A3/AC(214)). FTE (N) % Days at sea (days) % Energy consumption (litres) % Value of landings (thousand ) % ITAAREA37DRBVL High Weight of landings (thousand tonnes) % GVA (thousand ) % GVA per FTE ( /FTE) % Gross profit (thousand ) % Net profit (thousand ) % Net profit margin (%) % Profitability (212) Net profit margin % average (28-11) Economic development trend ITAAREA37DRBVL % 33-15% % % % % % % % % 15-23% High -31% Deteriorated ITAAREA37DTSVL % % % % % % % % % % % Weak -147% Deteriorated ITAAREA37DTSVL % 34 % % % % % % % % % 9-18% Reasonable -42% Deteriorated ITAAREA37DTSVL % % % % % % % % % % -4-56% Weak -218% Deteriorated ITAAREA37DTSVL % % % % % % % % % % -7 44% Weak 45% Improved ITAAREA37HOKVL % % % % % % % % % % 7-54% Reasonable -62% Deteriorated ITAAREA37HOKVL % 28-14% % % % % % % % % -8-32% Weak -262% Deteriorated ITAAREA37PGPVL % % % % % % % % % % 22-31% High -29% Deteriorated ITAAREA37PGPVL % 735-1% % % % % % % % % 14 2% High -19% Deteriorated ITAAREA37PGPVL % % % % % % % % % % % Weak -142% Deteriorated ITAAREA37PMPVL % % % % % 83-64% % % ITAAREA37PMPVL % 6-21% % 11-37% % % % % 51-54% 144-8% 6-65% Reasonable -6% Deteriorated ITAAREA37PSVL Weak ITAAREA37PSVL Reasonable ITAAREA37PSVL % 156-3% % % % % % % 31-4% % 9-49% Reasonable -49% Deteriorated ITAAREA37PSVL % % % % % % % % % % 98% Weak 99% Improved ITAAREA37PSVL4XX 15-12% 2-4% 516-1% % % % % % % 6 14% Reasonable ITAAREA37TBBVL % 36 78% % % % % 14 21% % % % % High 34% Improved ITAAREA37TBBVL % % % % % % % % % % % Weak -136% Deteriorated ITAAREA37TBBVL % % % % % % % % % % % Weak -272% Deteriorated ITAAREA37TMVL % % % % % % % % % % 13 19% High % Stable ITAAREA37TMVL % % % % % % % % % % % High 636% Improved ITAAREA37TMVL % % % 1349 % % % % % 529-3% % -1-29% Weak -146% Deteriorated ITAOFRDTSVL4XX 5-69% 25-62% % % % % % % % % High 71% Improved 244
247 million Performance indicators (miilion ) % 214 Annual Economic Report on the EU Fishing Fleet 14 GT, kw (thousands) no. vessels, employed (thousand) thousand days Vessel power Vessel GT No. Vessels Employed Days at sea Fishing days Energy consumption Landings value Landings weight Landings income Energy consumption (million litres) million / thousand tonnes Landings value (million ) Deep-water rose shrimp European anchovy European hake Marine fishes nei Swordfish Landings value (million ) Deep-water rose shrimp European anchovy European hake Marine fishes nei Swordfish Landings weight (tousand tonnes) Deep-water rose shrimp European anchovy European hake Marine fishes nei Swordfish Landings income Direct income subsidies Other income Fishing rights income Income GVA Net profit GVA to Revenue Net profit margin 245
248 National Chapters 5.13 LATVIA 1 Fleet Structure, Fishing Activity and Production In 212, the Latvian Baltic Sea fishing fleet consisted of 279 registered vessels, with a combined gross tonnage of 8 thousand GT, a total power of 22 thousand kw and an average age of 29 years (Table ). The size of the Latvian fleet followed a decreasing trend between 211 and 212. The number of vessels declined by 13% (or 4 vessels), while the total GT and kw of the fleet declined 2% during the same period. The reason for the change is connected to vessel scrapping which according to the multi-annual management plan aims to achieve a better balance between fishing capacity and the available resources. The fishing vessels were reassigned for activities outside fishing (by scrapping or selling). Vessel scrapping between 28 and 212, as well as other structural changes in fleet segments, had a positive impact on incomes and minimised total costs resulting in an increase in profitability and overall improvement in the economic effectiveness of several fishing firms. Significant differences in the number of vessels and in other related variables were observed between 21 and 211. The fleet size decreased by 452 vessels or 59%. Fleet GT and kw decreased by 13% and 16% respectively (Table ; Figure ). The major factor causing the fleet to decrease is due to the small coastal zone vessels less than 1m, which were excluded from the statistics. These vessels have a licence and obligation to fill coastal logbooks but only fish for family consumption and are not involved in commercial fishing activity. This type of fishing activity in Latvia has a long historical tradition. The small-scale fleet targets Atlantic cod, Atlantic salmon, European flounder, European smelt, Atlantic herring, European sprat and others coastal species. Table Latvian national fleet structure, activity and production trends: Arrows indicate change ( ) 212 to 211: ( ) increase; ( ) decrease and ( ) stable/no change ( between -1 and +1%) Output Fishing Effort Employment Structure Variable NATIONAL FLEET % Total No. Vessels (#) % 276 No. of Inactive vessels (#) % Average vessel age (year) % 29 Vessel tonnage (thousand GT) % 8 Vessel power (thousand kw) % 22 No. of Enterprises (#) % Total employed (#) % FTE (#) % Average wage per employed (thousand ) % Average wage per FTE (thousand ) % Days at sea (thousand days) % Fishing days (thousand days) % Energy consumption (milion litres) % Energy consumption per landed tonne (l/t) % Landings weight (thousand tonnes) % Landings value (million ) % Recreactional catches of selected species (T % Data source: DCF 214 Fleet Economic (MARE/A3/AC(214)); data for 213and 214 are provisional. Note: total number of vessels in 211 includes only active vessels; average vessel age and length excludes the PGP fleet segment; capacity data (number of vessels, engine power and gross tonnage) in 211 excludes inactive vessels. 1 Note: This National Chapter does not cover the entire Latvian fleet 246
249 214 Annual Economic Report on the EU Fishing Fleet In 212, the number of fishing enterprises totalled 123, with the majority (53%), owning a single vessel. Only 5% of the enterprises owned six or more fishing vessels (Table ). Employment was around 643 jobs and 353 FTEs in 212 (Table ; Figure ). The level of total employment and FTE decreased 1% and 7%, respectively between 211 and 212. While the average wage per FTE increased during the same period by 24%. GT, kw (thousand) million / thousand tonnes Landings value (million ) Figure Latvian fleet: main trends for the period Vessel power Vessel tonnage No. Vessels FTE Total employed Landings value Landings weight Landings income Atlantic cod Atlantic herring European smelt European sprat Marine fishes nei no. vessels, employment (thousand) thousand days Average price ( /kg) Landings weight (thousand tonnes) Top left capacity and employment; top right fishing effort and fuel consumption; middle left landings in value and weight; middle right average landed prices of top 5 species in terms of landed value in 212; bottom left - top 5 species in terms of value landed in 212; and bottom right landed weight of top 5 species in terms of value landed in Days at sea Fishing days Energy consumption Atlantic cod European smelt Marine fishes nei Atlantic herring European sprat Atlantic cod Atlantic herring European smelt European sprat Marine fishes nei million litres In 212 the Latvian Baltic Sea fishing fleet spent a total of around 19 thousand days at sea (Table ; Figure ), 17 thousand of which were fishing days. The total number of days at sea and fishing days remained relatively stable with only a decrease of 1% between 211 and 212. The total quantity of fuel consumed in 212 was 9.4 million litres an increase of 45% compared to the previous year. Fuel consumption per kg landed also increased significantly by 59%. The weight landed by the fleet in 212 was 57.5 thousand tonnes of fish, with a landed value of 23.4 million (Table ; Figure ). The total weight of landings declined 9% between 211 and 212 while landed 247
250 National Chapters value increased 8% during the same period. The main reason for decrease in weight was reduced Latvian quota for European sprat in the Baltic. The prices obtained for the two key species (Atlantic herring and European sprat) increased between 211 and 212. In terms of price, coastal zone species which are included in Marine fishes nei achieved the highest average price per kilo by the Latvian fleet ( 1.41 per kg), followed by Atlantic cod and European smelt ( 1.11 per kg and.38 per kg) (Figure ). Despite the high prices for coastal species and for European smelt, these species are negligible in the total landings composition. In terms of landings composition, in 212 European sprat was the most common species landed in terms of weight (3.7 thousand tonnes), followed by Atlantic herring (2 thousand tonnes) and Atlantic cod (4.3 thousand tonnes) (Figure ). In 212, European sprat achieved the highest landed value ( 1.1 million) for the national fleet, followed by Atlantic herring ( 7.4 million) and then Atlantic cod ( 4.8 million) (Figure ). European sprat, Atlantic herring and Atlantic cod, accounted for 43%, 32% and 21% respectively of the total landings value in 212 and contributed to 54%, 35% and 8%, respectively to total landed weight. The total landing value has remained relatively stable over the years, while total weight declined. The major factor causing the decrease in weight and significant increase in prices was the reduction of Latvian quota for European sprat by 5% in the Baltic Sea between 28 and 212 (Figure ). National Fleet Economic performance The amount of income generated by the Latvian national fleet in 212 was 24.8 million, including 23.4 million in revenue from fish sales and 1.4 million in non-fishing income. The landed income of the Latvian fleet increased 8% between 211 and 212. Expenditure by the Latvian fleet in 212 was 21.8 million, amounting to 93% of income. The largest expenditure items were non-variable costs and energy costs ( 6.3 and 4.9 million respectively). Between 211 and 212, total costs increased by 25% (Table ; Figure ). In terms of profitability, the total amount of Gross Value Added (GVA), gross profit and net profit generated by the Latvian national fleet in 212 was 8.5 million, 4.6 million and 3. million, respectively (Table ; Figure ). Therefore, Gross Value Added (GVA) and gross profit decreased by 2% and 37% respectively between 211 and 212. Towards the end of 28 and during 29 the Latvian fishery sector was negatively affected by the global economic crisis, which led to significant increase of total costs and decrease of profit levels. In 212, the Latvian fleet had an estimated (depreciated) replacement value of 1.5 million. Investments in the fleet amounted to.5 million. The major factor causing changes in the capital value of the fleet include the differences in data collection approaches. The data for 28 and 29 were imputed. The data for were received by questionnaire. 248
251 Performance indicators (million ) % 214 Annual Economic Report on the EU Fishing Fleet Table Latvian national fishing fleet economic performance in and projections for 213. Development trend based on % net profit margin 212 to average net profit margin Arrows indicate change ( ) 212 to 211: ( ) increase; ( ) decrease and ( ) stable/no change ( between -1 and +1%) Variable (million ) National Fleet % Income Costs Economic Indicators Capital value Profitability and development trends 3 25 Landings income % Other income % Labour costs % Energy costs % Repair costs % Other variable costs % Other non-variable costs % Capital costs % GVA % Gross profit % Net profit % Depreciated replacement value % Investments % Net profit margin (%) % development trend Deteriorated -19% RoFTA (%) % development trend Stable -1% GVA per FTE (thousand ) % development trend Stable 5% Data source: DCF 214 Fleet Economic (MARE/A3/AC(214)); data for 213 are provisional million Landings income Other income Revenue GVA Gross profit Net profit million Crew wage costs Unpaid labour Energy costs Repair costs Other variable costs Non-variable costs Annual depreciation GVA to Revenue Gross profit margin Net Profit margin RoFTA Figure Latvian fleet main economic performance trends for the period Top left income structure; top right cost structure; bottom left economic performance indicators; bottom right performance indicators as a % of revenue (landings income + other income) (projected figures for 213). 249

 and landings in weight (thousand tonnes); Value shows days-at-sea (thousand days) and landings in value (thousand ).")
252 Fleet Segment Level Economic performance National Chapters The Latvian national fleet operating in the Baltic Sea consisted of 4 active fleet segments in 212 (Figure ). A breakdown of the key performance indicators for 212 by main fishing activity is provided in Table and Table Table provides a breakdown of key performance indicators for each fleet segment in 212. A short description for the main segments is provided below. Figure Latvian effort and landings by FAO fishing area, 212. Colour shows fishing days (thousand days) and landings in weight (thousand tonnes); Value shows days-at-sea (thousand days) and landings in value (thousand ). Source: DCF 214 Fleet Economic (MARE/A3/AC(214)) Small-scale fleet The number of vessels in the small-scale fleet decreased 16% between 211 and 212. Landings weight decreased 14% while the value of landings increased by 18% and is around 1.4 million between 211 and 212. The small-scale fishing fleet is important for employment in coastal regions and was estimated at 258 jobs, corresponding to 154 FTEs. Total employment and FTEs for small-scale fleet decreased 2% and 24% respectively over the observed period (Table ). While costs increased 19%, net profit increased during the same period by 13%. Gross Value Added (GVA) and gross profit, increased by 11%and 12% respectively, between 211 and 212. Nevertheless the share of landings generated by small coastal vessels in total income is quite insignificant (about 6%) (Table ). Large-scale fleet The opposite trend was observed for the large-scale fleet. Employment in the large scale fleet was estimated at 385 jobs in 212, corresponding to 199 FTEs (Table ). The number of FTEs increased between 212 and 211 by 13% (Table ). The economic indicators show a decreasing trend between 211 and 212. In terms of profitability, the total amount of GVA, gross profit and net profit generated for the large scale fleet in 212 was 7.2 million, 3.4 million and 1.8 million, respectively. Gross Value Added (GVA), gross profit and net profit decreased by 24%, 45% and 64%, respectively, between 211 and 212 (Table ). Pelagic trawl 24-4m 48 vessels made up this segment in 212 and are based predominantly in the Baltic Sea. These vessels target species such as European Sprat and Atlantic Herring. The total value of landings was 17 million and around 138 FTEs was employed in this fleet segment in 212, contributing to 74% and 39% of the total income from landings generated and FTEs in the national fleet, respectively. This fleet segment was highly profitable, with a reported gross profit of around 4.2 million and a net profit of around 3.4 million in 212. Fixed netters 24-4m 1 vessels made up this segment in 212 which operate predominantly in the Baltic Sea. The fleet targets a variety of species, such as Atlantic cod and European flounder. The total value of landings was 1.4 million and only around 34 FTEs were employed in this fleet segment in 212, contributing to 6% and 11% of the total income generated from landings and FTEs in the national fleet, respectively. This 25
253 214 Annual Economic Report on the EU Fishing Fleet fleet segment has reported gross profit of around -.1 million and net profit of around -.3 million in 212.This fleet segment made losses in 212. One of the reasons is the decreasing in price for Cod by 29% in 212. The landing volume and value has decrease by 28% and 47% respectively between 211 and 212. The main reason is the fleet targets a variety of species, such as Atlantic Cod which stock was not sufficiently concentrated to maintain a profitable fishery for that segment in 212. Small scale fleet with polyvalent passive gears -1m 27 vessels make up this segment and they are based predominantly in the Baltic Sea and the Gulf of Riga in the coastal zone. These vessels target a variety of Atlantic cod, Atlantic salmon, European flounder, European smelt, Atlantic herring, European sprat and others coastal species. The total value of landings was 1.4 million and 154 FTEs were supported by this segment in 212. This fleet segment was profitable in 212 with a reported net profit of around 1.2 million in 212. Pelagic trawl vessels make up this segment and they are operating predominantly in the Gulf of Riga. These vessels target a variety of European sprat, Atlantic herring and European smelt. Their total value of landings was 3.2 million and 27 FTEs were supported by this segment in 212. This fleet segment made losses in 212. The reported net profit was around -1.2 million in 212. Assessment and Future Trends The changes for the Latvian fishing fleet in the Baltic Sea from 28 to 212 for economic indicators and costs in most of the cases showed negative tendencies. However it should be taken into account that 28 was the most profitable year. Between 28 and 212, the number of vessels reduced significantly. The Latvian quota in the Baltic Sea for sprat, which is the most common species for Latvian fishing fleet, declined by 16% between 211 and 212. Overall, there were two tendencies in the activity of Latvian Baltic Sea fishing fleet - 9% reduction in landings weight and an increase in the average landed price, resulting in an 8% increase in income, from 21.6 million in 211 to 23.4 million in 212. Total costs increased by 25%, mainly due to a fluctuation in the cost structure. Gross Value Added, gross profit and economic profit reduced to 8.5, 4.6 and 3 million respectively in 212. Based on the results of economic performance indicators and predictions for 213 it is possible to conclude that the number of vessels reduced insignificant (by 2 vessels) between 212 and 214. The effort and days at sea was relatively stable, while landings weight increased by 6% and the total value decreased insignificantly by 2%. Expenditure costs in 213 are expected to have increased considering the expected increase in fuel prices, i.e. energy costs. It is expected that the profit will vary to a negligible extent and will have a decreasing trend. A longer trend of the main indicators analysed, including data from the Data Collection Regulation (DCR, 22-27), is provided at the end of this chapter. Data issues Data issues, coverage and quality: All transversal data for 28 to 214 were obtained from the Integrated Control and Information System for Latvian fisheries, which includes logbook data and technical parameters of fishing vessels from the Latvian vessel register. The data are reported on a monthly basis and cover all members of the Latvian fishing vessel population. All economic variables for 28 to 212 were received from Central Statistical Bureau of Latvia (CSB) state statistical questionnaire form 1-Fisheries and other statistical sources of economic information based on the annual balance sheet. Primary economic information from the state statistical questionnaire 1- Fisheries was received annually from owners of fishing firms. In questionnaire form information is aggregated by fleet segments. Economic data covers all the members of population. Despite that economic data collection is based on questionnaire forms, participation of the respondents is obligatory according to the Latvian legislation. The achieved sample rate was 1%. The major factors causing changes in the capital value of the fleet include the differences in data collection approaches. The data for 28 and 29 were calculated using formulas. The data for were received from questionnaires, which is the best source of economic data collected. 251
254 National Chapters Latvia had two distant-sea trawlers over 4m operating in the North Atlantic and five trawlers operating in CECAF area (EEZ of Mauritania and Morocco) in 212. These vessels belong to three fishing firms and these data were excluded from economic analysis for confidentiality reasons. Table Latvian national fleet structure, activity and production trends by operational scale: Arrows indicate change ( ) 212 to 211: ( ) increase; ( ) decrease and ( ) stable/no change ( between -1 and +1%) Structure Employment Fishing Effort Output Variable Small scale Fleet % Large scale fleet No. Vessels (#) % % Vessel tonnage (thousand GT) % % Vessel power (thousand kw) % % Total employed (#) 992 1,11 1, % % FTE (#) % % Average wage per employed (thousand ) % % Average wage per FTE (thousand ) % % Days at sea (thousand days) % % % Fishing days (thousand days) % % Energy consumption (milion litres) % % Energy consumption per landed tonne (l/t) % % Landings weight (thousand tonnes) % % Landings value (million ) % % Table Economic performance of the Latvian national fishing fleet by operational scale: Development trend based on % net profit margin 212 to average net profit margin Arrows indicate change ( ) 212 to 211: ( ) increase; ( ) decrease and ( ) stable/no change ( between -1 and +1%) Variable (million ) Small scale Fleet % Large scale fleet % Income Costs Economic Indicators Capital value Profitability and development trends Landings income % % Other income % % Labour costs % % Energy costs % % Repair costs % % Other variable costs % % Non-variable costs % % Capital costs % % GVA % % Gross profit % % Net profit % % Depreciated replacement value % % Investments.2.1-5% % Net profit margin (%) % % development trend Improved 253% Deteriorated -5% RoFTA (%) % % development trend Improved 126% Deteriorated -18% GVA per FTE (thousand ) % % development trend Improved 158% Deteriorated -29% 252
255 214 Annual Economic Report on the EU Fishing Fleet Table Main socio-economic performance indicators by fleet segment in the Latvian national fishing fleet in 212. Development trend based on % net profit margin 212 to average net profit margin Arrows indicate change ( ) 212 to 211: ( ) increase; ( ) decrease and ( ) stable/no change ( between -1 and +1%) Fleet segment No. of vessels (N) % FTE (N) % Days at sea (days) Data source: DCF 214 Fleet Economic (MARE/A3/AC(214)). % Energy consumption (litres) % Value of landings (thousand ) % Weight of landings (thousand tonnes) % GVA (thousand ) % GVA per FTE ( /FTE) % Gross profit (thousand ) % Net profit (thousand ) % Net profit margin (%) % Profitability (212) Net profit margin % average (28-11) Economic development trend LVAAREA27DFNVL244 1 % 34 1% % % % % 95-94% % % % % Weak -238% Deteriorated LVAAREA27PGPVL % % 1891 % 48 18% % % % % % % 8-2% High 253% Improved LVAAREA27TMVL % 27-18% % 28 24% % % % % % % % Weak -263% Deteriorated LVAAREA27TMVL % % % % % % % % 422 2% 343 2% 19-12% High 253
256 million Performance indicators (miilion ) % GT, kw (thousands) no. vessels, employed (thousand) thousand days Energy consumption (million litres) million / thousand tonnes National Chapters Landings value (million ) Vessel power Vessel GT Employed No. Vessels Atlantic cod Atlantic herring European smelt European sprat Landings value (million ) Days at sea Fishing days Energy consumption Atlantic cod Atlantic herring European smelt European sprat Marine fishes nei Landings weight (tousand tonnes) Landings value Landings weight Landings income Atlantic cod Atlantic herring European smelt European sprat Marine fishes nei % % 4% 3% 2% 1% % -1% Landings income Direct income subsidies Other income Fishing rights income Income GVA Net profit GVA to Revenue Net profit margin 254
257 214 Annual Economic Report on the EU Fishing Fleet 5.14 LITHUANIA Fleet Structure, Fishing Activity and Production In 213, the Lithuanian fishing fleet consisted of 148 registered vessels, of which 54 were inactive. The fleet had a combined gross tonnage of 27 thousand GT, an engine power of 34 thousand kw and an average age of 33 years. Considerable decline of capacity in terms of GT and kw was associated with a temporary secession of one vessel and the withdrawal of a few distant-water vessels from the fleet register. Capacity was restored in 214. In 213, the number of active vessels declined 12%. During the period , the reduction in vessel numbers was mostly observed in the small-scale fleet operating in coastal waters. This result was driven by the withdrawal of enterprises with very low economic activity; where income from landings was as negligible as for instance 3 per year. Coastal fishing for these companies was either regarded as a secondary activity or undertaken predominately as inland water fisheries in the Curonian lagoon. Related to this, catches of fresh water species in Curonian lagoon increased by almost 16% during 212 and 213 (Table , Figure ). In 213, the number of fishing enterprises in the Lithuanian fleet totalled 7, from which 55.7% owned a single vessel. The number of companies owning one vessel declined 9% in the small-scale fishery segment. This figure is related to the decline of vessels with very low economic activity. Moreover, it is common for enterprises involved in coastal fisheries for the owner to have several vessels, usually less than 1m. Recently the trend of reducing number of vessels per owner and more intensively exploiting reduced capacity was observed. In 212, sea fisheries employed 732 persons, corresponding to 566 FTEs. The level of employment during 211 and 212 slightly decreased and FTE was more or less stable in this period. In fact these changes were mostly influenced by distant-water fisheries due to temporary outage of vessels in the CECAF area. The stabilised trend with minor increase in coastal area employment is influenced by multiannual capacity reductions aimed at more balanced levels, with increased income per vessel and profitability resulting from higher landings. Table Lithuanian national fleet structure, activity and production trends: Arrows indicate change ( ) 212 to 211: ( ) increase; ( ) decrease and ( ) stable/no change ( between -1 and +1%) NATIONAL FLEET % Variable Product Fishing Effort Employment Structure Total No. Vessels (#) % 146 No. of Inactive vessels (#) % 58 Average vessel age (year) % 34 Vessel tonnage (thousand GT) % 34 Vessel power (thousand kw) % 42 No. of Enterprises (#) % Total employed (#) % FTE (#) % Average wage per employed (thousand ) % Average wage per FTE (thousand ) % Days at sea (thousand days) % Fishing days (thousand days) % Energy consumption (milion litres) % Energy consumption per landed tonne (l/t) % Landings weight (thousand tonnes) % Landings value (million ) % % Data source: DCF 214 Fleet Economic (MARE/A3/AC(214)); data for 213 and 214 are provisional. 255


258 National Chapters The 213 landings data indicate a modest increase in value and a significant gain in weight compared to 212, which in relation to 211 effort were less successful. The total weight landed by the Lithuanian fleet in 213 was 89.3 thousand tonnes of seafood, with a landed value of 31.3 million. Value of landings at national level was strongly dependent on the distant-water fleet segment, as around 86% of the value landed by the national fleet was generated by vessels operating in this fishery. In 213, the Lithuanian fleet spent around 11 thousand days at sea and remained almost unchanged compared to 212. thousand days ,2 1, Vessel power Vessel tonnage No. Vessels FTE Total employed no. vessels, employment thousand days Days at sea Fishing days Energy consumption million litres million / thousand tonnes Landings value Landings weight Landings income Data source: DCF 214 Fleet Economic (MARE/A3/AC(214)); data for 213 are provisional. Figure Lithuanian fleet: main trends for the period Top left capacity and employment; top right fishing effort and fuel consumption; middle left landings in value and weight; middle right average landed prices of 3 of the top species in terms of landed value in 212; bottom left - 3 of the top species in terms of value landed in 212; and bottom right landed weight of 3 of the top species in terms of value landed in 212. In 212, Cunene horse mackerel generated the highest landed value ( 8.9 million) by the distant-water vessels, followed by round sardinella ( 5.4 million), beaked redfish ( 3.8 million, not shown) and European sprat ( 2.9 million). The most important species landed the distant-water fleet in terms of weight was round sardinella (11.8 thousand tonnes) and Cunene horse mackerel (1.1 thousand tonnes) (Figure ). During 256
259 214 Annual Economic Report on the EU Fishing Fleet the period , high variability in prices of small pelagic species landed by high sea vessels was reported. It apparently affected national fleet performance. According to reported data, the price of Cunene horse mackerel decreased from.58 per kg to.12 per kg and recovered to.4 per kg in 21. Such change in price is doubtful as the EU market price for Cunene horse mackerel is around.4 per kg. There was a general decrease in fish prices during 29 following the economic crises, but the reported excessive decrease in value of landings suggests that such variability of data is questionable. Concerning fisheries in the Baltic Sea and its coastal area, during the value of landings decreased 3.6%, but was 13% higher compared to 211. From 28 to 211 the highest value of landings in Baltic Sea was generated from Baltic cod catches, whereas from 211 onwards, the most significant part of income has been generated by European sprat. In 213, values of European sprat landings consisted of 3.38 million, whereas Baltic cod landings generated 2 million. In terms of landings weight, European sprat landings amounted to 1.3 thousand tonnes, Baltic herring 2.47 thousand tonnes and Baltic cod 1.74 thousand tonnes. The landed value of Baltic cod between 28 and 213 shows a downward trend with an overall 37.4% decline over the period. The dynamics of European sprat landings from can be spilt in two parts: the first reveals a constant decline from 28 to 211 and the second a rapid increase from 211 to 213. Increase in value resulted from higher prices driven by increased demand. Consequently, a considerable part of the Baltic Sea fleet increased its effort in the small pelagic fishery. Landed weight of European sprat similarly decreased between 28 and 21 but in contrast to Baltic cod, it remained steady between 21 and 212. The decline in landings weight of Baltic cod was mostly influenced by effort and capacity reduction in the Baltic Sea fleet. The main reasons for reduced effort with relation to lower profitability of Baltic cod fishery was likely influenced by an increase in fuel price, causing higher energy costs for an already inefficient fleet. Additionally, the fleet is obliged to land more than half its catch in national ports, while distances between trawling areas and landing sites are increasing as well as lower level of cod price. Despite a decreasing trend in landings weight and value, the Baltic cod quota has shown a tendency to increase, as an example from 2631t in 28 to 3933t in 213, followed by 4.4% gain in 214 amounting 419t. Quota for European sprat decreased 45% between 28 and 213 and a further 4% from 213 to 214. Around 84% of sprat catches are landed in different ports in Denmark and only 1.2% in national ports. In 213, the largest part of income by small-scale fleet was generated from the Baltic cod and European smelt fisheries, with almost equal importance, thousand and 182. thousand, respectively. During income from Baltic cod increased by 18.2% with respectively higher weight whereas income from European smelt decreased 6.9%. It was mostly related to unsuitable weather for European smelt fishing due to high temperatures. Decline in weight was followed by a 12% increase in prices. National Fleet Economic performance The amount of income generated by the Lithuanian national fleet in 212 was 42.8 million, which is around 8% less than in 211. Total revenues consisted from 98% of fishing income and less than 2% of other income. Total operating costs incurred by the Lithuanian national fleet in 212 equated to 34.9 million and were 12% lower compared to the previous year. In 212, almost half of total operating costs were spent on fuel and compared to 211 increased 54%. For the fleet fishing in the Baltic Sea, energy costs increased 14% from 211, mainly in the demersal trawler segment. The highest increase in energy costs was observed in the distant-water fishery. Other variable costs and energy costs, as the two major fishing expenses, were 11 and 11.5 million, respectively (Table ; Figure ). Gross Value Added (GVA), gross profit and net profit generated by the Lithuanian national fleet in 212 were 12.9 million, 8.5 million and 5.5 million, respectively. According to reported data, income from landings of the national fleet has not changed significantly since 211, but decreased expenditures, such as other variable costs and crew costs, increased profitability indicators. As the economic indicators of the national fleet are highly dependent on the performance of the distant-water fishery, factors that affect the performance of other fleet segments have minor impact at national level. The small-scale fishery segment consisting of vessels below 1 m significantly increased effort in 211 and 212 and generated relatively high profitability trends, generating a net profit margin of 34% (Table and Table ). Large-scale vessels, mainly due to pelagic trawlers, also demonstrated good economic results. Increased demand for small pelagic species at good prices affected a high profitability performance 257
260 National Chapters even with decreased effort. For example, days at sea between 211 and 212 decreased 1%, whereas net profit increased 27% (Table and Table ). For large-scale demersal trawlers, increased effort in days at sea raised production costs, together with decreased landings weight and low prices for cod price in local markets, resulted in weak economic performance. Despite outstanding problems in the distant-water fleet with bilateral agreements with third countries and relatively unfavourable conditions for Lithuanian pelagic vessels fishing in CECAF area, which reduced effort by 19%, the economic performance was sufficient, generating an increase in net profit by 2%. In 212, the Lithuanian fleet had an estimated (depreciated) replacement value of 48.9 million with 8% annual decrease. Change of investments per year by the fleet dropped significantly from 2.1 million in 211 to 1.2 million in 212. This tendency suggests an unfavourable outlook as the large-scale and distant-water fleets demand investment for the aged fleet with relatively high costs per effort. Table Lithuanian national fishing fleet economic performance in and projections for 213. Development trend based on % net profit margin 212 to average net profit margin Arrows indicate change ( ) 212 to 211: ( ) increase; ( ) decrease and ( ) stable/no change ( between -1 and +1%) Variable (million ) National Fleet % Income Costs Economic Indicators Capital value Profitability and development trends Landings income % Other income % Labour costs % Energy costs % Repair costs % Other variable costs % Other non-variable costs % Capital costs % GVA % Gross profit % Net profit % Depreciated replacement value % Investments % Net profit margin (%) % development trend Improved 243% RoFTA (%) % development trend Improved 66% GVA per FTE (thousand ) % development trend Improved 9% Data source: DCF 214 Fleet Economic (MARE/A3/AC(214)); data for 213 are provisional. 258

; middle right economic performance indicators; bottom")
261 214 Annual Economic Report on the EU Fishing Fleet Performance indicators (million ) million Landings income Other income Revenue GVA Gross profit Net profit million % Crew wage costs Unpaid labour Energy costs Repair costs Other variable costs Other non-variable costs Annual depreciation GVA to Revenue Gross profit margin Net Profit margin RoFTA Data source: DCF 214 Fleet Economic (MARE/A3/AC(214)); data for 213 are provisional. Figure Lithuanian fleet main economic performance trends for the period Top left income structure; top right cost structure; middle left cost items as a percentage of income (fishing income and other income); middle right economic performance indicators; bottom performance indicators as a % of revenue (landings income + other income) (projected figures for 213). Fleet Segment Level Economic performance The Lithuanian fleet is highly diversified with a broad range of vessel types targeting different species predominantly in other fishing regions, particularly in CECAF (area 34) (Figure ). Figure Lithuanian fleet effort and landings by FAO fishing area, 212. Colour shows fishing days (thousand days) and landings in weight (thousand tonnes); Value shows days-at-sea (thousand days) and landings in value (thousand ). Source: DCF 214 Fleet Economic (MARE/A3/AC(214)) 259
262 National Chapters The national fleet is divided into 5 fleet segments. Due to reduction in capacity, lower vessel numbers create a confidentiality problem; and only the three most important segments are presented. In fact, these represent different the types of fisheries in Lithuania: (1) the small scale segment, which operates in the Baltic Sea coastal area, (2) the largescale fishery represented by demersal trawlers, which fishing in the Baltic Sea and (3) the distant-water fleet segment, characterised by completely distinct characteristics compare to local fisheries. Table provides a breakdown of key performance indicators for all fleet segments in 212. Demersal Trawlers and Seiners (DTS) vessels make up this segment, which operates predominantly in the Baltic Sea. The main target species of that segment is Baltic cod, though a certain part of fleet performs mixed fisheries using second gear for pelagic species. The catches of Baltic cod have a tendency to decrease despite the increasing quotas and relatively stable prices in local market. Around 84% of catches are landed in national port according to legal obligations. This segment is energy demanding and expenditure for fuel amounted 36.7% of total operating costs. Landing obligation, mentioned above from one point of view adversely affected profitability for an already inefficient old fleet. Net profit margin for demersal trawlers segment was around 1% and it was the lowest value among rest fleet. In 212, the total income was almost 3.77 million corresponding to 9% in income from landings and 1% from other income. Deducting other income form the results, the economic performance could be interpreted as unprofitable in 212. This segment employed 138 FTEs were employed in this fleet segment, contributing to 24.4% of the total FTEs generated by the Lithuanian fishing fleet. Although this segment had a minor profitable performance, profitability indicators as net profit margin constantly decreasing from 28. GVA has the similar declining tendency. Passive Gears (PG) -1m 61 vessels make up this segment which operates predominantly in coastal area of Baltic Sea operating with the passive gears. The fleet targets a variety of species but in particular Baltic cod, European smelt and Baltic herring. In terms of value of landings the main part of income comes from Baltic cod and European smelt, with very marginal difference between them. In 212, the total income was almost.33 million and around 3 FTEs were employed in this fleet segment. This fleet segment was profitable, with a reported gross profit of around.134 million and net profit of.123 million in 212. Regarding profitability and development trends between 211 and 212, small scale fishery performed relatively well and improved in such positions as net profit and return on tangible assets. The major expenses in this segment were crew costs (42% in total operating cost structure) with relatively high unpaid labour as well as energy expenditures (22% in total operational cost structure). This segment had a different cost structure compare to remaining fleet segments, mainly trawlers, therefore fuel costs were not the main factor affecting profitability. Increased quotas for Baltic cod, high demand in local market for European smelt with a reasonable price had a major impact on higher profits. Capacity reduction policy resulted in improved socioeconomic indicator GVA/FTE. Decreased yearly investments did not affected profitability, because small scale fishery segment using mainly drift or fixed nets is not so much investment demanded compare to high capital value trawlers with complex gear. Regarding fleet population in that segment a modest decrease in number of vessels was observed, which was mostly related companies with low economic activity. It is worth mentioning that during decrease in number of capacity was related to vessels with very low income from landings. For one part of coastal line fishermen can operate to coastal area of Baltic Sea and in Curonian lagoon which belongs to inland waters. Pelagic Trawlers (TM) 4XX 1 vessels make up this segment which consists of long distance fishery vessels predominantly operating in CECAF (area 34) and some vessels fishing in North Atlantic (area 27). In CECAF region fleet was targeting mainly small pelagic species, such as Cunene horse mackerel and Round sardinella, whereas vessels from Area 27 was fishing sandeels, Atlantic redfishes and northern prawns. In 212, the total income was almost 35.6 million and around 355 FTEs were employed in this fleet segment, contributing to 83% and 63% of the total income from landings and FTEs generated by the Lithuanian fishing fleet, 1 Some data have been excluded from the table to guarantee data confidentiality. 26
263 214 Annual Economic Report on the EU Fishing Fleet respectively. This fleet segment was profitable, with a reported gross profit of around 6.8million and net profit of 4.2 million in 212. Assessment and Future Trends For the small-scale fleet, repair and maintenance expenditures did not account for a significant part of the cost structure and this segment is highly sensitive to target species prices and quota designated. Multiannual capacity reduction schemes to achieve a balanced level (capacity for this segment reached stabilised trend), could benefit from increases in income per vessel and better perspectives for employment. This can be seen from the 212 data, where income per vessel, compared to 211 increased 61.2%. The current trend of the small-scale segment is the reduction of low economic activity vessels and an increase in efficiency of the more active vessels related to higher FTE involved in the fishery. The decrease of quota uptake for cod by the largescale fishery may provide a good opportunity for small-scale vessels that target cod. Prices for several important species in the small-scale fishery have followed an increasing trend over the period For example, prices for European smelt peaked in 213. Baltic cod landed from small-scale vessels has also increased but the peak was reached in 212, with a slight decline in 213. Regarding cod management plan, the 214 quota for Baltic cod increased 4% compared to 213. This will affect segments targeting cod, such as DTS 24-4m and PG -1m. The large-scale fishery demersal and pelagic trawlers - currently shows a preference to small pelagic species, resulting in an almost full uptake of the quota over recent years. During , quota for Baltic herring increased 25%, whereas sprat decreased 4%. This provides a good outlook for pelagic trawlers as well as for other segments that target small pelagics as a secondary activity/gear. Significantly increased sprat and Baltic herring prices also contribute to a good outlook. For example, during , prices for European sprat increased 23%. A better outlook for distant-water vessels is expected in 214, compared to 212 and 213. Due to the problematic situation when the contract with Morocco was terminated in 211, part of the distant-water segment suffered losses and significantly reduced capacity. In the future, the situation is expected to improve slightly when reduced capacity is restored; hence, increased quota uptake and effort compared to 211 and 212 is forecasted. Data issues Under DCF, data on earnings from landings comes from two distinct reports (total value of landings as transversal variable and total income from landings as economic indicator). In Lithuania, income from landings together with other socio-economic indicators, such as expenditure, employment and capital value are collected through census with a one year lag whereas transversal variables are collected one year prior to economic data. Despite this difference in time period both indicators should comply with each other with modest deviation. Transversal and economic data for income during varied significantly for the Lithuanian distant-water clustered fleet segments. This mismatch occurred due to different methodologies used for transversal and economic data calculation as well as different data sources. Economic data, income from landings and related costs for each vessel or segment (when all vessels of particular enterprise fall in the same segment) are reported from enterprise business accounts, while value of landings is estimated counting price per fish and quantity landed (from logbooks). The high deviation of value of landings is highly probable that depends from the reported prices for the species (especially during years 28 and 29), which were landed in ports of other countries. 261
264 Table Economic performance of the Lithuanian national fishing fleet by operational scale: Development trend based on % net profit margin 212 to average net profit margin Arrows indicate change ( ) 212 to 211: ( ) increase; ( ) decrease and ( ) stable/no change ( between -1 and +1%) Structure Employment Fishing Effort Output Variable Small scale Fleet % Large scale fleet % Distant water fleet National Chapters No. Vessels (#) % % % Average vessel age (year) % % % Vessel tonnage (thousand GT) % % % Vessel power (thousand kw) % % % Total employed (#) % % % FTE (#) % % % Average wage per employed (thousand ) % % % Average wage per FTE (thousand ) % % % Days at sea (thousand days) % % % Fishing days (thousand days) % % % Energy consumption (milion litres) % % % Energy consumption per landed tonne (l/t) % % % Landings weight (thousand tonnes) % % % Landings value (million ) % % % %
265 214 Annual Economic Report on the EU Fishing Fleet Table Lithuanian national fleet structure, activity and production trends by operational scale: Arrows indicate change ( ) 212 to 211: ( ) increase; ( ) decrease and ( ) stable/no change ( between -1 and +1%) Variable (million ) Small scale Fleet % Large scale fleet Distant water fleet % % Income Costs Economic Indicators Capital value Profitability and development trends Landings income % % % Other income..... % % % Labour costs % % % Energy costs % % % Repair costs % % % Other variable costs % % % Non-variable costs % % % Capital costs % % % GVA % % % Gross profit % % % Net profit % % % Depreciated replacement value % % % Investments % % % Net profit margin (%) % % % development trend Improved 46% Improved 135% Improved 39% RoFTA (%) % % % development trend Improved 47% Improved 12% Improved 4% GVA per FTE (thousand ) % % % development trend Improved 22% Improved 13% Stable -4% Table Main socio-economic performance indicators by fleet segment in the Lithuanian national fishing fleet in 212. Development trend based on % net profit margin 212 to average net profit margin Arrows indicate change ( ) 212 to 211: ( ) increase; ( ) decrease and ( ) stable/no change ( between -1 and +1%) Fleet segment No. of vessels (N) % FTE (N) % Days at sea (days) % Energy consumption (litres) % Value of landings (thousand ) % Weight of landings (thousand tonnes) % GVA (thousand ) % GVA per FTE ( /FTE) % Gross profit (thousand ) % Net profit (thousand ) % Net profit margin (%) Data source: DCF 214 Fleet Economic (MARE/A3/AC(214)); data for 213 are provisional. % Profitability (212) Net profit margin % average (28-11) Economic development trend LTUAREA27DFNVL % 18 % % 15 8% % % 134-7% 7.4-7% 41 3% % 6 25% Reasonable -63% Deteriorated LTUAREA27DTSVL % 138-1% % % % % % % % 32-88% 1-86% Reasonable -87% Deteriorated LTUAREA27PGVL1 61 2% 3 64% % 51 51% % % % 7.6 1% % % 34 17% High 46% Improved LTUAREA27TMVL244 4 % 25-17% 765-1% % % % % % % % 37 26% High 32% Improved LTUOFRTMVL4XX 1 % 355-4% % % % % 994-1% % % % 12 3% High 39% Improved 263
266 National Chapters 5.15 MALTA 1 Fleet Structure, Fishing Activity and Production In 213, the Maltese fishing fleet consisted of 1,4 registered vessels, with a combined gross tonnage of 7.8 thousand GT, a total power of 76.1 thousand kw and an average age of 28 years. The size of the Maltese fishing fleet decreased between 28 and 213, with the number of vessels decreasing 21% (276 vessels). The decrease between 211 and 212 equated to only 2%. GT increased 4% between 28 and 213 and overall engine power (kw) decreased 13% (Table ) from 28 to 213. The major factors causing the number of vessels to decrease were: (1) compensations given to vessel owners for decommissioning; (2) vessels that had low landing declarations (below national thresholds) were removed from the full-time or part-time register and given recreational licences; (3) entry of new vessels into the fleet with varying GT and power, which in the end contributed to an overall decrease in power but an increase in GT. Table Maltese national fleet structure, activity and production trends: Arrows indicate change ( ) 212 to 211: ( ) increase; ( ) decrease and ( ) stable/no change ( between -1 and +1%) Variable NATIONAL FLEET % Production Fishing Effort Employment Structure Total No. Vessels (#) 1,316 1,111 1,112 1,87 1,6 1,4-2% 122 No. of Inactive vessels (#) % 1 Average vessel age (year) % 28 Vessel tonnage (thousand GT) % 7 Vessel power (thousand kw) % 74 No. of Enterprises (#) 1,297 1,81 1,76 1,6 1, % Total employed (#) % FTE (#) % Average wage per employed (thousand ) % Average wage per FTE (thousand ) % Days at sea (thousand days) % Fishing days (thousand days) % Energy consumption (milion litres) % Energy consumption per landed tonne (l/t) 2,732 2,697 2,91 1, % Landings weight (thousand tonnes) % Landings value (million ) % Recreactional catches of selected species (T).1.5 Data source: DCF 214 Fleet Economic (MARE/A3/AC(214)); data for 213 and 214 are provisional. In 213, the provisional number of fishing enterprises in the Maltese fleet totalled 85, with the vast majority owning a single vessel. Fewer than 16% of enterprises owned two to five fishing vessels. Total employment in 212 was estimated at 425 jobs, corresponding to 413 FTEs. The level of employment increased 89% between 211 and 212. The significant increase in FTE estimates when compared to 28 is due to a change in the data collection procedure and hence, these are not comparable. In 213, the Maltese fleet spent a total of around 28 thousand days at sea, with a 16% reduction from 212. The number of days at sea also decreased between 211 and 212 (-18%). The quantity of fuel consumed in 212 totalled around 1.6 million litres, 38% lower than in 211 (Table ; Figure ). 1 This National Chapter is built on data that by experts has been judged, in part, as questionable regarding both coverage and quality. Results should therefore be treated carefully! 264
267 214 Annual Economic Report on the EU Fishing Fleet The total weight landed by the Maltese fleet in 213 was 2.4 thousand tonnes of seafood, with a landed value of 12.3 million. The total weight and value of landings increased over the period analysed, with the smallscale fleet accounting for around one third of the weight landed. GT, kw (thousands) million / thousand tonnes Landings value (million ) Landings weight (thousand tonnes) Figure Maltese fleet main trends for the period Vessel tonnage Vessel power No. Vessels FTE Total employed Landings value Landings weight Landings income Atlantic bluefin tuna Common dolphinfish Giant red shrimp Surmullet Swordfish no. of vessels, employment thousand days Average price ( /kg) Data source: DCF 214 Fleet Economic (MARE/A3/AC(214)); data for 213 are provisional. Top left capacity and employment; top right fishing effort and fuel consumption; middle left landings in value and weight; middle right average landed prices of top 5 species in terms of value landed in 212; bottom left landed value of top 5 species in terms of value landed in 212; and bottom right landed weight of top 5 species in terms of value landed in Days at sea Fishing days Energy consumption Atlantic bluefin tuna Giant red shrimp Swordfish Common dolphinfish Surmullet Atlantic bluefin tuna Common dolphinfish Giant red shrimp Surmullet Swordfish million litres In 212, swordfish catches produced the highest landed value ( 3.6 million) by the national fleet, followed by Atlantic bluefin tuna ( 1.4 million), common dolphinfish ( 1.2 million), giant red shrimp (.9 million) and then surmullet (.6 million). In terms of landings weight, swordfish landings amounted to 5 tonnes, chub mackerel 25 tonnes and round sardinella 2 tonnes. The major factors causing the increase in weight and value of landings are probably due to increased demand for some species, such as chub mackerel and round sardinella that are nowadays used as bait for longliners and for feed in aquaculture farms (for bluefin tuna). Moreover, higher prices per kilo were achieved in 212 compared to previous years, also contributing to the increase in landings value. 265
268 National Chapters The prices obtained for these key species in general increased between 28 and 212. Giant red shrimp achieved the highest average price per kilo in 212 ( 18.8 per kg), followed by Atlantic bluefin tuna ( 9.86 per kg). First sales prices increased for a number of key species due to higher export demand and generally higher prices achieved through auction markets. National Fleet Economic performance The amount of income generated by the Maltese national fleet in 212 was 13.2 million. Income from landings equated to 12.7 million, an increase of 11% compared to 211. Operating costs incurred by the Maltese national fleet in 212 equated to 13.1 million, almost 1% of income. Crew cost and fuel costs, the two major fishing expenses, were 4.1 and 4.3 million, respectively (see Table ). Table Maltese national fishing fleet economic performance in and projections for 213. Development trend based on % net profit margin 212 to average net profit margin Arrows indicate change ( ) 212 to 211: ( ) increase; ( ) decrease and ( ) stable/no change ( between -1 and +1%) Variable (million ) National Fleet % Income Costs Economic Indicators Capital value Profitability and development trends Landings income % Other income Labour costs % Energy costs % Repair costs % Other variable costs % Other non-variable costs % Capital costs % GVA % Gross profit % Net profit % Depreciated replacement value % Investments % Net profit margin (%) % development trend Improved 85% RoFTA (%) % development trend Improved 69% GVA per FTE (thousand ) % development trend Deteriorated -61% Data source: DCF 214 Fleet Economic (MARE/A3/AC(214)); data for 213 are provisional. In terms of economic performance, the amount of Gross Value Added (GVA), gross profit and net profit generated by the Maltese national fleet in 212 was 4.2 million,.1 million and - 6 million, respectively. GVA decreased 32% while gross profit and net profit increased compared to 211. A change in the capital value of the fleet is related to the change in the calculation methodology of the capital value and depreciation costs, using as the Perpetual Inventory Method (PIM), which Malta started to use in 21. Profits have, however, not increased and the net profit has consistently been negative between 28 and 212. With regards to capital cost projected for 213, 33.4 million may be overestimated taking into account that the number of vessels decreased to 14 vessels from 16 in 212. Hence, capital cost for 213 should be less than the capital cost taken in 212 or at least equal to
269 million 214 Annual Economic Report on the EU Fishing Fleet In 212, the Maltese fleet had an estimated (depreciated) replacement value of 41 million. Investments by the fleet amounted to 2.3 million in 211. Net profit margin has deteriorated over the years at national fleet level but has improved for the Maltese small-scale fleet. The development trend in RoFTA on the other hand is quite stable and labour productivity (GVA per FTE) has improved. Performance indicators (million ) Landings income Other income Revenue GVA Gross profit Net profit Data source: DCF 214 Fleet Economic (MARE/A3/AC(214)); data for 213 are provisional. Figure Maltese fleet main economic performance trends for the period million % Top left income structure; top right cost structure; middle left cost items as a percentage of income (fishing income and other income); middle right economic performance indicators; bottom performance indicators as a % of revenue (landings income + other income) (projections figures for 213) Crew wage costs Energy costs Other variable costs Annual depreciation Unpaid labour Repair costs Other non-variable costs GVA to Revenue Gross profit margin Net Profit margin RoFTA Fleet Segment Level Economic performance The Maltese fleet is highly diversified with a broad range of vessel types targeting different species in the Mediterranean. The national fleet consisted of 23 active (DCF) fleet segments in 211, with 5 inactive fleet segments consisting of 273 vessels. Seven of the active fleet segments made net losses in 212 while four made an overall profits (information lacking for 8 segments). Table and Table provide a breakdown of key performance indicators by fishing activity (small, large and distant-water fleets). Table provides a breakdown of key performance indicators for all Maltese fleet segments in 212. A short description of three important segments in terms of total value of landings is provided below. Small-scale fleet A large proportion (68%) of the fleet consists of small-scale vessels under 12m and the entire fleet operates solely in the Mediterranean Sea. The small-scale fleet was stable in terms of vessel numbers, tonnage and power between 212 and 213. However, the overall trend from 28 to 213 is an increase in capacity, with the number of vessels, tonnage and power increasing by 14%, 9% and 15%, respectively. Vessels using hooks 6 12m - 4 vessels made up this segment in 212, which operates predominantly in the Mediterranean. The fleet targets a variety of species mainly by using surface and bottom long-liners. Surface long-liners target mainly large pelagic species such as Atlantic bluefin tuna (Thunnus, thynnus), swordfish (Xiphias gladius), and common dolphinfish (Coryphaena hippurus) while bottom long-liners target demersal 267
270 National Chapters species such as longnose spurdog (squalus blainvillei), red scorpion fish (Scorpaena scrofa) and red porgy (Pagrus pagrus) amongst others. In 212, the total value of landings was just under 1.3 million and around 5 FTEs were employed in this fleet segment. This fleet segment was profitable, with a reported gross profit of around.5 million and net profit of.2 million in 212. The main reasons for the loss are the increased costs attributed to energy consumption where fishers are required to travel to more distant grounds for fishing, higher unpaid labour costs and significant annual depreciation costs. Vessels using hooks 18 24m - 16 vessels made up this segment in 212, which operates predominantly in the Mediterranean. The fleet targets a variety of species mainly by using surface and bottom long-liners. Surface long-liners target mainly large pelagic species such as Atlantic bluefin tuna(thunnus, thynnus), swordfish (Xiphias gladius), and common dolphinfish (Coryphaena hippurus) while bottom long-liners target demersal species such as bluntnose sixgill shark (Hexanchus griseus), red scorpion fish (Scorpaena scrofa) and longnose spurdog (Squalus blainvillei) species amongst others. In 212, the total value of landings was about 2.6 million and around 5 FTEs were employed in this fleet segment. This fleet segment was profitable, with a reported gross profit of around.9 million and net profit of 88 thousand in 212. The main drivers behind the loss are the high costs attributed to annual depreciation costs and high opportunity costs of capital along with high variable costs. Demersal trawlers 18-24m 14 vessels make up this segment in 212, which operates predominantly in the Mediterranean. The fleet targets a variety of species but in particular demersal and deep water species, such as deep water rose shrimp (Parapenaeus longirostris), giant red shrimp (Aristeomorpha foliacea) and surmullets (Mullus surmuletus). Maltese trawlers are divided into 3 categories: (i) Trawlers targeting demersal slope species, mainly red shrimps (Aristaeomorpha foliacea and Aristeus antennatus) all year round depending on the weather; (ii) Trawlers targeting demersal species, mainly deep-water rose shrimps (Parapenaeus longirostris), and red mullets (Mullus barbatus and Mullus surmuletus) also all year round; (iii) Vessels target both demersal slope and demersal shelf species. In 212, the total value of landings was almost 2.3 million and around 28 FTEs were employed in this fleet segment. This fleet segment was not particularly profitable, with a reported gross profit of around.2 million and a net loss of 1.1 million in 212. The main drivers behind the loss were the high opportunity cost of capital and depreciation costs. Assessment and Future Trends No national expert available during both EWGs to provide information on the development trends of the Maltese fleet. Table Maltese national fleet structure, activity and production trends by operational scale: Arrows indicate change ( ) 212 to 211: ( ) increase; ( ) decrease and ( ) stable/no change ( between -1 and +1%) Structure Employment Fishing Effort Output Variable Small scale Fleet % Large scale fleet No. Vessels (#) % % Vessel tonnage (thousand GT) % % Vessel power (thousand kw) % % Total employed (#) % % FTE (#) % % Average wage per employed (thousand ) % % Average wage per FTE (thousand ) % % Days at sea (thousand days) % % % Fishing days (thousand days) % % Energy consumption (milion litres) % % Energy consumption per landed tonne (l/t) 3,25 6,8 2,177 1,346 1,46 9% 2,997 1,983 4,26 1, % Landings weight (thousand tonnes) % % Landings value (million ) % % 268
271 214 Annual Economic Report on the EU Fishing Fleet Table Economic performance of the Maltese national fishing fleet by operational scale: Development trend based on % net profit margin 212 to average net profit margin Arrows indicate change ( ) 212 to 211: ( ) increase; ( ) decrease and ( ) stable/no change ( between -1 and +1%) Variable (million ) Small scale Fleet % Large scale fleet % Income Costs Economic Indicators Capital value Profitability and development trends Landings income % % Other income Labour costs % % Energy costs % % Repair costs % % Other variable costs % % Non-variable costs % % Capital costs % % GVA % % Gross profit % % Net profit % % Depreciated replacement value % % Investments % % Net profit margin (%) % % development trend Improved 87% Improved 85% RoFTA (%) % % development trend Improved 68% Improved 8% GVA per FTE (thousand ) % % development trend Deteriorated -7% Improved 18% Data Issues In 21, a sampling plan was implemented in order to achieve estimates for all the economic variables at population level. The technique of stratified random sampling was used; the sample was selected randomly from the total population. Interviews based on questionnaires were used to gather the data needed. The sampling frame for the collection of economic data was based on the fishing vessel register information recorded in MALTASTAT, which is a reliable and efficient computerised fisheries statistics system that includes a register/inventory of all fishing vessels as well as on log books with information from catch and landings evaluation. As regards the transversal data, for vessels over 1m, census data is obtained through data from the Fleet Vessel Register, logbooks and market data. For small-scale vessels, the same sampling plan for the economic variables is carried out. The large fluctuations obtained for most variables and fleet segments are mainly attributed to the fact that the vast majority (over 9%) of vessels in Malta are multipurpose with different gears registered. For this reason, if a vessel uses some gears in one year and uses different gears in other years, this vessel will form part of a different segment in the next year. This is true for a large number of vessels, and this causes shifts in all the economic and transversal data gathered and thus fluctuations can be considerable. A sampling / statistical strategy whereby this is eliminated needs to be attempted. Data on income from leasing out quota or other fishing rights, lease/rental payments for quota or other fishing rights and the value of quota and other fishing rights was collected for the first time for the year 29. This is partly due to the fact that total allowable catch (TAC) for bluefin tuna was introduced in 29. As stated earlier, the change in calculation methodology for capital value and depreciation costs is the reason why there has been a substantial change in values. From 21, the Perpetual Inventory Method (PIM) was introduced so everything else being equal the trend for depreciation costs is expected to stabilise in future years. Moreover, 21 was the year in which the new sampling plans were employed and it is evident that 21 data is significantly different from data reported in earlier years. This year was the trial year for the new sampling plan, and thus results may not be particularly reliable. When new sampling plans are introduced, the transition period should ideally be accompanied by a parallel data collection method to cross-check the data being collected with the new plan. If possible, sampling strategies should be consistent throughout the years. Some trends may be misleading due to poor data quality in earlier years (28 and 29). Economic data calculations have been improved (as explained earlier) in more recent years, however, an important data 269
272 National Chapters issue that needs to be considered is that for most of the economic data, the data is obtained from direct interviews with fishers through a sampling plan. This method assumes that the fishers are giving good quality data and is highly dependent on how much the data they give during the interviews is true and correct. From the resulting data obtained in the past few years, the trend is that, in general during the interviews, fishers declare very high capital costs and other fixed and variable costs and low income. This data needs to be checked with other data sources thoroughly in future years or alternative data collection methods needs to be attempted. It should be noted that the significant changes in the value of unpaid labour is due to a change in the data collection procedure. Employment levels are checked at fleet level. If for example a particular fishery requires more than one person on board (that is, other than the vessel owner/skipper which is included in the calculation), value of unpaid labour (or alternatively paid employment) must be present. In addition, the hours of work on shore by the vessel owner and other non paid labour are included in the calculation. 27
273 214 Annual Economic Report on the EU Fishing Fleet Table Main socio-economic performance indicators by fleet segment in the Maltese national fishing fleet in 212. Development trend based on % net profit margin 212 to average net profit margin Arrows indicate change ( ) 212 to 211: ( ) increase; ( ) decrease and ( ) stable/no change ( between -1 and +1%) Fleet segment No. of vessels (N) % FTE (N) % Days at sea (days) % Energy consumption (litres) % Value of landings (thousand ) % Weight of landings (thousand tonnes) % GVA (thousand ) % GVA per FTE ( /FTE) % Gross profit (thousand ) % Net profit (thousand ) % Net profit margin (%) % Profitability (212) Net profit margin % 212 average (28-11) Economic development trend MLTAREA37DFNVL6 9 35% High 113% Improved MLTAREA37DFNVL % MLTAREA37DFNVL % -49% 4-76% 1-71% -77% -9-98% % MLTAREA37DTSVL % % % % Weak 33% Improved MLTAREA37DTSVL % 5-51% % 5 25% % 61 8% 43-87% % % % % Weak MLTAREA37HOKVL % % 1-98% 4-95% 1-94% 2 114% % % % Weak -5226% Deteriorated MLTAREA37HOKVL % 5 44% % % % % % % % % 2 18% High 112% Improved MLTAREA37HOKVL % 21-49% 766 8% 37-81% % 147 8% % % % 88 14% 8 13% Reasonable 16% Improved MLTAREA37HOKVL % 5 321% % % % % % % % 18 1% 1 1% Reasonable 11% Improved MLTAREA37HOKVL % 68-74% 3-84% 4-87% MLTAREA37PGPVL % % % % % % % % -6 96% Weak 98% Improved MLTAREA37PGPVL % % % % % 229 1% % % % % % Weak 94% Improved MLTAREA37PMPVL % Weak 57% Improved MLTAREA37PMPVL % % % % % % % % 22 15% % % Weak 89% Improved MLTAREA37PMPVL % 2-74% MLTAREA37PSVL Reasonable MLTAREA37PSVL High Data source: DCF 214 Fleet Economic (MARE/A3/AC(214)). 271
274 million Performance indicators (million ) % GT, kw (thousands) # of vessels, FTE million / thousand tonnes Vessel power Vessel GT No. Vessels Employed thousand days Days at sea Fishing days Energy consumption Energy consumption (million litres) National Chapters Landings value Landings weight Landings income Price /kg Landings value (million ) Landings weight (tousand tonnes) Atlantic bluefin tuna Giant red shrimp Swordfish Common dolphinfish Surmullet Atlantic bluefin tuna Common dolphinfish Giant red shrimp Surmullet Swordfish Atlantic bluefin tuna Giant red shrimp Swordfish Common dolphinfish Surmullet Landings income Direct income subsidies Other income Fishing rights income Revenue GVA Net profit GVA to Revenue Net Profit margin 272
275 214 Annual Economic Report on the EU Fishing Fleet 5.16 THE NETHERLANDS Fleet Structure, Fishing Activity and Production In 213, the Dutch fishing fleet consisted of 741 registered vessels, with a combined gross tonnage of 129 thousand GT, a total power of 275 thousand kw and an average age of 3 years. The size of the fishing fleet remained stable between 211 and 213. In 213, the number of fishing enterprises in the Dutch fleet totalled 456, with the vast majority (7%), owning a single vessel. Only 3% of the enterprises owned two to five fishing vessels. Total employment in 213 was estimated at 1,982 FTEs. The level of employment decreased between 29 and 213 and the number of FTEs dropped 1% over the period. The major factors causing employment to decrease include a reduction in number of vessel in the segment over 24m and smaller crew during trips because of declining earnings (less fishermen on board/minimum required crew) (Table ; Figure ). Table Dutch national fleet structure, activity and production trends: Arrows indicate change ( ) 212 to 211: ( ) increase; ( ) decrease and ( ) stable/no change ( between -1 and +1%) Variable NATIONAL FLEET % Output Fishing Effort Employment Structure Total No. Vessels (#) % 735 No. of Inactive vessels (#) % 19 Average vessel age (year) % 3 Vessel tonnage (thousand GT) % 134 Vessel power (thousand kw) % 28 No. of Enterprises (#) % Total employed (#) 3,256 3,239 3,335 2,778 2,881 3,25 4% FTE (#) 2,197 2,139 2,198 1,926 1,769 1,982-8% Average wage per employed (thousand ) % Average wage per FTE (thousand ) % Days at sea (thousand days) % Fishing days (thousand days) % Energy consumption (milion litres) % Energy consumption per landed tonne (l/t) % Landings weight (thousand tonnes) % Landings value (million ) % Recreactional catches of selected species (T Data source: DCF 214 Fleet Economic (MARE/A3/AC(214)); data for 213 and 214 are provisional. In 213, the Dutch fleet spent a total of around 5 thousand days at sea. The total number of days at sea increased slightly compared to 212. The major factor causing the increase in days at sea since 211 includes higher effort in the shrimp fishery. The quantity of fuel consumed in 212 totalled around 171 million litres, a decrease of around 7% from 211 and 25% from 21. The major factors causing the decrease in fuel consumption include the results of innovation programmes (introduction of new technics in fishing gear) that commenced in 28. Transition to sustainable fisheries is an ongoing process. In the year 212 almost all 42 EU allowances for pulse technique were in effect in the Netherlands. This resulted in 4-6% less fuel consumption and less fuel costs per individual vessel per day at sea. Fuel consumption in 213 will stabilise because no new permits for use of pulse technique (instead of beam trawl) were issued. However, fuel consumption is expected to decrease considerably again in 214 because of further investments in the fuel saving pulse technic (due to 42 extra EU allowances). It is estimated that fuel consumption will decrease again at least by another 2-3 million litres in the next few years, depending on the size of the vessels. 273


, followed by the years 21 (385 thousand tonnes), 211 (351 thousand tonnes), 29 (35 thousand")

 prices were paid for common sole ( 9.28 per kg in 212), followed by common shrimp ( 3.")
276 National Chapters Figure Dutch fleet: main trends for the period Data source: DCF 214 Fleet Economic (MARE/A3/AC(214)); data for 213 are provisional. Top left capacity and employment; top right fishing effort and fuel consumption; middle left landings in value and weight; middle right average landed prices of top 5 species in terms of value landed in 212; bottom left landed value of top 5 species in terms of value landed in 212; and bottom right landed weight of top 5 species in terms of value landed in 212. The total weight of fish and shellfish landed by the Dutch fleet in 213 was 341 thousand tonnes, with a value of 367 million. The total weight and value of landings increased compared to 212. In terms of landed weight, in 28 the fleet achieved the highest value (415 thousand tonnes), followed by the years 21 (385 thousand tonnes), 211 (351 thousand tonnes), 29 (35 thousand tonnes), 213 (341 thousand tonnes) and 212 (335 thousand tonnes). The total landings of flatfish increased slightly in time; the total landings of pelagic fish fluctuated from year to year. Most of the prices for the key species presented in Figure decreased since 21. Prices for plaice and sole decreased in 212 by 3% and 8%, respectively, compared to 28. The price of shrimp increased in 212 to the level of 28. The highest (auction) prices were paid for common sole ( 9.28 per kg in 212), followed by common shrimp ( 3.38 per kg in 212) and European plaice ( 1.36 per kg in 212). Prices (direct sales) for jack and horse mackerels remained stable. In 213, prices for plaice and sole decreased again, while the average price of shrimp remained stable because of rather low landings. Common sole accounted for around 3% of the total value of landings obtained by the Dutch fleet in the period , shrimp accounted for 274
277 214 Annual Economic Report on the EU Fishing Fleet around 2%. In 212 total employment increased whereas FTE s decreased. This was mainly due to an increase in part-time employment. National Fleet Economic performance The total amount of income generated by the Dutch national fleet in 212 was 364 million. This consisted of 358 million landings value and around 5.9 million in non-fishing income. Total income increased between 211 and 212 and is expected to have increased again in 213. Total costs in 212 equated to 367 million, consisting of 327 million in operating costs and a further 4 million in capital costs. Total costs for 213 are estimated at 364 million. Labour and energy costs, the two major fishing expenses, are expected to amount to 92 and 12 million, respectively in 213 ( Table ). Saving fuel is one of the most important goals of the Dutch fleet. In 213, savings in energy costs is expected to amount to 3 million. Table Dutch national fishing fleet economic performance in and projections for 213. Development trend based on % net profit margin 212 to average net profit margin Arrows indicate change ( ) 212 to 211: ( ) increase; ( ) decrease and ( ) stable/no change ( between -1 and +1%) Variable (million ) National Fleet % Income Costs Economic Indicators Capital value Profitability and development trends Landings income % Other income % Labour costs % Energy costs % Repair costs % Other variable costs % Other non-variable costs % Capital costs % GVA % Gross profit % Net profit % Depreciated replacement value % Investments % Net profit margin (%) % development trend Deteriorated -13% RoFTA (%) % development trend Deteriorated -142% GVA per FTE (thousand ) % development trend Improved 1% Data source: DCF 214 Fleet Economic (MARE/A3/AC(214)); data for 213 are provisional. In terms of economic performance, the total amount of Gross Value Added (GVA), gross profit and net profit generated by the Dutch national fleet in 212 was 13 million, 37 million and - 3. million, respectively. All indicators are expected to have increased in 213 compared to 212, with the Dutch fleet moving from making a loss to posting a net profit. The major factors causing the improvement in economic performance include higher landings of more valuable species and lower costs mainly because of fuel saving (e.g. pulse) techniques in the flatfish fleet. Total investment increased from 211 to 212, but this increase was mainly due to investments in the large pelagic trawler segment (13mln increase). For the pelagic fleet in 213 fishing opportunities were limited. Fishery licenses for African waters had still not been prolonged and fishing in Pacific waters was not successful due to poor catches. Therefore, some vessels were tied up temporarily, which means that effort decreased significantly. In 213, the Dutch fleet had an estimated (depreciated) replacement value of almost 34 million, lower than the year before, and an estimated value of fishing rights of 25 million. Fishing rights and quota are transferable in the Netherlands. Selling/buying and leasing these rights are quite common and prices fluctuate 275

); data for 213 are provisional. Figure 5.16.")
; middle")
. Fleet Segment Level Economic performance The Dutch fleet is highly diversified with a broad range of vessel types targeting different")

278 National Chapters substantially from year to year, depending on market availability (e.g. quota for sole or plaice available or not). Investments amounted to 35 million in 212 and will not change significantly in 213. The major factors causing the change in the capital value of the fleet include the higher cost of building new vessels in case of replacement. Data source: DCF 214 Fleet Economic (MARE/A3/AC(214)); data for 213 are provisional. Figure Dutch fleet main economic performance trends for the period Top left income structure; top right cost structure; middle left cost items as a percentage of income (fishing income and other income); middle right economic performance indicators; bottom performance indicators as a % of revenue (landings income + other income) (projected figures for 213). Fleet Segment Level Economic performance The Dutch fleet is highly diversified with a broad range of vessel types targeting different species predominantly in the North Sea (demersal fleet) and North East Atlantic Ocean (pelagic fleet), around the UK and Ireland. Besides that, a part of the pelagic fleet operates in African waters and in the Pacific. Figure Dutch fleet effort and landings by FAO fishing area, 212. Colour shows fishing days (thousand days) and landings in weight (thousand tonnes); Value shows days-at-sea (thousand days) and landings in value (thousand ). Source: DCF 214 Fleet Economic (MARE/A3/AC(214)) 276
279 214 Annual Economic Report on the EU Fishing Fleet The economic performance of the fleet relies heavily on innovation and technical/structural development. The Dutch government and the EU supported the fisheries sector to produce fish in a more sustainable way with economic perspectives. Projects started a few years ago (e.g. knowledge networks ) helped to improve entrepreneurship in fisheries so that fishermen will be able to compete in international fish business in future. The national fleet consisted of 1 (DCF) fleet segments in 212. Almost all of the larger active fleet segments made profits in 212 while -1 m DTS vessels, -1 m PG vessels, m TBB vessels and over 4 m TM vessels made losses. Table and Table provide a breakdown of key performance indicators by fishing activity (small and large-scale fleets). Table provides a breakdown of key performance indicators for all 1 fleet segments in 212. A short description of the four most important segments in terms of total value of landings is provided below. Beam trawl over 4m 64 vessels make up this segment which operates predominantly in the North Sea. The fleet targets a variety of species but in particular flatfish, such as sole, plaice and turbot. In 212, the total value of landings was almost 116 million and around 375 FTEs were employed in this fleet segment, contributing to 33% and 21% of the total income from landings and FTEs generated by the Dutch fishing fleet, respectively. This fleet segment was profitable, with a reported gross profit of around 25 million and net profit of 18 million in 212. The total number of vessels in this fleet segment did not change but the structure of the segment did. A very important development is the change in flatfish fishing methods. In 211 and 212 vessels invested in replacement of beam trawl by some other newly developed fishing methods. Replacement of the beam by the SumWing (an aquadynamic wing) showed fuel savings (up to 15%) and fishing with pulse techniques combined with SumWing showed even better fuel saving results compared to the conventional beam trawl (up to 6%). Conventional beam trawl vessels generally made losses in 212, Sum Wing vessels made also a small loss whereas vessels fishing with pulse techniques made a reasonable profit. Research pilots concerning pulse techniques show significantly less impact on the seabed and less unwanted by-catches (non-commercial fish/discards). Generally it can be said that flatfish (especially sole) can be caught cheaper by using pulse technique despite rather high investments. Besides, the fishery with pulse trawl is more sustainable. However, vessels fishing with the pulse technique only have a permit on a temporary basis. It is still not known if the pulse technique will be allowed permanently in the future. In 212, an increased amount of sole was landed due to the selectivity for this species by fishing with pulse technique. Landings of other individual species did not change very much. The total landings increased by 4% and the value of landings decreased by 3%, mainly as a result of lower average prices. Employment decreased by 6% and fuel consumption dropped by 21% in this segment. As a result, total costs decreased and Gross Value Added increased by 4% compared to 211. Pelagic trawl over 4m 13 vessels made up this segment which operated predominantly in the North East Atlantic Ocean and to a lesser extend in the North Sea. In addition five vessels operated in the first few months of 212 in African waters and in the Pacific. However, this segment faced problems with effort in these non EU-waters. The fleet targeted pelagic species, particularly herring, mackerel, horse mackerel, blue whiting and sardines. The total value of landings dropped to almost 18 million and around 44 FTEs were employed in this fleet segment, contributing to 3% and 25% of the total income from landings and FTEs generated by the Dutch fishing fleet, respectively. This fleet segment was not profitable. Effort in terms of days at sea decreased by 26% and mainly as a result of that the use of energy decreased. Lower landings weight (-7%) and lower fish prices resulted in a lower value of landings (-9%). High costs (mainly because of high fuel prices) resulted in a net loss. Beam trawl 18-24m 165 vessels made up this segment which operated predominantly in the North Sea and in the coastal zone. The fleet mainly targeted common shrimp and some vessels targeted langoustines (seasonally) and flatfish, such as sole, plaice and turbot. In 212, the total value of landings was almost 6 million and around 48 FTEs were employed in this fleet segment, contributing to 17% and 27% of the total income from landings and FTEs generated by the Dutch fishing fleet, respectively. 277
280 National Chapters This fleet segment was profitable, mainly because of high average price for shrimp, with a reported gross profit of around 7 million and net profit of 2 million in 212. Effort in terms of days at sea increased by 33% compared to 211 and energy consumption increased by 32%. Landings weight decreased by 9%. In this segment a limited number of vessels started to invest in pulse technique, targeting flatfish (mainly sole). Also a few (4) vessels started an innovation project (improvement program for sustainable fisheries) to implement pulse technique targeting shrimp on an experimental basis. The first results provide a perspective for the future because of the more sustainable character of the gear compared to traditional beam trawl for shrimp. Economic results look promising (apart from high costs of investments). First results show up to 25% fuel saving compared to (shrimp) beam trawl. However, these vessels are just temporary allowed to fish with the pulse technique and until now it is not clear if this technique will be allowed permanently in future. Beam trawl 24-4m 26 vessels made up this segment which operated predominantly in the North Sea. The fleet targeted a variety of species like mullet, gurnard, squid and sea bass (mainly fly shoot method) but in particular flatfish, such as sole, plaice and turbot. In 212, the total value of landings was almost 27 million and around 147 FTEs were employed in this fleet segment, and contributed to 8% of both the total income from landings and FTEs generated by the Dutch fishing fleet. This fleet segment was profitable, with a reported gross profit of around 1 million and net profit of.1 million in 212. Vessels in this segment also started using pulse techniques on a temporary basis with positive economic results, whereas the economic performance of the conventional beam trawl was generally quite negative. Table Dutch national fleet structure, activity and production trends by operational scale: Arrows indicate change ( ) 212 to 211: ( ) increase; ( ) decrease and ( ) stable/no change ( between -1 and +1%) Structure Employment Fishing Effort Output Variable Small scale Fleet % Large scale fleet No. Vessels (#) % % Vessel tonnage (thousand GT) % % Vessel power (thousand kw) % % Total employed (#) % 2,911 2,962 3,1 2,679 2,522 2,545-6% FTE (#) % 2,87 2,29 2,15 1,899 1,652-13% Average wage per employed (thousand ) % % Average wage per FTE (thousand ) % % Days at sea (thousand days) % % % Fishing days (thousand days) % % Energy consumption (milion litres) % % Energy consumption per landed tonne (l/t) 84 2, ,81 262% % Landings weight (thousand tonnes) % % Landings value (million ) % % Source: DCF 214 Fleet Economic (MARE/A3/AC(214)) 278
281 214 Annual Economic Report on the EU Fishing Fleet Table Economic performance of the Dutch national fishing fleet by operational scale: Development trend based on % net profit margin 212 to average net profit margin Arrows indicate change ( ) 212 to 211: ( ) increase; ( ) decrease and ( ) stable/no change ( between -1 and +1%) Variable (million ) Small scale Fleet % Large scale fleet % Income Costs Economic Indicators Capital value Profitability and development trends Landings income % % Other income % Labour costs % % Energy costs % % Repair costs % % Other variable costs % % Non-variable costs % % Capital costs % % GVA % % Gross profit % % Net profit % % Depreciated replacement value % % Investments % Net profit margin (%) % % development trend Deteriorated -261% Deteriorated -122% RoFTA (%) % % development trend Deteriorated -128% Deteriorated -129% GVA per FTE (thousand ) % % development trend Deteriorated -78% Improved 13% Source: DCF 214 Fleet Economic (MARE/A3/AC(214)) Assessment and Future Trends The most important issues in the Dutch fishery sector are: Fisheries in general Closed areas: Demersal trawl fisheries are facing many closed areas because of Natura 2. Beside that other activities in the North Sea other than fisheries claim more and more space. As a result, fisheries are forced to move to other areas. Landing obligation: Parts of the fisheries sector are preparing to meet the requirements with respect to landing obligation which will start in January 215 for the pelagic fisheries and in January 216 for the demersal fisheries. Fishermen started projects (supported by the Dutch government and EU) to decrease unwanted bycatch. Generally fishermen share ideas (within knowledge networks) about designs of gear to diminish discards. Besides that, ideas about fishing behaviour are exchanged so that the impact of fisheries will be minimised. Vessel Innovation: Figures in this report show an ongoing ageing of the fleet. As a result, the fleet will depreciate and become outdated in the near future. Fishermen, in cooperation with suppliers and ship builders, now develop a new vessel concept so that fisheries can be operating in a more sustainable and fuel saving way in the future (improvement of competitiveness). Finance: Entrepreneurs in fisheries face problems with finding finance for investment in innovation to get a better economic position and to make fisheries more sustainable. Fish prices: Continuation of the general trend in lower prices for most fish species. Flatfish fishery in general (the beam trawl 12-18m, 24-4m and over 4m segments) Increase of EU allowances for pulse technique: In March 214 another 42 permits became available for the flatfish fleet. By this action almost all conventional beam trawl vessels (>24 meter) will replace their fishing gear by pulse technique, scheduled in 214. By this it is expected that total energy consumption will decrease significantly again for these segments. 279
282 National Chapters Quota for sole: Because of the high selectivity of the pulse technique on sole, it can be expected that quota for this specie will be fully exploited starting in 214. This contrasts to past years where sole quota was not fully exploited. Shrimp fishery in general (the beam trawl 18-24m segment) Pulse technique for shrimp: Further introduction of pulse techniques in shrimp fisheries is on hold now because of a general demand (fishermen, NGO s) to collect more and better information and to assess the impact on shrimps and other species by this new technique. Landing prices: Low landings in the first half of 214 resulted in rather high average prices for shrimp. A longer trend of the main indicators analysed, including data from the Data Collection Regulation (DCR, 22-27), is provided at the end of this chapter. Data issues Most of the segments in the Dutch fishing fleet are well covered. In some of the smaller segments (DRB -1 m, DTS -1 m and TBB m) variation in activity levels is high resulting in high uncertainty in the economic indicators estimates and large fluctuations from year to year. Therefore, these figures should be viewed as indicative for the size of the sector rather than describing the exact trends. Currently work is being carried out to improve the estimation procedures. 28
283 214 Annual Economic Report on the EU Fishing Fleet Table Main socio-economic performance indicators by fleet segment in the Dutch national fishing fleet in 212. Development trend based on % net profit margin 212 to average net profit margin Arrows indicate change ( ) 212 to 211: ( ) increase; ( ) decrease and ( ) stable/no change ( between -1 and +1%) Fleet segment No. of vessels (N) % FTE (N) % Days at sea (days) % Energy consumption (litres) % Value of landings (thousand ) % Weight of landings (thousand tonnes) % GVA (thousand ) % GVA per FTE ( /FTE) % Gross profit (thousand ) % Net profit (thousand ) % Net profit margin (%) % Profitability (212) Net profit margin % average (28-11) Economic development trend NLD AREA27 DRB VL1 2 25% 13 24% 71-87% 1, % 8,442 % 54-98% 5,72-3% % 3,528-54% 3,14-59% 37-59% High -58% Deteriorated NLD AREA27 DTS VL1 24-4% % 26-88% % 1-98% % % % ,656 Weak NLD AREA27 DTS VL % 65-35% 2,212 2% 4,157 27% 8,562 1% 3,355 21% 3,372-29% % 1,672-36% 1,52-47% 11-48% High 224% Improved NLD AREA27 DTS VL % 19 8% 3,969 12% 8,65 25% 26,96 22% 1,542 41% 1,368-1% % 3,967-33% 1,28-72% 4-77% Reasonable -6% Deteriorated NLD AREA27 PG VL % % 2,54-2% % 3,79-33% % 1,456-64% % % - 1, % % Weak -261% Deteriorated NLD AREA27 TBB VL % 15 14% % % 1,57 87% 434-8% % % % % % Weak -27% Deteriorated NLD AREA27 TBB VL % % 2,842 33% 21,29 32% 59,684 59% 16,851-9% 28, % % 6, % 2, % 4 128% Reasonable 159% Improved NLD AREA27 TBB VL % 147-2% 4,567 11% 13,124-2% 26,722 17% 9,132 16% 8,65 35% % % 98 13% 126% Reasonable -93% Deteriorated NLD AREA27 TBB VL4XX 64 % 373-6% 11,427-1% 6,565-21% 115,545-3% 36,792 4% 45,37 4% % 25,126 18% 17,676 47% 15 5% High 3% Improved NLD AREA27 TM VL4XX 13 8% % 2,488-26% 61,135-1% 17,869-9% 254,575-7% 26,428-26% % - 4, % - 26,627-34% % Weak -124% Deteriorated Data source: DCF 214 Fleet Economic (MARE/A3/AC(214)). 281

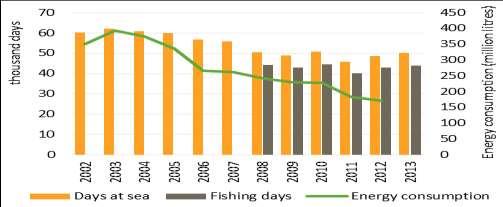
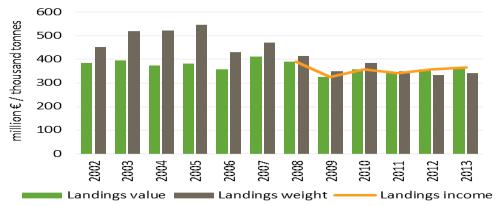
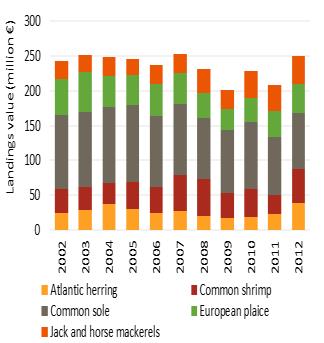
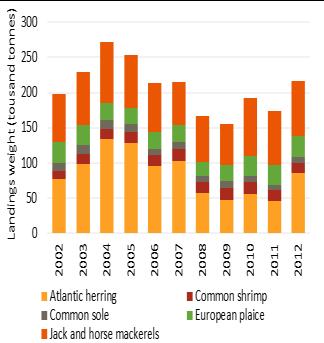
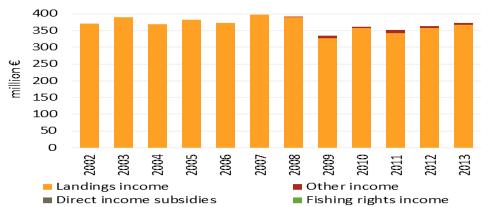
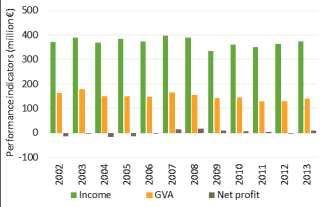
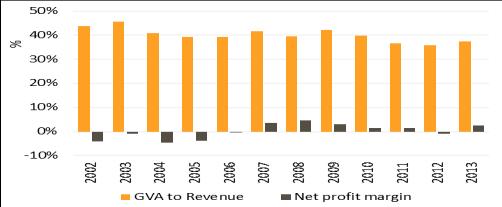
284 282 National Chapters
285 214 Annual Economic Report on the EU Fishing Fleet 5.17 POLAND Fleet Structure, Fishing Activity and Production In 213, the Polish fishing fleet consisted of 836 registered vessels, including 43 inactive vessels, with a combined gross tonnage of 57 thousand GT, a total engine power of 98 thousand kw and an average age of 28 years. The number of vessels remained stable between 211 and 212. However, GT and kw decreased by 11% and 5%, respectively (Table ; Figure ). The main factor causing this decrease was the absence of one deep-sea trawler in the fishery in 212. The significant changes in fleet capacity in 213 and 214 were also caused by changes in the deep-sea fleet composition. In 213, the number of fishing enterprises totalled 72, with the vast majority (9%), owning a single vessel. Only 9% of the enterprises owned two to five fishing vessels. Total employment in 212 was estimated at 2,54 jobs, corresponding to 1,737 FTEs. The level of employment increased between 211 and 212, with total employment increasing by 4% and the number of FTEs increasing by 1% over the period. The major factor causing employment to increase was termination of the 3 years rotating cod quota allocation system (suspension of 1/3 of the cod fleet each year) that took place in (cod effort management plan). Table Polish national fleet structure, activity and production trends: Arrows indicate change ( ) 212 to 211: ( ) increase; ( ) decrease and ( ) stable/no change ( between -1 and +1%) Variable NATIONAL FLEET % Output Fishing Effort Employment Structure Total No. Vessels (#) % 838 No. of Inactive vessels (#) % 838 Average vessel age (year) % 28 Vessel tonnage (thousand GT) % 34 Vessel power (thousand kw) % 81 No. of Enterprises (#) % Total employed (#) 3,26 2,512 2,434 2,411 2,54 2,524 4% FTE (#) 1,71 1,64 1,577 1,576 1,737 1,68 1% Average wage per employed (thousand ) % Average wage per FTE (thousand ) % Days at sea (thousand days) % Fishing days (thousand days) % Energy consumption (milion litres) % Energy consumption per landed tonne (l/t) % Landings weight (thousand tonnes) % Landings value (million ) % Data source: DCF 214 Fleet Economic (MARE/A3/AC(214)); data for 213 and 214 are provisional. Note: Distant water fleet excluded from wages, energy consumption and landings value. The Polish fleet spent a total of around 7.6 thousand days at sea in 213. The total number of days at sea in 212 amounted to 67.2 thousand days, 15% higher than in 211. The increase can be explained by a greater effort deployed by pelagic vessels benefiting from high prices for small pelagics and cod vessels that were inactive in 211 but returned to activity after the termination of the cod effort management plan (as previously mentioned). The quantity of fuel consumed in 212 totalled 2 million litres, an increase of 15% from 211. The major factors causing the increase in fuel consumption was the increase in pelagic and cod fleet activity. The total weight of seafood landed by the Polish fleet in 213 was 195 thousand tonnes. The total amount of Baltic Sea fleet landings was 133 thousand tonnes, with a landed value of 56 million. The total landings weight and value of the Baltic Sea fleet increased 21% between 211 and 212 but only 2% between 212 and
286 National Chapters In 213, European sprat generated the highest landed value in the Baltic fisheries ( 22 million), followed by Atlantic cod ( 14.6 million), Atlantic herring ( 8.7 million), and European flounder ( 4.5 million). In terms of landings weight, in 213 European sprat landings were 8.3 thousand tonnes, Atlantic cod 12.6 thousand tonnes and Atlantic herring 23.6 thousand tonnes. The major factor causing the increase in landings weight and value in 213 was high pelagic catches and prices. GT, kw (thousands) million / thousand tonnes Landings value (million ) Vessel tonnage Vessel power No. Vessels FTE Total employed Figure Polish fleet: main trends for the period no. vessels, employment (thousand) Landings value Landings weight Landings income Atlantic cod Atlantic herring European flounder European perch European sprat thousand days Average price ( /kg) Landings weight (thousand tonnes) Data source: DCF 214 Fleet Economic (MARE/A3/AC(214)); data for 213 are provisional. Top left capacity and employment; top right fishing effort and fuel consumption; middle left landings in value and weight; middle right average landed prices of top 5 species in terms of value landed in 212; bottom left landed value of top 5 species in terms of value landed in 212; and bottom right landed weight of top 5 species in terms of value landed in Days at sea Fishing days Energy consumption Atlantic cod European flounder European sprat Atlantic herring European perch Atlantic cod Atlantic herring European flounder European perch European sprat million litres National Fleet Economic performance The total amount of income generated by the Polish Baltic 1 fleet in 212 was 55.5 million (excluding subsidies). This consisted of 55.3 million in landings value ( 56.4 million in 213) and.2 million in non- 1 Due to confidentiality reasons a distant water fleet was excluded from an economic performance analysis. 284
287 214 Annual Economic Report on the EU Fishing Fleet fishing income. The Polish Baltic fleet s landings income increased 21% between 211 and 212. The historically highest outcome of the Polish fleet in 212 was caused by a sharp increase in pelagic fish prices. Total estimated costs incurred by the Polish Baltic fleet in 212 equated to 49.3 million, amounting to 89% of total income. Crew cost and fuel costs, the two major fishing expenses, were 16.3 and 14.1 million respectively (Table ; Figure ). European sprat accounted for 26% of the total landings value obtained by the Polish fleet in 212, increasing to 39% of total income in 213, while Atlantic cod decreased from 32% in 212 to 26% in 213. This was mainly due to high prices of sprat (18% increase compared to 212 prices). At the same time, Atlantic cod prices decreased by 3.3% as a result of deteriorating physical condition of individual fish. Increased supply of imported cod in the Polish market was another reason for price decreases. Table Polish national fishing fleet economic performance in and projections for 213. Development trend based on % net profit margin 212 to average net profit margin Arrows indicate change ( ) 212 to 211: ( ) increase; ( ) decrease and ( ) stable/no change ( between -1 and +1%) Variable (million ) National Fleet % Income Costs Economic Indicators Capital value Profitability and development trends Landings income % Other income % Labour costs % Energy costs % Repair costs % Other variable costs % Other non-variable costs % Capital costs % GVA % Gross profit % Net profit % Depreciated replacement value % Investments % Net profit margin (%) % development trend Stable -5% RoFTA (%) % development trend Stable 4% GVA per FTE (thousand ) % development trend Improved 27% Data source: DCF 214 Fleet Economic (MARE/A3/AC(214)); data for 213 are provisional. 285
288 National Chapters million million Performance indicators (million ) Landings income Other income Revenue GVA Gross profit Net profit % Crew wage costs Unpaid labour Energy costs Repair costs Other variable costs Other non-variable costs Annual depreciation GVA to Revenue Gross profit margin Net Profit margin RoFTA Data source: DCF 214 Fleet Economic (MARE/A3/AC(214)); data for 213 are provisional. Figure Polish fleet main economic performance trends for the period Top left income structure; top right cost structure; middle left cost items as a percentage of income (fishing income and other income); middle right economic performance indicators; bottom performance indicators as a % of revenue (landings income + other income) (projected figures for 213). Fleet Segment Level Economic performance The Polish fleet is moderately diversified with a range of vessel types targeting different species predominantly in the Baltic Sea, North East Atlantic (1 vessel), Mauritanian and Moroccan waters (2 vessels). The national fleet consisted of 8 (DCF) fleet segments in 212, with 4 inactive length classes consisting of 43 vessels. One of the active fleet segments made losses in 212 while 5 made an overall profit (information lacking for deep sea fleet segment). Table provides a breakdown of key performance indicators for all Polish fleet segments in 212. A short description of the two most important segments in terms of total value of landings is provided below. Small-scale fleet In 213 the Polish small-scale fleet consisted of 585 registered vessels, with a combined gross tonnage of 2.7 thousand GT and engine power of 21 thousand kw. The size of the fleet increased between 211 and 212, with the number of vessels increasing by 6% and GT and kw by 11% and 7%, respectively. The major factor causing this increase was the termination of the cod management plan (Table ). The total weight landed by the small-scale fleet in 213 was 12.9 thousand tonnes of fish, with a landed value of 11.7 million. The total weight of landings increased slightly between 212 and 213, however, landed value decreased as a result of lower prices for European flounder, Atlantic herring and European perch. In 213, Atlantic cod generated the highest landed value ( 3.7 million), followed by European perch ( 1.6 million), Atlantic herring ( 1.4 million), European flounder ( 1.1 million), pike perch ( 1.5 million) and Atlantic herring. In terms of landings weight, European flounder amounted to 3.4 thousand tonnes, Atlantic herring landings 3.3 thousand tonnes, and Atlantic cod 2.9 thousand tonnes. Landings of these three top species changed slightly compared to
,.4% higher than in 212, followed by Atlantic cod ( 1.27 per kg), 5.6% higher than in 211.")
.")
289 214 Annual Economic Report on the EU Fishing Fleet The prices obtained for most of the small-scale fleet key species decreased between 212 and 213. Pike perch achieved the highest average price per kilo in 213 ( 4.9 per kg),.4% higher than in 212, followed by Atlantic cod ( 1.27 per kg), 5.6% higher than in 211. Atlantic herring and European flounder as well as European perch prices dropped by 24%, 22% and 12%, respectively. The total amount of income generated by the Polish small-scale fleet in 212 was 12 million (without subsidies, which amounted to 1.5 million). The Polish small-scale fleet s total income increased 9% between 211 and 212. Crew cost and fuel costs, the two major fishing expenses, were 5.6 and 1.3 million respectively. Between 211 and 212, labour and fuel costs increased by 34% and 15% respectively (Table ). Figure Polish fleet effort and landings by FAO fishing area, 212. Colour shows fishing days (thousand days) and landings in weight (thousand tonnes); Value shows days-at-sea (thousand days) and landings in value (thousand ). Source: DCF 214 Fleet Economic (MARE/A3/AC(214)) Large-scale fleet In terms of economic performance, the total amount of Gross Value Added (GVA), gross profit and net profit generated by the Polish Baltic large-scale fleet in 212 were 19.5 million, 8.9 million and 4.7 million, respectively. GVA increased by 31%, gross profit and net profit increased by 39% and 37% respectively between 211 and 212. The major factor causing the improvement in economic performance was again high herring and sprat prices. In 212, the Baltic large-scale fleet had an estimated (depreciated) replacement value of 67 million. Investments by the fleet amounted to 1.3 million in 212. The main factor causing a change in the capital value of the fleet was an increase in number of vessels (termination of effort restriction in cod fisheries). The net profit margin development trend for the Baltic large-scale fleet improved significantly and the indicator improved in 212 compared to 211 (1%). This may be explained by high increases in prices of small pelagic species. Similarly RoFTA and GVA per FTE indicators improved in 212 compared to 211, as well as the development trend compared to the average (Table ). Distant-water fleet The amount of landings by the distant-water fleet 2 totalled 61.4 thousand tonnes in 213, a 4% increase compared to 212. In 213, Atlantic horse mackerel generated the highest landed weight (27.7 thousand 2 Vessels over 4 meters length operating in OFR or Area 27 (except for Baltic Sea) 287
290 National Chapters tonnes), followed by Round sardinella (15.9 thousand tonnes), Atlantic mackerel (7.6) thousand tonnes), Atlantic cod (6.6 thousand tonnes) and Pilchard (1.5 thousand tonnes). Pelagic trawl 24-4m 47 vessels make up this segment which operates exclusively in the Baltic Sea. The fleet targets a variety of species but in particular pelagic species, such as sprat and herring. In 212, the total value of landings was 24 million and around 38 FTEs were employed, contributing to 44% and 24% of the total income from landings and FTEs generated by the Polish Baltic fishing fleet respectively. This fleet segment was profitable, with a reported gross profit of around 3.1 million and net profit of.4 million in 212. The economic condition of the segment deteriorated in 212 compared to mainly due to high increase in crew (+25%), fuel (+42%) and depreciation costs (+133%). The number of vessels and employment in the segment changed slightly (+7% and +6% respectively). No substantial changes in catch composition took place; except for a significant increase of cod landings (this species however doesn t play an important role in the segment landings). In 212 the segment continued benefiting from high sprat and herring prices. In order to avoid over-utilisation of the TAC, a new management policy was introduced in 211 regarding the quota allocation system for Baltic sprat (ICES 22-32) and Western Baltic herring stocks (ICES 22-24). Individual maximum allowable catch limits were established for these two stocks. Vessels possessing catch records for previous years were authorised to get catch permissions with higher limits. The others got reduced (5% less) quotas. Individual limitation was introduced for Central Baltic herring (ICES 25-27) in 212. Maximum allowable catches for a single vessel was set at a level of 8 tonnes. Due to intensive catches and possibility over-utilisation of quotas the sprat and herring fisheries had to be closed early in212, like previous year. Passive gears -1 m 455 vessels (in ) make up this segment which operates exclusively in the Baltic Area including lagoon brackish waters. The fleet targets a variety of saltwater species: Atlantic herring, European flounder, Atlantic cod and a variety of freshwater species, such as freshwater bream, pike perch and pike. In 212, the total value of landings was over 8 million and around 324 FTEs (925 total jobs) were employed in this fleet segment, contributing to 15% and 24% of the total income from landings and FTEs generated by the Polish Baltic fishing fleet respectively. In 212 this segment was profitable, with a reported gross profit of around 1.6 million ( 2.2 million in 211) and net profit of 1.3 million ( 1.8 million in 212). The economic development trend deteriorated in 212 net profit margin was 53% lower compared to the average, however the profitability indicator remained at a high level of 16%. The deterioration of the economic situation may be explained by high increase in crew costs (44%) and relative low increase of landings income (14%). The small-scale fisheries is highly subsidised compared to other fleet segments. In 212 vessels belonging to a passive gear -1 m segment benefited from subsidies for voluntary reducing of fishing effort (mainly in form of temporary cessation of fishing activities). Subsidies of 7.7 (4% more than in 211) were paid out to the fleet in 212. Vessels belonging to small-scale fisheries (those under 8 meters length) kept benefiting from no individual limit restrictions in 212. Assessment and Future Trends Landings income was slightly higher in 213 ( 56.4 million) compared to 212 ( 55.3 million). Despite a similar TAC available for Poland in the Baltic Sea for 214, lower landings revenues are expected. This is a result of the crisis in the cod fisheries due to a bad health situation for the stock and a new pelagic quota allocation system implemented by Polish fisheries administration. Deteriorating condition of Baltic cod (skinny fish) is negatively influencing the performance of the demersal fleet segments targeting cod (DTS, DFN, HOK and PG112). The poor condition of cod stock phenomena remains unsolved in 214, so following precautionary principle in such a situation, ICES advised for 215 severe TAC cuts (- 53% for Western and - 56% for Eastern Baltic Sea cod stock). Despite of slight increase in cod prices observed in the beginning of 214, CPUE continues to have a downward trend. Pelagic species prices dropped in the first months of 214. Additionally, individual catch limits for sprat and herring in 214 have decreased with 68% and 58% (average), respectively compared to the year before. These two factors may negatively influence the situation in 214 for the segments that are dependent on pelagic species. On the other hand, the ICES TAC advice for 215 herring stocks is rather optimistic (+18% for Central Baltic herring stock and +7% for Western Baltic). 288
291 214 Annual Economic Report on the EU Fishing Fleet A longer trend of the main indicators analysed, including data from the Data Collection Regulation (DCR, 22-27), is provided at the end of this chapter. Data issues Due to confidentiality reasons, deep sea vessels (vessels over 4m fishing outside Baltic Sea) were excluded from the economic analysis. However, transversal data (except for value of landings) and employment data were provided for all fleet segments. Capacity of the distant water fleet increased significantly in 213. The number of distant vessels provided in the report refers to fleet (5 units) that were in use during the whole year. However there were no more than two vessels active in the same time. In order to ensure consistency with data provided for previous years, premiums paid by government for scrapped vessels were taken into account when calculating invested capital (not the PIM method). 289
292 National Chapters Table Polish national fleet structure, activity and production trends by operational scale: Arrows indicate change ( ) 212 to 211: ( ) increase; ( ) decrease and ( ) stable/no change ( between -1 and +1%) Structure Employmen Fishing Effor Output Variable Small scale Fleet % Large scale fleet % Distant water and othermost region fleet No. Vessels (#) % % % Vessel tonnage (thousand GT) % % % Vessel power (thousand kw) % % % Total employed (#) 1,379 1,154 1,121 1,163 1,271 1,313 9% 1,377 1,88 1, ,53 1,24 8% % FTE (#) % ,75 25% % Average wage per employed (thousand ) % % Average wage per FTE (thousand ) % % Days at sea (thousand days) % % % Fishing days (thousand days) % % % Energy consumption (milion litres) % % Energy consumption per landed tonne (l/t) % % Landings weight (thousand tonnes) % % % Landings value (million ) % % % Table Economic performance of the Polish national fishing fleet by operational scale: Development trend based on % net profit margin 212 to average net profit margin Arrows indicate change ( ) 212 to 211: ( ) increase; ( ) decrease and ( ) stable/no change ( between -1 and +1%) Variable (million ) Small scale Fleet Large scale fleet % % Income Costs Economic Indicators Capital value Profitability and development trends Landings income % % Other income % % Labour costs % % Energy costs % % Repair costs % % Other variable costs % % Non-variable costs % % Capital costs % % GVA % % Gross profit % % Net profit % % Depreciated replacement value % % Investments % % Net profit margin (%) % % development trend Deteriorated -54% Improved 68% RoFTA (%) % % development trend Deteriorated -49% Improved 19% GVA per FTE (thousand ) % % development trend Stable 5% Improved 23% 29
293 214 Annual Economic Report on the EU Fishing Fleet Table Main socio-economic performance indicators by fleet segment in the Polish national fishing fleet in 212. Development trend based on % net profit margin 212 to average net profit margin Arrows indicate change ( ) 212 to 211: ( ) increase; ( ) decrease and ( ) stable/no change ( between -1 and +1%) Fleet segment No. of vessels (N) % FTE (N) % Days at sea (days) % Energy consumption (litres) % Value of landings (thousand ) % Weight of landings (thousand tonnes) % GVA (thousand ) % GVA per FTE ( /FTE) % Gross profit (thousand ) % Net profit (thousand ) % Net profit margin (%) % Profitability (212) Net profit margin % 212 average (28-11) Economic development trend POLAREA27DFNVL Weak -161% Deteriorated POLAREA27DTSVL % % % % % % % % % % 28 5% High 17% Improved POLAREA27DTSVL % % % % % % % % % % 28-27% High POLAREA27DTSVL4XX 1 % 37 3% % % POLAREA27PGVL % 323 6% % 95-11% % % % % % % 16-35% High POLAREA27PGVL % 159 1% % % 391 2% % 28-9% % 422-5% % 4-66% Reasonable -74% Deteriorated POLAREA27TMVL % 38 6% % % % % % % % 44-6% 2-67% Reasonable -7% Deteriorated POLOFRTMVL4XX 2-33% 18-33% % % Data source: DCF 214 Fleet Economic (MARE/A3/AC(214)). 291
294 National Chapters GT, kw (thousands) no. vessels, employed (thousand) thousand days Energy consumption (million litres) million / thousand tonnes million Performance indicators (miilion ) % Vessel power Vessel GT No. Vessels Employed Days at sea Fishing days Energy consumption Landings value Landings weight Landings income Landings value (million ) Landings value (million ) Landings weight (tousand tonnes) Atlantic cod European flounder European sprat Atlantic herring European perch Atlantic cod Atlantic herring European flounder European perch European sprat Atlantic cod Atlantic herring European flounder European perch European sprat 7% 6% 5% 4% 3% 2% 1% % -1% Landings income Direct income subsidies Other income Fishing rights income Income GVA Net profit GVA to Revenue Net profit margin 292
295 214 Annual Economic Report on the EU Fishing Fleet 5.18 PORTUGAL Fleet Structure, Fishing Activity and Production In 212, the Portuguese fishing fleet consisted of 8,398 registered vessels, with a combined gross tonnage of 11.3 thousand GT, a total power of thousand kw and an average age of 29 years. Of the 4,323 active vessels, 3,559 were based in mainland Portugal, 668 in the Azores and 96 in Madeira). The size of the Portuguese fishing fleet has decreased 3.5% since 28. Between 211 and 212, the number of vessels decreased 2% while GT and engine power decreased 1% (Table ; Figure ). The major factors causing the fleet to decrease includes the ageing of vessels and vessel owners. Projections for 213 and 214 reveal a further decreasing trend in overall fleet capacity. This is mostly due to increased restrictions for licenced vessels with no registered activity in previous years. In 212, the number of fishing enterprises totalled 4,84, with the vast majority (97%) owning a single vessel and 2.9% of the enterprises owning two to five vessels. Total employment in 212 was estimated at 16,143 jobs, corresponding to 14,931 FTEs. The level of employment decreased 6% between 28 and 212. Table Portuguese national fleet structure, activity and production trends: Arrows indicate change ( ) 212 to 211: ( ) increase; ( ) decrease and ( ) stable/no change ( between -1 and +1%) Variable NATIONAL FLEET % Output Fishing Effort Employment Structure Total No. Vessels (#) 8,77 8,664 8,66 8,557 8,398 8,325-2% 8,237 No. of Inactive vessels (#) 3,431 3,514 3,584 3,675 4,75 4,274 11% 4,247 Average vessel age (year) % 31 Vessel tonnage (thousand GT) % 1 Vessel power (thousand kw) % 367 No. of Enterprises (#) 4,56 4,649 4,618 4,65 4,84 3,857-11% Total employed (#) 17,17 17,514 17,323 16,822 16,143 16,378-4% FTE (#) 17,17 15,633 17,8 16,776 14,931 15,89-11% Average wage per employed (thousand ) % Average wage per FTE (thousand ) % Days at sea (thousand days) % Fishing days (thousand days) % Energy consumption (milion litres) % Energy consumption per landed tonne (l/t) % Landings weight (thousand tonnes) % Landings value (million ) % Data source: DCF 214 Fleet Economic (MARE/A3/AC(214)); data for 213 are provisional. In 212, the Portuguese fleet spent a total of 386 thousand days at sea and consumed around 113 million litres. Effort in days at sea remained quite stable between 211 and 212 while the quantity of fuel consumed increased 11% compared to 211. The total weight landed by the Portuguese fleet in 212 was 21 thousand tonnes of seafood, corresponding to a landed value of 452 million. Over the period analysed, landed weight decreased while value increased. In 212, Atlantic cod generated the highest landed value ( 7 million) by the national fleet, followed by European pilchard (sardine) with 46.6 million, common octopus ( 39 million), Atlantic redfishes ( 26.5 million) and then Atlantic horse mackerel ( 26.6 million). The prices obtained for these key species increased between 28 and 212. Atlantic cod achieved the highest average price per kilo in 212 ( 8.9 per kg), followed by common octopus ( 4 per kg). In terms of landed weight, 35 thousand tonnes of European pilchard were landed in 212, followed by Atlantic horse mackerel (15 thousand tonnes) and common octopus (9 thousand tonnes). 293
); data for 213 are provisional.")


 was insufficient to fully compensate for the reduction in quantity. Madeira registered an increase of landings in 212 (+29.6%), from 4.")

296 National Chapters Figure Portuguese fleet: main trends for the period Data source: DCF 214 Fleet Economic (MARE/A3/AC(214)); data for 213 are provisional. Top left capacity and employment; top right fishing effort and fuel consumption; middle left landings in value and weight; middle right average landed prices of top 5 species in terms of value landed in 212; bottom left landed value of top 5 species in terms of value landed in 212; and bottom right landed weight of top 5 species in terms of value landed in 212. Landings by the Azorean fleet decreased 16.5% in 212, from 16 thousand tonnes in 211 to 13.4 thousand tonnes in 212. The decrease was mainly due to reduced catches of tuna (-24.3%), for which the region is highly dependent, as well as Atlantic horse mackerel (-38.2%). The increase in price (+16.6%, from 2.41 /kg to 2.81 /kg) was insufficient to fully compensate for the reduction in quantity. Madeira registered an increase of landings in 212 (+29.6%), from 4.5 to 5.8 thousand tonnes, exclusively due to increased tuna catches. Prices in Madeira decreased by 9.5% from 2.43 /kg to 2.2 /kg, due to the increase in quantity, following the supply and demand rules. National Fleet Economic performance The total amount of income generated by the Portuguese national fleet in 212 was million. This consisted of million in landings value and 1 million in non-fishing income. The Portuguese fleet s 294
297 214 Annual Economic Report on the EU Fishing Fleet total income remained stable between 211 and 212. Total operating costs incurred by the Portuguese national fleet in 212 equated to 35 million, amounting to 68% of total income. Crew cost and fuel costs, the two major fishing expenses, were 114 and 9 million, respectively (Table ; Figure ). Between 211 and 212, total operating costs remained stable although the cost structure differed from the previous year, with a decrease of crew wages and increase of other costs. In terms of economic performance, the total amount of Gross Value Added (GVA), gross profit and net profit generated by the Portuguese fleet in 212 were 26 million, 117 million and 11 million, respectively. Gross Value Added (GVA) decreased by 12%, gross profit and net profit increased 3% between 211 and 212. The major factors causing the improvement in economic performance are mainly due to the reduction in crew wages, which compensate for the increase of other costs. In 212, the Portuguese fleet had an estimated (depreciated) replacement value of 397 million. Table Portuguese national fishing fleet economic performance in and projections for 213. Development trend based on % net profit margin 212 to average net profit margin Arrows indicate change ( ) 212 to 211: ( ) increase; ( ) decrease and ( ) stable/no change ( between -1 and +1%) Variable (million ) National Fleet % Income Costs Economic Indicators Capital value Profitability and development trends Landings income % Other income % Labour costs % Energy costs % Repair costs % Other variable costs % Other non-variable costs % Capital costs % GVA % Gross profit % Net profit % Depreciated replacement value % Investments % Net profit margin (%) % development trend Deteriorated -59% RoFTA (%) % development trend Deteriorated -7% GVA per FTE (thousand ) % development trend Improved 14% Data source: DCF 214 Fleet Economic (MARE/A3/AC(214)); data for 213 and 214 are provisional. 295

; middle right economic performance indicators; bottom performance indicators as a % of revenue (landings income + other")

 (Figure 5.18.")
 and landings in weight (thousand tonnes); Value shows days-at-sea (thousand days) and")
) The national fleet consisted of 5 (DCF) fleet segments in 212, with 6 inactive")
298 National Chapters Data source: DCF 214 Fleet Economic (MARE/A3/AC(214)); data for 213 are provisional. Figure Portuguese fleet main economic performance trends for the period Top left income structure; top right cost structure; middle left cost items as a percentage of income (fishing income and other income); middle right economic performance indicators; bottom performance indicators as a % of revenue (landings income + other income) (projections figures for 213). Fleet Segment Level Economic performance The Portuguese fleet is highly diversified with a broad range of vessel types targeting different species predominantly in the Portuguese Exclusive Economic Zone (27.9.a for the mainland fleet, 27.1 for the Azores s fleet and CECAF for the Madeira s fleet) (Figure ). Figure PRT effort (days-at-sea and fishing days) and landings (weight and value) by FAO fishing area, 212. Colour shows fishing days (thousand days) and landings in weight (thousand tonnes); Value shows days-at-sea (thousand days) and landings in value (thousand ). Source: DCF 214 Fleet Economic (MARE/A3/AC(214)) The national fleet consisted of 5 (DCF) fleet segments in 212, with 6 inactive length classes consisting of 4,75 vessels. Despite some fleet segments making losses in 212, in general there was an increase in profits. Table and Table provide a breakdown of key performance indicators by main type of fishing activity (small, large and distant-water fleet). Table provides a breakdown of key performance 296
299 214 Annual Economic Report on the EU Fishing Fleet indicators for all 5 fleet segments in 212. A short description of the 4 most important segments in terms of total value of landings is provided below. Demersal trawl and seine over 4m 13 vessels made up this segment which operates predominantly in Area 27 (NAFO, Norway, Banana hole and Irminger). The fleet targets a variety of species but in particular Atlantic Cod, Atlantic redfish and Greenland halibut. In 212, the total value of landings was around 19 million and around 465 FTEs were employed in this fleet segment, contributing to 24% and 3% of the total income from landings and FTEs generated by the Portuguese fishing fleet respectively. This fleet segment was highly profitable, with a reported gross profit of around 54.1 million and net profit of 38 million in 212. While the fleet structure remained stable, the improvement in 212 compared to 211 was mainly due to a higher market value and the improvement of the prices for these species. The cost structure and level of employment remained stable. Demersal trawl and seine 24-4m 63 vessels made up this segment in 212, which operates predominantly in Area 27 (27.9.a and 27.8.c). The fleet targets a variety of species but in particular deep water rose shrimp, Atlantic horse mackerel and Atlantic mackerel. In 212, the total value of landings was almost 44 million and around 632 FTEs were employed in this fleet segment, contributing to 1% and 3.4% of the total income from landings and FTEs generated by the Portuguese fishing fleet, respectively. In 212, this fleet segment reported a gross profit of around 19 thousand and net loss of - 13 million. Crew costs decreased in 212 while energy costs increased. Hooks 24-4m (OFR) 24 vessels made up this segment, which operates predominantly off the African Coast and in the Indian Ocean (FAO areas 34, 41, 51 and 57). The fleet targets a variety of species but in particular large pelagic fishes such as blue shark, bigeye tuna and swordfish. In 212, the total value of landings reached almost 19 million and around 345 FTEs were employed in this fleet segment, contributing 4% and 2% of the total income from landings and FTEs generated by the Portuguese fishing fleet, respectively. This fleet segment had a reported gross profit of around 7.4 million and net profit of -.5 million in 212. The economic performance decreased when compared to 211, which was expected due to some restrictions regarding deep species and shark catches. Purse seine 18-24m 52 vessels made up this segment in 212, which operates predominantly in Area 27 (27.9.a and 27.8.c). The fleet targets a variety of species but in particular small pelagic fishes, such as Atlantic pilchard, chub mackerel and Atlantic horse mackerel. In 212, the total value of landings was almost 41 million and the fleet segment employed around 1,21 FTEs, contributing 9% and 6% of the total income from landings and FTEs, respectively. This fleet segment was profitable in 212, with a reported gross profit of around 16.4 million and net profit of 11.5 million. The average price per kg continued its upward trend in 212, contributing to the good performance of the segment. Assessment and Future Trends An overall decreasing trend in capacity of the national fleet is observed, not only in terms of engine power and GT but also in the number of active vessels, which is most likely to continue for the next few years. This decrease is mainly attributed to the scrapping of older vessels in the fleet. The price per kilo of landings shows an increasing trend related to the decrease in the total weight of landings. The implementation of measures at national level, restricting European pilchard catches, resulted in a 4% decrease in landed weight, from around 57 thousand tonnes in 21 to 27 thousand tonnes in 213. The small-scale fleet will further decrease in number of vessels due to more rigorous criteria for licensing, namely for vessels with low levels of activity (e.g. from retired fishermen). The distant-water fleet is expected to remain highly profitable in the next few years mainly because of the increased stocks of codfish in 213. In 211, European pilchard represented 28.3% of the total landings, decreasing to 16.6% of total landings in 212. The purse seine fishery, which catches more than 99% of pilchard in Portugal, received a MSC (Marine Stewardship Council) certification in 21, as a sustainable and well managed fishery. With the decline in stock biomass following an ICES evaluation, this certification was suspended in 212. It was therefore decided that a specific management plan should be put in place in 212, to ensure a fast and sustainable stock recovery. The plan has a life span of 4 years (212 to 215) and sets all the conditions for this fishery, 297
300 National Chapters including very restrictive harvest rules and catch limits and aiming to: (1) ensure the sustainability of the resources; (2) minimise the impact of fishery activities on the ecosystem; (3) operate at maximum sustainable yield; (4) improve the economic viability and social conditions of the sector and (5) ensure the proper levels of cooperative governance. This plan further set the specific goal of contributing to the avoidance of a further decline of the Iberian sardine stock by reducing fishing effort and to recover, with high probability, levels of stock biomass by 215. The implementation of the plan resulted in decreased catches of this specie and enabled recovery of the certification in 213. In 25, a plan was implemented with the goal of recovering stocks of the southern hake in the Western Iberian Peninsula (Areas 8.c and 9.a). Following European Regulation (EC) Nº 2166/25, the Portuguese authorities implemented an effort management plan by limiting the number of days of activity for vessels with more than 5 tonnes of hake. This plan anticipated a 1% annual reduction in effort, calculated between the number of vessels in the plan and the number of days for each vessel. In 212 every vessel under the plan was allowed 155 days of activity; this number was further reduced to 14 days in 213. Effort related to this plan reduced from 9 million kwdays in 27 to 6.4 million kwdays in 212 and a projected 5.7 million kwdays in 213. The main fleet segments targeting hake are trawlers with vessel length 24-4m, responsible for 32% of total catches, followed by Drift or Fixed Nets with vessel lengths between 18-24m, responsible for 3% of total catches and with vessel length between 12-18m, responsible for 16% of total catches. Most effort is applied by the trawlers, although hake catches represent only 3.7% of these vessels total catches, showing that they are not targeting hake. The fleet segment most dependent on hake is DFN, with vessel length 18-24m, with hake representing 27% of total catches. Catches of hake within the DFN with vessel length 12-18m represents 1% of total catches. The value of the species has the same order of magnitude of quantities, when compared with total value of landings. It should be noted that the quota consumption for hake was 2.6 thousand tonnes, representing 65% of the quota for the stock attributed to Portugal. In 213, catches reached 3.2 thousand tonnes, an increase from 212 but still only representing 69% of the national quota of 4, tonnes. The quota for 214 increased to 5,32.46 tonnes, although effort is expected to further decrease, as the number of fishing days allowed for each vessel under the plan was reduced to 126. Data issues Capacity, logbook and landings data are derived from sources that are covered by different legislations. All these data are available exhaustively. The only exception is the group of vessels under 1m without logbook obligations. For these vessels effort is estimated considering that one auction day is equal to one fishing day. The remaining variables (cost, employment, fuel consumption) are estimated based on results from questionnaire surveys. All segments of the Portuguese fleet have been sampled. As segments are not necessarily homogeneous, the results can be quite variable which is reflected in the high coefficients of variation. Results for the small-scale fleet present a lower response rate and higher variability due to the polyvalent characteristics of the fleet and the difficulties of the fishermen in completing the questionnaires. As many do not have organised accountancy procedures, they tend to rely on memory in order to answer the questions, raising costs and introducing bias into the economic performance estimates. The value of landings are estimated for processed products and landings in foreign ports while total income from landings is estimated based on survey with questionnaires. For that reason, total value of landings by species may differ from total income from landings. 298
301 214 Annual Economic Report on the EU Fishing Fleet Table Portuguese national fleet structure, activity and production trends by operational scale: Arrows indicate change ( ) 212 to 211: ( ) increase; ( ) decrease and ( ) stable/no change ( between -1 and +1%) Structure Employment Fishing Effort Output Variable Small scale Fleet % Large scale fleet % Distant water and othermost region fleet No. Vessels (#) 4,347 4,212 4,126 4,1 3,447 3,187-14% % % Average vessel age (year) % % % Vessel tonnage (thousand GT) % % % Vessel power (thousand kw) % % % Total employed (#) 8,956 9,678 9,462 9,265 8,26 7,365-13% 7,927 7,55 7,51 7,223 7,663 7,379 6% FTE (#) 8,956 7,964 9,283 9,232 7,288-21% 7,927 7,357 7,437 7,29 7,185 % % Average wage per employed (thousand ) % % % Average wage per FTE (thousand ) % % % Days at sea (thousand days) % % % Fishing days (thousand days) % % % Energy consumption (milion litres) % % % Energy consumption per landed tonne (l/t) % % 1,193 1,4 1, % Landings weight (thousand tonnes) % % % Landings value (million ) % % % %
302 Table Economic performance of the Portuguese national fishing fleet by operational scale: Development trend based on % net profit margin 212 to average net profit margin Arrows indicate change ( ) 212 to 211: ( ) increase; ( ) decrease and ( ) stable/no change ( between -1 and +1%) National Chapters Variable (million ) Small scale Fleet % Large scale fleet Distant water & othermost region % % Income Costs Economic Indicators Capital value Profitability and development trends Landings income % % % Other income % % % Labour costs % % % Energy costs % % % Repair costs % % % Other variable costs % % % Non-variable costs % % % Capital costs % % % GVA % % % Gross profit % % % Net profit % % % Depreciated replacement value % % % Investments % % % Net profit margin (%) % % % development trend Deteriorated -212% Deteriorated -13% Stable -2% RoFTA (%) % % % development trend Deteriorated -172% Deteriorated -5% Deteriorated -52% GVA per FTE (thousand ) % % % development trend Deteriorated -24% Improved 14% Stable -5% 3
303 214 Annual Economic Report on the EU Fishing Fleet Table Main socio-economic performance indicators by fleet segment in the Portuguese national fishing fleet in 212. Development trend based on % net profit margin 212 to average net profit margin Arrows indicate change ( ) 212 to 211: ( ) increase; ( ) decrease and ( ) stable/no change ( between -1 and +1%) Fleet segment No. of vessels (N) % FTE (N) % Days at sea (days) % Energy consumption (litres) % Value of landings (thousand ) % Weight of landings (thousand tonnes) % GVA (thousand ) % GVA per FTE ( /FTE) % Gross profit (thousand ) % Net profit (thousand ) % Net profit margin (%) % Profitability (212) Net profit margin % average (28-11) Economic development trend PRTAREA27DFNVL1 41-2% % % 47 14% % 658 % % % % % -3 84% Weak -148% Deteriorated PRTAREA27DFNVL % % % % 287 2% % % % % % % Weak -162% Deteriorated PRTAREA27DFNVL % 62 37% % % % 442 3% % 14. 2% % % % Weak -415% Deteriorated PRTAREA27DFNVL % 312-1% % % % % % % % % 8 121% Reasonable PRTAREA27DRBVL % 12 17% % 297-3% 84 54% % % % % % % Weak -18% Deteriorated PRTAREA27DRBVL % 58 23% % % % % % % -7 81% % -52 4% Weak -13% Deteriorated PRTAREA27DRBVL % 48 3% % % % 548-1% 995 3% % % % 9 122% Reasonable 11% Improved PRTAREA27DTSVL1 75 % 156-7% % % % % % 8.6 7% 86-76% % -15-2% Weak -263% Deteriorated PRTAREA27DTSVL112 1 % 27 8% % % 74-2% 25 11% 57 4% % % 44-76% 6-77% Reasonable 16% Improved PRTAREA27DTSVL % 63 % % % % % % % % % % High 287% Improved PRTAREA27DTSVL % 53-9% % 2139 % % % % % 796-1% % -1-84% Weak -116% Deteriorated PRTAREA27DTSVL % 565-5% % % % % % % % % % Weak -357% Deteriorated PRTAREA27DTSVL4XX 13 % 43-4% 285-3% % % % % % % % 35 56% High 8169% Improved PRTAREA27FPOVL Reasonable PRTAREA27FPOVL % % % 447 9% 43-3% % % % % % 26-31% High -12% Deteriorated PRTAREA27FPOVL % % % % % % % % % % -6 64% Weak PRTAREA27FPOVL Weak PRTAREA27HOKVL % % % % % % % 1.2 % 95-49% % 22-56% High -31% Deteriorated PRTAREA27HOKVL % 54-17% % 262 4% 1232 % % 47-2% 8.7-4% 115 2% % -2-13% Weak -2122% Deteriorated PRTAREA27HOKVL % 25 38% % % 6861 % % % % % % 25-2% High 3% Improved PRTAREA27HOKVL % 281-5% % % % 447-8% % % 18-73% % % Weak -235% Deteriorated PRTAREA27HOKVL % % % % % % % % % % % Weak PRTAREA27PGPVL % % % % % % % 7.9 6% 73-39% % 3-83% Reasonable 31
304 National Chapters Fleet segment No. of vessels (N) % FTE (N) % Days at sea (days) % Energy consumption (litres) % Value of landings (thousand ) % PRTAREA27PGPVL % 32-63% 12-52% 79-87% % % % % % 89-66% 1 46% High PRTAREA27PGPVL High Weight of landings (thousand tonnes) % GVA (thousand ) % GVA per FTE ( /FTE) % Gross profit (thousand ) % Net profit (thousand ) % Net profit margin (%) % Profitability (212) Net profit margin % average (28-11) Economic development trend PRTAREA27PMPVL Weak -4616% Deteriorated PRTAREA27PMPVL % 639-2% % 183-9% % % % % % % % Weak -451% Deteriorated PRTAREA27PMPVL % 58 26% % % 713 8% % % % % % % Weak -5114% Deteriorated PRTAREA27PMPVL % 38 2% % % % % % % % % % Weak PRTAREA27PSVL1 65 8% % % 234-5% % % % 1.6 4% % 884-8% 25-25% High 531% Improved PRTAREA27PSVL % % % 68 % % 536 4% % % 77-1% % -112% Weak -11% Deteriorated PRTAREA27PSVL % % 5237 % % % % 743 1% % % % 3 78% High 227% Improved PRTAREA27PSVL % 944-4% % % 4627 % % % % % % 16 2% High PRTAREA27PSVL244 2 % 416 4% % % % % % % 55-99% % % Weak PRTOFRDTSVL244 6 % 81 16% 113 1% % % % % % % % % Weak PRTOFRFPOVL Weak PRTOFRHOKVL Weak PRTOFRHOKVL High PRTOFRHOKVL % 25-13% % % 596-1% % % % % % 14-4% High 2% Stable PRTOFRHOKVL % 42-58% % % % 45-5% % % % 76 13% 4 311% High 341% Improved PRTOFRHOKVL % 296 7% % % % % % % 738-1% % -3-13% Weak PRTOFRHOKVL4XX 5 % 8-9% % % % % % % % % 38 52% High PRTOFRMGPVL1 8-33% 39-37% % 36-49% % 17-12% % % 28-71% 4 97% 1 473% Reasonable -54% Deteriorated PRTOFRMGPVL % 45-2% 73 35% % 729 3% % 424-2% % % % % Weak Data source: DCF 214 Fleet Economic (MARE/A3/AC(214)). 32
305 214 Annual Economic Report on the EU Fishing Fleet GT, kw (thousands) no. vessels, employed (thousand) thousand days Energy consumption (million litres) million / thousand tonnes million Performance indicators (miilion ) % Vessel power Vessel GT No. Vessels Employed Days at sea Fishing days Energy consumption Landings value Landings weight Landings income Landings value (million ) Atlantic cod Atlantic redfishes European pilchard Atlantic horse mackerel Common octopus Landings value (million ) Atlantic cod Atlantic redfishes European pilchard Atlantic horse mackerel Common octopus Landings weight (tousand tonnes) % 4% 2% % -2% Atlantic cod Atlantic redfishes European pilchard Atlantic horse mackerel Common octopus Landings income Direct income subsidies Other income Fishing rights income Income GVA Net profit GVA to Revenue Net profit margin 33
306 National Chapters 5.19 ROMANIA Fleet Structure, Fishing Activity and Production In 212, the Romanian fishing fleet consisted of 261 registered vessels, with a combined gross tonnage of one thousand GT, a total power of 5.9 thousand kw and an average age of 12 years. The size of the Romania fishing fleet decreased between 28 and 212, with the number of vessels falling by 18, by 1.6 thousand GT and 2.9 thousand kw, 68% and 33% respectively (Table ; Figure ). The major factors causing the fleet decrease over the time period included the restructuring plan for the fleet, less investment in the industry (financial difficulties encountered in this period did not make the sector attractive to investors) and the lack of fishing infrastructure (no specialised ports on the Romanian coast - landing sites and first sale centres need modernizing). No subsidies or any other kind of support were granted by the authorities to possible investors or fishermen, which used partly the availabilities of the EFF for fleet restructuring. In 212, the number of fishing enterprises in the Romanian fleet totalled 91, with the vast majority (79%), owning a single vessel. Only 18% of enterprises owned two to five fishing vessels. Total employment in 212 was estimated at 471 jobs, corresponding to 39 FTEs (note, these values are explained by the accentuated seasonality and the low qualification of fishermen). The level of employment decreased between 28 and 212, with total employed decreasing by 48% and the number of FTEs decreasing by around 1% over the period. The major factors causing employment to decrease include a reduction of number of active vessels, a lot of fishermen acting occasionally on their own because of the economic crisis and, as a consequence, the decrease of the funds available for investments and business development. The restrictive exploitation of species such as turbot (under the quota system introduced by the EC) and the fact that young fishermen have not joined the sector were also reasons for the lower jobs number. This trend also continued into 213. Table Romanian national fleet structure, activity and production trends: Arrows indicate change ( ) 212 to 211: ( ) increase; ( ) decrease and ( ) stable/no change ( between -1 and +1%) Variable NATIONAL FLEET % Output Fishing Effort Employment Structure Total No. Vessels (#) % 19 No. of Inactive vessels (#) % 6 Average vessel age (year) % 15 Vessel tonnage (thousand GT) % 1 Vessel power (thousand kw) % 6 No. of Enterprises (#) % Total employed (#) % FTE (#) % Average wage per employed (thousand ) % Average wage per FTE (thousand ) % Days at sea (thousand days) % Fishing days (thousand days) % Energy consumption (milion litres) % Energy consumption per landed tonne (l/t) % Landings weight (thousand tonnes) % Landings value (million ) % Recreactional catches of selected species (T % Data source: DCF 214 Fleet Economic (MARE/A3/AC(214)); data for 213 and 214 are provisional. The Romania fleet spent a total of around 3.4 thousand days at sea in 212. The total number of days at sea decreased by around 6% between 28 and 212, similar with the fishing days evolution. The major factors causing the decrease in days at sea include the reduction of the active vessel numbers as a result of the measures for fleet restructuring; this decrease corresponds to the continuing reduction of the number of fishermen from 875 in 28 to 471 in 212. In the last two years activity was focused to fishing Thomas rapa 34
307 214 Annual Economic Report on the EU Fishing Fleet whelk due to an increase in demand in the market, especially in the tourist season, and fishermen trying to reduce the effect of the quota system for turbot introduced in 29. The quantity of fuel consumed in 212 totalled around.2 million litres, a decrease of around 35% from 211. The fuel consumption is mainly explained by the lack of investment in new equipment, despite the reducing number of days at sea and the number of active boats, but also in the improvement of the data collection process from year to year. GT, kw (thousands) million / thousand tonnes Landings value (million ) Vessel tonnage Vessel power No. Vessels FTE Total employed Figure Romanian fleet: main trends Landings value Landings weight Landings income European sprat Pontic shad Med. horse mackerel Thomas' rapa whelk no. vessels, employment thousand days Average price ( /kg) Landings weight (thousand tonnes) Data source: DCF 214 Fleet Economic (MARE/A3/AC(214)); data for 213 are provisional. Top left capacity and employment; top right fishing effort and fuel consumption; middle left landings in value and weight; middle right average landed prices of top 5 species in terms of value landed in 212; bottom left landed value of top 5 species in terms of value landed in 212; and bottom right landed weight of top 5 species in terms of value landed in Days at sea Fishing days Energy consumption European sprat Pontic shad Turbot 5 thousand litres Med. horse mackerel Thomas' rapa whelk European sprat Med. horse mackerel Pontic shad Thomas' rapa whelk Turbot The total weight landed by the Romanian fleet in 212 was less than 8 tonnes of seafood, with a landed value of.9 million. The total weight and value of landings increased overall during the period 28 to 212 but weight declined in 29 and 21, only to recover in 211. In 212, Thomas rapa whelk generated the highest landed value by the national fleet around 529 thousand, followed by turbot around 24 thousand, European sprat around 55 thousand and other species like European anchovy, Mediterranean horse mackerel and other ones. In terms of landings weight, in 212 Thomas rapa whelk was 588 tonnes, turbot 43 tonnes, European sprat 87 tonnes, the main important species landed. The major factors causing the 35
308 National Chapters fluctuations in the weight and value of landings between 211 and 212 include the instability inside the sector, a lack of organisational measures in terms of producer organisations-associations, and the instability of the internal market. For turbot, the quota system discouraged trade. The fishermen were looking to other species to increase income in the tourist season, as is illustrated in 211 by the WEIG and value for Thomas rapa whelk landed; 212 data does not illustrate the same trend due to the fact that the market price decreased for this species and, mainly because in 211 fishermen realized a kind of processing the product separating the meat from the shelves, and selling it as fresh fish product for a good price. Due to the increase on demand foreign market (especially Bulgaria who counted for a bigger number of tourists) the sales coming back for the whole exemplar (meat in shelve for safety during transportation) and decreasing the price. The prices obtained for the 5 key species (Thomas rapa whelk, turbot, pontic shad, European sprat and European anchovy) remained relatively stable between 28 and 212. Thomas rapa whelk, is an exception achieving its highest average price per kilo in 211 ( 4.1 per kg) due to unusual demand on the market in the tourist season, followed the next year with a calmer market, reflected also in the decreasing quantity landed. And, as mentioned, due to the switching type of sales from the whole individual for foreign market, instead of continuing to process (even in a preliminary stage, for restaurants buying), the price decline. Turbot achieved an average price per kilo among all the finfish landed in 212 of 4.74 per kg - it decreased as importance because of TACs limits, followed by pontic shad ( 2.32 per kg). Thomas Rapa Whelk sold for an average price of.9 per kg. The major factors causing changes in the price of individual species include the expected inverse relationship between price and availability of supplies. Another explanation is that the specialized vessels over 18m capturing sprat in 28 were mostly inactive from 29 onwards; this fleet segment only contained one or two vessels active during the time period, including 212, and the trend for 213 being similar. The economic evolution of the Romania fleet is strictly related to the changes in the structure of the fleet segments during and the seasonality of small pelagics. This change resulted in the current structure of the Romanian fleet which is characterised as being an ageing small scale fleet, with a low level of technical capacity. The trend is similar for 213. National Fleet Economic performance The amount of income generated by the Romanian national fleet from landings in 212 was 937 thousand. No information is available on non-fishing income, due to the unreported data by the fishermen. In 212 the decreasing prices for Thomas Rapa Whelk strongly affected the total income, as mentioned above. The Romanian fleet s total income decreased by 34% between 211 and 212. The conclusion is the market is no stabilised and is illustrating the more realistic the actual status of the fishery including the market one. Total operating costs incurred by the Romanian national fleet in 212 equated to.87 million, amounting to 92% of total income.94 million. Crew cost and fuel costs, the two major fishing expenses, were.32 and.17 million respectively, see Table ; Figure Between 28 and 212, total operating costs increased 16%, largely due to the increase in fuel costs, and labour costs 46%. The Romanian small scale fleet represents the principal part of the national fleet. The total amount of income generated by the small scale fleet from landings in 212 was.837 million, decreased versus 211, due to the weak price on the Thomas rapa welk species as explained above. Total operating costs incurred by the small scale fleet in 212 equated to.743 million, amounting to approximately 88% of its income. Crew cost and fuel costs, the two major fishing expenses, were.32 and.12 million respectively, see In terms of economic performance, the total amount of Gross Value Added (GVA), gross profit and net profit generated by the Romania national fleet in 212 were.58 million,.26 million and.8 million respectively. Gross Value Added (GVA) and gross profit decreased 33%, and 35% respectively between 211 and 212. The major factors causing the decreasing in economic performance corresponds to a decrease in the value of landings and a decreased number of fishermen, compounded by of the prices evolution on the market during the period. It should be noted that the fishing sector and the volume and value of landings generated are relatively modest compared to other EU member states, with more than 85% of production attributed to the small scale fishery. 36
309 214 Annual Economic Report on the EU Fishing Fleet Table Between 211 and 212, total operating costs decreased by 3%, largely despite the increasing labour costs and decrease of other variable costs, which amounted to almost 15% of total income in 212. The small scale fleet shows the same shift from labour intensive to capital intensive production and increasing of wages between 21 and 212. In terms of economic performance, the total amount of Gross Value Added (GVA), gross profit and net profit generated by the Romania national fleet in 212 were.58 million,.26 million and.8 million respectively. Gross Value Added (GVA) and gross profit decreased 33%, and 35% respectively between 211 and 212. The major factors causing the decreasing in economic performance corresponds to a decrease in the value of landings and a decreased number of fishermen, compounded by of the prices evolution on the market during the period. It should be noted that the fishing sector and the volume and value of landings generated are relatively modest compared to other EU member states, with more than 85% of production attributed to the small scale fishery. Table Romanian national fishing fleet economic performance in and projections for 213. Development trend based on % net profit margin 212 to average net profit margin Arrows indicate change ( ) 212 to 211: ( ) increase; ( ) decrease and ( ) stable/no change ( between -1 and +1%) Variable (million ) National Fleet % Income Costs Economic Indicators Capital value Profitability and development trends Landings income % Other income Labour costs % Energy costs % Repair costs % Other variable costs % Other non-variable costs.1.1 Capital costs % GVA % Gross profit % Net profit % Depreciated replacement value % Investments % Net profit margin (%) % development trend Improved 565% RoFTA (%) % development trend Improved 14% GVA per FTE (thousand ) % development trend Deteriorated -6% Data source: DCF 214 Fleet Economic (MARE/A3/AC(214)); data for 213 are provisional. In 212, the Romanian fleet had an estimated depreciated replacement value of 3.45 million but it has not been possible to make an estimate of the value of fishing rights because there no such rights or a system related to that; the management of the fishing resources is based on a TAC/quota system. Investments in the fleet amounted only to.12 million in 212. The major factors causing this stable situation at a lower level in the capital value of the fleet include several factors: the smaller dimension of the fleet (decreased number of active vessels, number of fishermen), less concentration of the capital (there still exist a large number of companies owning one small boat less than 12m), a high dependency to the internal market, the absence of the fishing infrastructure and government subsidies system, the lack of an integrated supply chain (including an organised selling system no fishery auction). The small companies did not develop alternative activities, resulting in no other income recorded. The sector is not so attractive for investment due to the reasons mentioned and to the constraints imposed by operating only in the Black Sea exploiting weather conditions affecting the small scale fishery the main segment of the Romanian fleet, one of the smallest in the EU. 37
310 National Chapters million Performance indicators (million ) Landings income Other income Revenue GVA Gross profit Net profit million % Crew wage costs Unpaid labour Energy costs Repair costs Other variable costs Other non-variable costs Annual depreciation GVA to Revenue Gross profit margin Net Profit margin RoFTA Figure Romanian fleet main economic performance trends Data source: DCF 214 Fleet Economic (MARE/A3/AC(214)); data for 213 are provisional. Top left income structure; top right cost structure; bottom left economic performance indicators; bottom right performance indicators as a % of revenue (landings income + other income) (projected figures for 213). Fleet Segment Level Economic performance The Romanian fleet is not diversified with a small range of vessel types targeting different species only in the Black Sea. The national fleet consisted of 4 main (DCF) fleet segments in 212, with 288 inactive vessels. The all 4 active fleet segments made a slight profit in 212. In the analysis, the 4 main segments of vessels less 12 m, using fixed gears (mostly traps) and polyvalent mobile and passive gears will be considered. Table provides a breakdown of key performance indicators for all 4 fleet segments in 212. A short description of the small scale fishery segments the most important segments of the fleet in terms of total value of landings is provided below. The main length class, which comprises vessels between -12m, makes up the largest segment. It operates only in the Romanian waters of the Black Sea, as does all the national fleet. The fleet targets a variety of species sometimes using several gears on the same trip. The fleet particularly targets small pelagic species, such as European anchovy, European sprat, other small pelagic species as well as picked dogfish and Thomas rapa whelk. It should be mentioned that turbot is a target species, but the quantity available is subject to EC TAC limits; this species is fished by fixed gears, using small boats. The main characteristic of the segment for all boats used, is that during the fishing season the fishermen switch from one fishing technique to another, using the same boats and targeting the mentioned species. It is not a specialized fishery, but a mixed one. The fishery includes also the artisanal fishery. This is due to the fact that investment is lacking in the sector for improvement of the quality of activity. The biggest change is observed in the increasing of the number of engines/motors used, compared with 28. In 212, the total value of landings was almost.94 million and around only FTEs was employed in this fleet segment, contributing more than 9% of the total income from landings and 93% of the FTEs generated by the Romanian fishing fleet, respectively. This fleet segment continued to be the most important in the Romanian fleet, with a reported gross profit of around.26 million and net profit of.8 million in 212, weak results. 38
311 214 Annual Economic Report on the EU Fishing Fleet The fishing activity is traditional for the fishermen s communities. These communities comprise a small number of fishermen. The decreasing number is due to the fact that the young people are not attracted by this activity. The investment lacking in the sector causes a poor level of productivity, small quantities of catches, and a low level of technical working conditions. The infrastructure for stabilisation of the activity is missing: there are no fishing ports (specialised on discharging, receiving, storing, selling, etc.). The fishing activity is largely dependent on the weather conditions in the Black Sea having very large differences of temperature between winter and summer and strong winds. The switches in fishing technique produce high instability in activity and in the process of data collection. Enterprises do not using an accounting system and they are not able to allocate costs to each kind of technique and to each gear type used. The data are delivered in bulk as a whole for the entire activity during the year, for they own small boats. As a conclusion it should be mentioned that the fishery in Romania is not specialised, as techniques and gears used; it is a mixed small scale fishery on which the segments/techniques/gear types are not the main consideration of fishermen, catching mainly small pelagic species. The quota system for better exploitation of existing stocks, in terms of stability, has to be improved by the member state. As it was also mentioned in several reports of the previous years, no income (such as: fishing rights, direct subsidies, and other income no additional activities) other than landings income were reported/recorded by member state. The large percentage of inactive vessels, related to the diminishing number of fishermen, is a reason of the poor activity and low results of the Romanian fishing fleet. Assessment and Future Trends The national fishing fleet of Romania is almost entirely represented by the small scale fishery. The large number of fishing companies owning a single vessel represents 97% of the total number of companies. It consisted in 197 vessels from a total of 261 vessels in 212. The small scale fleet has mainly similar levels with a marked improvement of the value landed due to the demand on the internal market. This situation with poor concentration of ownership is the main explanation of the low level of investments in the sector, resulting in insufficient means for the improvement of technical conditions of the boats used. The trend of the decreasing number of fishermen and number of vessels was present in 212 compared with 211, figures indicating the same trend for 212/213. This corresponds to a reduction of number of days at sea and days fishing. These trends reflect the fluctuating character of activity year to year and season to season. Should be remarked the fact that no other activities are reported/recorded fishery being total separated by other activities. The difficult access of fishermen to the finance, including loans, is reflected in the character of the sector s general and technical efficiency. The instability is underlined by the variability: in 211 demand for Thomas rapa whelk on the market resulted in the highest value of landings, and also an increase in the total annual volume reported during the period. But in 212 it was recorded a decreasing trend as above mentioned and explained. The small scale fishery is represented by those vessels less than 12m overall length using, in the same season, polyvalent gears and polyvalent mobile and passive gears, the same boats shifting from one gear to another in the same period of time. The reported data are supplied by fishermen more or less in strict correspondence with the effective fishing activity, because the same fishermen are using simultaneously those kinds of gear during the season, and even for themselves are not recording in an accurate way all the expenses/selling value, etc. of the species captured for each type of gear or technique used. This fishery is characterized by a very high mixture of techniques due to the lack of a target species for catching and sale on the market. The trends for 212 show the same evolution, an unchanged situation on the fleet structure for 212 and 213, with the same decreasing trend, especially in the number of active vessels and fishermen. An increasing number of fishing days/days at sea could be expected and as a consequence an increase of landings. The profitability is expected to be weak in 213 versus 212 due to the same level of total costs and a decrease in the value of landings. Considering the market perspective, 212 was not so good in price terms as 211 for Thomas rapa whelk, which generated an increase in the value of landings, the greatest of the period For the other main species, the price changes are representatively decreasing, having a negative consequence in value level trend in 213. The main explanation is the dependency of the fishery on the internal market and of a weakness in the selling system, due to the atomisation of the fishermen, in principal, 39
312 National Chapters acting on their own, and a lack concentration of the sector; the existing fishermen s organizations do not participate in marketing the catch. Data issues, quality and coverage The collection of data process, as explained above should be improved by the member state. Fishermen are delivering aggregated data for their activity; the member state is encouraged to apply survey estimates, in order to have the relevant data for all indicators for every fleet segment and gear type, improving the quality of data usable for various types of analyses. Acting in such a way, the data will be better used, especially for assessment of the evaluation indictors on profitability of the fleet, for the economic and social indicators analyses. Also, data will be used in the next planning activity by the EC for the future multiannual management plans in the Black Sea waters. This comprises measures that should be applied for demersal and pelagic targeted species for sustainable fishing activity. Table Romanian national fleet structure, activity and production trends by operational scale: Arrows indicate change ( ) 212 to 211: ( ) increase; ( ) decrease and ( ) stable/no change ( between -1 and +1%) Structure Employment Fishing Effort Output Variable Small scale Fleet % Large scale fleet No. Vessels (#) % % Average vessel age (year) % % Vessel tonnage (thousand GT) % % Vessel power (thousand kw) % % Total employed (#) % % FTE (#) % % Average wage per employed (thousand ) % % Average wage per FTE (thousand ) % % Days at sea (thousand days) % % Fishing days (thousand days) % % Energy consumption (milion litres) % % Energy consumption per landed tonne (l/t) % % Landings weight (thousand tonnes) % % Landings value (million ) % % %
313 214 Annual Economic Report on the EU Fishing Fleet Table Economic performance of the Romanian national fishing fleet by operational scale: Development trend based on % net profit margin 212 to average net profit margin Arrows indicate change ( ) 212 to 211: ( ) increase; ( ) decrease and ( ) stable/no change ( between -1 and +1%) Variable (million ) Small scale Fleet % Large scale fleet % Income Costs Economic Indicators Capital value Profitability and development trends Landings income % % Other income Labour costs % % Energy costs % % Repair costs % % Other variable costs % % Non-variable costs.1.1 Capital costs % % GVA % % Gross profit % % Net profit % % Depreciated replacement value % % Investments % Net profit margin (%) % % development trend Improved 142% Deteriorated -121% RoFTA (%) % % development trend Improved 5% Deteriorated -565% GVA per FTE (thousand ) % % development trend Stable 2% Deteriorated -39% 311
314 Table Main socio-economic performance indicators by fleet segment in the Romanian national fishing fleet in 212. Development trend based on % net profit margin 212 to average net profit margin Arrows indicate change ( ) 212 to 211: ( ) increase; ( ) decrease and ( ) stable/no change ( between -1 and +1%) National Chapters Fleet segment No. of vessels (N) % FTE (N) % Days at sea (days) % Energy consumption (litres) % Value of landings (thousand ) % Weight of landings (thousand tonnes) ROUAREA37PGOVL Weak % GVA (thousand ) % GVA per FTE ( /FTE) % Gross profit (thousand ) % Net profit (thousand ) % Net profit margin (%) % Profitability (212) Net profit margin % average (28-11) Economic development trend ROUAREA37PGVL % 4 83% % 2-8% 62 7% 45 41% 42 49% % 11 42% 1-27% 1-43% Reasonable -94% Deteriorated ROUAREA37PGVL % 31 3% % 11-41% % 687 8% % % % % 2-9% High 187% Improved ROUAREA37PMPVL % 3 6% 76 4% 22-54% 5-53% 67-46% 22-53% % 6-48% % % Weak Data source: DCF 214 Fleet Economic (MARE/A3/AC(214)) 312
315 214 Annual Economic Report on the EU Fishing Fleet 5.2 SLOVENIA Fleet Structure, Fishing Activity and Production In 213, the Slovenian fishing fleet consisted of 171 registered vessels, with a combined gross tonnage of 599 GT, a total power of 8.5 thousand kw and an average age of 36 years. The size of the fleet decreased between 28 and 213; the number of vessels by 5.5% and GT and kw by 4% and 2%, respectively (Table 5.2.1; Figure 5.2.1). The major factors causing the fleet to decrease include the scrapping of vessels, including two of the largest vessels. The Slovenian national economy is insignificantly influenced by the marine fisheries sector. However, the sector has a particular social impact in terms of employment. The watershed moment for Slovenian marine fisheries began with Slovenian independency in the year This period marked a decrease in the extent of fishing regions and a substantial loss of market for fish products. A large number of poorly equipped smallscale fishermen, inadaptability of large-scale fisherman, along with discordance among fishing, producing and marketing capabilities brought the sector into crisis. Landings of almost 6 thousand tonnes in 199 have decreased to 33 tonnes in 212. Table Slovenian national fleet structure, activity and production trends: Arrows indicate change ( ) 212 to 211: ( ) increase; ( ) decrease and ( ) stable/no change ( between -1 and +1%) Output Fishing Effort Employment Structure Variable NATIONAL FLEET % Total No. Vessels (#) % 171 No. of Inactive vessels (#) % 88 Average vessel age (year) % 37 Vessel tonnage (thousand GT) %.6 Vessel power (thousand kw) % 8.5 No. of Enterprises (#) % Total employed (#) % FTE (#) % Average wage per employed (thousand ) % Average wage per FTE (thousand ) % Days at sea (thousand days) % Fishing days (thousand days) % Energy consumption (milion litres) % Energy consumption per landed tonne (l/t) % Landings weight (thousand tonnes) % Landings value (million ) % Data source: DCF 214 Fleet Economic (MARE/A3/AC(214)); data for 213 and 214 are provisional. The existence of two sea fishery reserves where all fishing activities are banned (Portorož and Strunjan fishery reserves) further limit the reduced Slovenian fishing area. For the last few years, this has had a negative impact, particularly on those fishermen who are engaged only in small-scale coastal fishing. In 212, the number of fishing enterprises totalled 146, with the majority (7%), owning a single vessel. Only 29% of the enterprises owned two to five fishing vessels. Total employment in 212 was estimated at 17 jobs, corresponding to 63 FTEs. The level of employment decreased between 28 and 212, with total employed decreasing by 2%, whiles the number of FTEs decreased by 18%. The Slovenian fishing fleet consists predominantly of small vessels of less than 12 meters (mainly vessels of 6 meters). Self-employed fishermen who own one fishing vessel about six meters long represent a typical Slovenian fishing enterprise. 313
316 314 National Chapters thousand days million litres In 213, the fleet spent a total of around 7.7 thousand days at sea. Effort, in days at sea, increased 13% between 28 and 213. The fisheries sector, particularly the small scale fleet, is affected by the limited size of marine fishing area. For this reason, most fish stocks targeted by the Slovenian fleet are overexploited, resulting in lower landings and increased effort. Most of the fleet is poorly equipped and unable to operate in international waters. One of the reasons for increased days at sea is the high price of fuel, which encourages the fishermen to do shorter and more frequent trips. GT, kw (thousands) million / thousand tonnes Landings value (million ) Landings weight (thousand tonnes) Figure Slovenian fleet main trends for the period Vessel tonnage Vessel power No. Vessels FTE Total employed Landings value Landings weight Landings income Common pandora Common sole European squid Gilthead seabream Whiting 5 no. vessels, employment Average price ( /kg) Data source: DCF 214 Fleet Economic (MARE/A3/AC(214)); data for 213 are provisional. Top left capacity and employment; top right fishing effort and fuel consumption; middle left landings in value and weight; middle right average landed prices of top 5 species in terms of landed value in 212; bottom left - top 5 species in terms of value landed in 212; and bottom right landed weight of top 5 species in terms of value landed in 212. The quantity of fuel consumed in 212 was around 28 thousand litres, a decrease of around 48% from 28. The major factor causing this decrease includes the scrapping of several vessels in the fleet, including two of the largest vessels. The total weight of seafood landed in 212 was around 33 tonnes, with a landed value of 1.5 million. The total weight and value of landings decreased by 49% and 29%, respectively, over the period analysed. In 29, the national fleet generated the highest landed value ( 2.2 million), followed by 28, 21 and 211 ( 2 million). In terms of landings weight, in 29 the fleet landed around 866 tonnes, 21 (764 tonnes), 211 (719 tonnes) and 212 (33 tonnes). The major factors causing the decrease in landed weight and value, Days at sea Fishing days Energy consumption Common pandora European squid Whiting Common sole Gilthead seabream Common pandora Common sole European squid Gilthead seabream Whiting
317 214 Annual Economic Report on the EU Fishing Fleet especially for European anchovy and sardine, include overexploited stocks and scrapping of fishing vessels. In the last quarter of 211, Slovenia sent the two largest ships to be scrapped (pelagic trawlers 24-4m); those vessels targeted mainly sardine and anchovy and represented around 5% of the Slovenian landed weight. Prices obtained for the key species targeted by the fleet generally increased between 28 and 212. European pilchard achieved the highest average price in 212 ( 2 per kg), followed in 28 ( 1.99 per kg). European pilchard accounted for 26% of the total landings value obtained by the Slovenian fleet in 28, decreasing to only 2.5% of income in 212, while European anchovy decreased from 23% in 28 to 8% in 212. National Fleet Economic performance The amount of income generated by the Slovenian national fleet in 212 was 2.4 million. This consisted of 1.5 million in landings value and.9 million in non-fishing income. The Slovenian fleet s landings income decreased 29% between 211 and 212, while other income increased 35% during the same period. Due to reduced landings, Slovenian fishermen are looking for the opportunity to generate earnings in other industries, such as tourism. Table Slovenian national fishing fleet economic performance in and projections for 213. Development trend based on % net profit margin 212 to average net profit margin Arrows indicate change ( ) 212 to 211: ( ) increase; ( ) decrease and ( ) stable/no change ( between -1 and +1%) Variable (million ) National Fleet % Income Costs Economic Indicators Capital value Profitability and development trends Landings income % Other income % Labour costs % Energy costs % Repair costs % Other variable costs % Other non-variable costs % Capital costs % GVA % Gross profit % Net profit % Depreciated replacement value % Investments % Net profit margin (%) % development trend Improved 98% RoFTA (%) % development trend Improved 15% GVA per FTE (thousand ) % development trend Improved 62% Data source: DCF 214 Fleet Economic (MARE/A3/AC(214)); data for 213 are provisional. Total operating costs incurred by the fleet in 212 equated to 2 million, amounting to 83% of total income. Crew cost and fuel costs, the two major fishing expenses, were 1.3 and.3 million, respectively (Table 5.2.2; Figure 5.2.2). Between 28 and 212, total operating costs decreased 5%, largely due to scrapping of several vessels. In terms of economic performance, the amount of Gross Value Added (GVA), gross profit and net profit generated by the Slovenian fleet in 212 were 1.6 million,.3 million and -.1 million, respectively. Between 211 and 212, GVA remained relatively stable while gross profit and net profit increased 967% and 98% respectively. The major factors causing the improvement in economic performance in 212 included lower expenditure in fuel and labour costs and increases in income from other sources. Regardless of the 315
318 million National Chapters increase in economic performance, the fleet was in a poor economic condition because of old and poorly equipped fleet and reduced catches. In 212, the Slovenian fleet had an estimated (depreciated) replacement value of 4.6 million. Investments by the fleet amounted to.3 million in 212. Performance indicators (million ) Landings income Other income Revenue GVA Gross profit Net profit Data source: DCF 214 Fleet Economic (MARE/A3/AC(214)); data for 213 are provisional. Figure Slovenian fleet main economic performance trends for the period % million Top left income structure; top right cost structure; middle left cost items as a percentage of income (fishing income and other income); middle right economic performance indicators; bottom performance indicators as a % of revenue (landings income + other income) (projected figures for 213) Crew wage costs Unpaid labour Energy costs Repair costs Other variable costs Other non-variable costs Annual depreciation GVA to Revenue Gross profit margin Net Profit margin RoFTA Fleet Segment Level Economic performance The Slovenian fleet has a range of vessel types targeting different species predominantly in the Adriatic Sea. The fleet consisted of 8 (DCF) fleet segments in 212, with 4 inactive length classes consisting of 92 vessels. Two of the active fleet segments made losses in 212 (DFN VL-6m, DFN VL6-12m) while DTS VL12-18m and PS VL12-18m made an overall profit. One of the active fleet segments (DFN VL6-12m) has suffered a deteriorating economic development trend while DFN VL-6m and DTS VL12-18m revealed an improving trend (see Table 5.2.5). In 212, there were 89 active vessels of which around 67 (75% of all active vessels) are classified as smallscale. The majority of these vessels operate in the coastal waters of Slovenia. A breakdown of the key performance indicators by main fishing activity (small and large-scale) is provided in Table and Table Table provides a breakdown of key performance indicators for all Slovenian fleet segments in 212. A short description of the most important segment in terms of total value of landings is provided below. Demersal trawlers and demersal seiners 12-18m - 17 vessels make up this segment and are based predominantly in the Adriatic. The fleet targets a variety of species, the most important being whiting, musky octopus and European squid. The value of landings was.65 million and 11 FTEs were employed in this fleet segment in 212, contributing to 43% and 17% of the total income from landings and FTEs generated by the MS fishing fleet respectively. This fleet segment made a profit in 212. In 212, the small scale sector in Slovenia was represented by two segments: 316
319 214 Annual Economic Report on the EU Fishing Fleet Drift and fixed netters -6m Around 33 vessels make up this segment which operate in Slovenian coastal areas of the Adriatic. These vessels target demersal species, such as sole, common pandora and sea bream. The total value of landings was.15 million and around 19 FTEs were employed in this fleet segment in 212, contributing 1% and 3% of the total income from landings and FTEs generated by the national fleet respectively. This fleet made a loss in 212. Drift and fixed netters 6-12m Around 34 vessels make up this segment which operate in Slovenian coastal areas of the Adriatic. These vessels target demersal species, such as sole, common pandora and sea bream. The total value of landings was.365 million and around 25 FTEs were employed in this fleet segment in 212, contributing 24% and 4% of the total income from landings and FTEs generated by the national fleet respectively. This fleet segment made a loss in 212. Table Slovenian national fleet structure, activity and production trends by operational scale: Arrows indicate change ( ) 212 to 211: ( ) increase; ( ) decrease and ( ) stable/no change ( between -1 and +1%) Structure Employment Fishing Effort Output Variable Small scale Fleet % Large scale fleet No. Vessels (#) % % Vessel tonnage (thousand GT) % % Vessel power (thousand kw) % % Total employed (#) % % FTE (#) % % Average wage per employed (thousand ) % % Average wage per FTE (thousand ) % % Days at sea (thousand days) % % % Fishing days (thousand days) % % Energy consumption (milion litres) % % Energy consumption per landed tonne (l/t) 1,328 1,26 1,353 1,12 1,41-5% % Landings weight (thousand tonnes) % % Landings value (million ) % % Table Economic performance of the Slovenian national fishing fleet by operational scale: Development trend based on % net profit margin 212 to average net profit margin Arrows indicate change ( ) 212 to 211: ( ) increase; ( ) decrease and ( ) stable/no change ( between -1 and +1%) Variable (million ) Small scale Fleet % Large scale fleet % Income Costs Economic Indicators Capital value Profitability and development trends Landings income % % Other income % Labour costs % % Energy costs % % Repair costs % % Other variable costs % % Non-variable costs.1.1. % % Capital costs % % GVA % % Gross profit % % Net profit % % Depreciated replacement value % % Investments % % Net profit margin (%) % % development trend Deteriorated -224% Improved 21% RoFTA (%) % % development trend Deteriorated -236% Improved 278% GVA per FTE (thousand ) % % development trend Stable -3% Improved 171% 317
320 Assessment and Future Trends National Fleet National Chapters The future development of the Slovenian fishing fleet is delineated in the Operational Program for Fisheries Development in the Republic of Slovenia (OP). The OP foresees the following measures related to the fishing fleet within its priority axes: Priority axis 1: Adaptation of the fishing fleet (the goal of this axis is to achieve a balance between the capacity of the Slovenian fishing fleet and the available fisheries resources): permanent cessation of fishing activities; measures on board fishing vessels (in order to improve the working conditions and safety of fishermen) and improving the selectivity of fishing gear; measures focused on small-scale coastal fishing. Priority axis 2: Measures of common interest: collective actions for the improvement of safety and working conditions for the fishermen; measures to improve existing ports and landing sites. Priority axis 3: Sustainable development of fisheries areas: opportunities for the diversification of fishing activities (e.g. into fishing tourism). Due to scrapping in 211 and 212 the size of the fishing fleet decreased between 28 and 213; the number of vessels by 5.5% and GT and kw by 4% and 2% respectively. Consequently, the weight of landings decreases in 213 by more than 6% regarding 28. So in the future we can also expect decreases in the value of landings and thus the total income of the Slovenian fleet. Due to the reduction of the fleet and related reduction of fishing effort we can expect improvement in the biological status of fish stocks. Because of that, weight of landings will probably start to increase again due to better catches. When the crisis finally ends, we can also expect fish prices to increase. As the fleet is generally old and poorly equipped we can expect that repair and maintenance costs will continue to increase in the future. Due to poor condition and profitability of the fleet, we cannot expect increases in GVA and profits. Small scale Fleet The same issues apply to the small scale fleet. Around 2 fishers have lost their jobs due to vessel scrapping. In the future we can expect an increase of small scale vessels because some of them will start operating in a self-employed manner. Due to reduced catch we can also expect higher prices for European pilchard (sardine) and anchovy and, consequently, higher income for those targeting these species. Data issues The economic data on the fishing sector were collected mostly from accounting records AJPES, from data base InfoRib, through questionnaires and sales notes. In the monitoring programme all fishing vessels were included (approximately 18 units). The data collected from all sources were combined in such a way that a complete set of accounting items is compared for each business enterprise. The target population was all fishing sector in Slovenia. There were approx. 1 companies or fishermen in Slovenia. In March 213 the questionnaires for 212 were sent to all users of fishing vessels in Slovenia. Where the questionnaire was the only source used, the response rate was more than 6%. Where the data from annual accounts of business enterprises was used the response rate was 1%, because there are economic reports for all investigated companies or fishermen. 318
321 214 Annual Economic Report on the EU Fishing Fleet Table Main socio-economic performance indicators by fleet segment in the Slovenian national fishing fleet in 212. Development trend based on % net profit margin 212 to average net profit margin Arrows indicate change ( ) 212 to 211: ( ) increase; ( ) decrease and ( ) stable/no change ( between -1 and +1%) Fleet segment No. of vessels (N) % FTE (N) % Days at sea (days) % Energy consumption (litres) % Value of landings (thousand ) % Weight of landings (thousand tonnes) % GVA (thousand ) % GVA per FTE ( /FTE) % Gross profit (thousand ) % Net profit (thousand ) % Net profit margin (%) % Profitability (212) Net profit margin % average (28-11) Economic development trend SVNAREA37DFNVL % 19 2% % 8-6% % 18 57% % % % % % Weak 58% Improved SVNAREA37DFNVL % 25-4% % 53 3% 364-3% 41-6% % % % % % Weak -54% Deteriorated SVNAREA37DTSVL % 11-24% % 198-1% 65-2% % % % % % 2 173% High 167% Improved SVNAREA37PSVL % 7-23% 29-32% 19-37% 32-34% 17-42% % % 15-39% 65-49% 22-23% High SVNAREA37TMVL % -99% 1-1% Data source: DCF 214 Fleet Economic (MARE/A3/AC(214)). 319
322 National Chapters 5.21 SPAIN Fleet Structure, Fishing Activity and Production In 212, the Spanish fishing fleet consisted of 1,544 registered vessels, with a combined gross tonnage of 4 thousand tonnes, engine power of 94 thousand kw and an average age of 28 years. Of the total number of registered vessels, 1,66 were inactive during 212 (15% of the fleet), increasing 59% compared to 211. The size of the fleet also decreased between 211 and 212; 3% in number, 4% in GT and 3% in kw (Table ; Error! Reference source not found.). This five-year declining trend is expected to continue in 213 brought on by structural adjustments (balance between opportunity and capacity) in the Spanish fleet through scrapping, mainly of small scale vessels. In 212, small-scale fleet, with 4,188 vessels, represented 4% of national fleet whereas the distant-water fleet, with 264 vessels, represented 3%. The majority of vessels (5,575) operate in the North Atlantic (area 27). Table Spanish national fleet structure, activity and production trends: Arrows indicate change ( ) 212 to 211: ( ) increase; ( ) decrease and ( ) stable/no change ( between -1 and +1%) Variable NATIONAL FLEET % Total No. Vessels (#) 13,115 11,51 11,29 1,892 1,544 1,167-3% Output Fishing Effort Employment Structure No. of Inactive vessels (#) 3,312 1, ,7 1,66 1,372 59% Average vessel age (year) % Vessel tonnage (thousand GT) % Vessel power (thousand kw) 1,68 1, % No. of Enterprises (#) 12,93 1,616 1,351 1,96 9,776 9,438-3% Total employed (#) 3,539 38,45 39,281 36,294 34,399 34,251-5% FTE (#) 3,715 35,844 33,678 32,194 3,32 29,953-6% Average wage per employed (thousand ) % Average wage per FTE (thousand ) % Days at sea (thousand days) 1,149 1,97 Fishing days (thousand days) 1,12 1,49 Energy consumption (milion litres) % Energy consumption per landed tonne (l/t) 784 Landings weight (thousand tonnes) Landings value (million ) 1,93 Data source: DCF 214 Fleet Economic (MARE/A3/AC(214)); data for 213 are provisional. In 212, the number of fishing enterprises in the Spanish fleet totalled 9,776, with the vast majority (94%) owning a single vessel. Only 6% of the enterprises owned two to five fishing vessels. Total employment in 212 was estimated at 34,399 jobs, corresponding to 3,32 FTEs. The level of employment decreased between 211 and 212, with the number of jobs and FTEs decreasing by 5% and 6% respectively. This reduction was caused by the declining trend in vessel numbers. During 212, small scale fleet represented 19% of the total employment, with 5,97 FTEs whereas large scale fleet represented 69% of total employment, with 2,842 FTEs. In 212 the Spanish fleet spent a total of around 1,149 thousand days at sea. In 213, a decrease of 5% in effort is expected. The quantity of fuel consumed in 212 totalled around 683 million litres, a decrease of around 19% from 211. The total weight landed by the Spanish fleet in 212 was 871 thousand tonnes of seafood, corresponding to 1.9 billion in landed value. There was also an increase in recreational catches, increasing 51% in 212. The majority of catches (in weight) are from the distant-water fleet, 53% of the total catches, whereas only 9% of the catches are from the Mediterranean Sea (area 37). 32
 thousand days 116 114 112 11 18 16 14 12 1 98 28 29 21 211 212 213 9 8 7 6 5 4 3 2 1 million litres Days at sea Fishing days Energy consumption Data source: DCF 214")


323 214 Annual Economic Report on the EU Fishing Fleet GT, kw (thousands) Vessel tonnage Vessel power No. Vessels FTE Total employed no. vessels, employment (thousand) thousand days million litres Days at sea Fishing days Energy consumption Data source: DCF 214 Fleet Economic (MARE/A3/AC(214)); data for 213 are provisional. Figure Spanish fleet: main trends for the period Top left capacity and employment; top right fishing effort and fuel consumption; middle left landings in value and weight; middle right average landed prices of top 5 species in terms of value landed in 212; bottom left landed value of top 5 species in terms of value landed in 212; and bottom right landed weight of top 5 species in terms of value landed in 212. National Fleet Economic performance The amount of income generated by the Spanish fleet in 212 was 1,97.7 million. This consisted of 1,97.6 million in landings value and.1 million in non-fishing income. The Spanish fleet s income decreased 3% between 211 and 212, caused by the small scale fleet that suffered a 31% decrease in income. The reduction on small scale fleet s income was a result of a reduction in the number of vessels, of 39%. On the other hand, long-distant water fleet s income increased 12%. Total operating costs incurred by the national fleet in 212 equated to 1,79 million, amounting to 94% of income. Crew and fuel costs were the two major fishing expenses in 212 representing 3% and 23% of total income respectively (Table ; Figure ). Between 211 and 212, total operating costs fell 9% due to a decrease in all operating costs. In terms of economic performance, the total amount of Gross Value Added (GVA), gross profit and net profit generated by the Spanish national fleet in 212 was 838 million, 261 million, and 117 million, respectively. Gross Value Added (GVA), gross profit and net profit increased by 1%, 56% and 2,135% respectively between 211 and 212. In 212, the Spanish fleet had an estimated (depreciated) replacement value of 515 million and investments amounted to 23 million in 212, a 26% decrease on
 212 to 211: ( ) increase; ( ) decrease and ( ) stable/no change ( between -1 and +1%) Income Costs Economic Indicators Variable (million ) National Fleet 28 29 21 211 212 %")

.3 6.2 2178% development trend Improved 2178% RoFTA (%) 3.3 26.2 695% development trend Improved 695% GVA per FTE (thousand ) 16.7 2.")

324 National Chapters Table Spanish national fishing fleet economic performance in Development trend based on % net profit margin 212 to average net profit margin Arrows indicate change ( ) 212 to 211: ( ) increase; ( ) decrease and ( ) stable/no change ( between -1 and +1%) Income Costs Economic Indicators Variable (million ) National Fleet % Landings income 1, , , , ,97.6-2% Other income % Labour costs % Energy costs % Repair costs % Other variable costs % Other non-variable costs % Capital costs % GVA % Gross profit % Net profit % Capital value Profitability and development trends Depreciated replacement value % Investments % Net profit margin (%) % development trend Improved 2178% RoFTA (%) % development trend Improved 695% GVA per FTE (thousand ) % development trend Improved 29% Data source: DCF 214 Fleet Economic (MARE/A3/AC(214)). Data source: DCF 214 Fleet Economic (MARE/A3/AC(214)); data for 213 are provisional. Figure Spanish fleet main economic performance trends for the period Top left income structure; top right cost structure; middle left cost items as a percentage of income (fishing income and other income); middle right economic performance indicators; bottom performance indicators as a % of revenue (landings income + other income) (projections figures for 213). 322
.")
325 214 Annual Economic Report on the EU Fishing Fleet Fleet Segment Level Economic performance The Spanish fleet is highly diversified with a broad range of vessels types targeting many different species such as tunas, cod, anchovies, sardines, squid, cuttlefish, octopus mainly in the Mediterranean and North Atlantic Seas (Figure ). The national fleet consisted of 57 active fleet segments in 212. In 19 of the active fleet segments there were losses while 38 active segments had gross profits in 212. Figure Spanish fleet landings by main FAO fishing area, 212. Colour shows fishing days (thousand days) and landings in weight (thousand tonnes); Value shows days-at-sea (thousand days) and landings in value (thousand ). Source: DCF 214 Fleet Economic (MARE/A3/AC(214)) In 212, small scale fleet, with 4,188 vessels, represented 4% of the Spanish fleet but only 19% of the total employment. This fleet has suffered an important reduction (-31%) in landings income, mainly driven by a similar reduction in the number of vessels, 39% decrease from 211. The Spanish small-scale fleet was not profitable in 212, although the segment s performance improved compared with results from previous years. In 212, the large-scale fleet increased significantly in vessel number (+62% compared to 211), representing 46% of the Spanish fleet and 69% of the total employment. Despite this increase in capacity, the landings income suffered a reduction of 5% in 212. However, the fleet improved its profitability. With 264 vessels, the distant-water fleet represented 3% of the Spanish fleet. This fleet was the most profitable since its landings income increased 12% while operating costs decreased by more (Table ). Table provides a breakdown of key performance indicators for all active segments in 212. A short description of the three most important segments in terms of total landings income is provided below. Purse seine over 4m Vessels in this segment operate in other fishing regions (distant-water/high sea fleet). The total landings income was almost 43 million and around 1,598 FTEs were employed in this fleet segment in 212, contributing to 23% and 5% of the income from landings and FTEs generated by the Spanish fishing fleet, respectively. This fleet segment was profitable with a reported gross profit of 132 million in 212. Demersal trawl/seine 24 4m 375 vessels make up this segment which operates predominantly in area 27. In 212, landings income was around 312 million and 3,169 FTEs were employed in this segment, contributing to 16% and 1% of the income from landings generated and FTEs in the Spanish fleet, respectively. This fleet segment was profitable, with a reported gross profit of around 33 million. Demersal trawl / seine over 4m This segment operates predominantly in other (distant) regions. This segment made around 224 million in total landings income and employed 1,371 FTEs, contributing to 12% and 5% of the total income from landings and FTEs generated by the Spanish fishing fleet, respectively. This fleet segment reported a gross profit around 6 million in 212 although the other fishing regions (long distance) fleet reported losses of almost 11 million. 323
326 Assessment and Future Trends National Chapters In 212, according to the official statistics of the Ministry for Agriculture, Food and Environment ( the Spanish fishing fleet decreased in the number of vessels in order to bring it in balance with the resources. This trend is also reflected in the reduction of engine power and gross tonnage. Between 211 and 212, the size of the fleet (measured by vessel tonnage) reduced 4%, which particularly affected the small scale fleet, which decreased 23%. Profitability of the fleet improved in 212 motivated by operating cost reductions, but specifically in crew and energy expenses. The number of inactive vessels increased a 59% in 212, another factor contributing to improved profitability in the sector. A longer trend of the main indicators analysed, including data from the Data Collection Regulation (DCR, 22-27), is provided at the end of this chapter. Data issues Effort data and landings data was only provided for the years 212 and 213 (value of landings provided only for 212). Data collection for Spain is difficult due the size and complexity (by fishing areas and technology) of the Spanish fishing fleet. The inter-annual variation in the composition of the small and large-scale fleets is in part due to the methodology used to define each type of fishing technology. Small-scale vessels are defined as vessels less than 12 m using non-towed gears. If from one year to the next, a vessel with 12 m or less changes it main gear type (used in more than 5% of the fishing effort in a given year) from a passive gear (e.g. HOK - hook) to an active gear (e.g. PS Purse seine), it will no longer be defined as small-scale but instead as a large-scale vessel. 324
327 214 Annual Economic Report on the EU Fishing Fleet Table Spanish national fleet structure, activity and production trends by operational scale: Arrows indicate change ( ) 212 to 211: ( ) increase; ( ) decrease and ( ) stable/no change ( between -1 and +1%) Output Fishing Effort Employment Structure Variable Small scale Fleet % Large scale fleet % Distant water and othermost region fleet % No. Vessels (#) 6,42 6,315 7,12 6,83 4,188 4,22-39% 3,89 3,11 2,956 2,77 4,486 4,326 62% % Vessel tonnage (tonne) % % % Vessel power (kw) % % % Total employed (#) 7,818 11,797 12,697 13,453 8,61 11,183-36% 18,17 2,714 19,524 17,83 21,85 18,411 18% 4,551 5,534 7,6 5,38 4,713 4,854-6% FTE (#) 5,33 7,261 8,222 8,356 5,378-36% 19,385 21,266 17,14 18,48 19,33 5% 6,297 7,317 8,316 5,79 5,891 2% Average wage per employed (thousand ) % % % Average wage per FTE (thousand ) % % % Days at sea (thousand days) Fishing days (thousand days) Energy consumption (milion litres) % % % Energy consumption per landed tonne (l/t) Landings weight (thousand tonnes) Landings value (million )
328 National Chapters Table Economic performance of the Spanish national fishing fleet by operational scale: Development trend based on % net profit margin 212 to average net profit margin Arrows indicate change ( ) 212 to 211: ( ) increase; ( ) decrease and ( ) stable/no change ( between -1 and +1%) Variable (million ) Small scale Fleet Distant water & othermost region fleet % % Large scale fleet % Income Costs Economic Indicators Capital value Profitability and development trends Landings income % 86 1, , % % Other income % % Labour costs % % % Energy costs % % % Repair costs % % % Other variable costs % % % Non-variable costs % % % Capital costs % % % GVA % % % Gross profit % % % Net profit % % % Depreciated replacement value % % % Investments % % % Net profit margin (%) % % % development trend Improved 17% Improved 333% Improved 28% RoFTA (%) % % % development trend Improved 16% Improved 35% Improved 28% GVA per FTE (thousand ) % % % development trend Deteriorated -7% Improved 14% Improved 79% 326
329 214 Annual Economic Report on the EU Fishing Fleet Table Main socio-economic performance indicators by fleet segment in the Spanish national fishing fleet in 212. Development trend based on % net profit margin 212 to average net profit margin Arrows indicate change ( ) 212 to 211: ( ) increase; ( ) decrease and ( ) stable/no change ( between -1 and +1%) Fleet segment No. of vessels (N) % FTE (N) % Days at sea (days) % Energy consumption (litres) ESP AREA27 DFN VL ,594 1,178 6,88 2,383 2, ,289 % ESP AREA27 DFN VL % % 28,684 12, % 17,312 5,915 2,927-5% % - 1, % Value of landings (thousand ) % ESP AREA27 DFN VL ,11 3,321 9,355 3,425 9, , Weak Weight of landings (thousand tonnes) ESP AREA27 DFN VL ,54 3,51 9,979 3,254 8, ,12 1,51 9 Reasonable ESP AREA27 DRB VL1 1,865 1, ,325 6,97 23,335 3,156 23, ,425-11, Weak ESP AREA27 DRB VL , Weak ESP AREA27 DRB VL ,451 2,156 5,743 2,318 3, , High ESP AREA27 DTS VL ,45 8,295 13,55 2,892 1, ,842 ESP AREA27 DTS VL ,1 15,795 21,813 6,382 5, ,439-2, Weak ESP AREA27 DTS VL % 1,752-29% 42, ,453-35% 179,362 8,672 8,998 14% % 28, % 13, % 7 165% Reasonable ESP AREA27 DTS VL4XX 19-42% % 4,586 24,628-56% 92,741 37,266 38,388-18% % 16,52 66% 7,67 462% 1 796% Reasonable ESP AREA27 FPO VL ,214 1,959 4,74 1,259 2, Weak ESP AREA27 FPO VL , ,763 1,36 2, Weak ESP AREA27 HOK VL1 1-82% 11-82% % % % 82-85% 57-89% 21-48% High ESP AREA27 HOK VL % 161-2% 8,47 2, % 4,287 2, 2,422-47% % - 1, % ESP AREA27 HOK VL % % 15,68 3,266-6% 12,9 5,2 11,853-6% % 2,131 56% % % Weak ESP AREA27 HOK VL % % 8,855 5,829 96% 14,11 5,776 1,161 74% % 954 3% % -1 8% Weak ESP AREA27 HOK VL % 1, % 26,138 34,3 29% 11,38 44,196 82,25 519% % 27, % 18, % % High ESP AREA27 PGP VL1 2,17 2,441 18,988 7,825 39,492 8,563 33, ,43 3,49 6 Reasonable ESP AREA27 PGP VL , , Weak ESP AREA27 PGP VL % % 4, % 2,82 1,1 2, % % % % -17-7% Weak ESP AREA27 PS VL % % 3, % 2,289 1,87 1,4-31% 7.1-7% % % % Weak ESP AREA27 PS VL % % 19,893 4,977 22% 29,281 22,9 2, % % 3,211 8% 2,563 25% 7 26% Reasonable ESP AREA27 PS VL % 1,188 39% 18,85 9,25-1% 42,684 35,877 15,591-61% % 5,162-56% 1,598-54% 5-1% Reasonable ESP AREA27 PS VL % 1,222-26% 14,532 11,47-8% 65,798 53,368 45,522-36% % 11,697-55% 8,929-45% 14-23% High ESP AREA37 DFN VL , ,435 1,255 3, ,45 1,36 24 High ESP AREA37 DFN VL , , , ESP AREA37 DRB VL , Weak % GVA (thousand ) % GVA per FTE ( /FTE) % Gross profit (thousand ) % Net profit (thousand ) % Net profit margin (%) % Profitability (212) 327
330 National Chapters Fleet segment No. of vessels (N) % FTE (N) % Data source: DCF 214 Fleet Economic (MARE/A3/AC(214)). Days at sea (days) % Energy consumption (litres) % Value of landings (thousand ) % Note: development trend not available due to incomplete data set (unable to estimate Opportunity cost of capital and hence net profit for the years 28 to 21) Weight of landings (thousand tonnes) ESP AREA37 DRB VL , Reasonable ESP AREA37 DTS VL , , , High ESP AREA37 DTS VL % % 3,832 6,315-43% 19,9 4,746 11,4 37% % 2, % 1,14 14% 5 143% Reasonable ESP AREA37 DTS VL % 1,784 18% 69,219 44,87-1% 67,356 12,296 33,269-5% % 1,417 12% - 2,89 15% -3 1% Weak ESP AREA37 DTS VL % 63-1% 3,621 29,185-28% 4,855 6,399 17,181 48% % 3, % - 2,2 79% -4 77% Weak ESP AREA37 FPO VL , ESP AREA37 FPO VL , , , Weak ESP AREA37 HOK VL % % 8,394 1,115-37% 3, ,22-81% % 32-99% - 1, % % Weak ESP AREA37 HOK VL % 24-27% 9,736 2,7-25% 9,534 1,619 5,49 65% % 2, % 1, % % High ESP AREA37 HOK VL % % 5,551 2,213-31% 8,328 1,49 3,823-31% % 1,32-29% % % Weak ESP AREA37 PGP VL , , , ESP AREA37 PGP VL % % 95,877 3, % 23,841 5,521 15, % % % - 1,775-8 Weak ESP AREA37 PGP VL % 32-43% 2, % 1, ,63 21% % 231 8% % 9 188% Reasonable ESP AREA37 PS VL , ,49 1,628 2, High ESP AREA37 PS VL % % 16,62 1,567-62% 21,843 15,677 7,596-44% % 2,548 1% ESP AREA37 PS VL % % 2,786 8,14 77% 33,16 2,94 19,2 156% % 7,793 43% 3,96 811% 1 364% Reasonable ESP AREA37 PS VL % 251-1% 4,473 2,87-8% 2,374 5,72 19,238 72% % 11,265 35% 8,99 674% % High ESP OFR DTS VL % 786 % 1,793 32,621-52% 73,416 12,883 16,32 25% % 1,43-1% - 6,92-542% % Weak ESP OFR DTS VL4XX 35 21% 912-6% 9,57 62,647 25% 266,126 89,811 22,96-62% % - 1,66-149% - 17,171-23% % Weak ESP OFR FPO VL , ESP OFR HOK VL , ,616 1, ESP OFR HOK VL ,41 1,549 3,66 2,955 4, , High ESP OFR HOK VL % 12-34% 2,84 2,84-42% 4,69 2,93 1,7 117% % - 1,229 86% - 1,653 82% -26 7% Weak ESP OFR HOK VL % 1,581 6% 32,614 51,548-1% 123,839 74,981 21,12-58% % - 7, % - 11,13-546% % Weak ESP OFR HOK VL4XX 3 % 1,13 28% 9,531 31,25-5% 53,827 2,733 14,55-43% % 3,346-77% - 7,66-289% % Weak ESP OFR PGP VL ,349 1,875 6,774 3,849 5, ESP OFR PGP VL , ESP OFR PS VL , ,294 1, ESP OFR PS VL4XX 32-2% 1,598 % 9,557 11,468-8% 422, , ,425 67% % 131, % 11,321 21% % High 328 % GVA (thousand ) % GVA per FTE ( /FTE) % Gross profit (thousand ) % Net profit (thousand ) % Net profit margin (%) % Profitability (212)
 thousand days Energy consumption (million litres) 214 Annual Economic Report on the EU Fishing Fleet 14 12")

331 GT, kw (thousands) # of vessels, emplyed (thousands) thousand days Energy consumption (million litres) 214 Annual Economic Report on the EU Fishing Fleet Vessel power No. Vessels Vessel tonnage Employed Days at sea Fishing days Energy consumption 5 % GVA to Revenue Net Profit margin 329
332 National Chapters 5.22 SWEDEN Fleet Structure, Fishing Activity and Production In 213 the Swedish fishing fleet consisted of 1,299 registered vessels, with a combined gross tonnage of 32 thousand GT, a total power of 171 thousand kw and an average age of 32 years. The size of the Swedish fleet decreased between 28 and 213; the number of vessels decreased by 14% and GT and kw decreased by 29% and 19%, respectively (Table ). The major factors causing the fleet to decrease include decreased number of permits to fish European Eel, entry barriers, bad profitability, scrapping campaigns, introduction of transferable fishing rights and natural wastage due to age. In 213, the number of fishing enterprises in the Swedish fleet totalled 1,35, with the vast majority (8%), owning a single vessel. Only 2% of the enterprises owned two to five fishing vessels. Total employment in 212 was estimated at 1,663 jobs, corresponding to 942 FTEs. The level of employment decreased between 28 and 212, with total employed decreasing by 16% and the number of FTEs decreasing by 17% over the period. The major factors causing employment to decrease include the decreasing fleet size and less labour intensive vessels. That total employment decreased less than FTE means that Sweden has more part-time fishermen. Table Swedish national fleet structure, activity and production trends: Arrows indicate change ( ) 212 to 211: ( ) increase; ( ) decrease and ( ) stable/no change ( between -1 and +1%) Variable NATIONAL FLEET % Total No. Vessels (#) 1,57 1,471 1,415 1,359 1,322 1,299-3% Productio Fishing Effort Employment Structure No. of Inactive vessels (#) % Average vessel age (year) % Vessel tonnage (thousand GT) % Vessel power (thousand kw) % No. of Enterprises (#) 1,211 1,181 1,134 1,89 1,55 1,35-3% Total employed (#) 1,98 1,758 1,765 1,679 1,663 1,62-1% FTE (#) 1,133 1, % Average wage per employed (thousand ) % Average wage per FTE (thousand ) % Days at sea (thousand days) % Fishing days (thousand days) % Energy consumption (milion litres) % Energy consumption per landed tonne (l/t) % Landings weight (thousand tonnes) % Landings value (million ) % % Data source: DCF 214 Fleet Economic (MARE/A3/AC(214)); data for 213 are provisional. In 213 the Swedish fleet spent a total of around 78 thousand days at sea. The total numbers of days at sea decreased by around 24% between 28 and 213. The major factors causing the decrease include lower quotas and increasing catch per effort. The quantity of fuel consumed in 212 totalled around 47 million litres, a decrease of around 24% from 29, driven by fewer days at sea and increased fuel efficiency. The total weight landed by the Swedish fleet in 212 was 137 thousand tonnes of seafood, with a landed value of 124 million. The total weight decreased while the value of landings increased over the period analysed. In 212, the catch was exceptionally low due to low quotas. The highest landed value ( 131 million) by the national fleet was achieved in 213. The total landed value followed the price statistics; in particular prawn prices, which increased since 28. Landed value was also strongly affected by currency (SEK to EUR) 33
333 214 Annual Economic Report on the EU Fishing Fleet and landings weight. Cod prices decreased and the quotas was not fully utilised, lowering both landing value and landing weight. In terms of landings weight, decreasing quotas (particularly on pelagic species such as herring and sprat) affects the results. Improved landings price is the major factor causing the increase in value as quotas decreased. Herring, sprat and cod prices were stable during the period while Northern prawn prices increased and Norwegian lobster decreased between 28 and 212. Lobster achieved the highest average price per kilo in 212 (close to 12 per kg), followed by prawn (just over 1 per kg). GT, kw (thousands) million / thousand tonnes Landings value (million ) Data source: DCF 214 Fleet Economic (MARE/A3/AC(214)); data for 213 are provisional. Figure Swedish fleet main economic performance trends for the period ,5 2, 1,5 1, 5 Vessel power Vessel tonnage No. Vessels FTE Total employed Landings value Landings weight Landings income Atlantic cod Atlantic herring European sprat Northern prawn Norway lobster No. vessels, employment thousand days Average price ( /kg) Landings weight (thousand tonnes) Top left income structure; top right cost structure; middle left cost items as a percentage of income (fishing income and other income); middle right economic performance indicators; bottom performance indicators as a % of revenue (landings income + other income) Days at sea Fishing days Energy consumption Atlantic cod Atlantic herring European sprat Northern prawn Norway lobster Atlantic cod Atlantic herring European sprat Northern prawn Norway lobster million litres National Fleet Economic performance The total amount of income generated by the Swedish national fleet in 212 was close to 13 million. This consisted of 124 million in landings value and 6 million in non-fishing income. The Swedish fleet s total income decreased between 211 and 212. This was due to the fact that other income was very high in 29, 21 and 211; a result of the introduction of transferable quotas. Thus, the increase in landings value was 331
334 National Chapters equalised by the decrease in other income. Both income and cost data for 21 was affected by the introduction of transferable quotas in the Swedish Pelagic fishery, resulting in substantial reductions in pelagic vessels. Over the period 28 and 212, total income increased and the effect of the introduction of the transferable rights with high values on other cost seems to have declined. The other income variable is technically not supposed to include income from selling fishing rights but in this case, does due to secrecy issues. Total operating costs incurred by the Swedish national fleet in 212 equated to 14 million, amounting to almost 8% of total income. Crew cost and fuel costs, the two major fishing expenses, were 3 and 34 million, respectively (Figure ). Between 28 and 212, total operating costs generally increased with the exception of repair costs, which remained stable due to a diminishing fleet. The increase in operating costs was due to higher costs for labour and fuel exceeding the effect of a diminishing fleet. Non-variable costs were stable during the period. Capital costs decreased due to a diminishing fleet size. Overall, the increases in price for cost items during the period are in some way compensated by less fishing and a decreasing fleet. Table Swedish national fishing fleet economic performance in and projections for 213. Development trend based on % net profit margin 212 to average net profit margin Arrows indicate change ( ) 212 to 211: ( ) increase; ( ) decrease and ( ) stable/no change ( between -1 and +1%) Variable (million ) National Fleet % Income Landings income % Other income % Labour costs % Energy costs % Costs Repair costs % Other variable costs % Other non-variable costs % Capital costs % Economic Indicators Capital value Profitability and development trends GVA % Gross profit % Net profit % Depreciated replacement value % Investments % Net profit margin (%) % development trend Improved 312% RoFTA (%) % development trend Improved 44% GVA per FTE (thousand ) % development trend Stable -2% Data source: DCF 214 Fleet Economic (MARE/A3/AC(214)); data for 213 are provisional. The overall economic performance trend for the Swedish fleet (excluding 21; abnormally high) is positive. In terms of economic performance, the total amount of Gross Value Added (GVA), gross profit and net profit generated by the national fleet in 212 were 56.6 million, 26.2 million and 2.2 million, respectively. Gross Value Added (GVA) and gross profit were stable between 28 and 211 (again, excluding 21). The resource rent is perhaps the optimal indicator for assessing the balance between the fishing fleet (e.g. users) and fish stocks. Net profit, as provided here, can be used as a proxy for the resource rent generated by fisheries. The major factors causing the improvement in economic performance include a diminishing fleet 332
.")


335 214 Annual Economic Report on the EU Fishing Fleet and introduction of transferable quotas. Net profit generally increased between 28 and 212, an exception being 21; abnormally high (a result of the aforementioned issues regarding the introduction of transferable fishing rights). Net profit margin for 212 was estimated as 1.7%. In 212, the Swedish fleet had an estimated (depreciated) replacement value of 128 million. The replacement value remained stable over the period but began to decrease significantly during 212. Rent, exchange currency, and second-hand market for vessels influence the replacement value. Investments by the fleet amounted to 7 million in 212. Investments were stable over the period but with fewer vessels in the fleet the indicator per vessel has increased, suggesting fisher optimism in the future. The indicator Return on Fixed Tangible Assets (RoFTA) is an appropriate indicator of capital productivity when the tangible assets are correctly estimated. In 212, RoFTA was estimated at 2.4. This indicator shows an increasing trend resulting from decreasing tangible asset value due to fewer vessels. Labour productivity (GVA/FTE) does not provide a commensurate picture between fisheries because it is a gross indicator (GVA is profit before labour and capital is deducted). However, it s not affected by potential bias from the estimation procedure of capital costs and labour that includes making several assumptions. Labour productivity increased over the period, excluding 21 abnormally high; labour productivity was estimated at 6 thousand in 212, a 15% increase compared to 28. Data source: DCF 214 Fleet Economic (MARE/A3/AC(214)); data for 213 are provisional. Figure Swedish fleet main economic performance trends for the period Top left income structure; top right cost structure; middle left cost items as a percentage of income (fishing income and other income); middle right economic performance indicators; bottom performance indicators as a % of revenue (landings income + other income) (projected figures for 213). Fleet Segment Level Economic performance The Swedish fleet is highly diversified with a broad range of vessel types targeting different species predominantly in the Baltic Sea, Skagerrak, and Kattegat regions (Figure ). The national fleet consisted of 1 clustered fleet segments in 212, with 3 clustered inactive length classes consisting of 33 vessels. One 333

) Small-scale fleet The number of small-scale vessels decreased from 819 in 28 to 727 in 213, a decrease of 11%, following the general trend of the")
336 National Chapters of the active fleet segments made losses in 212 while the remaining 6 made overall gross profits. All segments except for the two passive segments with vessels less than 12m made positive net profits. Figure Swedish fleet effort and landings by FAO fishing area, 212. Colour shows fishing days (thousand days) and landings in weight (thousand tonnes); Value shows days-at-sea (thousand days) and landings in value (thousand ). Source: DCF 214 Fleet Economic (MARE/A3/AC(214)) Small-scale fleet The number of small-scale vessels decreased from 819 in 28 to 727 in 213, a decrease of 11%, following the general trend of the Swedish fleet. More than half of this decrease in vessel number stems from vessels with main income from fishing European Eel. The Swedish authorities, through different management actions, such as permits, have tried to diminish effort in the threatened European Eel fishery. The number of vessel with main income from cod and salmon fisheries have also decreased while vessel numbers increased slightly for main income originating from Norwegian lobster fishery (Table , Table ). The numbers employed in the small-scale fisheries follows the same decreasing trend as vessels, with FTE decreasing more rapidly, indicating a larger portion of part-time fishers. Vessel tonnage and power has remained stable over the period while average vessel age is increasing. Overall, the small-scale fleet is not profitable, generating a negative net profit margin of 34%. Gross value added is positive but relatively low per FTE at 21 thousand. As tangible assets are, in most cases, probably paid off, these vessels can afford to continue to fish. Low GVA estimates signal that there are other reasons for fishing than just profit, such as part-time employment or a way of life. Additionally, increased seal populations along the Swedish coastline are heavily affecting both income, by taking and eating fish directly from the gears, and costs, by destroying gears as well as creating extra work. Large-scale fleet For the large-scale fleet, the number of vessels decreased from 329 in 28 to 265 in 213, a decrease of well over 2%. More than half of this decrease stems from vessels with main income from the Norwegian lobster fishery. The Swedish authorities have promoted fishing lobster with passive gears and as cod populations are in bad conditions, mixed fisheries with cod and lobster are no longer a profitable option. Vessels fishing for cod as main source of income have also decreased. Some of these vessels also fished pelagic species and after the introduction of fishing-rights in the pelagic fishery they sold their rights and left the fishery. The increase in the value of landings for the large-scale vessels from 28 to 212 is considerably better than the development of the fleet as a whole. This is despite the fact that landings weight has decreased substantially over the period due to reduced quotas. Overall the large-scale fleet seems to perform fairly well but the variation is large. Vessels fishing pelagic species and those that fish in the north Baltic for vendance rom are performing very well while those fishing for cod, Northern prawn and Norwegian lobster are performing poorly. The large-scale fleet has been affected by increased energy costs so the effect of higher 334
337 214 Annual Economic Report on the EU Fishing Fleet landing values has been equalised. However, decreased capital costs due to fewer vessels generated a higher net profit compared to 211 (Table , Table ). Table Swedish national fleet structure, activity and production trends by operational scale: Arrows indicate change ( ) 212 to 211: ( ) increase; ( ) decrease and ( ) stable/no change ( between -1 and +1%) Output Fishing Effort Employment Structure Variable Small scale Fleet % Large scale fleet No. Vessels (#) % % Vessel tonnage (thousand GT) % % Vessel power (thousand kw) % % Total employed (#) 1, % % FTE (#) % % Average wage per employed (thousand ) % % Average wage per FTE (thousand ) % % Days at sea (thousand days) % % % Fishing days (thousand days) % % Energy consumption (milion litres) % % Energy consumption per landed tonne (l/t) % % Landings weight (thousand tonnes) % % Landings value (million ) % % Table Economic performance of the Swedish national fishing fleet by operational scale: Arrows indicate change ( ) 212 to 211: ( ) increase; ( ) decrease and ( ) stable/no change ( between -1 and +1%) Income Costs Economic Indicators Variable (million ) Small scale Fleet % Large scale fleet % Landings income % % Other income % % Labour costs % % Energy costs % % Repair costs % % Other variable costs % % Non-variable costs % % Capital costs % % GVA % % Gross profit ##### % Net profit % % Capital value Profitability and development trends Depreciated replacement value % % Investments % % Net profit margin (%) % % development trend Improved 22% Deteriorated -14% RoFTA (%) % % development trend Deteriorated -37% Deteriorated -5% GVA per FTE (thousand ) % % development trend Stable % Deteriorated -5% Table provides a breakdown of key performance indicators for all fleet segments in 212. A short description of the 2 most important segments in terms of total value of landings is provided below. Demersal trawl / seine 24-4m 45 vessels in 212 made up this clustered segment, which also contains 7 vessels over 4 m, operating predominantly in the Baltic Sea. The fleet targets a variety of species, in particular pelagic species such as herring and sprat but also demersal species such as cod and prawn. In 212, the total value of landings was almost 63 million and around 26 FTEs were employed in this fleet segment, contributing to 51% and 28% of the total income from landings and FTEs in the Swedish fishing fleet, respectively. This fleet segment was profitable, with a reported gross profit of around 19 million and a net 335
338 336 National Chapters profit of 5.1 million in 212. The profit is generated mainly from vessels fishing pelagic species. Vessels with more than 5% cod or prawn in landing value are generally unprofitable. Around 44% of the vessels are inside the pelagic system with tradable fishing rights and these are highly profitable. Demersal trawl seine 18-24m in 212, 46 vessels made up this segment, which operates predominantly in the Baltic Sea, Skagerrak and Kattegat. The fleet targets a variety of species but in particular pelagic species and demersal species such as cod, lobster and prawn. In 212, the total value of landings was more than 22 million and around 156 FTEs were employed in this fleet segment, contributing 18% and 17% of the total income from landings and FTEs in the Swedish fishing fleet, respectively. This fleet segment was profitable, with a reported gross profit of around 3.8 million and a net profit of 1.6 million in 212. The vessels fishing pelagic species are more profitable than the rest of the segment (22% of the vessels are within the tradable fishing rights system). No specific fishery within this segment was unprofitable. Assessment and Future Trends Towards the end of 29, Sweden introduced a tradable fishing right system for pelagic quotas. Vessels in the system are clustered together with other vessels, mostly in the demersal trawl/seine 18-24m and 24-4m segments. The reason, in addition to confidentiality issues, is that many of the pelagic vessels also fish cod and vice-versa. A clear positive effect of the pelagic system can be seen. The first transactions took place in early 21 and the first effects of these transactions became visible in late 21 in terms of profitability for the pelagic fisheries. But the effect of the new system can be better seen in the profitability of 212, once capacity had been removed. However, decreases in quotas for pelagic species (most importantly for herring and sprat) and increases in fuel prices have had a negative effect on the expected profitability increase resulting from the introduction of the system. Fuel prices increased during 21 and 211 and remained at high levels during 212, which had an effect on all fleet segments. The increase is supposed to have the greatest effect on segments fishing with active gears (e.g. trawls and seiners). In general, fuel consumption has decreased since 29 but increased in 212. The large demersal and pelagic vessels, demersal trawl/seines 24-4m and the midsize demersal and pelagic vessels, demersal trawl/seines 18-24m, increased their use of fuel during 212. Lower fuel consumption was generally the result of decreased number of days spent at sea and better fuel efficiency. However, the question of how much further fuel efficiency rationalisation can occur without significant investments in new technologies remains. For newer vessels perhaps the limit has been reached or at least rationalisation has slowed down. The general trend since the beginning of the 2s is a decrease in capacity, i.e. in the number of vessels that also reflects reduction of total engine power and gross tonnage. This is partly due to management efforts directed at decreasing fleet size in order to bring it in balance with the resources. But that is not the whole truth since a part of the decrease is due to the fact that many fishermen have left the sector since they can no longer make a living from fishing. Some of the fishermen operating inside the pelagic fishing rights system sold their rights and left the sector while others just left the sector without being compensated. The profitability of the diminishing Swedish fleet is increasing perhaps not as fast as expected due to decreasing quotas. The analysis of economic performance shows that all Swedish segments with vessels over 12 m are making positive net profits. The segments with vessels with a length of less than 12 m and fishing with passive gear are all making negative net profits. The segments fishing with passive gear are heavily affected by increasing populations of seals in recent years. There is also a crew recruitment problem as jobs on board fishing vessels is not a particularly attractive way of making a living for younger people due to the low wages and relatively poor working conditions compared to other jobs on land. This poor recruitment is reflected in the increasing average age of Swedish fishermen. This coupled with a decreasing fleet size is expected to continue for some time. Data issues Since 28, the Swedish data collection is mostly based on census data mixed with a census survey in order to distinguish specific cost items. The introduction of a tradable fishing right system has affected the 21 data. Half of the vessels that had more than half of the total landings value left the fleet. There are most probably
339 214 Annual Economic Report on the EU Fishing Fleet incomes in the other income variable that result from selling quotas. The effect is that the profitability of 21 is higher than it should be (since incomes and costs from fishing rights should be kept outside in this analysis). At the same time some costs incurred from buying fishing rights may have been recorded in the variable other costs, as well as, in the in year investments variable. Sweden is currently performing an evaluation of the introduction of the fishing right system. There are no other major data issues in the Swedish DCF data. The main problems had previously stemmed from changes in certain methodologies over time, which interrupted time series data especially for expenditure data. One example is the issues with the estimation of capital costs. Since few, if any, new vessels have been built or even entered the Swedish fleet in recent years, reliable observations on price per capacity unit to use as input in the PIM-model are hard to find. Sweden tries to work around this issue by estimating insurance values for each vessel from a survey. The insurance values are later used as a base for estimating the price per capacity unit used in the model. However there are issues connected with using insurance values since they may include or exclude certain values. Old wooden vessels cannot be insured and newer vessels normally don t need full insurance since part of the vessel is insured by guarantees. This issue has now been taken into consideration by using different models for estimating price per capacity unit for the Swedish data. Another important issue is clustering. With a small and diminishing fleet, Sweden is forced to cluster all of the economic data and also report cluster definitions. At the same time Sweden is recommended to report unclustered transversal data on capacity, landings etc. Previously Sweden used different clusters for different years but has now worked around this problem, back-calculating all data, and is now using the same clusters for the whole DCF period. This makes it easier to follow trends. Most of the Swedish data comes from registers but cost data is collected separately. Sweden uses mandatory questionnaires for data on costs (combined with tax declarations from registers). Previously, Sweden used probability sampling when sending out the questionnaires. Since 212, questionnaires requesting 211 data are sent to all vessels (census). Instead of getting 6% response from a 5% sample, Sweden now gets more than 8% response from a census sample, i.e. the number of data points has increased threefold. 337
340 Table Main socio-economic performance indicators by fleet segment in the Swedish national fishing fleet in 212. Development trend based on % net profit margin 212 to average net profit margin Arrows indicate change ( ) 212 to 211: ( ) increase; ( ) decrease and ( ) stable/no change ( between -1 and +1%) National Chapters Fleet segment No. of vessels (N) % FTE (N) % Days at sea (days) % Energy consumption (litres) % Value of landings (thousand ) % Weight of landings (thousand tonnes) % GVA (thousand ) % GVA per FTE ( /FTE) % Gross profit (thousand ) % Net profit (thousand ) % Net profit margin (%) % Profitability (212) Net profit margin % average (28-11) Economic development trend SWEAREA27DFNVL1 67-1% % % % 814 1% % 458-4% % % % -5-76% Weak 8% Improved SWEAREA27DFNVL % 93 11% 1532 % % % 287 4% 393 4% % % % % Weak 55% Improved SWEAREA27DFNVL % 14-37% % % 166-8% 851-6% % % % % % High 536% Improved SWEAREA27DTSVL % 56-6% 499 5% % % 155 4% % % % % 5 176% Reasonable 153% Improved SWEAREA27DTSVL % 117 % % 547 9% % % % % % % 1 168% Reasonable 33% Improved SWEAREA27DTSVL % 156 9% 735 1% % % % % % % % 7-47% Reasonable -51% Deteriorated SWEAREA27DTSVL % 26-1% % % % % % % % 573 1% 8 15% Reasonable -23% Deteriorated Data source: DCF 214 Fleet Economic (MARE/A3/AC(213)). 338
341 million Performance indicators (miilion ) % Price /kg Landings value (million ) Landings weight (tousand tonnes) GT, kw (thousands) no. of vessels, FTE thousand days Energy consumption (million litres) million / thousand tonnes 214 Annual Economic Report on the EU Fishing Fleet ,5 3, 2,5 2, 1,5 1, Vessel power Employed Vessel tonnage No. Vessels Days at sea Fishing days Landings value Landings income Landings weight Atlantic cod European plaice Saithe(=Pollock) Common shrimp Greenland halibut Atlantic cod Common shrimp European plaice Greenland halibut Saithe(=Pollock) Atlantic cod Common shrimp European plaice Greenland halibut Saithe(=Pollock) 7% 5% 3% 1% -1% Landings income Direct income subsidies Other income Fishing rights income Income GVA Net profit GVA to Revenue Net profit margin 339
342 214 Annual Economic Report on the EU Fishing Fleet 5.23 UNITED KINGDOM Fleet Structure, Fishing Activity and Production In 213, the UK fishing fleet consisted of 6,46 registered vessels, with a combined gross tonnage of 21, GT, a total power of 84, kw and an average age of 25 years. The size of the UK fishing fleet decreased between 28 and 213, with the number of vessels falling by 6% and GT and kw decreasing by 6% and 7% respectively (Table ). The major factor causing the fleet to decrease was technological creep exacerbated by a lowering of the average age of the fleet, large parts of which are under the application of effort controls. In 212, the number of fishing enterprises in the UK fleet totalled 4,357, a small decrease from the previous year. In 213 this number decreased by 7% despite the total number of vessels decreasing only 1%. This is symptomatic of a trend of large businesses consolidating and purchasing smaller enterprises (Table ; Figure ). Total employment in 212 was estimated at 12,445 jobs, corresponding to 9,868 FTEs. The level of employment decreased between 28 and 212, with total employed decreasing by just 1.3% and the number of FTEs decreasing by just.9% over the period. The major factors causing employment to decrease relate to the declining number of fishing vessels and a continued substitution of capital for labour. Table UK national fleet structure, activity and production trends: Arrows indicate change ( ) 212 to 211: ( ) increase; ( ) decrease and ( ) stable/no change ( between -1 and +1%) Structure Employment Fishing Effort Production Variable NATIONAL FLEET % Total No. Vessels (#) 6,791 6,614 6,539 6,466 6,413 6,46-1% 6,43 No. of Inactive vessels (#) 2,89 1,963 1,958 1,818 1,83 1,954 1% 1,876 Average vessel age (year) % 24 Vessel tonnage (tonne) % 197 Vessel power (kw) % 799 No. of Enterprises (#) 4,428 4,395 4,323 4,368 4,357 4,49 % Total employed (#) 12,614 12,212 12,73 12,45 12,445 12,389 % FTE (#) 9,957 1,55 1,285 9,764 9,868 9,87 1% Average wage per employed (thousand ) % Average wage per FTE (thousand ) % Days at sea (thousand days) % Fishing days (thousand days) % Energy consumption (milion litres) % Energy consumption per landed tonne (l/t) % Landings weight (thousand tonnes) % Landings value (million ) % Recreactional catches of selected species (T) Data source: DCF 214 Fleet Economic (MARE/A3/AC(214)); data for 213 and 214 are provisional. In 213 the UK fleet spent a total of around 39, days at sea. The total number of days at sea has fallen steadily between 28 and 213 by around 13%. The major factors causing the decrease in days at sea include continuing falls in the days that are permitted to be spent at sea under the CFP effort controls for some UK fleets. The quantity of fuel consumed in 212 totalled around 269 million litres, a decrease of around 1% from 28 (Table , Figure ).The major factors causing the decrease in fuel consumption include decreases in vessel numbers and days at sea, increasing fuel efficiency of newer engines and the rising cost of fuel. The total weight landed by the UK fleet in 212 was 621 thousand tonnes of seafood, with a landed value of 942 million. The total weight of landings increased by 11% over the period , in the same period, value of landings has increased by 23%. In 212, mackerel generated the highest landed value ( 191 million) by the national fleet, followed by Norway lobster ( 137 million), scallops ( 7 million), monkfish/anglers ( 54 million) and then herring ( 46 million). In terms of landings weight, in 212 mackerel was 169 thousand tonnes, followed by herring (87 thousand tonnes), and then haddock (35 thousand tonnes). The major factors causing the changes 355
343 National Chapters in weight and value of landings include a decline in mackerel landings and an increase in herring landings. The potential benefit to the fleet of an increase in landings of haddock was largely cancelled out by a fall in price. The changes in prices obtained for these key species varied between 211 and 212. Norway lobster achieved the highest average price per kilo in 212 ( per kg), followed by monkfish/anglers ( 4.46 per kg). While the inverse relationship between price and quantity largely prevails, it does not explain the fall in price of mackerel. Mackerel accounted for 25% of the total landings value obtained by the UK fleet in 211, decreasing to 2% of total income in 212, while Norway lobster remained largely stable, increasing from 14% in 211 to 15% in 212. The decline in importance of mackerel reflects both the drop in landings and the decline in its price. The 6% fall in Norway lobster landings between 211 and 212 was compensated for by a 7% increase in price, a seemingly inelastic response that may reflect price inflation in other foodstuffs and a different (domestic rather than export) market from mackerel (Figure ). Landings weight (thousand tonnes) million / thousand tonnes Average price ( /kg) GT, kw (thousands) Vessel power Vessel tonnage No. Vessels FTE Total employed Landings value Landings income Landings weight no. Vessels, employment (thousand) thousand days Days at sea Fishing days Energy consumption Anglerfishes Atlantic mackerel Norway lobster 5 Atlantic herring Great Atlantic scallop million litres Landings value (million ) Anglerfishes Atlantic mackerel Atlantic herring Great Atlantic scallop Anglerfishes Atlantic herring Atlantic mackerel Great Atlantic scallop Norway lobster Data source: DCF 214 Fleet Economic (MARE/A3/AC(214)); data for 213 are provisional. Figure UK fleet: main trends Top left capacity and employment; top right fishing effort and fuel consumption; middle left landings in value and weight; middle right average landed prices of top 5 species in terms of value landed in 212; bottom left landed value of top 5 species in terms of value landed in 212; and bottom right landed weight of top 5 species in terms of value landed in
344 214 Annual Economic Report on the EU Fishing Fleet National Fleet Economic performance The total amount of income generated by the UK national fleet in 212 was 972 million. This consisted of 944 million in landings value and 28 million in non-fishing income. From non-fishing income increased by over 16% partially due to demand for guard work in areas with a thriving oil industry. The UK fleet s total income increased 2% between 21 and 212. Total operating costs incurred by the UK national fleet in 212 equated to 769 million, amounting to 79% of total income. Crew cost and fuel costs, the two major fishing expenses, were 232 and 188 million respectively. Between 28 and 212, total operating costs increased by 17%, largely due to an increase in fuel costs, which amounted to 24% of total income in 212 (Table ; Figure ). In terms of economic performance, the total amount of Gross Value Added (GVA), gross profit and net profit generated by the UK national fleet in 212 were 436 million, 23 million and 155 million, respectively. Gross Value Added (GVA) and gross profit remained largely stable between 211 and 212 whilst net profit decreased by 2%. This slight decline in economic performance can largely be attributed to an 11% increase in fuel costs despite the number of days at sea remaining the same. The fleet has attempted to adjust to this by reducing spending on other more minor costs. The UK fleet had an estimated (depreciated) replacement value of 539 million in 212 and an estimated value of fishing rights of 77 million in 212. Investments by the fleet amounted to 48 million in 212. The major factors causing a change in the capital value of the fleet include a rise of 3% in the value of fishing rights between 21 and 211 (Table ; Figure ). Table UK national fishing fleet economic performance in and projections for 213 Development trend based on % net profit margin 212 to average net profit margin Arrows indicate change ( ) 212 to 211: ( ) increase; ( ) decrease and ( ) stable/no change ( between -1 and +1%) Variable (million ) National Fleet % Income Costs Economic Indicators Capital value Profitability and development trends Landings income % Other income % Labour costs % Energy costs % Repair costs % Other variable costs % Other non-variable costs % Capital costs % GVA % Gross profit % Net profit % Depreciated replacement value % Investments % Net profit margin (%) % development trend Improved 16% RoFTA (%) % development trend Improved 26% GVA per FTE (thousand ) % development trend Improved 17% Data source: DCF 214 Fleet Economic (MARE/A3/AC(214)); data for 213 are provisional. 357


345 million Performance indicators (million ) Landings income Other income Revenue GVA Gross profit Net profit million % National Chapters Crew wage costs Unpaid labour Energy costs Repair costs Other variable costs Other non-variable costs Annual depreciation GVA to Revenue Gross profit margin Net Profit margin RoFTA Data source: DCF 214 Fleet Economic (MARE/A3/AC(214)); data for 213 are provisional. Figure UK main economic performance trends Top left income structure; top right cost structure; bottom left economic performance indicators; bottom right performance indicators as a % of revenue (landings income + other income) (projected figures for 213). Fleet Segment Level Economic performance The UK fleet is highly diversified with a broad range of vessel types targeting different species predominantly in ICES areas II (Bering Sea), IV (North Sea), V and VI (West of Scotland) and VII (English Channel and Western Approaches) (Figure ). The national fleet consisted of 29 (DCF) fleet segments and 6,413 vessels in 212, with 3 inactive length classes consisting of 183 vessels. Two of the active fleet segments made losses in 212 while 23 made a reasonable or better profit. 13 fleet segments improved their profitability while 12 segments showed deterioration. Figure GBR effort and landings by FAO fishing area, 212 Colour shows fishing days (thousand days) and landings in weight (thousand tonnes); Value shows days-at-sea (thousand days) and landings in value (thousand ). Source: DCF 214 Fleet Economic (MARE/A3/AC(214)) 358
346 214 Annual Economic Report on the EU Fishing Fleet Table and Table provide a breakdown of key performance indicators for all UK fleet by main fishing activity. Table provides a breakdown of key performance indicators for all UK fleet segments in 212. A short description of the three most important segments in terms of total value of landings is provided below. These three fleets alone contribute more than 5% of fleet total landings value. Pelagic Trawl>4m 32 vessels make up this segment which operates predominantly in ICES areas IIa, IVa, VIa and VII. The fleet targets pelagic species, mainly mackerel and herring. In 212, the total value of landings was just over 25 million and around 326 FTEs were employed in this fleet segment, contributing 26% of the UK fleet total income from landings and 3% of FTEs generated by the UK fishing fleet. This fleet segment was profitable, with a reported gross profit of around 9 million and net profit of 79 million in 212. The volume of landings increased by 1% but weaker prices meant value of landings dropped by 5% compared to the previous year. Demersal Trawl and Seine 24m to <4m 96 vessels make up this segment which operates predominantly around the UK coast in ICES areas II, IV, Vb, VI, and VII. The fleet targets a variety of species but in particular the demersal species, such as monkfish, cod, haddock and whiting, and the shellfish species, Norway lobster. In 212, the total value of landings was 132 million and around 1167 FTEs were employed in this fleet segment, contributing 14% of the total income from landings and 12% of FTEs generated by the UK fishing fleet. This fleet segment was profitable, with a reported gross profit of around 26 million and net profit of 2 million in 212. Demersal Trawl and Seine 18m to <24m 182 vessels make up this segment which operates predominantly around the UK coast in ICES areas II, IV, Vb, VI, and VII. The fleet targets a variety of species but in particular the demersal species, such as monkfish, cod, haddock and whiting, and the shellfish species, Norway lobster. In 212, the total value of landings was 15 million and around 1,496 FTEs were employed in this fleet segment, contributing 11% of the total income from landings and 15% of FTEs generated by the UK fishing fleet. This fleet segment was profitable, with a reported gross profit of around 2 million and net profit of almost 14 million in 211. The fleet has been fairly stable in terms of capital and FTEs employed. The 7% decrease in the value of landings coupled with the 5% decline in the volume of landings suggests prices for the fleet segment s products remain relatively stable. Assessment and Future Trends National Fleet The increase in the value of landings of 23% from 28 to 212 matches the 23% increase in the consumer price index for fish and seafood. The decline in landings of mackerel has been compensated for by increases in herring and the other species important to the UK fleet. The number of vessels continues to fall steadily from 6,791 in 28 to 6,46 in 213 but the falling average age suggests that there has been little if any fall in capacity, newer boats being more effective than older ones. The fall in FTEs from 1,55 in 29 there was a decommissioning scheme in 28 which distorts the impression for that year - to 9,868 in 212 suggests that the cost of labour is continuing to cause substitution of capital for labour but the magnitude of the trend is not unduly strong. While overall the fleet is profitable, with 16% of income being retained as net profit, there are considerable variations within the fleet segments and these are inconsistent within the segments or according to vessel size or according to the number of vessels within a segment offering little indication of the cause of the variability. The value of fishing rights showed a sharp increase of 3% between 21 and 211 and a slight increase of 2% between 211 and 212 reflecting optimism about the prospects of the industry. Energy efficiency of the fleet continued to improve, by 4%, between 211 and 212, a consequence of the decreasing average age of vessels in the UK fleet. The impending ban on discarding looks likely to have a significant impact on the economic performance of the UK fishing fleet. A recent report commissioned by Seafish 1 suggests accessing additional quota is vital to the implementation of the ban. With estimates indicating quota leasing costs on the rise, this will reduce profitability
347 National Chapters for segments of the fleet. Furthermore, there is no certainty that, under the ban, quota leasing markets and international swap agreements will operate in the same manner. In addition, the UK government has recently re-allocated quota from the over 1m sector to the under 1m sector. This invoked a legal challenge that ultimately failed. The under 1m fleet segments may therefore benefit from access to this quota with vessels it was taken from possibly needing to access additional quota or reduce effort. There has been a significant increase in landings of both scallops and nephrops into the UK from foreign vessels. Both weight and value of these landings have nearly doubled in 212. This influx of vessels has largely come from the North Sea fishery into the fishery West of Scotland and has led to a shortage of kilowatt days-at-sea to catch the quota. Small-Scale Fleet Although value of landings for the UK fleet saw a slight drop from 211 to 212 the small scale fleet saw a 7% increase. This is despite 3 Marine Protected Areas being implemented in England and a 5% decrease in the number of vessels making up the fleet. In terms of economic performance, the total amount of Gross Value Added (GVA), gross profit and net profit generated by the small scale fleet in 212 were 59 million, 17 million and 11 million respectively. All three variables saw increases of around 15% between 211 and 212. This increase in economic performances comes in spite of rising costs and largely due to a 12% increase in Landings income and 65% increase in other income. As 211, 9% of income is retained as net profit. As mentioned previously the reallocation of quota from the over 1m sector to the under 1m sector was upheld by judicial review which will benefit the Small Scale Fleet going forward. Distant-Water Fleet The UK distant water fleet consists of a few very large vessels fishing in Arctic waters and in the northern Atlantic near Greenland. The value of landings remained fairly steady at around 12 million between 21 and 211. Little other information can be separated from the aggregate because the size of the fleet is too small to protect the commercial sensitivity of the data. A ban on bottom trawling and the introduction of capacity limits has been proposed by the European Commission for the distant waters fleet. In the short term this seems destined to reduce landings and GVA as well as directly impact employment. The longer-run effects are hard to judge. Potentially these rules could limit the growth of the fishery if new opportunities emerge. A longer trend of the main indicators analysed, including data from the Data Collection Regulation (DCR, 22-27), is provided at the end of this chapter. Data issues There have been no significant data issues in producing this chapter, and the coverage and quality appear to be good. The reader should note that UK fleet revenues and costs do not include trade in quota. Quota trades take two forms; transfer in perpetuity and transfers for a defined period, usually one year - generally called leasing. There are two components within each of these. First, there is the windfall accruing to those enjoying the initial allocation of the resource in 1999 and secondly the normal capital gain or loss arising on transfer of the asset. Only the latter should be included in the accounts used in this report. However, it is impossible to identify the contribution of each component, but as the proportion of the total value is declining with each transfer of the original allocation, the problem will disappear as time goes by. Initially, however, the windfall component will be by far the greater proportion and hence for the time being omission of transfers limits any distortion of the fleet profitability figures. 36
348 214 Annual Economic Report on the EU Fishing Fleet Table UK national fleet structure, activity and production trends by operational scale: Arrows indicate change ( ) 212 to 211: ( ) increase; ( ) decrease and ( ) stable/no change ( between -1 and +1%) Structure Employment Fishing Effort Output Variable Small scale Fleet % Large scale fleet No. Vessels (#) 3,11 3,97 3,111 3,211 3,176 3,56-1% 1,63 1,559 1,474 1,44 1,41 1,397-2% Vessel tonnage (thousand GT) % % Vessel power (thousand kw) % % Total employed (#) 5,665 5,433 6,28 6,229 5,468 5,76-12% 6,949 6,779 6,495 6,176 6,968 6,266 FTE (#) 1,944 2,23 2,162 2,155 2,32-6% 8,13 8,32 8,123 7,69 7,836 3% Average wage per employed (thousand ) % % Average wage per FTE (thousand ) % % Days at sea (thousand days) % % % Fishing days (thousand days) % % Energy consumption (milion litres) % % Energy consumption per landed tonne (l/t) % % Landings weight (thousand tonnes) % % Landings value (million ) % % Data source: DCF 214 Fleet Economic (MARE/A3/AC(214)); data for 213 are provisional. Table Economic performance of the UK national fishing fleet by operational scale: Development trend based on % net profit margin 212 to average net profit margin Arrows indicate change ( ) 212 to 211: ( ) increase; ( ) decrease and ( ) stable/no change ( between -1 and +1%) Variable (million ) Small scale Fleet % Large scale fleet % Income Costs Economic Indicators Capital value Profitability and development trends Landings income % % Other income % % Labour costs % % Energy costs % % Repair costs % % Other variable costs % % Non-variable costs % % Capital costs % % GVA % % Gross profit % % Net profit % % Depreciated replacement value % % Investments % % Net profit margin (%) % % development trend Improved 9% Improved 14% RoFTA (%) % % development trend Improved 22% Improved 29% GVA per FTE (thousand ) % % development trend Improved 1% Improved 18% Data source: DCF 214 Fleet Economic (MARE/A3/AC(214)); data for 213 are provisional. 361
349 Table Main socio-economic performance indicators by fleet segment in the UK national fishing fleet in 211. Development trend based on % net profit margin 212 to average net profit margin Arrows indicate change ( ) 212 to 211: ( ) increase; ( ) decrease and ( ) stable/no change ( between -1 and +1%) National Chapters Fleet segment No. of vessels (N) % Data source: DCF 214 Fleet Economic (MARE/A3/AC(214)) FTE (N) % Days at sea (days) % Energy consumption (litres) % Value of landings (thousand ) % Weight of landings (thousand tonnes) % GVA (thousand ) % GVA per FTE ( /FTE) % Gross profit (thousand ) % Net profit (thousand ) % Net profit margin (%) % Profitability (212) Net profit margin % average (28-11) Economic development trend GBRAREA27DFNVL % % % 254-7% % % % % % % 13 15% High 189% Improved GBRAREA27DFNVL % 3-8% % % % % % % % % % High 186% Improved GBRAREA27DFNVL % 69 12% 24 % 83-5% 635 3% % % % 159 2% % % High 46% Improved GBRAREA27DFNVL % 29-9% % % % % % % % % 25 27% High 47% Improved GBRAREA27DRBVL % % % % % % 63 9% % % % 1-38% Reasonable -42% Deteriorated GBRAREA27DRBVL % 349 7% % % % % % % % % 14-36% High -41% Deteriorated GBRAREA27DRBVL % 176-3% % % % % 137 % % % % 34 7% High 28% Improved GBRAREA27DRBVL % 37 6% % % % % % % % % 24-14% High -3% Stable GBRAREA27DTSVL % 35-7% % % % 67 23% % % % % 2-78% Reasonable -41% Deteriorated GBRAREA27DTSVL % 28-4% % % % % % % % 125-3% 1-27% Reasonable -5% Stable GBRAREA27DTSVL % % % % % % % % % % 15-1% High 23% Improved GBRAREA27DTSVL % % % % % % % % 224-1% % 12-9% High 37% Improved GBRAREA27DTSVL % % % % % % % 46. 8% % % 15-22% High 27% Improved GBRAREA27DTSVL4XX 12-8% % % % % % % % % % % High -56% Deteriorated GBRAREA27FPOVL % % % % % % % % 638-3% % 4-65% Reasonable -54% Deteriorated GBRAREA27FPOVL % 335-3% % % % 871-2% % 36. 1% % % % High 61% Improved GBRAREA27FPOVL % 349-8% % % % % % % % % % High 79% Improved GBRAREA27FPOVL % 14-31% % 24-22% % % % % % % 17 12% High 72% Improved GBRAREA27HOKVL1 57 8% 198 % % % % % % % % % -4 53% Weak 58% Improved GBRAREA27HOKVL % % 39-14% % % % % % % % 2 24% High 11% Improved GBRAREA27PGPVL % 73 17% % % % % % % % 5 21% 9 66% Reasonable 255% Improved GBRAREA27PSVL4XX 32 3% % % % % % % % % % 31 8% High 33% Improved GBRAREA27TBBVL1 21 5% 27 89% % % % % % % % % % High 194% Improved GBRAREA27TBBVL % % % % % % % % % 4 11% 1% Reasonable 11% Improved GBRAREA27TBBVL % % % % % % % % % % % High 3498% Improved GBRAREA27TBBVL % 397 6% % % % % % % % % % Weak -557% Deteriorated
350 214 Annual Economic Report on the EU Fishing Fleet GT, kw (thousands) Vessel power Employed million Performance indicators (miilion ) % Landings value (million ) Landings value (million ) Anglerfishes Atlantic mackerel Norway lobster Landings income Direct income subsidies Vessel tonnage No. Vessels Atlantic herring Great Atlantic scallop Other income Fishing rights income no. of vessels, employed (thousands) Thousand days Days at sea Energy consumption Fishing days Anglerfishes Atlantic herring Atlantic mackerel Great Atlantic scallop Norway lobster Income GVA Net profit Million litres Landings weight (tousand tonnes) million / thousand tonnes Landings value Landings weight Landings income Anglerfishes Atlantic herring Atlantic mackerel Great Atlantic scallop Norway lobster 8% 7% 6% 5% 4% 3% 2% 1% % -1% GVA to Revenue Net profit margin 363
351 214 Annual Economic Report on the EU Fishing Fleet 6. AER REPORT METHODOLOGY Background The data used to compile all the various analyses contained within the report were collected under the frameworks of the Data Collection Regulation (DCR); cf. Council Regulation (European Commission (EC)) No 1543/2 of 29 June 2 and the data collection framework (DCF), cf. Council regulation (European Commission (EC) No 199/28 of 25th February 28). The 214 data call for economic data on the EU fishing fleet for EU Member States was the sixth data call to be requested under the DCF. This year s fishing fleet economic data call was issued by DG MARE on the 3 February 214 with a one month deadline (3 March 214). The 214 data call requested economic data for the years 28 to 214. Capacity data was requested up to and including 214, while employment and economic parameters were requested up to and including 212. Most effort and all landings data were requested up to and including 213, as well as, income from landings (non-mandatory) to allow for economic performance projections to be estimated at fleet segment and national level for 213. The table below outlines all the DCF economic and transversal variables to be submitted for the years , along with their uploading acronyms and corresponding aggregation levels. All the various definitions for variables, aggregation levels, gear types, length classes, DCF supra regions, FAO sub regions, species, sampling strategies and precision levels can be found by navigating through the data collection website. See Additionally, data held in the EU Fleet Register was used to complement the fleet capacity data (number of vessels, gross tonnage and engine power) for trend analysis as the data submitted under the DCF was not complete for the entire period considered. For example, capacity data for Greece was only available for 212. At the time of the data extraction, Croatia was not yet covered by the EU Fleet Register
352 AER METHODOLOGY 6.1. DCF VARIABLES REQUESTED Table DCF Fleet economic data call contents for years Data Type Economic Variable group Variable Acronym Years Aggregation level Other requested fields Fishing Enterprises Employment Income Expenditure (Cost) Capital and Investments Capacity One Vessel Two to Five Vessels Six or More Vessels Employment FTE Harmonised FTE OneVes TwoFiveVes SixMoreVes totjob totnatfte totharmfte Landings Income totlandginc * Rights Income Direct Subsidies Other Income Crew Wage Unpaid Labour Energy Costs Repair & Maintenance Costs Other Variable Costs Non-Variable Costs Rights Cost Annual Depreciation Depreciation replacement Fishing Rights Investment Financial Position Number of Vessels Average LOA GT kw Average Vessel Age Sea Days Fishing Days kw Fishing Days GT Fishing Days totrightsinc totdirsub tototherinc totcrewwage totunpaidlab totenercost totrepcost totvarcost totnovarcost totrightscost totdepcost totdeprep totrights totinvest FinPos totves avgloa totgt totkw avgage totseadays totfishdays totkwfishdays totgtfishdays Yearly by: 1. Fleet segment 2. National totals Yearly by: 1. Fleet segment, Supra Region 2. National totals Yearly by: 1. Fleet segment, FAO Area level 4 (Baltic), FAO Area level 3 (all other regions) 2. National totals Sampling Strategy, Achieved Sample Rate, Coefficient of Variation (CV) (For national totals, only achieved sample rate is requested) * Maximum Sea Days submission not compulsory under DCF Transversal Effort Maximum Sea Days* MaxSeaDays Yearly by: 1. Fleet segment Fishing Operations Traps Nets Length of Nets Hooks Soak Time Trips totfishopr tottraps totnets lngnets tothooks totsoaktime tottrips Energy Consumption totenercons Yearly by: 1. Fleet segment, Supra Region 2. National totals Landings Weight of Landings Value of Landings totwghtlandg totvallandg Yearly by: 1. Fleet segment, FAO Area level 4 (Baltic), FAO Area level 3 (all other regions) 2. National totals Recreational Catches Weight of Catch totwghtcatch Yearly, Region level 2 (see Appendix II) 35
353 214 Annual Economic Report on the EU Fishing Fleet 6.2. CONCEPTS, TERMS AND DEFINITIONS Revenue Revenue the value of production (sale of landed seafood products) and income generated from the use of the vessel in other, non-commercial fishing activities, such as recreational fishing, transport, tourism, oil rig duty, research, etc. May also include insurance payment for gear damage/loss /vessel. Income from direct subsidies and fishing rights are excluded. Gross Value Added (GVA) Gross Value Added - net output of a sector after deducting intermediate inputs from all outputs. It is a measure of the contribution to GDP made by an individual producer, industry or sector. The Gross Value Added indicator calculated in this report is similar, but does not fully correspond to the Value added at factor cost of the Structural Business Statistics. GVA to Revenue Gross value added to revenue ratio - indicates the share of revenue that contributes to the economy through factors of production (returns to labour and returns to capital). Indicator is calculated as the ratio between gross value added and revenue and expressed as a percentage. Gross profit Gross profit the normal profit after accounting for operating costs, excluding capital costs. Also referred to as gross cash flow, i.e. the flow of cash into and out of a sector or firm over a period of time. Gross profit margin (%) Gross profit margin - a measure of profitability that can be used to analyse how efficiently a sector is using its inputs to generate profit. Calculated as the ratio between gross profit and revenue. Expressed as a percentage. Gross profit margin indicates the normal profitability of a firm and is of most interest to fishers as it represents the share of income they are left with at the end of the year. For managers, it may be used as an indication of the viability of an industry in terms of its commercial profitability by measuring the share of cash coming in and out of an industry. A high gross profit margin indicates that the sector has a low-cost operating model; reflects efficiency in turning inputs into outputs. A low percentage value can indicate a low margin of safety, i.e. a higher risk that declines in production or increases in costs may result in a net loss, or negative profit margin. Net profit Net profit is the difference between revenue and explicit costs and opportunity costs. Explicit costs include all operational costs, such as wages, energy, repair and other variable and non-variable costs. Net profit differs from gross profit in that it includes depreciation and opportunity costs of capital. It measures the efficiency of a producer in society s view by evaluating the total costs of inputs (excluding natural resource costs) in comparison to outputs or revenue. Economic profit is the primary indicator of economic performance and is often used as a proxy of resource rent in fisheries. Economic profits emerge as the excess of revenue over the opportunity cost of producing the good. Also referred to as supernormal or abnormal profits. Abnormal profits in a sector is an incentive for other firms to enter the industry (if they can). Zero or a negative profit margin may indicate high competition in the sector and can be used as one of the indicators of overcapacity. Net profit margin (%) Economic profit margin - a measure of profitability after all costs have been accounted for, and reflects the percentage of revenue that a sector retains as profit. It measures the relative performance of the sector compared to other activities in the economy and provides an indication of the sector s operating efficiency as it captures the amount of surplus generated per unit of production. 351
354 AER METHODOLOGY Labour productivity (GVA/FTE): Labour productivity - defined as output per unit of labour. Calculated as Gross Value Added (measure of output) by full-time equivalent (FTE) employment (unit of labour input). Labour productivity can be used as a measure of economic growth, competitiveness, and living standards within a sector. An increase in labour productivity indicates that a unit of input labour is producing more output or that the same amount of output is being produced with fewer units of labour. Labour productivity may also provide an indicator of worker s wellbeing or living standards, assuming that increases in productivity are matched by wage increases. Capital productivity Capital productivity - the return of the investment divided by the cost of the investment, also referred to as ROI (Rate on Investment). It measures profits in relation to capital invested, i.e. indicates how profitable a sector is relative to its total assets. The higher the return, the more efficient the sector is in utilising its asset base. As data on intangible assets (e.g. fishing rights, natural resource) are not always available in fisheries, the Return on Fixed Tangible Assets (ROFTA) is used as an approximation of ROI. Fuel efficiency Fuel efficiency - ratio between the quantity of energy consumed and the quantity of output (e.g. landing value or weight). Calculated as the amount of litres of fuel consumed for each kilogram of fish landed (litres per tonne landed). Fuel efficiency may vary considerably in function of fishing effort and specific fisheries characteristics such as fishing gear and targeted species ECONOMIC PERFORMANCE INDICATOR CALCULATIONS From the data submitted by Member States, indicators were calculated in order to assess the economic performance of fleet segments, national fleets, regional fleets and the EU fleet as a whole. All values are presented in nominal terms unless otherwise stated. For economic performance calculations relating to the years , the following formulas were used: Total Revenue: Total Revenue = Income from landings + income from fishing rights + other income + direct subsidies Revenue (Income): Revenue = Income from landings + other income Gross Value Added (GVA): GVA = Income from landings + other income energy costs repair costs other variable costs non variable costs Gross Profit (GRP): GRP = Income from landings + other income crew costs unpaid labour - energy costs repair and maintenance costs other variable costs non variable costs Net Profit/Loss: Net Profit = Income from landings + other income crew costs unpaid labour - energy costs repair costs other variable costs non variable costs depreciation cost opportunity cost of capital Where opportunity cost of capital = fixed tangible asset value * real interest Where real interest (r) = [(1 + i)/ (1 + π)] -1. Where i is the nominal interest rate of the Member State in the year concerned and π is the inflation rate of the Member State in the year concerned. See Table
355 214 Annual Economic Report on the EU Fishing Fleet Table 6.2 Inflation and nominal LT interest rates by EU Member State Inflation LT (nominal) Interest rate BEL BGR CYP DEU DNK ESP EST : : FIN FRA GBR GRC HRV IRE ITA LTU LVA MLT NLD POL PRT ROU SVN SWE Rate of Return on Fixed Tangible Assets (RoFTA): ROFTA = (net profit + opportunity cost of capital) / tangible asset value (vessel depreciated replacement value) Break-even revenue (BER): BER = (Fixed costs + opportunity costs of capital +depreciation) / (1-(crew costs + unpaid labour + energy costs + repair and maintenance costs + other variable costs)/revenue) Revenue to Break-even revenue Ratio (CR/BER): CR/BER = revenue / break-even revenue = Income from landings + other income / BER CR/BER gives an indication of the short term profitability of the fleet/fleet segment (or over/under capitalised): if the ratio is greater than 1, then enough cash flow is generated to cover fixed costs (economically viable in the short term). If the ratio is less than 1, insufficient cash flow is generated to cover fixed costs (indicating that the segment is economically unviable in the short to mid-term) ECONOMIC PERFORMANCE INDICATOR CLASSIFICATIONS Development trend The development trend, calculated as the change between 212 and the average value , for the economic performance indicators analysed, such as GVA, gross profit, net profit and GVA/FTE were classified as High, Reasonable or Weak according to the criteria in Table
356 AER METHODOLOGY Table 6.3 Development trend classification Development - change 211/28-21 average >5% Improved -5% - 5% Stable < -5% Deterioration Based on: Pavel, AER 25 Profitability Profitability, as net profit (or net profit as a % of income, where income includes income from the sale of fish and other non-fishing income and excludes direct income subsidies and income from fishing rights) was classified as High, Reasonable or Weak according to the criteria in Table 6.4. Table 6.4 Profitability classification Profitability: Net profit margin in 212 >1% High Profitability is good and segment is generating a good amount of resource rent -1 % Reasonable Segment is profitable generating some resource rents <% Weak The segment is making losses; economic overcapacity 6.5. ECONOMIC PERFORMANCE PROJECTIONS For economic performance forecasts at fleet segment and national level, the following formulas were used: Crew wages (CW) were estimated as an average proportion of the value of landing (VaL) during the three previous years: CW t t 3 t 1 t 3 t 1 CW VaL VaL t Non-variable costs (NVC) were estimated using the change in capacity i.e. number of vessels (N): NVC t N N t t 1 NVC t 1 Variable costs (VC) are projected using changes in effort, i.e. Days at Sea (DAS): VC t DAS DAS t t 1 VC t 1 The same method applied to variable costs is applied to repair and maintenance costs. Fuel costs (FC) are projected using changes in effort (DAS) and change in average fuel price (P): DASt FC t DAS t 1 Pt P t 1 FC t 1 354
357 214 Annual Economic Report on the EU Fishing Fleet 6.6. DISAGGREGATION OF ECONOMIC DATA Fleet economic data cannot be collected at higher resolution than defined in the DCF. Only landings (value and weight) and effort data (days at sea, fishing days, etc.) are provided by Member States at the sub-region level by fleet segment. Therefore, the correlation with transversal data is the only viable way for disaggregating economic data at the sea basin level (Baltic, North Sea, N Atlantic, and Mediterranean & Black Sea). Several assumptions can be made based on correlations between transversal and economic data, which were previously examined during the PGECON workshop in Hamburg 212. However, these analyses are still preliminary and considered as work in progress. PCEGON (213) strongly recommended a study on the disaggregation that delivers a comprehensive analysis of different approaches and methods, while also addressing the availability of individual data which varies by MS. Seeing that the methodology is still to be validated, this exploratory exercise set out to estimate the economic performance indicators at the sea basin level (Baltic, North Sea, N Atlantic, and Mediterranean & Black Sea) by MS and fleet segment. For this exercise, transversal and economic data by fleet segment were disaggregated based on either the value of landings or effort (days at sea), as: (1) Value of landings (VaL) used to allocate crew costs, costs for fishing rights and all income indicators; (2) Effort in days at sea (DAS) used to allocate fuel costs, repair and maintenance costs, depreciation and variable and non-variable costs; number of vessels, capacity and employment indicators. This year, the number of vessels operating in the region (N reg ) was provided by Member States with their data submissions. The number of vessels operating in the region was used disaggregated other capacity data, using the ratio between the variable and the total number of vessels for the fleet segment, multiplied by the number of vessels in the region (Nreg). For example to disaggregate the capacity variables GT and kw: GT reg GT N Tot Tot N Re g kw reg kw N tot Tot N Re g This method was also used to disaggregate employment variables. Regional employment (FTE reg ) was desegregated using the ratio between the number of vessels operating in the region and the total number of vessels, multiplying by total FTE. FTE reg FTE N Tot Tot N Re g To disaggregate income, the ratio between the value of landings (VaL) in the region and the total value of landings for the fleet segment multiplied by Income was used. For example, to estimate Landings income (LInc) and other income (OInc): LandingsIncome reg VaL ( LInc) VaL reg tot LInc tot 355
358 AER METHODOLOGY OtherIncom e reg Val ( OInc) Val reg tot OInc tot To allocate labour costs (CW), the value of landings was used (VaL) as follows: CW reg VaL VaL Reg Tot CWtot The same method was applied to disaggregate unpaid labour. Fuel costs (FC) was allocated based on effort (DAS) as: FC reg DAS DAS Re g Tot FCtot The same method was applied to Repair costs, other variable costs and non-variable costs DATA COVERAGE AND LIMITATIONS In terms of the completeness of the Member States data submissions, most countries submitted the majority of the parameters requested under the call. In many cases missing data relates to fleet segments with low vessel numbers for which data is hard to obtain. This year Greece provided data but only for 212, and with substantial amount of missing data, in particular effort and landings. Croatia submitted DCF data for the first time, providing economic data for the years 211 and 212. Submission from Cyprus, France and Spain continue to be incomplete and some data quality issues remain for several other Member States, such as Bulgaria and Malta. In terms of data quality, inevitably some abnormal estimates for various parameters were detected by JRC or the experts and in many cases rectified by the Member States. However, some quality issues remain outstanding. Furthermore, incomplete time series data due to either the non-submission of data, questionable data and/or new MS additions, make trend analysis at the EU level impossible without excluding the MS fleets that are incomplete. These discrepancies make an evaluation of the overall economic performance of the EU fishing fleet in 212 not possible. Under the DCF, Member States provide transversal and economic data on their fleets at the national level and by fleet segments (combination of main fishing technology and vessel length group at the supra-region level). For this report, national level datasets were used for the EU and Member State level analyses while data submitted at the fleet segment level were used to analyse performance by fleet segment and fishing activity. While in theory both national level and fleet segment datasets submitted by MS should equate, this is not always the case and some discrepancies exist between the two. These discrepancies are mainly due to missing/incomplete datasets at the fleet segment level or the nonsubmission of data due to confidentiality issues. But discrepancies can also be due to the fact that MS cluster (aggregate segments) to avoid breaching secrecy issues when there are too few vessels in a single segment. The result is that some MS appear to be missing fleets segments but these have just been grouped together in a cluster. For consistency, clustering should be applied in the same way for all years. However, in many instances this is not the case and clusters differ from year to years, making time-series hard to follow. Due to these and other data related issues, a complete overview of the EU fishing fleet for all reference years was not possible. 356
359 214 Annual Economic Report on the EU Fishing Fleet Fleets for MS that were unable to deliver all the required and reliable data had to be excluded from the analyses at the EU and Regional levels. To mitigate data deficiencies, a status quo of the EU fleet in 212 was provided considering only Member State fleets for which reliable data was provided while trend analyses included only the MS that provided the necessary data over the entire period (28-213). The National Chapters present all the DCF data provided by MS (some questionable data has been highlighted). The MS that were excluded from the trend analyses and the main reasons for their exclusion were: Bulgaria: coverage and quality considered questionable, employment data unreliable Croatia: coverage and quality considered questionable (errors detected in the estimation procedure); also excluded due to the fact that it is a new MS and therefore, with an incomplete time-series Cyprus: coverage and quality considered questionable; substantial amount of missing data over the entire period France: missing data for essential parts of the data call, such as effort, landings and capital costs in 28 and 29 Greece: partial data available only for 212 Malta: coverage and quality considered questionable; methodology changes in 21 makes time series questionable. Spain: missing data for essential parts of the data call, such as effort and capital costs for most of the period. For confidentiality reasons, Member States may aggregate fleet segments into clusters to provide sensitive economic data. In several cases, clustering may not be enough to guarantee confidentiality, and hence, parts of MS fleets are not covered at all. When fleet segments are clustered to provide economic data, one result may be that some MS fleet segments appear to be missing but these have just been grouped together with other segments, becoming part of a cluster. Another result may be the clustering of fleet segments with different characteristics, such as different vessel length groups or fishing gears, which could bias results when assessing by type of fishing gear or activity, such as small-scale versus large-scale fleet. For example, a fleet segment that would otherwise be considered as small scale (i.e. vessel under 12 m using non-towed gears) may be clustered into a large-scale fleet segment (i.e. vessel under 12m using towed gears), and vice-versa. Hence, results at the fishing activity level should be considered as only indicative of each fishing type. Furthermore, although clustering of fleet segment should be applied consistently, as far as possible, over the period, this is not always the case, making time-series hard to follow. 357
360 214 Annual Economic Report on the EU Fishing Fleet 7. List of Participants EWG 14-4 and Information on STECF members and invited experts affiliations is displayed for information only. In some instances the details given below for STECF members may differ from that provided in COMMISSION DECISION of 27 October 21 on the appointment of members of the STECF (21/C 292/4) as some members employment details may have changed or have been subject to organisational changes in their main place of employment. In any case, as outlined in Article 13 of the Commission Decision (25/629/EU and 21/74/EU) on STECF, Members of the STECF, invited experts, and JRC experts shall act independently of Member States or stakeholders. In the context of the STECF work, the committee members and other experts do not represent the institutions/bodies they are affiliated to in their daily jobs. STECF members and invited experts make declarations of commitment (yearly for STECF members) to act independently in the public interest of the European Union. STECF members and experts also declare at each meeting of the STECF and of its Expert Working Groups any specific interest which might be considered prejudicial to their independence in relation to specific items on the agenda. These declarations are displayed on the public meeting s website if experts explicitly authorized the JRC to do so in accordance with EU legislation on the protection of personnel data. For more information: declarations STECF members: Name Address 1 Tel. STECF members Abella, J. Alvaro (vicechair) ARPAT AREA MARE Tel alvarojuan.abella@arpat.toscana.it Agenzia Regionale per la Protezione Ambientale della Toscana Articolazione Funzionale RIBM Risorse Ittiche e Biodiversità Marina Via Marradi 114, Livorno Italia Andersen, Jesper Levring (vice-chair) Bailey, Nicholas Department of Food and Resource Economics (IFRO) Section for Environment and Natural Resources University of Copenhagen Rolighedsvej Frederiksberg Denmark Fisheries Research Services Marine Laboratory, P.O Box Victoria Road, Torry Aberdeen AB11 9DB UK Bertignac, Michel Laboratoire de Biologie Halieutique IFREMER Centre de Brest BP Plouzane, France Cardinale, Massimiliano Föreningsgatan 45, 33 Lysekil, Sweden Tel.dir.: Tel: +44 () Direct: +44 () Fax: +44 () tel : +33 () fax : +33 () Tel: jla@ifro.ku.dk baileyn@marlab.ac.uk n.bailey@marlab.ac.uk michel.bertignac@ifremer.fr massimiliano.cardinale@slu.se Curtis, Hazel Sea Fish Industry Authority 18 Logie Mill Logie Green Road Edinburgh EH7 4HS Tel: +44 () Fax: +44 () H_Curtis@seafish.co.uk 358
361 Contact details of STECF Members and EWG 14 5 and EWG 14 5 list of participants Name Address 1 Tel. STECF members Delaney, Alyne Daskalov, Georgi Döring, Ralf Innovative Fisheries Management, -an Aalborg University Research Centre, Postboks 14, 985 Hirtshals, Denmark Laboratory of Marine Ecology, Institute of Biodiversity and Ecosystem Research, Bulgarian Academy of Sciences Thünen Bundesforschungsinstitut, für Ländliche Räume, Wald und Fischerei, Institut für Seefischerei - AG Fischereiökonomie, Palmaille 9, D Hamburg, Germany Tel.: Tel.: Tel.: Fax.: ad@ifm.aau.dk gmdaskalov@yahoo.co.uk ralf.doering@ti.bund.de Gascuel, Didier Graham, Norman (chair) AGROCAMPUS OUEST 65 Route de Saint Brieuc, bat.4 CS 84215, F-3542 RENNES Cedex France Marine Institute, Fisheries Science Services (FSS), Rinville, Oranmore, Co. Galway, Ireland Tel:+33() Fax: +33() Tel: + 353() Didier.Gascuel@agrocampusouest.fr norman.graham@marine.ie Garcia Rodriguez, Mariano Gustavsson, Tore Karl Erik Jennings, Simon Kenny, Andrew Kraak, Sarah Kuikka, Sakari Martin, Paloma Instituto Español de Oceanografía, Servicios Centrales, Corazón de María 8, 282, Madrid, Spain Independent Consultant, Göteborg, Sweden CEFAS Lowestoft Laboratory, Pakefield Road, Lowestoft Suffolk, UK NR33 HT CEFAS Lowestoft Laboratory, Pakefield Road, Lowestoft Suffolk, UK NR33 HT University College Cork Based at: Marine Institute, Rinville, Oranmore, Co Galway, Ireland University of Helsinki, Department of Environmental Sciences, P.O. Box 65 (Viikinkaari 1), FI-14 University of Helsinki, FINLAND CSIC Instituto de Ciencias del Mar PasseigMarítim, Barcelona Spain Tel.: Fax: Tel.: Fax: Tel: +353 () Fax +353 () Tel.: Fax Tel: direct line : Fax: Mariano.Garcia@md.ieo.es tore.gustavsson@hotmail.com simon.jennings@cefas.co.uk andrew.kenny@cefas.co.uk Sarah.kraak@marine.ie skuikka@mappi.helsinki.fi paloma@icm.csic.es Malvarosa, Loretta NISEA S.c.a.r.l. malvarosa@nisea.eu 359
362 214 Annual Economic Report on the EU Fishing Fleet Name Address 1 Tel. STECF members Murua, Hilario Nord, Jenny Nowakowski, Piotr Prelezzo, Raul Sala, Antonello Scarcella, Giuseppe Somarakis, Stylianos Stransky, Christoph Theret, Francois Ulrich, Clara Vanhee, Willy AZTI - Tecnalia / Unidad de Investigación Marina, Herrera kaia portualdea z/g 211 Pasaia (Gipuzkoa), Spain The Swedish Agency of Marine and Water Management (SwAM) Maritime University of Szczecin. Faculty of Food Science and Fisheries, Department of Fishing Technique, Szczecin AZTI - Tecnalia / Unidad de Investigación Marina Txatxarramendi Ugartea z/g Sukarrieta (Bizkaia), Spain Fishing Technology Unit National Research Council (CNR) Institute of Marine Sciences (ISMAR) - Fisheries Section Largo Fiera della Pesca, Ancona - Italy Environmental Management Unit National Research Council (CNR) Institute of Marine Sciences (ISMAR) - Fisheries Section Largo Fiera della Pesca, Ancona - ITaly Department of Biology University of Crete VassilikaVouton P.O. Box Heraklion Crete Greece Thünen Institute [TI-SF] Federal Research Institute for Rural Areas, Forestry and Fisheries, Institute of Sea Fisheries, Palmaille 9, D Hamburg, Germany Scapêche 17 Bd Abbé Le Cam 561 Lorient France DTU Aqua, National Institute of Aquatic Resources, Technical University of Denmark, Charlottenlund Slot, JægersborgAllé 1, 292 Charlottenlund, Denmark ILVO - Institute for Agricultural and Fisheries Research Unit Animal Sciences - Fisheries Ankerstraat 1, B-84 Oostende, Belgium Tel: Fax: Tel Tel: Ext: 46- Fax: Tel: Fax: Tel: Fax: Tel.: , Tel Fax: Tel Fax hmurua@azti.es Jenny.nord@havochvatten.se npfgd@poczta.onet.pl rprellezo@suk.azti.es a.sala@ismar.cnr.it g.scarcella@ismar.cnr.it somarak@biology.uoc.gr christoph.stransky@ti.bund.de ftheret@comata.com cu@aqua.dtu.dk willy.vanhee@ilvo.vlaanderen.be 36
363 Contact details of STECF Members and EWG 14 5 and EWG 14 5 list of participants Name Address 1 Tel. STECF members van Oostenbrugge, Hans LandbouwEconomishInstituut- LEI, Fisheries Section, Burg. Patijnlaan 19 P.O.Box LS The Hague The Netherlands Tel:+31 () Fax: +31 () Hans.vanOostenbrugge@wur. Nl EWG 14 4 and 14 5 participants: Name Address / Telephone no. INVITED EXPERTS Edo AVIDč Jorg BERKENHAGEN Cecile BRIGAUDEAU Alfonso CIOFFI Richard CURTIN Irina DAVIDJUKA Jose Luis FERNANDEZ SANCHEZ Helena GALRITO Monica GAMBINO Emmet JACKSON Armelle JUNG Edvardas KASLAUSKAS Bernard KORMAN Emil KUZEBSKI Zavod za ribištvo Slovenije Fisheries Research Institute of Slovenia Sp. Gameljne 61a, 1211 Ljubljana SLOVENIA Thünen Institute of Sea Fisheries Hamburg GERMANY Des requins et de Hommes Rue Dumont d'urville BP 7 F 2928 Plouzané FRANCE Mably Società Cooperativa ITALY Bord Iascaigh Mhara Irish Sea Fisheries Board IRELAND Fish Resources Research Department Daugavgrivas 8 LV 148 Riga LATVIA University of Cantabria Avda. De los castros s/n 395 Santander SPAIN DGRM Avª Brasília, Lisboa PORTUGAL NISEA Via Irno, 11, Salerno ITALY Bord Iascaigh Mhara (BIM) Irish Sea Fisheries Board IRELAND Des requins et des Hommes Rue Dumont d'urville BP 7 F 2928 Plouzané FRANCE Agri information and Rural Business Center V. Kudirkos str. 18 LT315 Vilnius LITHUANIA MEDDE / DPMA / BSPA Bureau des Statistiques de la Pêche et de l'aquaculture Tour Voltaire pièce , place des degrés 9255 La Défense cedex FRANCE Morski Instytut Rybacki Kollataja Gdynia POLAND Edo.Avdic@zzrs.si Tel: joerg.berkenhagen@vti.bund.de Tel cecile@desrequinsetdeshommes.org Tel. : +33 () cioffi@mably.it Tel curtin@bim.ie Tel: +353 () irina.davidjuka@bior.gov.lv Tel fernandezjl@unican.es Tel galrito@dgrm.mamaot.pt Tel: gambino@irepa.org Tel jackson@bim.ie Tel.+353 () armelle@desrequinsetdeshommes.org Tél. : +33 () edvardas.kazlauskas@vic.lt Tel bernard.korman@developpementdurable.gouv.fr Tél. +33 () emil@mir.gdynia.pl Tel
364 214 Annual Economic Report on the EU Fishing Fleet Name Address / Telephone no. Steve LAWRENCE Janek LEES Sophie LEONARDI Carlos MOURA Anton PAULRUD (Chair) Evelina SABATELLA Arnaud SOUFFEZ Constantin STORIE Kees TAAL Torre GUSTAVSSON Mike TURENHOUT Irene TZOURAMANI Jarno VIRTANEN Ivana VUKOV JRC EXPERTS Natacha CARVALHO Franca CONTINI Alessandra BORRELLO Arina MOTOVA Seafish 18 Logie Mill, Logie Green Road, Edinburgh EH7 4HS UK Estonian Marine Institute 14 Mäealuse Street Tallinn ESTONIA IFREMER FRANCE Director Geral de Pescas e Aquicultura Avenida Brasilia Lisboa PORTUGAL Swedish Agency for Marine and Water management SWEDEN NISEA Via Irno, 11, Salerno ITALY University Of Nantes Chemin de la Censive du Tertre Nantes FRANCE NAFA ROMANIA LEI Wageningen UR P.O. Box 2973, 252 LS The Hague The Netherlands Private consultant Raketgatan 1C 4132 Gothenburg SWEDEN LEI Wageningen UR P.O. Box 2973, 252 LS The Hague The Netherlands Agricultural Economics Research Institute Hellenic Agricultural Organization DEMETER Terma Alkmanos, str Ilisia, Athens GREECE Finnish Game and Fisheries Research Institute FINLAND Planinska 2ª HR 1 Zagreb CROATIA Joint Research Centre (IPSC) Maritime Affairs Unit Via E. Fermi, Ispra (Varese) ITALY Joint Research Centre (IPSC) Maritime Affairs Unit Via E. Fermi, Ispra (VA) ITALY Joint Research Centre (IPSC) Maritime Affairs Unit Via E. Fermi, Ispra (VA) ITALY Joint Research Centre (IPSC) Maritime Affairs Unit Via E. Fermi, Ispra (VA) ITALY Steven.Lawrence@seafish.co.uk Tel. +44 () janek.lees@ut.ee Sophie.Leonardi@ifremer.fr Tel. +33 () cmoura@dgpa.min agricultura.pt Tel anton.paulrud@havochvatten.se Tel. +46 () e.sabatella@nisea.eu Tel arnaud.souffez@univ nantes.fr Tel cststroie@yahoo.com Tel kees.taal@wur.nl Tel tore_gustavsson@hotmail.com mike.turenhout@wur.nl Tel tzouramani.inagrop@nagref.gr Tel Jarno.Virtanen@rktl.fi ivana.vukov@mps.hr mobile: +385 () tel: +385 () natacha.carvalho@jrc.ec.europa.eu Tel franca.contini@jrc.ec.europa.eu Tel alessandra.borrello@jrc.ec.europa.eu Tel arina.motova@jrc.ec.europa.eu Tel
365 Contact details of STECF Members and EWG 14 5 and EWG 14 5 list of participants Name Address / Telephone no. COMMISSION Angel CALVO (DG MARE focalpoint) Natacha CARVALHO (JRC focalpoint) Aidas GLEMZA DG Maritime Affairs and Fisheries Unit A3 Structural Policy and Economic Analysis J 99 2/7 B 149 Brussels BELGIUM Joint Research Centre (IPSC) Maritime Affairs Unit Via E. Fermi, Ispra (Varese) ITALY Joint Research Centre (IPSC) Maritime Affairs Unit Via E. Fermi, Ispra (VA) ITALY angel andres.calvo santos@ec.europa.eu Tel natacha.carvalho@jrc.ec.europa.eu Tel Aidas.GLEMZA@ec.europa.eu Tel List of Background Documents Background documents are published on the EWG 14 4 meeting s web site on: Background documents are published on the EWG 14 5 meeting s web site on: List of background documents: EWG 14 4 and 14 5 Doc 1 Declarations of invited and JRC experts (see also section 7 of this report List of participants) 363
366 European Commission EUR 2691 EN Joint Research Centre Institute for the Protection and Security of the Citizen Title: Scientific, Technical and Economic Committee for Fisheries. 214 Annual Economic Report on the EU fishing fleet (STECF 14 16). EWG 14 4 and EWG 14 5 members: A Paulrud; E Avidč; J Berkenhagen; A Borrello; C Brigaudeau; N Carvalho; A Cioffi; R. Curtin; I Davidjuka; JL Fernandez Sanchez; H. Galrito, M Gambino; T. Gustavsson; E Jackson; A Jung; E Kaslauskas; B. Korman; E Kuzebski; S. Lawrence; J Lees; S Leonardi; A Motova; C Moura; P Rogers; E. Sabatella; A Souffez; C Stroie; K Taal; M. Turenhout; I. Tzouramani; J Virtanen & I Vukov. STECF members: Graham, N., Abella, J. A., Andersen, J., Bailey, N., Bertignac, M., Cardinale, M., Curtis, H., Daskalov, G., Delaney, A., Döring, R., Garcia Rodriguez, M., Gascuel, D., Gustavsson, T., Jennings, S., Kenny, A., Kirkegaard, E., Kraak, S., Kuikka, S., Malvarosa, L., Martin, P., Murua, H., Nord, J., Nowakowski, P., Prellezo, R., Sala, A., Scarcella, G., Somarakis, S., Stransky, C., Theret, F., Ulrich, C., Vanhee, W. & Van Oostenbrugge, H. Luxembourg: Publications Office of the European Union pp. 21 x 29.7 cm EUR Scientific and Technical Research series ISSN ; ISSN ISBN doi:1.2788/19812 Abstract The 214 Annual Economic Report (AER) on the European Union (EU) fishing fleet provides a comprehensive overview of the latest information available on the structure and economic performance of EU Member States fishing fleets. The results show that although revenue (income from seafood sales plus other income from non fishing activities) generated by the fleet decreased compared to 211, costs decreased even more, making the EU fishing fleet generally profitable and more so than in 211. The decrease in revenue is consistent with a decrease in the total weight and value of seafood landed by the EU fleet. In 212, the EU fleet generated 6.9 billion in revenue, amounting to 3.3 billion in Gross Value Added, 1.3 billion in gross profit and 458 million in net profit. In 212, 6.6% of the fleet s revenue was retained as net profit. In view of the continued uncertain economic climate in many Member States and high fuel prices, the economic performance of the EU fleet in the near future is unclear. Projections for 213 suggest decreased revenue for nine out of 15 Member State fleets assessed. However, GVA as a proportion of revenue is expected to have increased or remained stable in 9 out of the 15 MS fleets, and gross profit and net profit margins are expected to have increased in about half of the fleets assessed. This year s publication includes: (1) an extended (non technical) summary; (2) a structural and economic overview of the EU fishing fleet; (3) a detailed economic and structural overview of the fishing fleets from each EU Member State; (4) qualitative economic performance assessments for 212 and performance projections for 213 for each EU Member State; and (5) regional analyses of the EU fishing fleet.
367 How to obtain EU publications Our priced publications are available from EU Bookshop ( where you can place an order with the sales agent of your choice. The Publications Office has a worldwide network of sales agents. You can obtain their contact details by sending a fax to (352)

368 LB-AQ-14-1-EN-N As the Commission s in-house science service, the Joint Research Centre s mission is to provide EU policies with independent, evidence-based scientific and technical support throughout the whole policy cycle. Working in close cooperation with policy Directorates-General, the JRC addresses key societal challenges while stimulating innovation through developing new standards, methods and tools, and sharing and transferring its know-how to the Member States and international community The Scientific, Technical and Economic Committee for Fisheries (STECF) has been established by the European Commission. The STECF is being consulted at regular intervals on matters pertaining to the conservation and management of living aquatic resources, including biological, economic, environmental, social and technical considerations. ISBN doi:1.2788/19812
PROFITABILITY OF THE EU FISHING FLEET
 DIRECTORATE-GENERAL FOR INTERNAL POLICIES POLICY DEPARENT B: STRUCTURAL AND COHESION POLICIES FISHERIES PROFITABILITY OF THE EU FISHING FLEET NOTE This document was requested by the European Parliament's
Summary of the 2012 Annual Economic Report on the EU Fishing Fleet
 Summary of the 2012 Annual Economic Report on the EU Fishing Fleet Commissioned by the Directorate-General for Maritime Affairs and Fisheries Scientific, Technical and Economic Committee for Fisheries
Summary of the 2014 Annual Economic Report on the EU Fish Processing Industry
 Summary of the 2014 Annual Economic Report on the EU Fish Processing Industry This summary is part of the 2014 Annual Economic Report on the EU Fish Processing Industry (STECF 14-21) Fisheries EUROPEAN
The EU fisheries Data Collection Framework and Economic data
 The EU fisheries Data Collection Framework and Economic data John Anderson Economist Chair of SGECA AER working group john.anderson@jrc.ec.europa.eu IPSC - Institute for the Protection and Security of
Scientific, Technical and Economic Committee for Fisheries (STECF)
") Scientific, Technical and Economic Committee for Fisheries (STECF) Assessment of balance indicators for key fleet segments and review of national reports on Member States efforts to achieve balance between
Scientific, Technical and Economic Committee for Fisheries (STECF) Assessment of balance indicators for key fleet segments and review of national reports on Member States efforts to achieve balance between
Economic Performance of the EU Fishing Fleet and the potential gains of achieving MSY
 Economic Performance of the EU Fishing Fleet and the potential gains of achieving MSY Natacha Carvalho, Jordi Guillen, Fabrizio Natale & John Casey IIFET 2016, Aberdeen 11-15 July Joint Research Centre
COMMISSION IMPLEMENTING DECISION
 L 338/70 Official Journal of the European Union 17.12.2013 DECISIONS COMMISSION IMPLEMENTING DECISION of 9 December 2013 on an additional financial towards Member States fisheries control programmes for
DE MINIMIS AID FOR FISHERIES (MARE/2008/12)
") Final report ECONOMIC ANALYSIS OF RAISING DE MINIMIS AID FOR FISHERIES (MARE/2008/12) by FRAMIAN BV in co-operation with Symbeyond Research Group Contact: Pavel Salz Framian BV Achterburg 9 2641 LA Pijnacker
Final report ECONOMIC ANALYSIS OF RAISING DE MINIMIS AID FOR FISHERIES (MARE/2008/12) by FRAMIAN BV in co-operation with Symbeyond Research Group Contact: Pavel Salz Framian BV Achterburg 9 2641 LA Pijnacker
Pensions at a Glance: Europe and Central Asia
 Pensions at a Glance: Europe and Central Asia Edward Whitehouse Head of Pension-Policy Analysis Social Policy division OECD European Commission/ World Bank conference Reforming Pension Systems in Europe
10230/18 1 DGB. Council of the European Union. Brussels, 2 July 2018 (OR. en) 10230/18 PV CONS 34 AGRI 303 PECHE 238
 10230/18 PV CONS 34 AGRI 303 PECHE 238") Council of the European Union Brussels, 2 July 2018 (OR. en) 10230/18 PV CONS 34 AGRI 303 PECHE 238 DRAFT MINUTES COUNCIL OF THE EUROPEAN UNION (Agriculture and Fisheries) 18 June 2018 10230/18 1 CONTTS
Council of the European Union Brussels, 2 July 2018 (OR. en) 10230/18 PV CONS 34 AGRI 303 PECHE 238 DRAFT MINUTES COUNCIL OF THE EUROPEAN UNION (Agriculture and Fisheries) 18 June 2018 10230/18 1 CONTTS
EUROPEAN COMMISSION DIRECTORATE-GENERAL FOR MARITIME AFFAIRS AND FISHERIES. MARITIME POLICY AND BLUE ECONOMY The Director
 EUROPEAN COMMISSION DIRECTORATE-GENERAL FOR MARITIME AFFAIRS AND FISHERIES MARITIME POLICY AND BLUE ECONOMY The Director Ref. Ares(2019)421298-24/01/2019 Brussels, MARE/A4/ACS EMAIL To: From: DCF National
ECC-Net: Travel App. A new mobile application for European consumers when travelling abroad
 1 ECC-Net: Travel App A new mobile application for European consumers when travelling abroad A joint project of the European Consumer Centres Network ------------------------------------------------------
14349/16 MP/SC/mvk 1 DG D 2B
 Council of the European Union Brussels, 15 November 2016 (OR. en) 14349/16 COPEN 336 EUROJUST 146 EJN 72 NOTE From: To: General Secretariat of the Council Delegations No. prev. doc.: 9638/15 Subject: Implementation
EXPATRIATE TAX GUIDE. Taxation of income from employment in the EU & EEA
 EXPATRIATE TAX GUIDE Taxation of income from employment in the EU & EEA Poland 2016 CONTENTS* 2 Austria 4 Belgium 6 Bulgaria 8 Croatia 10 Cyprus 12 Czech Republic 14 Denmark 16 Estonia 18 Finland 20 France
Official Journal of the European Union L 172. Legislation. Non-legislative acts. Volume July English edition. Contents REGULATIONS
 Official Journal of the European Union L 172 English edition Legislation Volume 61 9 July 2018 Contents II Non-legislative acts REGULATIONS Commission Implementing Regulation (EU) 2018/963 of 6 July 2018
TREATY SERIES 2015 Nº 5
 TREATY SERIES 2015 Nº 5 Internal Agreement between the representatives of the Governments of the Member States of the European Union, meeting within the Council, on the Financing of European Union Aid
Outline of Presentation. I. Trends in Revenue Mobilization. II. Measuring Tax Gap. III. IMF s Approach RA-GAP
 Outline of Presentation I. Trends in Revenue Mobilization II. Measuring Tax Gap III. IMF s Approach RA-GAP 2 TRENDS IN REVENUE MOBILIZATION 3 I. Trends in Revenue Mobilization VAT revenues CIT Revenues
MINIMUM WAGES ACROSS OECD COUNTRIES: BACK TO THE FUTURE?
 Paris, 20 October 2017 MINIMUM WAGES ACROSS OECD COUNTRIES: BACK TO THE FUTURE? Andrea Garnero Economist Employment, Labour and Social Affairs OECD A widespread (but heterogenous) wage setting institution
I. Identifying information. Contribution ID: 061f8185-8f02-4c02-b a7d06d30f Date: 15/01/ :05:48. * Name:
 Contribution ID: 061f8185-8f02-4c02-b530-284a7d06d30f Date: 15/01/2018 16:05:48 Public consultation on a possible EU action addressing the challenges of access to social protection for people in all forms
Eligibility? Activities covered? Clients covered? Application or notification required? N/A N/A N/A N/A N/A N/A N/A
 NO DEAL BREXIT TRACKER Governments in European Economic Area (EEA) member states are announcing domestic measures in order to prepare for the UK's withdrawal from the EEA. The table below monitors these
Cross-border VAT refunds for EU businesses
 Cross-border VAT refunds for EU businesses Contents 1. GENERAL INFORMATION... 2 1.1. Legislation changes and advantages of the new system... 2 1.2. Eligibility for a cross-border EU VAT refund... 2 1.3.
Tax Refund Policies of Different Countries
 Remark: The following information is for reference only. Information is updated as of 16 May 2016 and provided by Transforex Currency Exchange Co., Ltd. ( TransForex ). Since the tax refund policy of different
The Challenge of Public Pension Reform in Advanced and Emerging Economies
 The Challenge of Public Pension Reform in Advanced and Emerging Economies Mauricio Soto Fiscal Affairs Department International Monetary Fund January 212 The views expressed herein are those of the author
EU-28 RECOVERED PAPER STATISTICS. Mr. Giampiero MAGNAGHI On behalf of EuRIC
 EU-28 RECOVERED PAPER STATISTICS Mr. Giampiero MAGNAGHI On behalf of EuRIC CONTENTS EU-28 Paper and Board: Consumption and Production EU-28 Recovered Paper: Effective Consumption and Collection EU-28 -
European Advertising Business Climate Index Q4 2016/Q #AdIndex2017
 European Advertising Business Climate Index Q4 216/Q1 217 ABOUT Quarterly survey of European advertising and market research companies Provides information about: managers assessment of their business
How demanding are eligibility criteria for unemployment benefits? Quantitative indicators for OECD and EU countries
 Seminar on Coverage of unemployment benefits Brussels, 9 December 2015 How demanding are eligibility criteria for unemployment benefits? Quantitative indicators for OECD and EU countries Kristine Langenbucher
Revenue Statistics Tax revenue trends in the OECD
 Revenue Statistics 2017 Tax revenue trends in the OECD OECD 2017 The OECD freely authorises the use of this material for non-commercial purposes, provided that suitable acknowledgment of the source and
Consumers attitudes towards cross-border trade and consumer protection 2016
 Consumers attitudes towards cross-border trade and consumer protection 2016 Technical report Contract n 2015 85 05 under FWC EAHC 2013/CP/03 Lot 1 Written by: GfK Date: January 2017 Justice and Consumers
Slovak Competitiveness: Fundamentals, Indicators and Challenges
 Copyright rests with the author Slovak Competitiveness: Fundamentals, Indicators and Challenges Presentation by Mark De Broeck European Department, IMF Seminar Organized by the European Commission November
The 2014 Annual Economic Report on the EU Fishing Fleet (STECF 14-16) - Corrigendum
 - Corrigendum") 2013 Annual Economic Report on the EU Fishing Fleet The 2014 Annual Economic Report on the EU Fishing Fleet (STECF 14-16) - Corrigendum Scientific, Technical and Economic Committee for Fisheries (STECF)
2013 Annual Economic Report on the EU Fishing Fleet The 2014 Annual Economic Report on the EU Fishing Fleet (STECF 14-16) - Corrigendum Scientific, Technical and Economic Committee for Fisheries (STECF)
Vessels operate mainly in the GSA 17 - Northern Adriatic, GSA 10 - South and Central Tyrrhenian Sea and in GSA 19 - Western Ionian Sea.
 5.12 ITALY Short description of the national fleet Fleet capacity In 2015 the national fleet capacity continued to decline, with a total of 12 426 vessels, having a combined gross tonnage (GT) of 164 thousand
The Challenge of Public Pension Reform
 The Challenge of Public Pension Reform Baoping Shang Fiscal Affairs Department International Monetary Fund May 4, 212 This presentation represents the views of the author and should not be attributed to
REPORT FROM THE COMMISSION TO THE EUROPEAN PARLIAMENT, THE COUNCIL, THE EUROPEAN ECONOMIC AND SOCIAL COMMITTEE AND THE COMMITTEE OF THE REGIONS
 EUROPEAN COMMISSION Brussels,.4.29 COM(28) 86 final/ 2 ANNEXES to 3 ANNEX to the REPORT FROM THE COMMISSION TO THE EUROPEAN PARLIAMENT, THE COUNCIL, THE EUROPEAN ECONOMIC AND SOCIAL COMMITTEE AND THE COMMITTEE
Pan-European opinion poll on occupational safety and health
 REPORT Pan-European opinion poll on occupational safety and health Results across 36 European countries Final report Conducted by Ipsos MORI Social Research Institute at the request of the European Agency
Implementation of the EBIC Common Principles on Bank Account Switching a), 2010
, 2010") Austria Belgium Bulgaria Cyprus Czech Republic Denmark Available as printout in banks and also on the homepages of the Austrian banks and the Austrian Federal Economic Chamber. Leaflet and brochure are
Austria Belgium Bulgaria Cyprus Czech Republic Denmark Available as printout in banks and also on the homepages of the Austrian banks and the Austrian Federal Economic Chamber. Leaflet and brochure are
Courthouse News Service
 14/2009-30 January 2009 Sector Accounts: Third quarter of 2008 Household saving rate at 14.4% in the euro area and 10.7% in the EU27 Business investment rate at 23.5% in the euro area and 23.6% in the
EUROPA - Press Releases - Taxation trends in the European Union EU27 tax...of GDP in 2008 Steady decline in top corporate income tax rate since 2000
 DG TAXUD STAT/10/95 28 June 2010 Taxation trends in the European Union EU27 tax ratio fell to 39.3% of GDP in 2008 Steady decline in top corporate income tax rate since 2000 The overall tax-to-gdp ratio1
DG TAXUD. STAT/11/100 1 July 2011
 DG TAXUD STAT/11/100 1 July 2011 Taxation trends in the European Union Recession drove EU27 overall tax revenue down to 38.4% of GDP in 2009 Half of the Member States hiked the standard rate of VAT since
Europeans attitudes towards the issue of sustainable consumption and production. Analytical report
 Flash Eurobarometer 256 The Gallup Organisation Analytical Report Flash EB N o 251 Public attitudes and perceptions in the euro area Flash Eurobarometer European Commission Europeans attitudes towards
NATIONAL COMMUNICATIONS FROM PARTIES INCLUDED IN ANNEX I TO THE CONVENTION
 UNITED NATIONS Distr. GENERAL FCCC/SBI/2002/3 3 April 2002 Original: ENGLISH SUBSIDIARY BODY FOR IMPLEMENTATION Sixteenth session Bonn, 10 14 June 2002 Item 3 (a) of the provisional agenda NATIONAL COMMUNICATIONS
Public Pension Spending Trends and Outlook in Emerging Europe. Benedict Clements Fiscal Affairs Department International Monetary Fund March 2013
 Public Pension Spending Trends and Outlook in Emerging Europe Benedict Clements Fiscal Affairs Department International Monetary Fund March 13 Plan of Presentation I. Trends and drivers of public pension
Preliminary results of International Trade in 2014: in nominal terms exports increased by 1.8% and imports increased by 3.
 International Trade Statistics 7 July, 215 Preliminary results of International Trade in : in nominal terms exports increased by 1.8% and imports increased by 3.2% vis-à-vis 213 In, exports of goods increased
State Involvement and Economic Growth
 State Involvement and Economic Growth (The Future of the European Economy: Over to the State, or to the Market?) 27th Economic Forum Krynica, Poland September 2017 Bas B. Bakker Senior Regional Resident
COMMUNICATION FROM THE COMMISSION TO THE EUROPEAN PARLIAMENT AND THE COUNCIL
 EUROPEAN COMMISSION Brussels, 7.12.2011 COM(2011) 837 final COMMUNICATION FROM THE COMMISSION TO THE EUROPEAN PARLIAMENT AND THE COUNCIL Preparation of the multiannual financial framework regarding the
Flash Eurobarometer N o 189a EU communication and the citizens. Analytical Report. Fieldwork: April 2008 Report: May 2008
 Gallup Flash Eurobarometer N o 189a EU communication and the citizens Flash Eurobarometer European Commission Expectations of European citizens regarding the social reality in 20 years time Analytical
Lowest implicit tax rates on labour in Malta, on consumption in Spain and on capital in Lithuania
 STAT/13/68 29 April 2013 Taxation trends in the European Union The overall tax-to-gdp ratio in the EU27 up to 38.8% of GDP in 2011 Labour taxes remain major source of tax revenue The overall tax-to-gdp
STAT/12/ October Household saving rate fell in the euro area and remained stable in the EU27. Household saving rate (seasonally adjusted)
") STAT/12/152 30 October 2012 Quarterly Sector Accounts: second quarter of 2012 Household saving rate down to 12.9% in the euro area and stable at 11. in the EU27 Household real income per capita fell by
STAT/12/152 30 October 2012 Quarterly Sector Accounts: second quarter of 2012 Household saving rate down to 12.9% in the euro area and stable at 11. in the EU27 Household real income per capita fell by
IMPROVING TAX COMPLIANCE. 6th IMF-Japan High-Level Tax Conference For Asian Countries Tokyo; April 7, 2015
 IMPROVING TAX COMPLIANCE 6th IMF-Japan High-Level Tax Conference For Asian Countries Tokyo; April 7, 2015 Outline Measurement and trends Some key methods and issues Managing compliance Supporting compliance
Approach to Employment Injury (EI) compensation benefits in the EU and OECD
 compensation benefits in the EU and OECD") Approach to (EI) compensation benefits in the EU and OECD The benefits of protection can be divided in three main groups. The cash benefits include disability pensions, survivor's pensions and other short-
Approach to (EI) compensation benefits in the EU and OECD The benefits of protection can be divided in three main groups. The cash benefits include disability pensions, survivor's pensions and other short-
State aid: Overview of national rescue measures and deposit guarantee schemes
 MEMO/08/614 Brussels, 10 th October 2008 State aid: Overview of national rescue measures and deposit guarantee s (See table attached in annex) This information is compiled from a range of sources and is
Economic gains of liberalising access to fishing quotas witin the European Union Andersen, Jesper Levring; Nielsen, Max; Lindebo, Erik
 university of copenhagen Københavns Universitet Economic gains of liberalising access to fishing quotas witin the European Union Andersen, Jesper Levring; Nielsen, Max; Lindebo, Erik Published in: Marine
The Architectural Profession in Europe 2012
 The Architectural Profession in Europe 2012 - A Sector Study Commissioned by the Architects Council of Europe Chapter 2: Architecture the Market December 2012 2 Architecture - the Market The Construction
Current Challenges in Revenue Mobilization: Improving Tax Compliance. CEPAL Regional Tax Seminar March 10, 2015
 Current Challenges in Revenue Mobilization: Improving Tax Compliance CEPAL Regional Tax Seminar March 10, 2015 Outline Recent trends in tax compliance Understanding and addressing noncompliance The hard-to-tax
PUBLIC PROCUREMENT INDICATORS 2011, Brussels, 5 December 2012
 PUBLIC PROCUREMENT INDICATORS 2011, Brussels, 5 December 2012 1. INTRODUCTION This document provides estimates of three indicators of performance in public procurement within the EU. The indicators are
Council conclusions on "First Annual Report to the European Council on EU Development Aid Targets"
 COUNCIL OF THE EUROPEAN UNION Council conclusions on "First Annual Report to the European Council on EU Development Aid Targets" 3091st FOREIGN AFFAIRS Council meeting Brussels, 23 May 2011 The Council
Live Long and Prosper? Demographic Change and Europe s Pensions Crisis. Dr. Jochen Pimpertz Brussels, 10 November 2015
 Live Long and Prosper? Demographic Change and Europe s Pensions Crisis Dr. Jochen Pimpertz Brussels, 10 November 2015 Old-age-dependency ratio, EU28 45,9 49,4 50,2 39,0 27,5 31,8 2013 2020 2030 2040 2050
Regional Economic Issues in CESEE
 Regional Economic Issues in CESEE JVI Lecture, Vienna, February 8, 2017 Bas B. Bakker Senior Regional Resident Representative for Central and Eastern Europe Outlook for CESEE 2 Within CESEE dichotomy:
Taxation trends in the European Union EU27 tax ratio at 39.8% of GDP in 2007 Steady decline in top personal and corporate income tax rates since 2000
 DG TAXUD STAT/09/92 22 June 2009 Taxation trends in the European Union EU27 tax ratio at 39.8% of GDP in 2007 Steady decline in top personal and corporate income tax rates since 2000 The overall tax-to-gdp
Income support for older persons in the Republic of Korea : a perspective of older persons
 ESCAP Regional Consultation Incheon, Republic of Korea Income support for older persons in the Republic of Korea : a perspective of older persons Soo-Wan Kim (Kangnam University) 1 I. Introduction This
Consumer credit market in Europe 2013 overview
 Consumer credit market in Europe 2013 overview Crédit Agricole Consumer Finance published its annual survey of the consumer credit market in 28 European Union countries for seven years running. 9 July
2017 Figures summary 1
 Annual Press Conference on January 18 th 2018 EIB Group Results 2017 2017 Figures summary 1 European Investment Bank (EIB) financing EUR 69.88 billion signed European Investment Fund (EIF) financing EUR
Can employment be increased only at the cost of more inequality?
 Can employment be increased only at the cost of more inequality? Engines for More and Better Jobs in Europe ZEW Conference, Mannheim April 2013 Torben M Andersen Aarhus University Policy questions How
Special scheme for small enterprises under the VAT Directive 2006/112/EC - Options for review
 Special scheme for small enterprises under the VAT Directive 2006/112/EC - Options for review Final Report Volume II Written by Deloitte May 2017 2017 Directorate-General for Taxation and Customs Union
in focus Statistics Contents Labour Mar k et Lat est Tr ends 1st quar t er 2006 dat a Em ploym ent r at e in t he EU: t r end st ill up
 Labour Mar k et Lat est Tr ends 1st quar t er 2006 dat a Em ploym ent r at e in t he EU: t r end st ill up Statistics in focus This publication belongs to a quarterly series presenting the European Union
IFRS APPLICATION AROUND THE WORLD JURISDICTIONAL PROFILE: Netherlands
 IFRS APPLICATION AROUND THE WORLD JURISDICTIONAL PROFILE: Netherlands Disclaimer: The information in this Profile is for general guidance only and may change from time to time. You should not act on the
European Fisheries Subsidies
 European Fisheries Subsidies State Aid The Hidden Subsidies Executive summary The fishing industry in the European Union (EU) receives a significant amount of government subsidies, which have promoted
NOTE. for the Interparliamentary Meeting of the Committee on Budgets
 NOTE for the Interparliamentary Meeting of the Committee on Budgets THE ROLE OF THE EU BUDGET TO SUPPORT MEMBER STATES IN ACHIEVING THEIR ECONOMIC OBJECTIVES AS AGREED WITHIN THE FRAMEWORK OF THE EUROPEAN
Electricity & Gas Prices in Ireland. Annex Business Electricity Prices per kwh 2 nd Semester (July December) 2016
 2016") Electricity & Gas Prices in Ireland Annex Business Electricity Prices per kwh 2 nd Semester (July December) 2016 ENERGY POLICY STATISTICAL SUPPORT UNIT 1 Electricity & Gas Prices in Ireland Annex Business
Electricity & Gas Prices in Ireland Annex Business Electricity Prices per kwh 2 nd Semester (July December) 2016 ENERGY POLICY STATISTICAL SUPPORT UNIT 1 Electricity & Gas Prices in Ireland Annex Business
EU BUDGET AND NATIONAL BUDGETS
 DIRECTORATE GENERAL FOR INTERNAL POLICIES POLICY DEPARTMENT ON BUDGETARY AFFAIRS EU BUDGET AND NATIONAL BUDGETS 1999-2009 October 2010 INDEX Foreward 3 Table 1. EU and National budgets 1999-2009; EU-27
IFRS APPLICATION AROUND THE WORLD JURISDICTIONAL PROFILE: Malta
 IFRS APPLICATION AROUND THE WORLD JURISDICTIONAL PROFILE: Malta Disclaimer: The information in this Profile is for general guidance only and may change from time to time. You should not act on the information
Analysis of European Union Economy in Terms of GDP Components
 Expert Journal of Economic s (2 0 1 3 ) 1, 13-18 2013 Th e Au thor. Publish ed by Sp rint In v estify. Econ omics.exp ertjou rn a ls.com Analysis of European Union Economy in Terms of GDP Components Simona
IFRS APPLICATION AROUND THE WORLD JURISDICTIONAL PROFILE: Denmark
 IFRS APPLICATION AROUND THE WORLD JURISDICTIONAL PROFILE: Denmark Disclaimer: The information in this Profile is for general guidance only and may change from time to time. You should not act on the information
Flash Eurobarometer 398 WORKING CONDITIONS REPORT
 Flash Eurobarometer WORKING CONDITIONS REPORT Fieldwork: April 2014 Publication: April 2014 This survey has been requested by the European Commission, Directorate-General for Employment, Social Affairs
Delegations will find in the Annex to this note the above Council Conclusions, which were adopted by the Council on 23 May 2011.
 COUNCIL OF THE EUROPEAN UNION Brussels, 23 May 2011 10593/11 DEVGEN 162 FIN 350 ACP 131 PTOM 28 COLAT 17 COASI 92 NOTE From: General Secretariat No. prev. doc.: 10187/11 Subject: Council Conclusions: First
Public consultation on the functioning of the administrative cooperation and fight against fraud in the field of VAT
 Public consultation on the functioning of the administrative cooperation and fight against fraud in the field of VAT Fields marked with * are mandatory. 1. ntroduction Context of the consultation As announced
Taxation trends in the European Union Further increase in VAT rates in 2012 Corporate and top personal income tax rates inch up after long decline
 STAT/12/77 21 May 2012 Taxation trends in the European Union Further increase in VAT rates in 2012 Corporate and top personal income tax rates inch up after long decline The average standard VAT rate 1
Fishery and aquaculture products
 1 buy Fishery and aquaculture an overview of EU consumer habits Maritime Affairs & Fisheries Fish sauce month Overall, 74 % of respondents say that they eat FAPs at least once a month TOP FAP consumers
COMMISSION OF THE EUROPEAN COMMUNITIES COMMISSION STAFF WORKING DOCUMENT. Annex to the
 COMMISSION OF THE EUROPEAN COMMUNITIES Brussels, 19122006 SEC(2006) 1690 COMMISSION STAFF WORKING DOCUMENT Annex to the COMMUNICATION FROM THE COMMISSION TO THE COUNCIL, THE EUROPEAN PARLIAMENT AND THE
Fieldwork February March 2008 Publication June 2008
 Special Eurobarometer 297 European Commission Attitudes towards radioactive waste Fieldwork February March 2008 Publication June 2008 Report Special Eurobarometer 297 / Wave 69.1 TNS Opinion & Social This
Outlook Overview: OECD Countries UN LINK Conference, Bangkok October, 2009
 Outlook Overview: OECD Countries UN LINK Conference, Bangkok 26 28 October, 2009 Dave Turner OECD, Economics Department OECD Outlook: Outline 1. Recovery underway but will probably be slow 2. Risks and
E-Communications Household Survey
 Special Eurobarometer 293 European Commission E-Communications Household Survey Fieldwork November December 2007 Publication June 2008 Report Special Eurobarometer 293 / Wave 68.2 TNS opinion & social
Entrepreneurship at a Glance 2018 Highlights
 Entrepreneurship at a Glance 218 Highlights OECD Entrepreneurship at a Glance Highlights 218 SDD 1 October 218 List of figures ENTREPRENEURSHIP AND BUSINESS STATISTICS DATABASES 218 UPDATE 2 1. New enterprise
COMMISSION STAFF WORKING DOCUMENT. National measures and practices as regards access to basic payment accounts
 EUROPEAN COMMISSION Brussels, 22.8.2012 SWD(2012) 249 final COMMISSION STAFF WORKING DOCUMENT National measures and practices as regards access to basic payment accounts Follow-up to the Recommendation
Public reporting for. Tax treaties Harmful tax practices Global solutions
 European Parliament European Commission Ownership transparency The European Parliament is advocating for public registers of of companies, as well as all trusts and similar legal structures in the EU In
Corrigendum. Page 41, Table 1.A1.1. Details of pension reforms, September 2013-September 2015 : Columns on Portugal should read as follows:
 Pensions at a Glance: OECD and G Indicators DOI: http://dx.doi.org/.787/pension_glance-5-en ISBN 9789644636 (print) ISBN 97896444443 (PDF) OECD 5 Corrigendum Page 4, Table.A.. Details of pension reforms,
THE COSTS OF CORRUPTION ACROSS THE EU
 THE COSTS OF CORRUPTION ACROSS THE EU CREDITS The Greens/EFA Group would like to thank the following persons for their work on this report: Pam Bartlett Quintanilla Patrick Cummins-Tripodi Awenig Marié
INVESTMENT AID IN EUROPE MARCH 2014 POLICY UPDATE
 INVESTMENT AID IN EUROPE MARCH 2014 POLICY UPDATE H I C K E Y & A S S O C I AT E S SITE SELECTION, INCENTIVES AND WORKFORCE SOLUTIONS INTRODUCTION As the world recovers from the economic downturn, businesses
CANADA EUROPEAN UNION
 THE EUROPEAN UNION S PROFILE Economic Indicators Gross domestic product (GDP) at purchasing power parity (PPP): US$20.3 trillion (2016) GDP per capita at PPP: US$39,600 (2016) Population: 511.5 million
Country-by-Country Reporting:
 -by- Reporting: Notifications Last updated: December 5, 2017 Notifications OECD Model Rule, Article 3. Notifications. Where a Constituent Entity of an MNE Group that is... not the Ultimate Parent Entity
The intergenerational divide in Europe. Guntram Wolff
 The intergenerational divide in Europe Guntram Wolff Outline An overview of key inequality developments The key drivers of intergenerational inequality Macroeconomic policy Orientation and composition
The European economy since the start of the millennium
 The European economy since the start of the millennium A STATISTICAL PORTRAIT 2018 edition 1 Since the start of the millennium, the European economy has evolved and statistics can help to better perceive
Recovery at risk? - CEE external vulnerability and Poland Article IV preliminary conclusions
 Central, Eastern and Southeastern Europe (CESEE) Recovery at risk? - CEE external vulnerability and Poland Article IV preliminary conclusions CASE, Warsaw - May 27, 214 James Roaf Senior Resident Representative
Fiscal rules in Lithuania
 Fiscal rules in Lithuania Algimantas Rimkūnas Vice Minister, Ministry of Finance of Lithuania 3 June, 2016 Evolution of National and EU Fiscal Regulations Stability and Growth Pact (SGP) Maastricht Treaty
Insurance Markets in Figures
 Insurance Markets in Figures June 2018 Most countries experienced a positive premium growth in life and/or non-life insurance in 2017 Preliminary data for 2017 show an increase in life and/or non-life
EMPLOYMENT RATE Employed/Working age population (15 64 years)
") EMPLOYMENT RATE 198 26 Employed/Working age population (15 64 years 8 % Finland 75 EU 15 EU 25 7 65 6 55 5 8 82 84 86 88 9 92 94 96 98 2 4** 6** 14.4.25/SAK /TL Source: European Commission 1 UNEMPLOYMENT
EMPLOYMENT RATE 198 26 Employed/Working age population (15 64 years 8 % Finland 75 EU 15 EU 25 7 65 6 55 5 8 82 84 86 88 9 92 94 96 98 2 4** 6** 14.4.25/SAK /TL Source: European Commission 1 UNEMPLOYMENT
FINAL REPORT. Measurement data and analysis. as specified in the specific contracts 5&6 on Modules 3&4. under the Framework Contract n ENTR/06/61
 FINAL REPORT Measurement data and analysis as specified in the specific contracts 5&6 on Modules 3&4 under the Framework Contract n ENTR/06/61 Report on the Fisheries Priority Area EU PROJECT ON BASELINE
THE TAX SYSTEM IN BELGIUM COMPARED TO OTHER OECD COUNTRIES
 THE TAX SYSTEM IN BELGIUM COMPARED TO OTHER OECD COUNTRIES TOWARDS A WELL-BALANCED FUNDAMENTAL TAX REFORM IN BELGIUM Bert Brys, Ph.D. 14 October 2013 Senior Tax Economist Centre for Tax Policy and Administration
Approved by Management committee of Danske Bank A/S Latvia branch (Meeting No 17/2017 from 24 April 2017) Effective from 1 of July 2017
 Effective from 1 of July 2017") Approved by Management committee of Danske Bank A/S Latvia branch (Meeting No 7/207 from 24 April 207) Effective from of July 207 DANSKE BANK A/S LATVIA BRANCH PRICELIST - FOR PRIVATE CUSTOMERS. Account...
Approved by Management committee of Danske Bank A/S Latvia branch (Meeting No 7/207 from 24 April 207) Effective from of July 207 DANSKE BANK A/S LATVIA BRANCH PRICELIST - FOR PRIVATE CUSTOMERS. Account...
REGULATORY HETEROGENEITY AND TRADE IN SERVICES. Workshop on Trade and International Regulatory Cooperation, Hildegunn Kyvik Nordås, TAD/TSD
 REGULATORY HETEROGENEITY AND TRADE IN SERVICES Workshop on Trade and International Regulatory Cooperation, Hildegunn Kyvik Nordås, TAD/TSD Overview Services exporters and importers Regulation level and
The economic effects of EU-reforms in corporate income tax systems
 The economic effects of EU-reforms in corporate income tax systems Study for the European Commission Directorate General for Taxation and Customs Union Contract No.TAXUD/2007/DE/324 by CPB Netherlands