NBER WORKING PAPER SERIES ASSET ALLOCATION AND ASSET LOCATION: HOUSEHOLD EVIDENCE FROM THE SURVEY OF CONSUMER FINANCES
|
|
|
- Conrad Marshall
- 5 years ago
- Views:
Transcription
1 NBER WORKING PAPER SERIES ASSET ALLOCATION AND ASSET LOCATION: HOUSEHOLD EVIDENCE FROM THE SURVEY OF CONSUMER FINANCES Daniel Bergstresser James Poterba Working Paper NATIONAL BUREAU OF ECONOMIC RESEARCH 1050 Massachusetts Avenue Cambridge, MA October 2002 We are grateful to Brad Barber, David Bradford, Joel Dickson, Roger Gordon, Andrew Samwick, and John Shoven for helpful conversations, to Amir Sufi for assistance with the Survey of Consumer Finances, and to the Hoover Institution, the National Institute of Aging, and the National Science Foundation for research support. The views expressed herein are those of the authors and not necessarily those of the National Bureau of Economic Research by Daniel Bergstresser and James Poterba. All rights reserved. Short sections of text, not to exceed two paragraphs, may be quoted without explicit permission provided that full credit, including notice, is given to the source.
2 Asset Allocation and Asset Location: Household Evidence from the Survey of Consumer Finances Daniel Bergstresser and James Poterba NBER Working Paper No October 2002 JEL No. H2, G2 ABSTRACT The rapid growth of assets in self-directed tax-deferred retirement accounts has generated a new set of financial decisions for many households. In addition to deciding which assets to hold, households with substantial assets in both taxable and tax-deferred accounts must decide where to hold them. This paper uses data from the Survey of Consumer Finances to assess how many households have enough assets in both taxable and tax-deferred accounts to face significant asset location choices. It also investigates the asset location decisions these households make. In 1998, 45 percent of households had at least some assets in a tax-deferred account, and more than ten million households had at least $25,000 in both a taxable and a tax-deferred account. Many households hold equities in their tax-deferred accounts, but not in their taxable accounts, while also holding taxable bonds in their taxable accounts. Most of these households could reduce their taxes by relocating heavily-taxed fixed income assets to their tax-deferred account. Asset allocation inside and outside tax-deferred accounts is quite similar, with about seventy percent of assets in each location invested in equity securities. For nearly three quarters of the households that hold apparently tax-inefficient portfolios, a shift of less than $10,000 in financial assets can move their portfolio to a tax-efficient allocation. Asset location decisions within IRAs appear to be sensitive to marginal tax rates; we do not find evidence for such sensitivity in other tax-deferred accounts. Daniel Bergstresser Harvard Business School Morgan Hall 125 Boston, MA James Poterba Department of Economics MIT 50 Memorial Drive Cambridge, MA and NBER poterba@mit.edu
3 1 Households have always faced the asset allocation problem, having to decide which assets to purchase and how much to invest in each of them. But with the recent growth of self-directed retirement plan assets, many households now also face an asset location problem. This is the question of how much of a given asset to hold in a taxable account, and how much of it to hold in a tax-deferred account. Assets in participant-directed tax-deferred accounts totaled nearly five trillion dollars at the end of 2001, with $2.4 trillion in Individual Retirement Accounts, and $2.3 trillion in 401(k)-type plans. At the end of 1990, by comparison, there were $637 billion in IRAs, and $735 billion in defined contribution plans. The recent growth of IRAs, 401(k) s, and other self-directed tax-deferred retirement vehicles has drawn substantial interest to the investment decisions made by households with these accounts. Asset location has begun to attract attention from researchers in public finance and financial economics, and it is a frequent topic of discussion among financial planners. Shoven (1998) outlined the structure of the asset location problem, and observed that tax minimization would usually dictate holding heavily-taxed taxable bonds in the tax-deferred account, with less-heavily taxed equities in the taxable account. Recent work by Dammon, Spatt, and Zhang (2002), Huang (2001), Poterba, Shoven, and Sialm (2001), and Shoven and Sialm (forthcoming) has offered further insight on the optimal asset mix for households facing various tax and financial circumstances. Absent liquidity or other considerations, households should hold relatively heavily taxed assets in their tax-deferred account. Whether this implies that taxable bonds should be held in the tax-deferred account depends on the set of assets available to the household. For example, Shoven and Sialm (forthcoming) consider the asset location decision for investors who can only hold equities in the form of relatively tax inefficient vehicles, such as high-turnover actively-managed mutual funds. If these investors have access to tax-exempt bonds, then their optimal asset location may involve equity mutual funds in the tax-deferred account, and tax-exempt bonds in the taxable account. Most of the recent research on asset location has focused on the derivation of tax-minimizing portfolio strategies, rather than on the analysis of household portfolio choices. Three studies have presented empirical evidence on how households actually locate their assets. The first, Bodie and Crane
4 2 (1997), is based on a survey of TIAA-CREF participants. It finds that investors choose similar asset allocations in their taxable and tax-deferred accounts, with little apparent regard for the benefits of taxefficient asset location. One open issue concerning this research concerns the extent to which the behavior of TIAA-CREF participants can be generalized to the population at large. A second study, Barber and Odean (forthcoming), is based on data drawn from brokerage firm records. The data suggest that households hold equity mutual funds and taxable bonds in their taxdeferred accounts, while they hold individual equities in their taxable account. Because individual equity holdings tend to be less heavily taxed than bonds or equity mutual funds, this asset location pattern is broadly consistent with tax-minimizing behavior. However, households are more likely to trade stocks in their taxable than in their tax-deferred account, even though trading in the tax-deferred account would not generate current capital gains tax liability. A key concern with this study is the degree to which data on assets held through a single brokerage firm depict a household s broader balance sheet, and in particular whether households may have offsetting positions at other financial institutions. Finally, a third study, Amromin (2002), uses data from the Survey of Consumer Finances to investigate whether precautionary demands for financial assets, coupled with penalties and restrictions on withdrawing assets from tax-deferred accounts, can explain deviations from tax-efficient asset location patterns. The paper also provides summary information on tax-deferred account holdings. The findings suggest that the standard deviation of household labor income is related to asset location choices, with households in less risky occupations choosing more tax-efficient asset locations. This paper represents an important step toward building models of the factors that affect asset location choices. In this paper, we also use data from several Surveys of Consumer Finances (SCFs) to analyze asset location decisions. The SCF data provide complete and disaggregate data on the portfolios held by a large sample of households. The SCF asks households to aggregate their holdings across all financial intermediaries. This makes it possible to study the overall structure of the household portfolio, rather than just the structure of one of its components.
5 3 This paper has two goals. The first is to describe the importance of the asset location problem, as measured by the number of households facing asset location decisions and the value of the assets held by households with such choices. The second is to explore asset location patterns, and to relate these patterns to household characteristics that affect the gains from tax-efficient asset location, particularly household marginal tax rates. The paper is divided into five sections. The first presents information on the number of households that face substantively important asset location decisions. We identify such households by the presence of significant asset holdings in both taxable and tax-deferred accounts (TDAs). Section two explores how households allocate their assets in taxable and in tax-deferred accounts. In the aggregate, equity investments make up more than two-thirds of tax-deferred financial assets and a similar proportion of taxable financial assets. The third section focuses on asset location decisions. It develops a simple classification rule to indicate whether or not households are making asset location decisions that are tax efficient. We develop several possible measures of tax efficiency, and we present estimates of the portfolio reallocation that would be needed to bring households in tax-inefficient positions to tax-efficient points. Section four presents cross-sectional regression and discrete choice evidence on the correlation between various household characteristics and asset location patterns. We investigate age, income, and net worth patterns in tax efficiency, and study how a household s marginal income tax rate affects the likelihood that its asset location choices are tax-efficient. A brief conclusion suggests directions for future research. 1. How Many Households Face Asset Location Choices? The recent expansion of tax-deferred accounts has included Individual Retirement Accounts (IRAs), which are available to all taxpayers with earned income, 401(k) plans, which are employerprovided defined contribution plans available at some firms, 403(b) plans, which are similar to 401(k) plans but are available to employees at nonprofit institutions, and a number of other smaller programs. Poterba, Venti, and Wise (2001) provide more information on the growth of tax-deferred accounts and the
6 4 characteristics of those who participate in them. Table 1 shows the total value of assets held in tax-deferred accounts as a fraction of total financial assets for selected years during the last two decades. The TDA share was 16.8 percent at the end of 2001, almost double the share in Tax-deferred assets are roughly equally divided between IRAs and various types of defined contribution pension plan accounts. A growing fraction of the assets in IRAs were actually accumulated in pension accounts, and then rolled over to an IRA. The aggregate data illustrate the growing importance of IRAs and 401(k)s, but they do not indicate how many households have substantial balances both in TDAs and in taxable accounts, and thus face substantively important asset location problems. To investigate how many households fall in this group, we use data from the 1989, 1992, 1995, and 1998 Surveys of Consumer Finances (SCFs). The SCF is the best available source of data on household wealth and its components. It asks a relatively comprehensive set of questions, has a large sample size, and oversamples high net worth households. The 1998 SCF, which is described by Kennickell, Starr-McCluer, and Surette (2000), sampled 4309 households, with 2813 in the random sample and 1496 in the stratified random sample that over-weighted those with high incomes or net worth. By combining an area probability sample with a high-income oversample, the SCF provides accurate information on broad population characteristics, while also offering in-depth information on the households that hold a disproportionate share of financial assets and net worth. Four households are excluded from the public use dataset due to disclosure concerns, leaving a sample with 4305 observations. One fourth of the households in the survey have net worth of over a million dollars. All of our tabulations weight the various observations in the survey by their sampling weights so that our reported statistics should be representative of the U.S. population. We measure the total value of the assets held in tax-deferred accounts as the sum of assets held in 401(k)s, 403(b)s, IRAs, and supplemental retirement accounts (SRAs). We exclude the value of assets in some traditional defined contribution plans that do not fall into these categories, since some of these plans may not allow participants much control over their asset allocation decisions. This exclusion probably leads us to understate the value of tax-deferred assets that are directly controlled by individual investors. A similar control issue arises with respect to some assets in 401(k) plans, where employer-imposed constraints on asset
7 5 allocation may limit individual control of investment options. We nevertheless include all 401(k) plan assets, because virtually all 401(k) participants control asset allocation decisions for at least some of their holdings. Table 2 presents summary information on the percentage of households with tax-deferred accounts. The first column shows the percentage with Individual Retirement Accounts, 401(k) plans, 403(b) plans, or other self-directed retirement saving plans. This percentage rises from 30.7 percent in 1989 to 45.7 percent in The next column shows the percentage of households with financial assets, excluding transaction accounts such as checking accounts, outside their TDA. Approximately 45 percent of the households in each of the four Surveys of Consumer Finances report ownership of these assets. This percentage would be much greater if we included financial assets in transaction accounts. We exclude them on the grounds that they do not reflect long-term investment positions in the way that TDA balances do. The last column in Table 2 shows the percentage of households with either taxable or tax-deferred assets. This group accounts for 55 percent of households in 1989 and 63 percent in These data illustrate the rapid growth during the last decade in the share of households with some involvement in financial markets. Table 3 presents more detailed information on the set of households that face asset location problems. It shows the number of households with TDA balances, and non-tda balances, above various threshold levels in 1989 and Asset thresholds are measured in constant 1998 dollars, and the shaded entries along the diagonal show the results when we apply the same threshold to both taxable and taxdeferred accounts. The asset thresholds do not adjust for the deferred taxes associated with holdings inside TDAs, or the greater prospective after-tax returns associated with assets held in these accounts. Poterba (2002) suggests that for time horizons of between 25 and 40 years, these two factors largely offset each other. The upper panel of Table 3 presents information from the 1989 SCF, while the lower panel presents data from The lower panel shows that in 1998, 30.3 million households had positive amounts of both taxable and tax-deferred assets. Over half of these households had significant amounts in both accounts; 15.6 million households had more than $10,000 in both, while 10.3 million households had more than $25,000 in both settings and 6.2 million had more than $50,000. A smaller but still substantial group, 3.2 million
8 6 households, had more than $100,000 in both types of accounts. This group, which accounts for just over 3 percent of all households, held almost 42 percent of non-transaction account financial assets. Comparing the entries in Table 3 for 1989 and 1998 demonstrates the growing importance of assets in tax-deferred accounts, and of the asset location issue. In 1989, 8.6 million households had more than $10,000, and 2.6 million had more than $50,000, in both taxable and tax-deferred accounts. These amounts are measured in 1998 dollars. Between 1989 and 1998, the number of households with tax-deferred assets above various thresholds grew much more rapidly than the number of households with taxable assets above various thresholds. To place tax-deferred asset holdings in the broader context of household portfolios, Table 4 presents information on the distribution of the ratio of TDA assets to total financial assets for the 1998 SCF. Asset location issues are more important for households with large TDA balances than for those with small balances. They are relatively more important for households with roughly similar holdings inside and outside their TDAs. For a household with a portfolio almost entirely in the taxable account, the asset mix within the 401(k) may be of little consequence, since the value of the 401(k) at retirement may represent a small fraction of total wealth. For a household with almost all of its assets in the TDA, the asset location decision is also of little consequence -- there may be too few assets outside the TDA to allow much flexibility. Table 4 shows that in 1998, the median household with both tax-deferred and taxable financial assets had 57.1 percent of its financial assets in a tax deferred account. At the 25th percentile this value was 28 percent, while at the 75th percentile it was 85.6 percent. Thus there is substantial dispersion in the share of assets held in TDAs, and a substantial number of households have between a quarter, and three-quarters, of their financial assets in these accounts. For higher net worth households, the distribution of tax-deferred assets relative to all financial assets shifts toward the left. The median value of this ratio for households with at least $250,000 in net worth, for example, is 47.9 percent, compared with 57.1 percent for all households. The measure of net worth used for this cutoff includes non-financial assets, and if we limit our sample to households with financial assets of more than $250,000, we find that the median household has only 42.3 percent of their financial assets in a TDA. These results nevertheless suggest that even in the upper strata of
9 7 the net worth and financial asset distributions, a substantial group of households have TDA and non-tda holdings that are of similar magnitude. Not surprisingly, net worth is strongly correlated with TDA balances. The median net worth of households with more than $25,000 in both taxable and tax-deferred accounts is $510,000, while the median for those with more than $100,000 in both settings is $1.18 million. In both cases, mean net worth is substantially greater than median ($1.31 million for those with more than $25,000 in both settings, and $2.58 million for those with more than $100,000). Income also rises with TDA holdings. Median household income rises from $81,200 for those with more than $25,000 in both the TDA and the taxable account, to $124,900 for those with more than $100,000 in each setting, while the median age of the household head rises from 54 to 56. The median income statistics do not capture a significant number of retired households with large holdings of both TDA and non-tda financial assets, but relatively low current income. 2. Asset Allocation Patterns The data in the last section suggest that roughly thirty million households faced asset location decisions in 1998, and that roughly fifteen million had at least $10,000 in a taxable as well as a tax-deferred account. A substantial share of the households with significant TDA balances had similar balances inside and outside their TDAs. For these households, decisions about asset location can have a non-trivial impact on their long-run financial status. Consider a 45-year-old couple with $100,000 in a TDA, and the same amount in a taxable account. Assume that the couple faces a 28 percent marginal income tax rate on interest and dividends, no capital gains tax, and that both bonds and stocks yield returns of 7 percent per year, but all of the bond income is currently taxable while only 2 percent of the equity return, the dividend yield, is taxable. If the couple allocates the TDA to stocks and the taxable account to bonds, and makes no subsequent reallocation decisions, then at age 70, net of taxes paid to withdraw assets from the TDA, they will have $732,650. By comparison, if they invest the TDA in bonds and hold equity in their taxable account, the lower tax burden on the bond income that results from holding bonds in the TDA will result in an after-tax wealth at age 70 of $866,791. This amounts to an 18 percent difference in wealth at retirement, a difference
10 8 that could have important effects on financial status. In this section, we use data from the Survey of Consumer Finances to investigate asset allocation patterns, and then in the next section, we consider asset location. 2.1 Survey of Consumer Finances Information on Asset Allocation For most types of tax-deferred accounts, the Survey of Consumer Finances asks whether the account is invested mostly or all in stock, split between stock and interest earning assets, or "mostly or all in interest-bearing accounts," or in "real estate," "insurance," or "other." Hardly any TDA assets are held in real estate, insurance, or "other." We use this information to construct estimates of the asset composition of taxdeferred accounts, and to compare these estimates with comparable estimates on the composition of taxable accounts. We allocate all of the assets in accounts identified as mostly or all in stock to equity, half of the value of split accounts, and none of the value of other accounts to equity. We then sum these equity holdings, as well as the total value of all accounts. The SCF does not distinguish taxable and tax-exempt bonds in the TDA, but based on evidence in Barber and Odean (forthcoming), we assume that there are no tax-exempt holdings. For one group of tax-deferred accounts, the SCF collects asset values but not the composition of assets. These are the accounts of households who had a defined contribution plan at a previous job, but who have not yet rolled their account to an IRA or taken cash distributions from the plan. Nearly three hundred thousand households have such accounts. We included these households in our summary tabulations in the preceding section, but in this and later sections, we exclude them. The SCF asks respondents to separately report the dollar values of direct stock holdings, equity mutual fund shares, and mixed equity-fixed income mutual fund shares that are held outside tax-deferred accounts. Aggregating these reported asset holdings provides a measure of equity held in taxable accounts. We do not include equity in privately-held companies, since such assets may be illiquid and difficult to transfer from the taxable to the tax-deferred account. The SCF also provides considerable detail on fixedincome assets held outside of tax-deferred accounts. Our measure of fixed-income assets includes certificates of deposit, savings bonds, and other taxable bonds held directly and through mutual funds. As in our
11 9 foregoing analysis, we exclude the value of checking accounts and money market accounts, on the grounds that holdings of these accounts are driven by liquidity concerns rather than asset allocation or tax issues. Tax-exempt bonds raise special problems for our analysis. While their risk attributes are similar to other fixed income securities, their income is taxed less heavily than the income from taxable bonds. The holders of tax-exempt bonds pay implicit rather than explicit taxes, so the effective tax burden on tax-exempt bonds equals the yield spread between comparably-risky taxable and tax-exempt bonds. This yield spread is usually smaller than the top marginal income tax rate times the taxable bond yield, so at least for households with relatively high marginal tax rates, tax-exempt bonds offer a higher after-tax return than taxable bonds. For some households, tax-exempt bonds may therefore offer a less risky, but lightly-taxed, alternative to taxable equity. In some of our calculations, we combine tax-exempt bonds with equity to describe household asset allocations between heavily-taxed and lightly-taxed assets. In the 1998 SCF, 4.8 percent of all households reported owning tax-exempt bonds, and another 1.8 percent held tax-exempt money market accounts. If we restrict our attention to households that have both taxable and tax-deferred financial assets, 11.9 percent hold tax-exempt bonds. This fraction has declined; it was16.3 percent in In contrast, the percent of all households owning tax-exempt bonds has been very stable. Most of the households that own tax-exempt bonds also hold taxable fixed-income securities. In 1998, of the 4.9 million households holding tax-exempt bonds, roughly half a million reported no financial assets outside their TDA, and one million held no corporate stock. 2.2 Asset Allocation Patterns Our analysis of asset location decisions focuses on whether households hold equities in their taxable accounts or in their tax-deferred accounts. Table 5 reports the first step in our analysis: summary information on the equity exposure of SCF households. The table also shows the percentage of households who hold fixed income assets, and tax-exempt bonds. The table presents cross-sectional information and it also documents recent trends. The first panel shows that equity rose from 40.4 percent of financial assets in 1989 to 69.7 percent of financial assets in This increase reflected both high returns and broadening participation in equity markets. The share of individuals holding equity in either taxable or tax-deferred
12 10 accounts rose from 27.3 percent to 45.8 percent, while the share of investors holding fixed-income assets remained steady at around 50 percent. The share of households with any equity or fixed-income assets rose from 54 to 63 percent over this time period, while the share holding tax-exempt bonds was steady at between four and five percent. The lower panels of Table 5 present separate information on financial assets held inside, and outside, tax-deferred accounts. In 1989, the equity share of assets held in TDAs (34 percent) was below the equity share in taxable accounts (43 percent). By 1998, 68 percent of TDA assets and 71 percent of non-tda assets were held in equities. The similarity of the stock-bond mix inside and outside TDAs raises questions about the extent to which investors are considering tax factors in deciding whether to locate assets inside or outside the TDA. Table 5 also shows that the percentage of TDA households with equity in their TDA rose from 13.3 in 1989 to 34.5 in Table 5 focuses exclusively on households that own equity, and it documents how these households own their stock. There can be substantial tax consequences associated with different methods of equity ownership. For example, investors who hold stock through equity mutual funds cede some control over their tax burdens to fund managers capital gain realization decisions. The first row in Table 6 shows that in 1989, 27.3 percent of households owned stock. This total can be disaggregated: 7.3 percent held equity only through their TDA, 6 percent held equity both inside and outside the TDA, and 14 percent held equity only outside their TDA. The table also shows that 14 percent of all households ( ) had only direct equity holdings, while 6 percent ( ) held at least some equity through a mutual fund. These summary statistics changed during the 1990s. By 1998, 12.4 percent of households held taxable equity only through stock owned directly, while 15.3 percent held some taxable equity through a mutual fund (15.3 = ). The percentage of the population holding at least some equity rose to 45.8 percent in 1998, and this was the result of rising numbers who held equity only in a TDA (from 7.3 percent to 18.1 percent) as well as both inside and outside a TDA (6 percent to 16.4 percent). The data from the Survey of Consumer Finances document a pronounced trend toward a higher fraction of equity investment being done through financial intermediaries. This trend may have implications for the effective
13 11 tax burdens on stocks and on bonds, since the effective tax burden on equities held through intermediaries is often higher than that on buy-and-hold direct equity investments. Table 7 presents information similar to that in Table 6, but it does so for the case of bonds rather than stocks. For bonds, the difference between holding assets within a TDA, and outside such an account, is very important for determining the effective tax burden. In addition to splitting fixed-income investments by TDA and non-tda location, Table 7 also distinguishes taxable fixed-income investments in taxable accounts from holdings of tax-exempt bonds. Table 7 does not suggest any changes in bond ownership that are nearly as pronounced as those for stock ownership. There was literally no change between 1989 and 1998 in the percentage of households 48.8 owning fixed income assets. Roughly one quarter of this group held fixedincome assets inside their TDA but not outside, while nearly half held fixed income assets outside the TDA but not inside. There has been some increase, from 8.8 percent to 13.1 percent, in the percentage of households with fixed-income investments held only through their TDA, and a decline, from 25.6 to 22.7 percent, in the set of households with fixed income held only outside the TDA. The overwhelming majority of SCF households hold no tax-exempt bonds, although those who do hold these bonds tend to be in the highest net worth strata, which makes the aggregate portfolio share held in these bonds significant. 3. Asset Location Decisions We now explore asset location choices in the Survey of Consumer Finances. We begin with a summary of these choices. Table 8 presents information on the number of households who report various asset location patterns in the 1998 SCF. The columns of this table indicate whether households have taxdeferred accounts, and if they do, what assets (only equity, only bonds, and some combination) they hold in these accounts. The rows describe the assets that the households hold in their taxable accounts. We combine tax-exempt bonds with equities held in taxable accounts. The table shows that there are 46.2 million households with assets in tax-deferred accounts; these are the households in columns two through four. Of this group, there are 30 million households with taxable assets outside the TDA. This is the group of households whose asset location decisions we study. The table entries for this group are shaded.
14 12 We define tax-minimizing asset location patterns as ones that allocate fixed income assets to taxdeferred accounts before taxable accounts. Households that follow such asset location patterns are labeled as tax efficient. The entries in Table 8 that are lightly shaded correspond to asset location patterns could be taxminimizing. The darkly shaded the entries correspond to investment patterns that do not appear to be consistent with tax-minimization. There are 10.8 million households (23.4 percent of all households with TDAs, and 36 percent of those with TDAs as well as taxable assets outside the TDA) holding only fixedincome assets in their TDAs. This is a group that might be allocating their highly-taxed assets to their taxdeferred account. Less than half of this group, however, 4.1 million households, holds any equity outside the TDA. These households, who are following a strict bonds in the TDA, stocks in the taxable account allocation rule represent less than one tenth of the households with tax-deferred accounts, and 13.6 percent of those with both TDA and non-tda financial assets. Table 8 also shows that there are 2.5 million households with only bonds in the TDA, and only bonds outside the TDA. This group may also be following a tax-minimizing asset location strategy, as may be the 4.9 million households with only equity in their TDA and in their taxable account. For a household with risk tolerance that points toward holding only stocks or holding only bonds in both sets of accounts, there is no effective asset location decision. One additional group, those with bonds and stocks in the TDA, and stocks in the taxable account, could also be tax-minimizing. This group consists of 2.3 million households. Adding all of these groups in the lightly shaded boxes together, there are 13.8 million households percent of all households with TDA assets, or 46 percent of those with both TDA and non-tda financial assets -- who may be following tax-minimizing asset location rules. Table 8 also shows that there is a substantial group of households that hold both fixed-income and equity investments, but who hold all of their equities inside their tax-deferred account. These households are in dark-shaded entries of the table. There are 6.5 (= ) million households that hold only fixedincome securities outside their TDA, while holding either all equities or a mix of bonds and stocks in the TDA. These households appear to be following just the reverse of the "bonds in the TDA" strategy. Another 5.6 million households hold only equity in the TDA, while holding both bonds and equities outside the TDA.
15 13 There are 9.7 million households that report only equity in the TDA or both equity and fixed-income securities in the TDA, and holdings of both equity and fixed-income assets outside the TDA. These households, like those who hold bonds outside the TDA and stocks in the TDA, could probably increase their after-tax financial assets at retirement by adjusting their portfolio to hold more of their fixed-income investments in their tax-deferred account, while preserving their overall risk exposure. The entries in Table 8 use a stark criterion for inclusion in categories such as only equity in the TDA. To capture households that have mostly equity in the TDA, we repeated the calculations that underlie the table using greater than 80 percent of the TDA invested in equity in place of the 100 percent cutoff in Table 8. We made similar changes in our other categorization criteria, replacing any 100 percent cutoff with 80 percent, and 0 percent with 20 percent. The results are broadly similar to the findings in Table 8, although fewer households are classified as following strategies that are not tax minimizing when we take this approach. Of the 46.2 million households with TDA assets, 3.8 million have more than 80 percent of their TDA in equity, and less than 20 percent of their taxable account in equity. This compares with 3.2 million households in Table 8 with all of their TDA in equity, and all of their non-tda assets in fixed income. The number of households following asset allocation patterns that are not tax minimizing, and are dark-shaded in the table, drops from 16.2 million to 10.5 million when we use the looser categorization criterion. Summary statistics like those in Table 8 provide a useful perspective on asset location decisions. We have also presented this information in a graphical format. Figure 1 plots the bivariate distribution of household asset allocation decisions in taxable as well as tax-deferred accounts. The concentration of households with TDA equity allocations of zero, 50 percent, and 100 percent reflects in part our procedure for turning categorical responses in the SCF into quantitative measures. The figure shows, however, that there is a very substantial concentration of households in the four corners of the distribution. There are two mass points in the distribution, corresponding to more than 80 percent equity allocation in both the TDA and outside the TDA (28.3 percent of the households with TDAs and non-tda financial assets) and less than twenty percent equity allocation (just over 10 percent). Amromin (2002) presents similar information, although his scatter plot does not portray the high concentration of households at corner allocations.
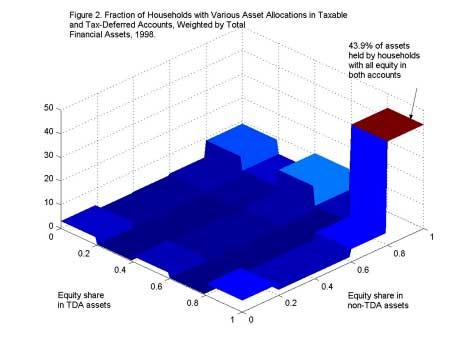
16 14 Figure 2 presents information similar to that in Figure 1, but households are now weighted by the total amount of financial assets that they hold inside and outside their TDAs. The data in Figures 1 and 2 taken together suggest that the households with little or no equity in their TDAs tend to be low-wealth households. When we weight by financial assets, 43.9 percent of all households have more than 80 percent of their TDA assets in equity, and a similar fraction of their non-tda assets in equity. Figure 2 demonstrates that most of the assets in tax-deferred accounts are held in accounts with high allocations to equity, as the data in Table 5 suggested. Table 8 and Figures 1 and 2 provide some insight on the extent to which households are pursuing tax-minimizing asset location strategies, but they do not offer a quantitative measure of how close taxinefficient households are to tax-efficient points. To address this issue, we compute the amount of wealth that each household with a TDA and non-tda financial assets would need to reallocate in order to reach a taxefficient portfolio. Table 9 summarizes the findings. The first row reports information already presented in Table 8: there are 16.2 million households that appear to be following tax-inefficient strategies based on their current portfolio holdings. The second row asks how many of these households hold portfolios that would require asset movements of more than $2500 to reach a tax-efficient point. For example, a household with a $2000 TDA balance invested in equity, and large bond holdings outside the TDA, could be brought to a taxefficient point by swapping $2000 of TDA equity for debt. Such a household would be counted as taxinefficient in the first row of Table 9, but not in the second. The results suggest that nearly half of the households with tax inefficient holdings are within $2500 of a tax-efficient point: only 8.5 million of the 16.2 million tax-inefficient households cannot be brought to tax-efficiency with asset transfers of $2500 or less. If we allow for asset transfers of no more than $10,000 per household, all but 4.6 million households can be brought to the tax-efficient point. This result suggests that by moving no more than 11.8 million households*($10,000), or $118 billion, we can move three-quarters of the tax inefficient households to tax efficient points. The information in Table 9 suggests that for many of the households that are following what appear to be tax-inefficient strategies, there is only a modest difference between the amount of retirement
17 15 wealth they would accumulate under a tax efficient strategy, and the amount they will accumulate if they continue to follow their current strategy. Table 10 presents another calculation designed to address the proximity of existing portfolios to taxefficient allocations. It focuses on the total amount of wealth that must be reallocated to achieve a taxefficient allocation for all households with TDAs, rather than on the number of households that have holdings that are inefficient by more than a certain amount. Since asset holdings are highly concentrated, results based on households and on assets can differ substantially. The first row in Table 10 focuses on the universe of households with TDAs and positive holdings of financial assets outside the TDA. In 1998, the total balance in TDAs was $2.64 trillion. To move all households with TDAs to a tax-minimizing asset location would require asset transfers of $250.8 billion, or just under one tenth of TDA assets. This is slightly more than twice the transfer, calculated above, that would bring all but 4.6 million households to tax-efficient points. Table 10 also shows the percentage of assets that need to be reallocated to achieve tax efficiency for households whose assets meet various thresholds for TDA and non-tda holdings. For those with at least $250,000 in both taxable and tax-deferred holdings, the required reallocation is $83 billion, or eleven percent of TDA assets. The required reallocation as a percentage of TDA assets is smallest for those with small holdings those who do not have at least $25,000 in both their taxable and tax-deferred accounts. For this group, the reallocation needed to achieve tax efficiency ($33.9 billion) is only 4.3 percent of total TDA assets. This reflects the smaller size of TDA relative to non-tda assets for this group, as well as a greater tendency to hold taxable fixed income assets in the TDA among small account holders. Table 10 also shows the aggregate portfolio reallocation that would be needed to move households to equal equity/fixed-income allocations inside and outside of tax-deferred accounts. The required reallocation is not much larger than the one that is needed to move all households to the tax-minimizing asset location. The comparison of these calculations suggests that households appear to be slightly closer to the taxminimizing outcome than to a default strategy that would allocate the same fraction of both the taxable and the tax-deferred account to equities. The third column of Table 10 shows the reallocation that would be needed to move households to allocation in which fixed income assets were held first in the TDA, except that
18 16 each household could hold $25,000 in fixed-income assets outside of the TDA for financial emergencies. Such a buffer stock might be attractive if, as in Amromin (2002) and Huang (2001), households face random shocks to their expenditure needs and they can make early withdrawals from tax-deferred accounts only at substantial cost. The required reallocation when we allow for a buffer stock of non-tda fixed income saving is only slightly smaller than that when we do not consider such a buffer. The notion of a financial buffer stock outside the TDA raises an important question about the extent to which TDA and non-tda assets are substitutes. For individuals over the age of 59 ½, who can withdraw assets from TDAs without penalty, the degree of substitutability is greater than for younger households who face withdrawal penalties of 10 percent. Depending on the structure of the TDA, there may also be other factors, such as hardship withdrawal restrictions in 401(k) plans, that limit the degree to which TDA assets can substitute for non-tda assets. Our analysis focuses on the tax differences between assets held inside and outside TDAs, but non-tax differences should also be considered in future work. 4. Explaining the Divergence Between Actual Asset Location and Tax-Minimizing Behavior There is substantial heterogeneity across households in the asset allocations that they chose in taxable and TDA accounts. While developing a structural model of the optimal amount of equity or debt to hold in the tax-deferred account, given the random shocks facing households, is beyond the scope of the current paper, we can explore which types of households make tax-efficient asset location decisions. We do this in three ways. First, we estimate probit models for the discrete choice of whether or not a household is in the tax efficient region in Table 8. Second, we estimate regression models to explain the difference between the share of the tax-deferred account that is held in fixed income assets, and the share of the financial asset portfolio outside the TDA that is held in fixed income assets. Finally, we estimate regression models in which the dependent variable is the share of TDA assets that would need to be reallocated to bring the household to a tax-efficient allocation. We consider the household s marginal tax rate, its reported risk tolerance, its age, net worth, and income as explanatory variables in our analysis. All of these variables, with the exception of the marginal tax
19 17 rate, are readily available on the Survey of Consumer Finances. Our marginal tax rate variable is an estimate of the household s marginal federal income tax rate on ordinary income, constructed using the algorithm described in Poterba and Samwick (forthcoming). The benefit of making a tax-efficient asset location decision is increasing in a household s marginal income tax rate. We therefore test for an association between the marginal tax rate and asset location patterns. In our estimation, we report results both for the entire sample of households with TDAs and non- TDA financial assets (1709 observations), and for a subsample of those households with IRAs (1410 observations). Some households in the subsample have TDA holdings only in an IRA, while others have both IRA and non-ira holdings. When we analyze the subsample with IRA holdings, we define our measure of tax efficiency using only the assets held in the IRA. Thus a household with an IRA fully invested in bonds, but a 401(k) with substantial equity holdings, and equity holdings in a taxable account as well would be classified as tax efficient in the subsample analysis. Our rationale for focusing on the second group is that some households with 401(k) accounts may hold equity in their TDAs because of employer restrictions on asset allocation. Many employers make 401(k) matching contributions in employer stock, and they require employees to hold this stock for some period of time. This could result in some households holding equity in their TDA, even though they would prefer to choose a more tax-efficient asset allocation. We have no way to identify households with constrained holdings in their 401(k)s, so we focus only on IRA holdings because households have complete discretion in allocating these assets. Table 11 presents the results of our empirical analysis of the cross-sectional determinants of asset allocation. The first two columns present estimates of probit models for a discrete dependent variable set equal to unity if the household exhibits a tax efficient asset location pattern, and zero otherwise. The basic specification is (1) Prob(TAXEFF i = 1) = Φ(β + δ*mtr i + Σ α j *AGE ij + Σ γ k *NETWORTH ik + Σ η c *RISK ic + Σ ρ s *INCOME is )
20 18 where TAXEFF i is an indicator variable for tax efficiency, and Φ(.) denotes the standard normal distribution function, and we include categorical indicator variables for age, net worth, and household income. The RISK variables are responses to three SCF questions that try to elicit a household s preferences with respect to the risk-reward tradeoff. The coefficient estimates suggest a positive, although variable, relationship between household marginal tax rates and the tax efficiency of a household s asset location choices. For the full sample, the coefficient on the tax variable is positive, but statistically insignificantly different from zero. It is larger in absolute value, and statistically significantly different from zero, for the IRA subsample. The results with respect to the marginal tax rate coefficients are sensitive, however, to the other variables included in the equation. Eliminating the categorical variables for household income, for example, reduces the marginal tax rate coefficient and in some specifications results in a negative coefficient estimate. There is some evidence of an age-related pattern in tax-efficiency. Both of the estimated equations show a substantially larger age coefficients for the year old age group than for the year old group. The significance of these two age categories is that the tax penalty for withdrawals from tax-deferred accounts is eliminated once the household reaches age 59 ½, thereby reducing the importance of precautionary saving considerations. Households over age 60 are more likely to have tax-efficient allocations than their slightly younger counterparts. We experimented with expanding the specification to include an interaction term between the marginal tax rate and an indicator variable for households over the age of 60, but we could not reject the null hypothesis that the coefficient on this variable was equal to zero. There is only weak evidence of net worth-related, or income-related, patterns in the probability of holding a tax-efficient portfolio. The specification in the first column suggests that households with net worth of less than $25,000 are less likely to make tax-efficient choices than other households are, but the differences across net worth categories are not statistically significant. Similar problems arise in interpreting the income coefficients. The next two columns of Table 11, columns three and four, report regression equations in which the dependent variable is DIFF, the difference between share of TDA assets in fixed-income securities and the
21 19 share of non-tda assets in fixed income securities. The specification includes the same explanatory variables as the probit models reported in the first two columns: (2) DIFF i = β + δ*mtr i + Σ α j *AGE ij + Σ γ k *NETWORTH ik + Σ η c *RISK ic + Σ ρ s *INCOME is + ε i. Once again, the estimated coefficient on the marginal tax rate variable is sensitive to our choice of estimation sample. The coefficients on the marginal tax rate are negative in the models for both the full sample and the IRA subsample. The coefficient is statistically significantly different from zero for the sample with IRA holdings. The point estimate for this specification, -.412, implies that a one percentage point increase in a household s marginal tax rate leads to a 0.4 percent decline in the difference between the share of fixedincome assets in the taxable and the tax-deferred account. There is some evidence of a link between net worth and the difference in asset allocations. Higher net worth households appear to hold a higher share of their non-tda assets in fixed income than lower net worth households. This finding is true for the IRA-only sample as well as for the broader sample. It is largely driven by a smaller amount of fixed-income holding in the tax-deferred accounts of high net worth households. There is once again some evidence of a difference in asset allocation patterns for households in their fifties and sixties, with older households showing a smaller differential between the share of fixed income assets in taxable and tax-deferred accounts. There are no pronounced patterns in the asset allocation patterns across income groups, and the coefficients on some of the adjacent indicator variables for income categories differ substantially. The last two columns of Table 11 present our last empirical test of whether tax rates affect asset location. The dependent variable in these regression models is the percentage of TDA assets that need to be reallocated in order to reach a tax-efficient allocation. The specification is otherwise the same as that in equation (2). Once again the marginal tax rate variable has mixed effects across specifications. The coefficient estimate is positive when we estimate the model for the full sample, and negative when we estimate on the sample of IRA holders. In neither case is the coefficient on the marginal tax rate variable statistically significantly different from zero.
22 20 5. Conclusions This paper presents evidence on asset allocation and location decisions for households with substantial balances in both their taxable and tax-deferred accounts. It shows that asset location is an important financial issue for a substantial group of U.S. households. More than eleven million households in 1998 had at least $25,000 in both taxable and tax-deferred accounts, and at least 3.4 million had more than $100,000 invested in each type of account. Many households have chosen asset location strategies that allocate equity to their tax-deferred account while they are holding fixed income investments in taxable account. A broad range of studies both in academic journals and in outlets that are read by financial services professionals, such as Charron (1999) and Crain and Austin (1997), suggest that households can raise their after-tax retirement wealth by holding highly taxed assets in their tax deferred account, and lightly taxed assets outside. Data from the Survey of Consumer Finances nevertheless suggest that the equity share of tax-deferred assets is roughly equal to the equity share of financial assets outside the TDA. The cost of tax inefficient behavior may be modest, however, for many households. Our calculations suggest that for roughly three quarters of the households that appear to deviate from tax-efficient asset location strategies, moving less than $10,000 in bonds or stocks would bring them to a tax-efficient allocation. The limited size of this reallocation places an upper bound on the foregone retirement wealth associated with current asset location decisions. We have had limited success in explaining the asset location patterns that we observe in crosssectional survey data. In the 1998 Survey of Consumer Finances, for example, we find at best a weak relationship between a household s marginal income tax rate and the tax-efficiency of its portfolio allocation. Explaining these patterns is clearly a challenge for future work, which should focus both on the information that households receive about asset allocation decisions within tax-deferred accounts, and on household awareness of the after-tax return consequences of different asset location choices. The asset location decision is part of a broader household decision about portfolio allocation. Finding that many households pursue tax-inefficient asset location strategies raises questions about other financial decisions. We view this as a natural direction for further research, and we have begun to explore
23 21 one such decision: consumer borrowing. Data from the 1998 SCF suggest that 44 percent of U.S. households have outstanding credit card balances. Moreover, 11.5 percent have a credit card balance of at least $5000, and more than 18 percent have more than $2500 in outstanding balances. Since 1986, interest payments on consumer debt have not been deductible from adjusted gross income for the purpose of computing taxable income. Interest on mortgage debt, however, remains deductible for income tax purposes. The tax deduction creates a strong incentive for households to borrow through home equity credit lines rather than on credit cards when they can. Maki (1996) and Stango (1999) suggest a decline in both credit card debt and in auto loan financing after TRA86, along with an increase in mortgage borrowing. In spite of the tax incentives, there appear to be a significant minority of households with credit card balances who could generate substantial tax savings by increasing their use of mortgage debt. Our preliminary estimates suggest that among the 18 percent of households with at least $2500 in outstanding consumer debt, 5.4 percent, or just under one third of the group, have at least $50,000 in self-reported housing equity. Nearly one seventh of this group, or 2.3 percent of the aggregate population, has at least $100,000 in housing equity. It is possible that the transactions costs associated with establishing a home equity line outweigh the tax saving for some households, particularly those who do not itemize and who do not expect to maintain their credit card balance for very long. Nevertheless, it seems that many of the same issues that arise in explaining apparently tax-inefficient asset location decisions also arise with respect to consumer borrowing decisions. Work is currently underway on these, and other related household financial decisions.
24 REFERENCES Amromin, Gene (2002), "Portfolio Allocation Choices in Taxable and Tax-Deferred Accounts: An Empirical Test of Tax Efficiency," mimeo, University of Chicago Department of Economics. Barber, Brad M. and Terrance Odean (forthcoming), "Are Individual Investors Tax Savvy? Asset Location Evidence from Retail and Discount Brokerage Accounts." Journal of Public Economics. Bodie, Zvi and Dwight B. Crane (1997), "Personal Investing: Advice, Theory, and Evidence," Financial Analysts Journal 53, Number 6 (November/December), Charron, Terry S. (1999), "Tax-Efficient Investing for Tax-Deferred and Taxable Accounts," Journal of Private Portfolio Management (Fall), Crain, Terry L. and Jeffrey R. Austin (1997), "An Analysis of the Tradeoff Between Tax Deferred Earnings in IRAs and Preferential Capital Gains," Financial Services Review 6 (4), Dammon, Robert, Chester Spatt, and Harold Zhang (2002). Optimal Asset Location and Allocation with Taxable and Tax-Deferred Investing, Mimeo, Carnegie-Mellon University. Huang, Jennifer (2001). Taxable or Tax Deferred Account? Portfolio Decisions with Multiple Investment Goals. Mimeo, MIT Sloan School of Management. Kennickell, Arthur B., Martha Starr-McCluer, and Brian Surette "Changes in U.S. Family Finances at the End of the 1990s: Results from the 1998 Survey of Consumer Finances." Federal Reserve Bulletin (January). Maki, Dean (1996), Portfolio Shuffling and Tax Reform, National Tax Journal 49, Poterba, James (2002). Valuing Assets in Retirement Saving Accounts, mimeo, MIT Economics Department. Poterba, James, John Shoven, and Clemens Sialm (2001). "Asset Location for Retirement Savers," in W. Gale, J. Shoven, and M. Warshawsky, eds., Private Pensions and Public Policies (Washington: Brookings Institution). Poterba, James, Steven Venti, and David Wise (2001). "The Transition to Personal Accounts and Increasing Retirement Wealth: Macro and Micro Evidence," NBER Working Paper Samwick, Andrew, and James Poterba (forthcoming). Taxation and Household Portfolio Composition: Evidence from Tax Reforms in the 1980s and 1990s. Journal of Public Economics. Shoven, John B. (1999). The Location and Allocation of Assets in Pension and Conventional Savings Accounts, NBER Working Paper Shoven, John B. and Clemens Sialm (forthcoming). Asset Location in Tax-Deferred and Conventional Savings Accounts, Journal of Public Economics. Stango, Victor (1999). The Tax Reform Act of 1986 and the Composition of Consumer Debt. National Tax Journal 52,
25 Table 1: Self-Directed Tax-Deferred Assets as a Percent of Total Financial Assets Year IRA DC pension Total % 5.5% 8.6% Source: Flow of Funds, Z.1 release, Tables L.10 and L.119.c. Total financial assets were $8.0 trillion in 1985, $12.3 trillion in 1990, $18.6 trillion in 1995, $27.2 trillion in 1998, and $28.3 trillion in Table 2: Percentage of Households with Tax-Deferred Accounts or Financial Assets Outside Tax- Deferred Accounts, Year Tax Deferred Assets Taxable Financial Assets Outside TDA Either Taxable or Tax Deferred Assets % 46.8% 63.0% Source: Tabulations from Surveys of Consumer Finances. Financial assets outside the tax-deferred account include stocks, equity mutual funds, certificates of deposit, savings bonds, and other taxable bonds. Tax-exempt bonds are not included in the set of financial assets outside the TDA. In 1989, 6.5 percent of households reported some holdings of tax-exempt bonds; this fraction was stable across surveys, rising to 6.6 percent in Virtually all households owning tax-exempt bonds also held taxable bonds. The number of households in the four Surveys of Consumer Finances are 93 million (1989), 95.9 million (1992), 99 million (1995), and million (1998). Table 3: Households with Significant Holdings of Both Taxable and Tax-Deferred Financial Assets Value of Tax-Deferred Financial Assets in Taxable Account Account > 0 10K 25K 50K 100K 1989 > K K K K > K K K K Notes: Each entry shows the total number of households (in millions) with the specified mix of assets in tax-deferred and taxable accounts. Asset cutoffs in both 1989 and 1998 are measured in 1998 dollars.
26 24 Table 4: Share of Financial Assets Held in Tax Deferred Accounts, 1998 Net Worth or Financial Asset Criterion Millions of Households with TDA & Non-TDA TDA Assets as a Percentage of Total Financial Assets For Households with Both TDA and Non-TDA Assets Percentile Mean All Households % 28.0% 57.1% 85.6% 97.3% 55.9% Net Worth $100K Net Worth $250K Net Worth $1M Financial Assets $100K Financial Assets $250K Financial Assets $1M Source: Authors' tabulations using 1998 Survey of Consumer Finances. See text for further details. Table 5: Asset Allocation in Taxable and Tax-Deferred Accounts, All Financial Assets Equity as Percentage of Total Financial Assets 40.4% 47.8% 55.5% 69.7% Tax Exempt Bonds as Percentage of Total Financial Assets Percent of Households with Equity or Fixed-Income Assets Percent of Households with Any Equity Percent of Households with Any Fixed-Income Assets Financial Assets Held in TDA Equity as Percentage of TDA Financial Assets Percent of Households with Equity or Fixed-Income Assets Percent of Households with Any Equity Percent of Households with Any Fixed-Income Assets Financial Assets Held in Outside TDA Equity as Percentage of Financial Assets in Taxable Account Tax Exempt Bonds as Percentage of Total Financial Assets Percent of Households with Equity or Fixed-Income Assets Percent of Households with Any Equity Percent of Households with Any Fixed-Income Assets Source: Authors' tabulations based on Survey of Consumer Finances. Fixed income assets include holdings of tax-exempt debt.
27 Table 6: Percentage of Households Holding Equity, Year Any Equity Held Both Inside and Outside TDA Equity Total Direct and Only Only Direct Holdings Indirect Indirect Equity Only Held in TDA Equity Only Held Outside TDA Total Direct and Indirect Only Indirect % 16.4% 4.7% 4.8% 6.9% 18.1% 11.3% 2.1% 3.7% 5.5% Source: Tabulations from Surveys of Consumer Finances. Only Direct Table 7: Percentage of Households Holding Fixed-Income Assets, Year Any Fixed Income both Inside and Outside TDA Fixed- Fixed- Total Both Only Only Tax- Income Income Taxable and Taxable Exempt Only in Holdings Tax-Exempt Bonds Bonds the TDA Fixed Income Only Held Outside TDA Total Both Taxable and Tax- Exempt Bonds Only Taxable Bonds Only Tax- Exempt Bonds Bonds % 13.0% 1.5% 11.1% 0.5% 13.1% 22.7% 2.2% 19.8% 0.7% Source: Tabulations from Surveys of Consumer Finances.
28 26 Table 8: SCF Households (millions) with Various Asset Combinations, 1998 Households with No Assets in TDA Households with Only Equity in their TDA Households with Both Equity and Taxable Fixed Income in TDA All Households Households With No Taxable Assets Outside the TDA Only Equity Outside TDA Equity and Fixed-Income Outside TDA Only Fixed- Income Outside TDA Households with Only Taxable Fixed Income in TDA Total Number of Households Total Notes: Tax-exempt bonds are included with equity, since these bonds are lightly taxed. The results are virtually unchanged if tax-exempt bonds are aggregated with taxable fixed income securities. Table 9: Millions of Households with Tax-Inefficient Allocations After Reallocation of Some Assets Maximum Current Household Allocation Position Possible Reallocation Only Equity in TDA, Equity and Bonds Outside Only Equity in the TDA, Only Bonds Outside Both Equity and Bonds Inside TDA and Outside Both Equity and Bonds in TDA, Only Bonds Outside Total Number of Households $ $ $ Note: Each entry indicates the number of household with a particular tax-inefficient combination of asset holdings who cannot be moved to a tax-efficient allocation with a reallocation of the amount shown in the left-most column. Table 10: Proximity of Actual Portfolios to Tax-Minimizing Asset Location, 1998 SCF ($1998 B) Household Characteristic Reallocation Needed to Achieve Tax Efficiency Reallocation Need to Achieve Tax Minimizing Allocation, Omitting $25,000 of Fixed Income Outside TDA Reallocation Needed to Achieve Equal Allocation in TDA & Taxable Account Amount of TDA Assets Total Financial Assets TDA and Non-TDA $250.8 $246.9 $266.4 $ $ > 0 TDA and Non-TDA > $25 K TDA and Non-TDA > $50 K TDA and Non-TDA > $250K Notes: Author s tabulations from the Survey of Consumer Finances. Detailed calculation methodology is described in the text.
29 27 Table 11: Explaining Tax Efficiency and Asset Allocation Share Differences Explanatory Variable Tax Efficiency Indicator Asset Allocation Difference Required Reallocation Share All TDAs IRA Sample All TDAs IRA Sample All TDAs IRA Sample Marginal Tax Rate (0.163) 0.414* (0.176) (0.168) * (0.187) (0.090) (0.111) Will Take Substantial Financial Risk (0.059) (0.067) (0.061) (0.072) (0.033) (0.043) Above Average Financial Risk (0.042) * (0.049) (0.044) (0.052) (0.024) (0.031) Average Financial Risk (0.038) * (0.044) (0.039) (0.046) 0.052* (0.021) 0.054* (0.027) Net Worth 0-25K * (0.080) * (0.126) (0.104) (0.155) (0.056) (0.092) Net Worth K (0.088) (0.122) (0.094) (0.127) * (0.050) * (0.076) Net Worth K (0.090) (0.121) * (0.094) (0.125) * (0.051) (0.074) Net Worth 250K-1M (0.092) (0.122) * (0.096) * (0.127) * (0.051) (0.075) Net Worth 1-2.5M * (0.091) (0.125) * (0.109) * (0.138) (0.059) (0.082) Net Worth >2.5M * (0.102) (0.137) * (0.124) * (0.150) (0.067) (0.089) Age * (0.054) (0.075) 0.177* (0.058) (0.079) (0.031) (0.047) Age (0.056) (0.074) 0.203* (0.059) (0.077) (0.032) (0.046) Age (0.059) (0.076) 0.169* (0.063) (0.081) 0.074* (0.034) (0.048) Age (0.066) (0.078) (0.068) (0.084) (0.037) (0.050) Age > (0.071) (0.084) (0.073) (0.088) 0.119* (0.039) (0.052) Income 25-50K * (0.044) * (0.049) 0.131* (0.048) 0.114* (0.053) (0.026) 0.071* (0.031) Income K * (0.047) * (0.051) 0.165* (0.050) 0.129* (0.054) (0.027) 0.104* (0.032) Income K * (0.058) * (0.063) (0.062) 0.139* (0.069) (0.034) (0.041) Income K * (0.084) * (0.085) (0.098) (0.104) (0.053) (0.062) Income 500K-1M (0.122) * (0.116) (0.156) (0.156) 0.208* (0.084) 0.267* (0.093) Income > 1M (0.162) (0.163) (0.170) (0.170) (0.092) (0.101) Constant (0.108) 0.306* (0.147) 0.148* (0.058) 0.258* (0.087) R Notes: Entries in columns 1 and 2 report coefficients from a probit model. The dependent variable equals unity unless the household holds fixed income assets outside a TDA, and holds some equity in a TDA. The second (third) pair of columns reports regressions with the difference between the fixed income share in the TDA and the taxable account, and the reallocation required to reach tax efficiency as a share of TDA assets, as dependent variables. The sample size for columns 1, 3, and 5 is 1709, while for columns 2, 4, and 6, it is 1410.
30 28
31 29
ASSET ALLOCATION AND ASSET LOCATION DECISIONS: EVIDENCE FROM THE SURVEY OF CONSUMER FINANCES
 CONFERENCE DRAFT COMMENTS WELCOME ASSET ALLOCATION AND ASSET LOCATION DECISIONS: EVIDENCE FROM THE SURVEY OF CONSUMER FINANCES Daniel Bergstresser MIT James Poterba MIT, Hoover Institution, and NBER March
NBER WORKING PAPER SERIES EXCHANGE TRADED FUNDS: A NEW INVESTMENT OPTION FOR TAXABLE INVESTORS. James M. Poterba John B. Shoven
 NBER WORKING PAPER SERIES EXCHANGE TRADED FUNDS: A NEW INVESTMENT OPTION FOR TAXABLE INVESTORS James M. Poterba John B. Shoven Working Paper 8781 http://www.nber.org/papers/w8781 NATIONAL BUREAU OF ECONOMIC
Deciding how much of a portfolio to allocate to different types of assets is. Asset Location for Retirement Savers
 10 Asset Location for Retirement Savers james m. poterba, john b. shoven, and clemens sialm Deciding how much of a portfolio to allocate to different types of assets is one of the fundamental issues in
center for retirement research
 SAVING FOR RETIREMENT: TAXES MATTER By James M. Poterba * Introduction To encourage individuals to save for retirement, federal tax policy provides various tax advantages for investments in self-directed
Asset Location for Retirement Savers
 Asset Location for Retirement Savers James M. Poterba Massachusetts Institute of Technology, Hoover Institution, and NBER John B. Shoven Stanford University and NBER Clemens Sialm Stanford University November
NBER WORKING PAPER SERIES THE DISTRIBUTION OF PAYROLL AND INCOME TAX BURDENS, Andrew Mitrusi James Poterba
 NBER WORKING PAPER SERIES THE DISTRIBUTION OF PAYROLL AND INCOME TAX BURDENS, 1979-1999 Andrew Mitrusi James Poterba Working Paper 7707 http://www.nber.org/papers/w7707 NATIONAL BUREAU OF ECONOMIC RESEARCH
This work is distributed as a Discussion Paper by the STANFORD INSTITUTE FOR ECONOMIC POLICY RESEARCH. SIEPR Discussion Paper No.
 This work is distributed as a Discussion Paper by the STANFORD INSTITUTE FOR ECONOMIC POLICY RESEARCH SIEPR Discussion Paper No. 00-08 ASSET LOCATION FOR RETIREMENT SAVERS James M. Poterba* John B. Shoven**
VERY PRELIMINARY - DO NOT QUOTE OR DISTRIBUTE
 0 VERY PRELIMINARY - DO NOT QUOTE OR DISTRIBUTE Do Required Minimum Distributions Constrain Household Behavior? The Effect of the 2009 Holiday on Retirement Savings Plan Distributions Jeffrey Brown University
Demographic Change, Retirement Saving, and Financial Market Returns
 Preliminary and Partial Draft Please Do Not Quote Demographic Change, Retirement Saving, and Financial Market Returns James Poterba MIT and NBER and Steven Venti Dartmouth College and NBER and David A.
NBER WORKING PAPER SERIES TAXES AND MUTUAL FUND INFLOWS AROUND DISTRIBUTION DATES. Woodrow T. Johnson James M. Poterba
 NBER WORKING PAPER SERIES TAXES AND MUTUAL FUND INFLOWS AROUND DISTRIBUTION DATES Woodrow T. Johnson James M. Poterba Working Paper 13884 http://www.nber.org/papers/w13884 NATIONAL BUREAU OF ECONOMIC RESEARCH
NBER WORKING PAPER SERIES HOUSEHOLD OWNERSHIP OF VARIABLE ANNUITIES. Jeffrey Brown James Poterba
 NBER WORKING PAPER SERIES HOUSEHOLD OWNERSHIP OF VARIABLE ANNUITIES Jeffrey Brown James Poterba Working Paper 11964 http://www.nber.org/papers/w11964 NATIONAL BUREAU OF ECONOMIC RESEARCH 1050 Massachusetts
The Asset Location Puzzle: Taxes Matter
 The Asset Location Puzzle: Taxes Matter Jie Zhou Nanyang Technological University, Singapore Abstract Asset location decisions observed in practice deviate substantially from predictions of theoretical
TAX-PREFERRED ASSETS AND DEBT, AND THE TAX REFORM ACT OF 1986: SOME IMPLICATIONS FOR FUNDAMENTAL TAX REFORM ERIC M. ENGEN * & WILLIAM G.
 TAX-PREFERRED ASSETS AND DEBT, AND THE TAX REFORM ACT OF 1986: SOME IMPLICATIONS FOR FUNDAMENTAL TAX REFORM ERIC M. ENGEN * & WILLIAM G. GALE ** Abstract - This paper focuses on two aspects of the tax
The Rise of 401(k) Plans, Lifetime Earnings, and Wealth at Retirement
 Plans, Lifetime Earnings, and Wealth at Retirement") The Rise of 401(k) Plans, Lifetime Earnings, and Wealth at Retirement By James Poterba MIT and NBER Steven Venti Dartmouth College and NBER David A. Wise Harvard University and NBER April 2007 Abstract:
The Rise of 401(k) Plans, Lifetime Earnings, and Wealth at Retirement By James Poterba MIT and NBER Steven Venti Dartmouth College and NBER David A. Wise Harvard University and NBER April 2007 Abstract:
This PDF is a selection from a published volume from the National Bureau of Economic Research. Volume Title: Analyses in the Economics of Aging
 This PDF is a selection from a published volume from the National Bureau of Economic Research Volume Title: Analyses in the Economics of Aging Volume Author/Editor: David A. Wise, editor Volume Publisher:
Investment Company Institute and the Securities Industry Association. Equity Ownership
 Investment Company Institute and the Securities Industry Association Equity Ownership in America, 2005 Investment Company Institute and the Securities Industry Association Equity Ownership in America,
Family Status Transitions, Latent Health, and the Post- Retirement Evolution of Assets
 Family Status Transitions, Latent Health, and the Post- Retirement Evolution of Assets by James Poterba MIT and NBER Steven Venti Dartmouth College and NBER David A. Wise Harvard University and NBER May
NBER WORKING PAPER SERIES PORTFOLIO CONCENTRATION AND THE PERFORMANCE OF INDIVIDUAL INVESTORS. Zoran Ivković Clemens Sialm Scott Weisbenner
 NBER WORKING PAPER SERIES PORTFOLIO CONCENTRATION AND THE PERFORMANCE OF INDIVIDUAL INVESTORS Zoran Ivković Clemens Sialm Scott Weisbenner Working Paper 10675 http://www.nber.org/papers/w10675 NATIONAL
Choosing Between an Estate Tax and a Basis Carryover Regime: Evidence from 2010
 Choosing Between an Estate Tax and a Basis Carryover Regime: Evidence from 2010 The MIT Faculty has made this article openly available. Please share how this access benefits you. Your story matters. Citation
Asset Location and Allocation with. Multiple Risky Assets
 Asset Location and Allocation with Multiple Risky Assets Ashraf Al Zaman Krannert Graduate School of Management, Purdue University, IN zamanaa@mgmt.purdue.edu March 16, 24 Abstract In this paper, we report
NBER WORKING PAPER SERIES
 NBER WORKING PAPER SERIES MISMEASUREMENT OF PENSIONS BEFORE AND AFTER RETIREMENT: THE MYSTERY OF THE DISAPPEARING PENSIONS WITH IMPLICATIONS FOR THE IMPORTANCE OF SOCIAL SECURITY AS A SOURCE OF RETIREMENT
Taxation and Portfolio Structure: Issues and Implications. James M. Poterba. MIT and NBER. December 1999 Revised March 2000
 Taxation and Portfolio Structure: Issues and Implications James M. Poterba MIT and NBER December 1999 Revised March 2000 ABSTRACT This paper provides an overview of how taxation affects household portfolio
Retirement Saving, Annuity Markets, and Lifecycle Modeling. James Poterba 10 July 2008
 Retirement Saving, Annuity Markets, and Lifecycle Modeling James Poterba 10 July 2008 Outline Shifting Composition of Retirement Saving: Rise of Defined Contribution Plans Mortality Risks in Retirement
Revenue and Incentive Effects of Basis Step-Up at Death: Lessons from the 2010 Voluntary Estate Tax Regime
 Revenue and Incentive Effects of Basis Step-Up at Death: Lessons from the 2010 Voluntary Estate Tax Regime The MIT Faculty has made this article openly available. Please share how this access benefits
SHOULD YOU CARRY A MORTGAGE INTO RETIREMENT?
 July 2009, Number 9-15 SHOULD YOU CARRY A MORTGAGE INTO RETIREMENT? By Anthony Webb* Introduction Although it remains the goal of many households to repay their mortgage by retirement, an increasing proportion
New Evidence on the Demand for Advice within Retirement Plans
 Research Dialogue Issue no. 139 December 2017 New Evidence on the Demand for Advice within Retirement Plans Abstract Jonathan Reuter, Boston College and NBER, TIAA Institute Fellow David P. Richardson
NBER WORKING PAPER SERIES THE GROWTH IN SOCIAL SECURITY BENEFITS AMONG THE RETIREMENT AGE POPULATION FROM INCREASES IN THE CAP ON COVERED EARNINGS
 NBER WORKING PAPER SERIES THE GROWTH IN SOCIAL SECURITY BENEFITS AMONG THE RETIREMENT AGE POPULATION FROM INCREASES IN THE CAP ON COVERED EARNINGS Alan L. Gustman Thomas Steinmeier Nahid Tabatabai Working
Agricultural and Rural Finance Markets in Transition
 Agricultural and Rural Finance Markets in Transition Proceedings of Regional Research Committee NC-1014 St. Louis, Missouri October 4-5, 2007 Dr. Michael A. Gunderson, Editor January 2008 Food and Resource
Gender Differences in the Labor Market Effects of the Dollar
 Gender Differences in the Labor Market Effects of the Dollar Linda Goldberg and Joseph Tracy Federal Reserve Bank of New York and NBER April 2001 Abstract Although the dollar has been shown to influence
Retirement Savings: How Much Will Workers Have When They Retire?
 Order Code RL33845 Retirement Savings: How Much Will Workers Have When They Retire? January 29, 2007 Patrick Purcell Specialist in Social Legislation Domestic Social Policy Division Debra B. Whitman Specialist
Volume URL: Chapter Title: Introduction to "Pensions in the U.S. Economy"
 This PDF is a selection from an out-of-print volume from the National Bureau of Economic Research Volume Title: Pensions in the U.S. Economy Volume Author/Editor: Zvi Bodie, John B. Shoven, and David A.
NBER WORKING PAPER SERIES TAX EVASION AND CAPITAL GAINS TAXATION. James M. Poterba. Working Paper No. 2119
 NBER WORKING PAPER SERIES TAX EVASION AND CAPITAL GAINS TAXATION James M. Poterba Working Paper No. 2119 NATIONAL BUREAU OF ECONOMIC RESEARCH 1050 Massachusetts Avenue Cambridge, MA 02138 January 1987
In Debt and Approaching Retirement: Claim Social Security or Work Longer?
 AEA Papers and Proceedings 2018, 108: 401 406 https://doi.org/10.1257/pandp.20181116 In Debt and Approaching Retirement: Claim Social Security or Work Longer? By Barbara A. Butrica and Nadia S. Karamcheva*
Changes in the Distribution of After-Tax Wealth: Has Income Tax Policy Increased Wealth Inequality?
 Changes in the Distribution of After-Tax Wealth: Has Income Tax Policy Increased Wealth Inequality? Adam Looney* and Kevin B. Moore** October 16, 2015 Abstract A substantial share of the wealth of Americans
INVESTMENT COMPANY INSTITUTE. The IRA Investor Profile
 INVESTMENT COMPANY INSTITUTE The IRA Investor Profile traditional ira investors asset allocation, 2007 and 2008 INVESTMENT COMPANY INSTITUTE The IRA Investor Profile traditional ira investors asset allocation,
Vanguard Research May 2014
 The Retirement buck stops income here: among Vanguard wealthier retirees money market funds Vanguard Research May 2014 Anna Madamba, Ph.D., Stephen P. Utkus, John Ameriks, Ph.D. Based on a survey of wealthier,
The Spouse Effect On Participation And Investment Decisions For Retirement Funds
 The Spouse Effect On Participation And Investment Decisions For Retirement Funds Jaimie Sung 1 and Sherman Hanna 2 Worker decisions on retirement account participation and their investment choices for
HOW DOES 401(K) AUTO-ENROLLMENT RELATE TO THE EMPLOYER MATCH AND TOTAL COMPENSATION?
 AUTO-ENROLLMENT RELATE TO THE EMPLOYER MATCH AND TOTAL COMPENSATION?") October 2013, Number 13-14 RETIREMENT RESEARCH HOW DOES 401(K) AUTO-ENROLLMENT RELATE TO THE EMPLOYER MATCH AND TOTAL COMPENSATION? By Barbara A. Butrica and Nadia S. Karamcheva* Introduction Many workers
October 2013, Number 13-14 RETIREMENT RESEARCH HOW DOES 401(K) AUTO-ENROLLMENT RELATE TO THE EMPLOYER MATCH AND TOTAL COMPENSATION? By Barbara A. Butrica and Nadia S. Karamcheva* Introduction Many workers
Effects of Public Policies on the Disposition of Pre-Retirement. Lump-Sum Distributions: Rational and Behavioral Influences
 Effects of Public Policies on the Disposition of Pre-Retirement Lump-Sum Distributions: Rational and Behavioral Influences December 2007 Leonard E. Burman, Norma B. Coe, Michael Dworsky, William G. Gale
Online Appendix A: Verification of Employer Responses
 Online Appendix for: Do Employer Pension Contributions Reflect Employee Preferences? Evidence from a Retirement Savings Reform in Denmark, by Itzik Fadlon, Jessica Laird, and Torben Heien Nielsen Online
NBER WORKING PAPER SERIES THE TRANSITION TO PERSONAL ACCOUNTS AND INCREASING RETIREMENT WEALTH: MACRO AND MICRO EVIDENCE
 NBER WORKING PAPER SERIES THE TRANSITION TO PERSONAL ACCOUNTS AND INCREASING RETIREMENT WEALTH: MACRO AND MICRO EVIDENCE James M. Poterba Steven F. Venti David A. Wise Working Paper 8610 http://www.nber.org/papers/w8610
Boston Library Consortium IVIember Libraries
 Digitized by the Internet Archive in 2011 with funding from Boston Library Consortium IVIember Libraries http://www.archive.org/details/speculativedynam00cutl2 working paper department of economics SPECULATIVE
Capital Gains Realizations of the Rich and Sophisticated
 Capital Gains Realizations of the Rich and Sophisticated Alan J. Auerbach University of California, Berkeley and NBER Jonathan M. Siegel University of California, Berkeley and Congressional Budget Office
401(k) Plan Asset Allocation, Account Balances, and Loan Activity in 1998
 Plan Asset Allocation, Account Balances, and Loan Activity in 1998") February 2000 Jan. 401(k) Plan Asset Allocation, Account Balances, and Loan Activity in 1998 by Jack VanDerhei, Temple University; Sarah Holden, ICI; and Carol Quick, EBRI EBRI EMPLOYEE BENEFIT RESEARCH
February 2000 Jan. 401(k) Plan Asset Allocation, Account Balances, and Loan Activity in 1998 by Jack VanDerhei, Temple University; Sarah Holden, ICI; and Carol Quick, EBRI EBRI EMPLOYEE BENEFIT RESEARCH
What You Don t Know Can t Help You: Knowledge and Retirement Decision Making
 VERY PRELIMINARY PLEASE DO NOT QUOTE COMMENTS WELCOME What You Don t Know Can t Help You: Knowledge and Retirement Decision Making February 2003 Sewin Chan Wagner Graduate School of Public Service New
Online Robustness Appendix to Are Household Surveys Like Tax Forms: Evidence from the Self Employed
 Online Robustness Appendix to Are Household Surveys Like Tax Forms: Evidence from the Self Employed March 01 Erik Hurst University of Chicago Geng Li Board of Governors of the Federal Reserve System Benjamin
Every year, the Statistics of Income (SOI) Division
 Division") Corporation Life Cycles: Examining Attrition Trends and Return Characteristics in Statistics of Income Cross-Sectional 1120 Samples Matthew L. Scoffic, Internal Revenue Service Every year, the Statistics
Corporation Life Cycles: Examining Attrition Trends and Return Characteristics in Statistics of Income Cross-Sectional 1120 Samples Matthew L. Scoffic, Internal Revenue Service Every year, the Statistics
Segmenting the Middle Market: Retirement Risks and Solutions Phase I Report Update to 2010 Data
 Segmenting the Middle Market: RETIREMENT RISKS AND SOLUTIONS PHASE I UPDATE Segmenting the Middle Market: Retirement Risks and Solutions Phase I Report Update to 2010 Data Sponsored By Committee on Post-Retirement
Issue Brief. Salary Reduction Plans and Individual Saving for Retirement EBRI EMPLOYEE BENEFIT RESEARCH INSTITUTE
 November 1994 Jan. Feb. Salary Reduction Plans and Individual Saving for Retirement Mar. Apr. May Jun. Jul. Aug. EBRI EMPLOYEE BENEFIT RESEARCH INSTITUTE This Issue Brief explores the issues of salary
The Effects of Increasing the Early Retirement Age on Social Security Claims and Job Exits
 The Effects of Increasing the Early Retirement Age on Social Security Claims and Job Exits Day Manoli UCLA Andrea Weber University of Mannheim February 29, 2012 Abstract This paper presents empirical evidence
Premium Timing with Valuation Ratios
 RESEARCH Premium Timing with Valuation Ratios March 2016 Wei Dai, PhD Research The predictability of expected stock returns is an old topic and an important one. While investors may increase expected returns
Cash holdings determinants in the Portuguese economy 1
 17 Cash holdings determinants in the Portuguese economy 1 Luísa Farinha Pedro Prego 2 Abstract The analysis of liquidity management decisions by firms has recently been used as a tool to investigate the
NBER WORKING PAPER SERIES THE NEXUS OF SOCIAL SECURITY BENEFITS, HEALTH, AND WEALTH AT DEATH. James M. Poterba Steven F. Venti David A.
 NBER WORKING PAPER SERIES THE NEXUS OF SOCIAL SECURITY BENEFITS, HEALTH, AND WEALTH AT DEATH James M. Poterba Steven F. Venti David A. Wise Working Paper 18658 http://www.nber.org/papers/w18658 NATIONAL
Contrarian Trades and Disposition Effect: Evidence from Online Trade Data. Abstract
 Contrarian Trades and Disposition Effect: Evidence from Online Trade Data Hayato Komai a Ryota Koyano b Daisuke Miyakawa c Abstract Using online stock trading records in Japan for 461 individual investors
NBER WORKING PAPER SERIES MAKING SENSE OF THE LABOR MARKET HEIGHT PREMIUM: EVIDENCE FROM THE BRITISH HOUSEHOLD PANEL SURVEY
 NBER WORKING PAPER SERIES MAKING SENSE OF THE LABOR MARKET HEIGHT PREMIUM: EVIDENCE FROM THE BRITISH HOUSEHOLD PANEL SURVEY Anne Case Christina Paxson Mahnaz Islam Working Paper 14007 http://www.nber.org/papers/w14007
DOG BITES MAN: AMERICANS ARE SHORTSIGHTED ABOUT THEIR FINANCES
 February 2015, Number 15-3 RETIREMENT RESEARCH DOG BITES MAN: AMERICANS ARE SHORTSIGHTED ABOUT THEIR FINANCES By Steven A. Sass, Anek Belbase, Thomas Cooperrider, and Jorge D. Ramos-Mercado* Introduction
NBER WORKING PAPER SERIES DEFINED CONTRIBUTION PLANS, DEFINED BENEFIT PLANS, AND THE ACCUMULATION OF RETIREMENT WEALTH
 NBER WORKING PAPER SERIES DEFINED CONTRIBUTION PLANS, DEFINED BENEFIT PLANS, AND THE ACCUMULATION OF RETIREMENT WEALTH James Poterba Joshua Rauh Steven Venti David Wise Working Paper 12597 http://www.nber.org/papers/w12597
4 managerial workers) face a risk well below the average. About half of all those below the minimum wage are either commerce insurance and finance wor
 face a risk well below the average. About half of all those below the minimum wage are either commerce insurance and finance wor") 4 managerial workers) face a risk well below the average. About half of all those below the minimum wage are either commerce insurance and finance workers, or service workers two categories holding less
4 managerial workers) face a risk well below the average. About half of all those below the minimum wage are either commerce insurance and finance workers, or service workers two categories holding less
The Impact of Uncertainty on Investment: Empirical Evidence from Manufacturing Firms in Korea
 The Impact of Uncertainty on Investment: Empirical Evidence from Manufacturing Firms in Korea Hangyong Lee Korea development Institute December 2005 Abstract This paper investigates the empirical relationship
The use of real-time data is critical, for the Federal Reserve
 Capacity Utilization As a Real-Time Predictor of Manufacturing Output Evan F. Koenig Research Officer Federal Reserve Bank of Dallas The use of real-time data is critical, for the Federal Reserve indices
401(k) PLANS AND RACE
 PLANS AND RACE") November 2009, Number 9-24 401(k) PLANS AND RACE By Alicia H. Munnell and Christopher Sullivan* Introduction Many data sources show a disparity among racial and ethnic groups regarding participation in
November 2009, Number 9-24 401(k) PLANS AND RACE By Alicia H. Munnell and Christopher Sullivan* Introduction Many data sources show a disparity among racial and ethnic groups regarding participation in
Switching Monies: The Effect of the Euro on Trade between Belgium and Luxembourg* Volker Nitsch. ETH Zürich and Freie Universität Berlin
 June 15, 2008 Switching Monies: The Effect of the Euro on Trade between Belgium and Luxembourg* Volker Nitsch ETH Zürich and Freie Universität Berlin Abstract The trade effect of the euro is typically
Retirement Security: What s Working and What s Not? James Poterba MIT, NBER, & TIAA-CREF. Bipartisan Policy Center 30 July 2014
 Retirement Security: What s Working and What s Not? James Poterba MIT, NBER, & TIAA-CREF Bipartisan Policy Center 30 July 2014 Retirement Support: A Three Legged Stool? Three Legs: Social Security, Private
NBER WORKING PAPER SERIES CAPPING INDIVIDUAL TAX EXPENDITURE BENEFITS. Martin Feldstein Daniel Feenberg Maya MacGuineas
 NBER WORKING PAPER SERIES CAPPING INDIVIDUAL TAX EXPENDITURE BENEFITS Martin Feldstein Daniel Feenberg Maya MacGuineas Working Paper 16921 http://www.nber.org/papers/w16921 NATIONAL BUREAU OF ECONOMIC
Persistent Mispricing in Mutual Funds: The Case of Real Estate
 Persistent Mispricing in Mutual Funds: The Case of Real Estate Lee S. Redding University of Michigan Dearborn March 2005 Abstract When mutual funds and related investment companies are unable to compute
Construction Site Regulation and OSHA Decentralization
 XI. BUILDING HEALTH AND SAFETY INTO EMPLOYMENT RELATIONSHIPS IN THE CONSTRUCTION INDUSTRY Construction Site Regulation and OSHA Decentralization Alison Morantz National Bureau of Economic Research Abstract
EVIDENCE ON INEQUALITY AND THE NEED FOR A MORE PROGRESSIVE TAX SYSTEM
 EVIDENCE ON INEQUALITY AND THE NEED FOR A MORE PROGRESSIVE TAX SYSTEM Revenue Summit 17 October 2018 The Australia Institute Patricia Apps The University of Sydney Law School, ANU, UTS and IZA ABSTRACT
Additional Evidence and Replication Code for Analyzing the Effects of Minimum Wage Increases Enacted During the Great Recession
 ESSPRI Working Paper Series Paper #20173 Additional Evidence and Replication Code for Analyzing the Effects of Minimum Wage Increases Enacted During the Great Recession Economic Self-Sufficiency Policy
DIVIDEND POLICY AND THE LIFE CYCLE HYPOTHESIS: EVIDENCE FROM TAIWAN
 The International Journal of Business and Finance Research Volume 5 Number 1 2011 DIVIDEND POLICY AND THE LIFE CYCLE HYPOTHESIS: EVIDENCE FROM TAIWAN Ming-Hui Wang, Taiwan University of Science and Technology
Online Appendix of. This appendix complements the evidence shown in the text. 1. Simulations
 Online Appendix of Heterogeneity in Returns to Wealth and the Measurement of Wealth Inequality By ANDREAS FAGERENG, LUIGI GUISO, DAVIDE MALACRINO AND LUIGI PISTAFERRI This appendix complements the evidence
Retirement Savings and Household Wealth in 2007
 Retirement Savings and Household Wealth in 2007 Patrick Purcell Specialist in Income Security April 8, 2009 Congressional Research Service CRS Report for Congress Prepared for Members and Committees of
NBER WORKING PAPER SERIES EDUCATION SAVING INCENTIVES AND HOUSEHOLD SAVING: EVIDENCE FROM THE 2000 TIAA-CREF SURVEY OF PARTICIPANT FINANCES
 NBER WORKING PAPER SERIES EDUCATION SAVING INCENTIVES AND HOUSEHOLD SAVING: EVIDENCE FROM THE 2000 TIAA-CREF SURVEY OF PARTICIPANT FINANCES Jennifer Ma Working Paper 9505 http://www.nber.org/papers/w9505
I S S U E B R I E F PUBLIC POLICY INSTITUTE PPI PRESIDENT BUSH S TAX PLAN: IMPACTS ON AGE AND INCOME GROUPS
 PPI PUBLIC POLICY INSTITUTE PRESIDENT BUSH S TAX PLAN: IMPACTS ON AGE AND INCOME GROUPS I S S U E B R I E F Introduction President George W. Bush fulfilled a 2000 campaign promise by signing the $1.35
Advanced Topic 7: Exchange Rate Determination IV
 Advanced Topic 7: Exchange Rate Determination IV John E. Floyd University of Toronto May 10, 2013 Our major task here is to look at the evidence regarding the effects of unanticipated money shocks on real
Do Required Minimum Distributions Matter? The Effect of the 2009 Holiday on Retirement Plan Distributions
 Do Required Minimum Distributions Matter? The Effect of the 2009 Holiday on Retirement Plan Distributions Jeffrey Brown University of Illinois and NBER James Poterba MIT and NBER David Richardson TIAA-CREF
EXECUTIVE COMPENSATION AND FIRM PERFORMANCE: BIG CARROT, SMALL STICK
 EXECUTIVE COMPENSATION AND FIRM PERFORMANCE: BIG CARROT, SMALL STICK Scott J. Wallsten * Stanford Institute for Economic Policy Research 579 Serra Mall at Galvez St. Stanford, CA 94305 650-724-4371 wallsten@stanford.edu
The Press and Local Information Advantage *
 The Press and Local Information Advantage * Greg Miller Devin Shanthikumar June 10, 2008 PRELIMINARY AND INCOMPLETE PLEASE DO NOT QUOTE Abstract Combining a proprietary dataset of individual investor brokerage
Banking market concentration and consumer credit constraints: Evidence from the 1983 Survey of Consumer Finances
 Banking market concentration and consumer credit constraints: Evidence from the 1983 Survey of Consumer Finances Daniel Bergstresser Working Paper 10-077 Copyright 2001, 2010 by Daniel Bergstresser Working
Summary An issue in the development of the new health care reform plan is the effect on small business. One concern is the effect of a pay or play man
 Jane G. Gravelle Senior Specialist in Economic Policy October 2, 2009 Congressional Research Service CRS Report for Congress Prepared for Members and Committees of Congress 7-5700 www.crs.gov R40775 Summary
Portfolio Substitution and the Revenue Cost of the Federal Income Tax Exemption for State and Local Government Bonds
 Portfolio Substitution and the Revenue Cost of the Federal Income Tax Exemption for State and Local Government Bonds The MIT Faculty has made this article openly available. Please share how this access
REDUCING DEFAULT RATES OF REVERSE MORTGAGES
 July 2016, Number 16-11 RETIREMENT RESEARCH REDUCING DEFAULT RATES OF REVERSE MORTGAGES By Stephanie Moulton, Donald R. Haurin, and Wei Shi* Introduction For many U.S. households, Social Security benefits
Executive Financial Incentives and Payout Policy: Firm Responses to the 2003 Dividend Tax Cut
 THE JOURNAL OF FINANCE VOL. LXII, NO. 4 AUGUST 2007 Executive Financial Incentives and Payout Policy: Firm Responses to the 2003 Dividend Tax Cut JEFFREY R. BROWN, NELLIE LIANG, and SCOTT WEISBENNER ABSTRACT
THE STATISTICS OF INCOME (SOI) DIVISION OF THE
 DIVISION OF THE") 104 TH ANNUAL CONFERENCE ON TAXATION A NEW LOOK AT THE RELATIONSHIP BETWEEN REALIZED INCOME AND WEALTH Barry Johnson, Brian Raub, and Joseph Newcomb, Statistics of Income, Internal Revenue Service THE
104 TH ANNUAL CONFERENCE ON TAXATION A NEW LOOK AT THE RELATIONSHIP BETWEEN REALIZED INCOME AND WEALTH Barry Johnson, Brian Raub, and Joseph Newcomb, Statistics of Income, Internal Revenue Service THE
FE670 Algorithmic Trading Strategies. Stevens Institute of Technology
 FE670 Algorithmic Trading Strategies Lecture 4. Cross-Sectional Models and Trading Strategies Steve Yang Stevens Institute of Technology 09/26/2013 Outline 1 Cross-Sectional Methods for Evaluation of Factor
Defined contribution retirement plan design and the role of the employer default
 Trends and Issues October 2018 Defined contribution retirement plan design and the role of the employer default Chester S. Spatt, Carnegie Mellon University and TIAA Institute Fellow 1. Introduction An
The State of Young Adult s Balance Sheets: Evidence from the Survey of Consumer Finances
 The State of Young Adult s Balance Sheets: Evidence from the Survey of Consumer Finances Lisa J. Dettling Federal Reserve Board Joanne W. Hsu Federal Reserve Board May 2014 Abstract In this paper, we investigate
NBER WORKING PAPER SERIES LIQUIDITY RISK AND SYNDICATE STRUCTURE. Evan Gatev Philip Strahan. Working Paper
 NBER WORKING PAPER SERIES LIQUIDITY RISK AND SYNDICATE STRUCTURE Evan Gatev Philip Strahan Working Paper 13802 http://www.nber.org/papers/w13802 NATIONAL BUREAU OF ECONOMIC RESEARCH 1050 Massachusetts
NBER WORKING PAPER SERIES THE DRAWDOWN OF PERSONAL RETIREMENT ASSETS. James M. Poterba Steven F. Venti David A. Wise
 NBER WORKING PAPER SERIES THE DRAWDOWN OF PERSONAL RETIREMENT ASSETS James M. Poterba Steven F. Venti David A. Wise Working Paper 16675 http://www.nber.org/papers/w16675 NATIONAL BUREAU OF ECONOMIC RESEARCH
Retirement. Optimal Asset Allocation in Retirement: A Downside Risk Perspective. JUne W. Van Harlow, Ph.D., CFA Director of Research ABSTRACT
 Putnam Institute JUne 2011 Optimal Asset Allocation in : A Downside Perspective W. Van Harlow, Ph.D., CFA Director of Research ABSTRACT Once an individual has retired, asset allocation becomes a critical
Online Appendix to The Costs of Quantitative Easing: Liquidity and Market Functioning Effects of Federal Reserve MBS Purchases
 Online Appendix to The Costs of Quantitative Easing: Liquidity and Market Functioning Effects of Federal Reserve MBS Purchases John Kandrac Board of Governors of the Federal Reserve System Appendix. Additional
Issue Brief. Lump-Sum Distributions: Fulfilling the Portability Promise or Eroding Retirement Security? EBRI EMPLOYEE BENEFIT RESEARCH INSTITUTE
 October 1996 Jan. Feb. Lump-Sum Distributions: Fulfilling the Portability Promise or Eroding Retirement Security? Mar. Apr. May Jun. Jul. Aug. EBRI EMPLOYEE BENEFIT RESEARCH INSTITUTE The critical decision
Changing patterns in household ownership of municipal debt. Daniel Bergstresser and Randolph Cohen 2016 Municipal Finance Conference
 Changing patterns in household ownership of municipal debt Daniel Bergstresser and Randolph Cohen 2016 Municipal Finance Conference 1 Punchline 6% 5% Share of Households Owning Municipal Bonds, 1989-2013
In the United States, most tax incentives for saving are. The Taxation of Retirement Saving: Choosing Between Front Loaded and Back Loaded Options
 The Taxation of Retirement Saving The Taxation of Retirement Saving: Choosing Between Front Loaded and Back Loaded Options Abstract - We examine retirement savers choices between front and back loaded
An Analysis of the ESOP Protection Trust
 An Analysis of the ESOP Protection Trust Report prepared by: Francesco Bova 1 March 21 st, 2016 Abstract Using data from publicly-traded firms that have an ESOP, I assess the likelihood that: (1) a firm
Comments on Michael Woodford, Globalization and Monetary Control
 David Romer University of California, Berkeley June 2007 Revised, August 2007 Comments on Michael Woodford, Globalization and Monetary Control General Comments This is an excellent paper. The issue it
SENSITIVITY OF THE INDEX OF ECONOMIC WELL-BEING TO DIFFERENT MEASURES OF POVERTY: LICO VS LIM
 August 2015 151 Slater Street, Suite 710 Ottawa, Ontario K1P 5H3 Tel: 613-233-8891 Fax: 613-233-8250 csls@csls.ca CENTRE FOR THE STUDY OF LIVING STANDARDS SENSITIVITY OF THE INDEX OF ECONOMIC WELL-BEING
Demonstrate Approval of Loans by a Bank
 1 Running head: The Data Consists of 100 Cases of Hypothetical Data to Demonstrate Approval of Loans by a Bank Name Course Subject 2 Introduction There has been witnessed an alarming trend in the number
Online Appendix to. The Value of Crowdsourced Earnings Forecasts
 Online Appendix to The Value of Crowdsourced Earnings Forecasts This online appendix tabulates and discusses the results of robustness checks and supplementary analyses mentioned in the paper. A1. Estimating
Journal of Insurance and Financial Management, Vol. 1, Issue 4 (2016)
") Journal of Insurance and Financial Management, Vol. 1, Issue 4 (2016) 68-131 An Investigation of the Structural Characteristics of the Indian IT Sector and the Capital Goods Sector An Application of the
Journal of Insurance and Financial Management, Vol. 1, Issue 4 (2016) 68-131 An Investigation of the Structural Characteristics of the Indian IT Sector and the Capital Goods Sector An Application of the
ICI RESEARCH PERSPECTIVE
 ICI RESEARCH PERSPECTIVE 1401 H STREET, NW, SUITE 1200 WASHINGTON, DC 20005 202-326-5800 WWW.ICI.ORG APRIL 2018 VOL. 24, NO. 3 WHAT S INSIDE 2 Mutual Fund Expense Ratios Have Declined Substantially over