NBER WORKING PAPER SERIES THE DISTRIBUTION OF PAYROLL AND INCOME TAX BURDENS, Andrew Mitrusi James Poterba
|
|
|
- Brice Davidson
- 6 years ago
- Views:
Transcription
1 NBER WORKING PAPER SERIES THE DISTRIBUTION OF PAYROLL AND INCOME TAX BURDENS, Andrew Mitrusi James Poterba Working Paper NATIONAL BUREAU OF ECONOMIC RESEARCH 1050 Massachusetts Avenue Cambridge, MA May 2000 We are grateful to Inna Shapiro and especially to Daniel Feenberg for assistance in developing the TAXSIM program, to Daniel Bergstresser and Leemore Dafny for research assistance, to Robert Carroll for providing us with tabulations from the 1995 U.S. Treasury W2/1040 merge file, and to Susan Dynarski, Jonathan Gruber, Doug Holtz-Eakin, Karl Scholz, Harvey Rosen, and two referees for very helpful comments. We thank the Smith Richardson Foundation, the National Science Foundation (Poterba), and the National Bureau of Economic Research for research support. The views expressed herein are those of the authors and not necessarily those of the National Bureau of Economic Research by Andrew Mitrusi and James Poterba. All rights reserved. Short sections of text not to exceed two paragraphs, may be quoted without explicit permission provided that full credit, including notice, is given to the source.
2 The Distribution of Payroll and Income Tax Burdens, Andrew Mitrusi and James Poterba NBER Working Paper No May 2000 JEL No. H2 ABSTRACT This paper presents new evidence on the level and distribution of income and payroll tax burdens for U.S. families over the period. During this period, payroll taxes have become an increasingly important component of the tax burden for many low- and middle-income families. This paper uses a new and expanded version of the NBER TAXSIM program to analyze the impact of legislative changes in income and payroll taxes. Averaged over all families, the combined 1999 payroll and income tax burden was quite similar to what it would have been if the 1979 income and payroll tax laws had remained in force for the last two decades, with only inflation-based adjustments to tax brackets. The mix of income and payroll taxes has changed, however. As a result of the expansion of the Earned Income Tax Credit in the late 1980s and early 1990s, as well as other changes in the federal personal income tax, payroll tax liabilities now exceed income tax liabilities for nearly two thirds of families. In 1979, payroll taxes exceeded income taxes for 44 percent of families. Andrew Mitrusi James Poterba NBER Department of Economics, E Massachusetts Avenue MIT Cambridge MA Cambridge, MA (617) (617) mitrusi@nber.org and NBER poterba@mit.edu
3 The relative importance of income taxes and payroll taxes in the federal fiscal system has shifted dramatically in the last four decades. Until 1963, federal receipts from the individual income tax were more than twice as great as federal payroll tax revenues. In 1995, payroll tax receipts were approximately equal to income tax receipts. While income tax revenues rose more sharply than payroll taxes in the late 1990s, the long-term projections of growing outlays for Social Security and Medicare suggest that the payroll taxes used to finance these programs will remain a central component of the fiscal landscape. The importance of considering the tax burden from both income and payroll taxes is evident in earlier studies that combine payroll and income taxes, such as those by the Joint Committee on Taxation (1993) or the Congressional Budget Office (1998). The expansion of the Earned Income Credit during the 1990s has reduced and in some cases eliminated personal income tax liability for many low-income families. Payroll taxes nevertheless remain significant for most of these families. Recent changes in the payroll tax, notably elimination of the taxable earnings maximum for the Hospital Insurance tax, have also affected the magnitude of payroll tax liabilities for many upper income families. This paper investigates the relative importance of income and payroll tax burdens for families at different points in the income distribution. The analysis focuses on the period 1979 to 1999, and it includes an investigation of how the Taxpayer Relief Act of 1997 (TRA97) affected the distribution of personal income tax burdens in the late 1990s. The analysis relies on an expanded and updated version of the National Bureau of Economic Research's TAXSIM model. We extend this model, which has historically been used to study only changes in the distribution of income tax burdens, to include payroll taxes as well. The paper is divided into four sections. The first summarizes the key legislative changes in both the payroll tax and the income tax over the period. It describes the Taxpayer Relief Act of 1997 in particular detail, since that reform receives special emphasis in our analysis. Section two presents summary information on the distribution of income and payroll tax liabilities over the period. It considers the average income and payroll tax burden on families in various income categories, as well as the fraction of families for which payroll taxes exceed income taxes. The analysis highlights the role 1
4 of the Earned Income Tax Credit in affecting family tax burdens. We compare tax burdens under different tax regimes using two baseline distributions of family income, one based on income tax returns and other data from 1995, and the other based on similar data from Section three presents a detailed summary of how the Taxpayer Relief Act of 1997 affected income tax burdens for families in different income categories. A brief concluding section outlines several issues that remain for future research. A substantial appendix describes the TAXSIM payroll tax calculator. It also explains the algorithms that we use to identify families that do not file income tax returns, to allocate labor income between spouses in married couples, and to impute eligibility for various tax credits that were enacted in the Taxpayer Relief Act of Federal Income and Payroll Tax Changes, There have been four major legislative changes in the federal personal income tax code in the last two decades. The payroll tax has also been changed several times, but the changes have been less dramatic than those in the income tax code. This section summarizes these legislative changes. 1.1 Federal Income Tax Changes, There were four major federal income tax reforms during the period. These were the Economic Recovery Tax Act of 1981 (ERTA), the Tax Reform Act of 1986 (TRA86), the Omnibus Budget Reconciliation Act of 1993 (OBRA93), and the Taxpayer Relief Act of 1997 (TRA97). These reforms are described in detail elsewhere, for example Steuerle (1992), so with the exception of TRA97, we will not provide an in-depth summary. ERTA significantly reduced personal income taxes across-the-board. It incorporated a three-year period of tax reduction, with marginal rates on all but the highest income taxpayers declining substantially during the period. The top marginal tax rate on earned income was 50 percent before as well as after ERTA, but the legislation reduced the top marginal rate on unearned income from 70 percent to 50 percent beginning in This reform also reduced the top statutory marginal tax rate on long-term 2
5 capital gains from 28 percent to 20 percent. We consider tax burdens in 1984 in our analysis below, because by 1984 the ERTA reforms were fully effective. TRA86 continued the reduction in top marginal tax rates that had been part of ERTA, but it also eliminated the capital gains tax preference for most taxpayers. For taxpayers at the highest income levels, TRA86 reduced marginal tax rates from 50 percent in 1986, to 39 percent in 1987 and to 28 percent in TRA86 introduced a hump-shaped pattern in marginal tax rates, with some taxpayers below the highest income groups facing a 33 percent marginal tax rate. It also eliminated the tax preference for capital gains, although the tax rate on such gains was capped at 28 percent. This change increased the statutory tax rate on gains for many high-income taxpayers. TRA86 raised the standard deduction and the personal exemption, thereby reducing the number of low-income families that needed to file income tax returns. It also expanded the Earned Income Tax Credit, which reduced income tax liabilities for low-income families with earned income. Because some provisions in TRA86 phased in over two years, we consider tax liabilities in 1989 as an illustration of tax burdens under the TRA86 regime. OBRA93 partially reversed the changes in the top marginal tax rate that had been enacted in In many ways it extended and amplified changes that were enacted as part of the Omnibus Budget Reconciliation Act of The 1990 Act eliminated the "hump shaped" distribution of marginal tax rates that was embodied in the 1986 law and replaced it with a top marginal tax rate of 31 percent. This led to a three-bracket income tax rate schedule, with rates of 15, 28, and 31 percent. OBRA93 raised the top marginal tax rate to 36% for joint filers with incomes above $140,000 ($115,000 for single filers). In addition, it raised the marginal tax rate to 39.6% (36% plus a 10% surtax) for individual or married taxpayers with taxable incomes of more than $250,000. Many high-income taxpayers face tax rates above this statutory maximum of 39.6% as a result of the phase-out provisions governing various deductions. OBRA93 also raised the share of Social Security benefits that could be taxed from 50 to 85 percent. 1.2 The Taxpayer Relief Act of 1997 TRA97 included a number of new tax credits and once again altered the tax rate on long-term capital gains. The first such credit is the Child Tax Credit, which provides a $500 credit ($400 for 1998) 3
6 for each qualified child of a taxpayer. To qualify, a child must be under the age of 17. This credit was fully available to married joint filers with modified adjusted gross income (AGI) of less than $110,000, and to single taxpayers or heads of household with modified AGI of less than $75,000. For each $1,000 of modified AGI in excess of these thresholds, the Child Tax Credit is reduced by $50 per child until the credit is exhausted. The Child Tax Credit is not refundable, and it is only available for dependent children who are under the age of 17. It does not generate any benefit for low-income families with no federal income tax liabilities. Our estimates, which are described in more detail in the appendix, suggest that the Child Tax Credit reduced family income tax liability for only 69.4 percent of under-17 dependents in (We estimate that 76.3 percent of all dependents claimed on tax returns in 1995 were under the age of 17.) Although some low-income families cannot use the Child Tax Credit to reduce their income tax liability, a large fraction of the tax benefits associated with the Child Tax Credit accrue to low- and modest-income families. We estimate that 35 percent of the under-17 dependents whose families benefit from the Child Tax Credit have family incomes of less than $40,000. TRA97 also reduced the maximum tax rate on long-term capital gains from 28 percent to 20 percent, effective May 7, For taxpayers in the 15-percent income tax bracket, the maximum longterm capital gains tax rate became 10 percent. TRA97 also introduced an "intermediate" capital gains tax rate that applied to gains held from twelve to thirty months, but this rate was eliminated in Because we consider tax liabilities for families facing the 1999 tax law, we do not consider the impact of the intermediate capital gains tax rate. Finally, TRA97 included a number of new tax incentives for college attendance. The two most significant are the HOPE Credit and the Lifetime Learning Credit (LLC). The HOPE credit is a nonrefundable credit of up to $1500 per student. It can be used to offset educational expenses in a student s first two years of post-secondary education. It is a 100 percent credit on the first $1000 of tuition and fees, and a 50 percent credit on the next $1000 of such fees. The full value of the credit is available to married joint filers with modified AGI of less than $80,000. The credit is completely phased out for 4
7 married joint filers with modified AGI of more than $100,000. For heads of household and single filers, the HOPE Credit phases out between $40,000 and $50,000 of modified AGI. The HOPE Credit can be claimed by the taxpayer, the taxpayer's spouse, or on behalf of any of the taxpayer's dependents. For families with a single HOPE Credit recipient, the phase-out of the credit raises marginal income tax rates by 7.5 percent in the relevant AGI range. Some tax returns might have more than one beneficiary, and for such returns, the marginal tax rate effects can be very large. To illustrate this, consider a family with two children, ages 19 and 20, who are attending college. Assume that the family has an adjusted gross income of $90,000. Before TRA97, this family faced a marginal federal income tax rate of 28 percent. The HOPE phase-out raises this tax rate to 43 (28 + 2*7.5) percent. For a singleparent family, the effect is even more dramatic, since the phase-out occurs over the $40-50,000 income range. A single parent household with two HOPE credit recipients could therefore face a 30 percent increase in marginal income tax rates as a result of the phase-out provisions. One important feature of the HOPE Credit, emphasized in Cronin (1997) and Dynarski (1999), is that it applies to net tuition and fees. Federal Pell grants and other financial aid that post-secondary schools provide to low-income enrollees can reduce the value of the HOPE Credit, and for some students, they may render the HOPE credit worthless. (This fact has led to interesting discussions, summarized in Dynarski (1999), about the ultimate incidence of the HOPE credit and the extent to which it benefits students attending college or is offset by increases in the net price charged by post-secondary institutions.) The Lifetime Learning Credit provides taxpayers with a credit equal to 20 percent of net educational expenditures, up to a maximum credit of $1,000. Like the HOPE Credit, the LLC is phased out for married joint filers over the $80,000-$100,000 modified AGI range, and for single filers over the $40-50,000 modified AGI range. The LLC is available to anyone enrolled in a post-secondary educational institution. The phase-out raises marginal tax rates by up to 5 percentage points for families in the phase-out income range. The LLC is computed on a per-return basis, rather than a per-student basis, and it is not possible to claim both a HOPE Credit and a Lifetime Learning Credit for the same eligible student. Because the HOPE Credit offers a 100 percent or a 50 percent credit, depending on the 5
8 amount of tuition outlays, and the LLC offers only a 20 percent credit, those who can use the HOPE Credit will presumably choose to use it before utilizing the Lifetime Learning Credit. The LLC is not restricted to two years of higher education spending, as the HOPE Credit is. We estimate the distributional effects of the tax credits embodied in TRA97 by "aging" tax returns from 1995 to 1999, and then imputing information on whether families are likely to have dependents who are eligible for these credits. While detailed information on individual income tax returns filed for the 1998 tax year will not be available for some time, the IRS has released preliminary data on the use of education tax credits in 1998, and we compare our estimates with these actual data. 1.3 Changes in Payroll Tax Rates and the Payroll Tax Base, The payroll taxes that are used to finance the Social Security and Hospital Insurance (Medicare) programs have not changed as dramatically as federal income taxes during the last twenty years. In 1979, the combined employer and employee payroll tax rate was percent. In 1999, this rate was 15.3 percent. Table 1 shows the changes in the combined employer and employee tax rate over the last two decades, as well as in the taxable maximum level of earnings for both payroll taxes. For high-earning taxpayers, the most significant payroll tax changes during the last two decades were the increase in the Hospital Insurance maximum taxable earnings from $51,300 to $125,000 in 1991, and the subsequent elimination of the upper limit on taxable earnings in The payroll tax rates have been 12.4 percent for Social Security, and 2.9 percent for Hospital Insurance, since The Distribution of Income and Payroll Tax Liabilities, The NBER TAXSIM model is a computer program that calculates federal income tax and payroll tax liabilities for a representative sample of U.S. families. The program analyzes data from the Statistics of Income (SOI) Public Use File, which is a stratified random sample of U.S. taxpayers that oversamples high-income tax returns. Feenberg and Coutts (1993) describe this program in some detail. TAXSIM currently offers detailed federal tax calculators for the period. While it has traditionally 6
9 focused on federal income tax liability, we extend its capacity to include payroll taxes as well. We focus our analysis on the period. We do not consider excise taxes at either the federal or state-local level, estate taxes, or corporate income taxes, in our analysis of tax burdens. Some other studies of household tax burdens, such as the ITEP model described by Ettlinger and O'Hare (1998) or some of the models analyzed by the Congressional Budget Office, also include taxes besides income and payroll taxes. Our limited analysis avoids a number of difficult incidence issues, discussed for example in Bradford (1995) and Joint Committee on Taxation (1993), associated with taxes other than income and payroll taxes. We focus our efforts on describing two taxes that have traditionally been assumed to fall on the families that pay them, namely the individual income tax and the payroll tax (including the employer's share of this tax). The most recent SOI Public Use File contains tax returns for the 1995 tax year. Because we are interested in family tax liabilities under the most recent federal tax law, we "age" the information from 1995 to We do this using an algorithm described in the appendix that relies on aggregate information on tax returns as reported by the Internal Revenue Service, along with data from the National Income and Product Accounts. We also augment the data from the SOI Public Use File with data from the Current Population Survey (CPS) on families that do not file tax returns. Our non-filer imputation procedure is also described in the appendix. Throughout our analysis, we focus on families as our basic unit of observation, and calendar years as the basic unit of time. We follow the tax code in defining "families" by excluding dependent tax filers from family units. When we stratify families according to their income, we focus on an "Adjusted AGI" measure. This is defined as Adjusted Gross Income (AGI) as reported on tax returns, plus employer-paid Social Security and Medicare taxes, plus the portion of Social Security benefits that are excluded from AGI, plus tax exempt bond interest, plus contributions to Individual Retirement Accounts and Keoghs. Some other studies of the distribution of income or payroll tax burdens, such as Ettlinger and O'Hare (1996), use even more expansive definitions of family income that include estimates of 7
10 transfer payments and other resource flows. We restrict our analysis to an income measure that can be constructed from data on tax returns. The appendix describes how we impute each family's payroll taxes. There are several ways to summarize the distribution of income and payroll tax liabilities for the period. We first describe the distribution of both types of taxes across families in different income categories in We then consider how the level of income and payroll taxes has varied over time, and also present information on the relative importance of the two taxes for families at different points in the income distribution. We finally isolate the effect of the Earned Income Tax Credit in affecting tax liabilities over the period that we study. 2.1 Income Taxes and Payroll Taxes, 1999 Table 2 presents our estimate of the distribution of income and payroll tax liabilities across families in calendar year Table 2 includes entries for the mean personal income tax and the mean payroll tax for families in different adjusted AGI categories. Our measure of the payroll tax burden combines both the employer and employee share of this tax, just as our measure of family income is defined before payment of either employer or employee payroll taxes. Table 2 also shows the fraction of families for whom the payroll tax is greater than the income tax, and for the fraction of families for whom the income tax is greater than the payroll tax, again stratified by adjusted AGI. A substantial group of families have zero payroll and income tax liabilities, so in some adjusted AGI categories, the sum of the percent of families with payroll taxes greater than income taxes, and the percent with income taxes greater than payroll taxes, adds up to less than 100 percent. Table 2 shows that for most families in income classes below $100,000, the average payroll tax burden exceeds the average personal income tax burden. The disparities are particularly clear at lower income levels. For families with between $20,000 and $30,000 in adjusted AGI, for example, mean payroll taxes are roughly three times as great as mean income taxes. For families in lower adjusted AGI categories, mean federal income taxes are negative. This reflects the refundable portion of the Earned Income Tax Credit generating negative income tax payments. The average federal income tax burden does not approximate the average payroll tax burden until the $75-100,000 adjusted AGI category. At 8
11 higher adjusted AGI levels, income tax payments are substantially larger than payroll tax payments. This reflects both the capped base for the Social Security payroll tax, and the low rate for the Hospital Insurance payroll tax (relative to income tax rates). Payroll taxes exceed income taxes for 62 percent of families. At income levels below $50,000, more than three-quarters of families have payroll tax bills that exceed their income taxes. At adjusted AGI levels above $200,000, income taxes exceed payroll taxes for virtually all families. At the lowest income levels, there are a substantial number of families with no income or payroll tax liability. Nearly half of families with adjusted AGI of less than $10,000 have neither payroll nor income tax liabilities. These families are not classified as having payroll taxes greater than income taxes, or vice versa. The results on income versus payroll taxes in Table 2 are broadly consistent with findings reported by the Congressional Budget Office (CBO) (1998). For example, CBO (1998) reports that at family income between $40,000 and $50,000, 78 percent of families pay combined employer and employee payroll taxes that exceed their income tax. Our estimate is 74.5 percent. At lower income levels there are greater disparities between our calculations and those in CBO (1998), and there are also some significant differences at higher income levels. For families with incomes between $100,000 and $200,000, for example, we estimate that 84 percent face income taxes greater than their payroll taxes, while the CBO (1998) estimate is 66 percent. Several factors could account for differences between our results and those in CBO (1998). One is that we use a less expansive income definition than CBO, since we do not impute any information such as transfer payments that is not reported on tax returns. A second possibility is different assumptions about the recent time path of various income components, particularly capital gain realizations, that represent a large share of income for the highest-income families. Any analysis of post-1995 tax distributional patterns requires making a forecast of how the income distribution has evolved since 1995 (the last year for which the SOI Public Use File is available). We describe in the appendix our algorithm for "aging" the 1995 income distribution to 1999, which differs from that used by CBO. We use more disaggregate information on the aggregate value of income flows to "age" the 1995 income distribution to 9
12 1999 than the CBO algorithm does. Finally, our approach to identifying nonfiler families may differ from that used by the CBO. In future work, we hope to explore the source of these differences. We have not made detailed comparisons of our findings and those from other models, such as the ITEP model described by Ettlinger and O'Hare (1998). We suspect, however, that what differences arise are likely to stem from factors similar to those that may cause divergence between our results and CBO's. 2.2 Income Taxes and Payroll Taxes: The Experience Table 2 provides information on the pattern of income tax and payroll tax liabilities in 1999, but it does not place these liabilities in historical context. Table 3 develops a longer-term perspective on the relative magnitude of tax liabilities. It shows the results of applying income and payroll tax rules from five years , 1984, 1989, 1994, and to the set of families whose 1999 income and payroll taxes we analyzed in Table 2. Recall that this "1999 family income distribution" was constructed by "aging" families from the 1995 SOI Public Use File and the 1995 Current Population Survey to When we apply the tax laws from other years to this set of families, we re-define the income thresholds in each year's tax laws to correspond to 1999 price levels. We make these adjustments using price changes as reflected in the Consumer Price Index. Thus, if the Consumer Price Level for 1999 was double that for an earlier year, we would double all of the nominal magnitudes in the income tax law for the earlier year, and then apply the resulting tax code to our data set of 1999 families. The calculations in Table 3, and in several subsequent tables, indicate what would have happened if the bracket amounts in tax codes from earlier years had been indexed for inflation but not for other changes in the economy. They assume that the U.S. economy would have evolved precisely as it did over the last twenty years despite this difference in the tax code. By holding the pre-tax distribution of family income constant, we are able to focus on the impact of tax law changes alone. Our assumption that the tax law does not affect the pretax distribution of income is an important over-simplification, however. Many studies, such as Feldstein (1995), Gruber and Saez (2000), and others surveyed in the latter study, suggest that there may be important links between the distribution of marginal tax rates and reported family income. 10
13 Table 3 shows the percentage of families for whom the payroll tax would have exceeded the personal income tax if the tax laws from various years had applied in The table shows significant change in the relative importance of the income and the payroll tax over the period. The upper panel of the table reports percentages as a share of all families in various adjusted AGI ranges. If the 1979 and 1984 tax laws had applied in 1999, only 19.1 and 28.8 percent of families with adjusted AGI between $50,000 and $75,000 ($1999) would have faced payroll taxes that were greater than their income tax liabilities. Under the 1999 tax law, two thirds of the families in this group faced greater payroll taxes than income taxes. Between 1984 and 1989, the percentage of families in this income group with payroll taxes greater than income taxes rose from 28.8 to 63.4 percent, highlighting the importance of the Tax Reform Act of 1986 in affecting the relative importance of income and payroll taxes. The last two decades have also seen some changes in the relative importance of payroll and income taxes for families at the top of the income distribution. In 1999, nearly one family in six with AGI between $100,000 and $200,000 paid more in payroll taxes than in income taxes. In years before the Tax Reform Act of 1986, this fraction was negligible. In 1989, less than one family in ten in this adjusted AGI category paid more in payroll than in income taxes. The increase in the number of high-income families with payroll taxes greater than income taxes thus appears to be due to both the changes in the Tax Reform Act of 1986, and the changes in the payroll tax cap in the early 1990s. The lower panel of Table 3 presents information on only those families who paid positive income or payroll tax in each year. While restricting the sample to this group has very little effect on our results for families with income of more than $40,000 in 1999, it has substantial effects at lower income levels. For families with 1999 adjusted AGI between $10,000 and $20,000, for example, 71.5 percent of all families but 87.1 percent of families who paid some taxes had 1999 payroll taxes in excess of personal income taxes. In general, the share of families with payroll taxes greater than income taxes is larger when we restrict the families we are considering to those with positive tax liability of some type. We find that just over 70 percent of families with positive taxes face payroll taxes that are larger than income taxes. 11
14 CBO (1998) reports an even larger value, 80 percent. In our data, the effect of conditioning on positive tax liability is similar in 1979, 1984, 1989, 1994, and Table 3 presents information on the relative magnitude of income and payroll tax liabilities, but it does not consider the absolute magnitude of either tax liability. Tables 4 and 5 present summary information on tax levels. The tables use two different family income distributions to compare the level of payroll taxes (Table 4) and personal income taxes (Table 5) for families at different income levels. The first is the 1999 family income distribution that was used to develop the summary statistics in Tables 2 and 3. As explained above, this income distribution is based on data from 1995 income tax returns, augmented with data from the 1995 Current Population Survey, and then "aged" to The second income distribution that we consider is the 1979 family income distribution. We construct this income distribution from the 1979 SOI Public Use File, augmented with data from the 1979 Current Population Survey. Nominal magnitudes in this 1979 family income distribution are then converted to 1999 quantities using the change in the Consumer Price Index between 1979 and We consider two income distributions to explore the robustness of our findings to shifts in the underlying characteristics of the families whose taxes we are studying. The 1979 family income distribution differs in various ways from the 1999 distribution. The share of wage income amongst the highest income families is lower, for example (see Feenberg and Poterba (2000)). There are differences in the relative importance of married couples and single filers at different family income levels. The average real income level of families in 1979 is also lower than that of families in 1999, since wages and other incomes have grown faster than the price level over the intervening two decades. Tables 4 and 5 reflect this in showing lower average payroll and income tax burdens when we use the 1979 family income distribution rather than the 1999 family income distribution. Table 4 reports information on the change in real payroll tax burdens over the period. The table shows that payroll taxes have increased modestly for middle-income families during this time period. The most striking change between two adjacent years in the table is that for high-income families 12
15 between 1989 and This is the result of the "uncapping" of the Hospital Insurance payroll tax for years after For some high-earning families, this change more than doubled payroll taxes. The upper and lower panels of Table 4 show similar broad trends in the average payroll tax burden for families in various adjusted AGI categories. This suggests that the changes in family structure and in family income composition between 1979 and 1999 have not significantly affected the family attributes that determine the relationship between payroll tax liability and adjusted AGI. Table 5 is similar to Table 4, except that it reports information on income taxes. It also presents summary statistics based on the 1999 family income distribution, as well as based on the 1979 family income distribution. The table shows that average income tax burdens have declined in the last two decades across all income classes. Consider the results in the upper panel, which relates to the 1999 family income distribution. In 1999, the average family's income tax liability would have been 33 percent greater if the 1979 income tax code (with bracket break-points adjusted for changes in the Consumer Price Index) was still in force than it was with the actual 1999 tax code. There is significant variation in the pattern of tax liabilities across income categories. For families with adjusted AGI in the $75-100,000 range for 1999, income taxes under the 1979 law would have been 24 percent greater than they actually were. For those in the $20-30,000 adjusted AGI class, taxes under the 1979 law would have been 57 percent greater than 1999 taxes. Taxes for families in the highest income category, with more than $1 million in 1999 adjusted AGI, would have been 39 percent higher under 1979 rather than 1999 law. For the lowest income families (with adjusted AGI of less than $10,000), net tax liability would have been less negative ($-74) under the 1979 law than under the prevailing 1999 law ($-247). The entries for the highest income families show the sharp impact of the 1986 Tax Reform Act in reducing tax burdens, and the impact of the 1993 Omnibus Budget Reconciliation Act (which raised top marginal rates) in raising tax burdens. Table 5 shows that the most significant change in average income tax liability occurs between 1984 and 1989, the years that bracket the Tax Reform Act of The average family's income tax liability declines by 22 percent as a consequence of this reform. In evaluating this statistic, it is important 13
16 to remember that this is a "no behavioral response" measure, so it does not incorporate changes in the amount of income reported, and hence the amount of tax paid, as a result of reductions in marginal tax rates. Taxpayer responses would partly offset the decline in average tax burdens shown in the table. Such offsets would be particularly important if we were disaggregating the various components of income tax liability, and considering for example the contribution of income taxes on realized capital gains. Capital gains realizations are an aspect of taxpayer behavior that appears to be particularly sensitive to marginal tax rates (see Poterba (2000) for a summary of recent research). The lower panel of Table 5 presents information on tax burdens in various years using the 1979 family income distribution rather than the 1999 income distribution. As in Table 4, the results in the upper and lower panels show the same broad trends in the effect of tax legislation on family tax burdens. There are some differences, however, that are attributable to differences in the composition of income for families in various adjusted AGI categories in 1999 and For example, for the highest income category, families with $1 million or more in adjusted AGI, the 1979 income distribution suggests that taxes would have averaged 29 percent greater under the 1979 tax law than under the 1999 law. Data from the 1999 family income distribution suggest a 39 percent larger effect; this reflects the growing importance of wage income amongst these families during the last two decades. Because the 1979 family income distribution has a lower mean income than the 1999 family income distribution, the average tax burden is lower when we use the 1979 than the 1999 income distribution. Using the 1999 family income distribution, we estimate that the average family's income tax burden was $6220. Using the 1979 family income distribution and the 1999 tax law, we estimate an average income tax burden of $3810. This is only 61 percent of the estimate using the 1999 family income distribution. Table 6 combines the information in Tables 4 and 5, and shows the total payroll and income tax burden for families in various adjusted AGI categories. At the highest income levels, the entries in the table are very similar to those in Table 5, since the income tax is the primary tax on families in this income range. At lower income ranges, however, the table highlights the interplay between income and payroll tax liabilities. For families with 1999 adjusted AGI below $10,000, the table shows a decline of 14
17 roughly one third of total tax liabilities between 1979 and There is a reversal of trend during this time period, with average tax burdens rising from $225 to $307 (measured in 1999 dollars) between 1979 and 1984, and then declining to $153 by The entries in Table 6 show that for families with adjusted AGI between $10,000 and $200,000, using the 1999 distribution of family income, combined tax burdens in 1979 and 1999 were very similar. The table again shows an increase in tax burdens between 1979 and 1984, followed by decline in subsequent years. For the small set of families with adjusted AGI in excess of $200,000, the table shows a decline in tax burdens between 1979 and The year with the lowest tax burden for these families is 1989, when the Tax Reform Act of 1986 had been fully phased in. The lower panel of Table 6 repeats the calculations in the upper panel using the 1979 family income distribution rather than the 1999 family income distribution. There are some differences between the results in the two panels. The lower panel shows more evidence of rising total tax burdens between 1979 and While the increase in tax burdens from 1979 to 1999 is modest for families with adjusted AGI below $40,000, at income levels between $40,000 and $200,000 a clear pattern of rising tax burdens emerges. For families with adjusted AGI between $75,000 and $100,000 in 1999, based on the 1979 family income distribution, combined income and payroll taxes were 7.4 percent higher in 1999 than in At income levels above $200,000, even the data based on the 1979 family income distribution show a decline in tax liability between 1979 and The difference between the results in the upper and lower panels of Table 6 is probably attributable to differences in the composition of income between families at given income ranges in the two income distributions. We "age" the 1979 families to 1999 using the rate of price inflation, not the rate of real income growth. Families in a given income range based on the 1979 family income distribution represent families with a higher standing in the overall income distribution than families at the same income level based on the 1999 family income distribution. The differences may also be due to differences in demographic structure between the set of 1979 and 1999 families. In 1999, for example, there are many more single-person families than in 1979, and a higher percentage of dependents are in 15
18 families without two adults. There is also a higher fraction of two earner couples amongst married joint filers. The sensitivity of findings like those in Table 6 to differences in the baseline income distribution is an issue that requires further study. Table 7 provides further information on the changing pattern of tax liabilities. It shows the fraction of families in different strata of the 1999 income distribution that paid less taxes in 1999 than they would have paid if the 1979 tax law had still been in effect. For all families, the table shows that 62.6 percent experienced a decline in personal income tax liabilities, while only 36.4 percent experienced a decline in combined payroll and income tax liabilities. If we restrict the analysis to families that paid either payroll or income taxes, as in the upper panel of the table, the data show that 70.2 percent of families faced lower income taxes in 1999, but that only 37.5 percent faced lower income and payroll taxes. At low family income levels, most families experienced a tax increase between 1979 and We need to focus on families in income strata above $50,000 before the probability of paying lower combined taxes in 1999 than in 1979 rises above 50 percent. The results in Table 7 provide a stark demonstration of the importance of combining income and payroll taxes when considering recent changes in tax burdens. 2.3 The Role of the Earned Income Tax Credit Having shown the combined income and payroll tax burden over time, we now return to explore the income tax in more detail. The average income tax burdens shown in Table 5 reflect changes in the structure of marginal income tax rates over time, changes in the level of deductions and exemptions, and changes in the Earned Income Tax Credit (EITC). Because the EITC expanded substantially during the two decades that we consider, it is informative to distinguish its effect from that of other changes in the tax code. Table 8 separates the EITC from other factors that affect personal income tax liability. (Unlike other tax credits, the EITC is refundable. This reflects in part its historical origins as an income tax "offset" to payroll taxes (see the discussion in Liebman (1998)). Families that have a negative personal income tax liability inclusive of the EITC also have payroll tax liabilities, since the EITC is equal to a 16
19 percentage of wage and/or self-employment income. At current levels, however, the EITC exceeds income and payroll tax liabilities for some low-income wage-earning families. Because families with adjusted AGI of more than $50,000 in 1999 were unaffected by changes in the EITC, the table focuses on families with incomes below this level. The summary statistics in Table 8 are based on the 1999 family income distribution, so the results are consistent with those in the upper panels of Tables 4 and 5. The first panel of Table 8 shows the change in personal income tax liabilities, excluding any refunds associated with the EITC. For the lowest income families, those with adjusted AGI of less than $20,000, there is virtually no change in this measure of tax liability between 1979 and There is an increase in tax liability in the early 1980s, but this is undone by the Tax Reform Act of The middle panel of Table 8 shows the EITC for families in different adjusted AGI ranges. It demonstrates that the expansion of the EITC has been a critical factor in reducing personal income tax liabilities over the period we study. The largest change takes place between 1989 and 1994, when the average EITC for families with incomes below $20,000 roughly doubles. There is an even larger percentage increase for the average EITC received by families with incomes in the $20-30,000 range. The bottom panel of Table 8 shows payroll taxes net of the EITC for low-income families. The results suggest that payroll taxes net of the EITC have declined for the average family with an adjusted AGI of below $20,000, while they have increased for families with incomes above this range. The entries in the bottom panel of Table 8 can be compared with those in the upper panel of Table 4 to gauge the impact of EITC expansion as an offset to rising payroll tax burdens. For families with adjusted AGI between $10,000 and $20,000, for example, the data in Table 4 suggest an increase of 29 percent in real payroll taxes between 1979 and Net of the expansion of the EITC, however, there was a net decrease of 13 percent in payroll tax payments over this period. Table 8 further underscores the need, in at least some contexts, to consider the income tax and the payroll tax in tandem. When changes in one tax instrument are designed, at least in part, to offset changes in another, it is useful to construct distribution tables that combine the two sets of taxes. 17
20 3. The Distributional Effects of the Taxpayer Relief Act of 1997 The summary statistics in the foregoing tables do not attempt to decompose changes in tax burdens from one year to the next into components that are attributable to particular legislative reforms. Rather, they simply summarize the total tax burden, for either the income tax or the payroll tax, which results from all of the tax legislation in force in each year. Because the Taxpayer Relief Act of 1997 introduced a number of new tax credits that may substantially affect the distribution of tax burdens, and because this is the most recent substantial change in the income tax code, there is particular interest in analyzing the distributional impact of these new credits. We do this by analyzing the source of the changes in income tax liability between 1994 and 1999 that we summarized in earlier tables. Table 8 reports on the effect of three key components of TRA97: the enactment of the Child Tax Credit, the reduction of tax rates on capital gains, and the enactment of the HOPE and Lifetime Learning Credits. The table does not present an exhaustive decomposition of the changes in tax revenue; there are other, less important, factors that also contribute to changing personal income tax liabilities between 1994 and The effect of these other factors is summarized in the last column of Table 8. The first column in Table 9 shows the change in the average personal income tax liability for families in various adjusted AGI categories. This entry is the difference between the entries in the 1994 column, and the entries in the 1999 column, of the upper panel of Table 5. The next three columns in Table 8 show the effects of each of the three most significant components of TRA97. The entries in Table 9 show that for high-income families, TRA97 had a substantial effect in reducing tax liabilities through the reduction in capital gains tax rates. In evaluating these findings, however, it is important to recall our "no behavioral response" assumption. We will understate the change in taxes paid if, as is very likely, the reduction in capital gains tax rates increased gain realizations and hence taxable income. For lower and middle-income taxpayers, the new credits were more important than the capital gains tax changes in affecting tax burdens. For the typical taxpaying family with an adjusted AGI of 18
21 between $50,000 and $75,000 in 1999, for example, the net effect of the HOPE and Lifetime Learning Credits was a reduction of $58 in tax liabilities, compared to $50 due to capital gains tax changes. The distribution of credit-eligible dependents across adjusted AGI categories implies that most of the benefits of the HOPE and LLC accrue to middle income families. The average value of the tax reduction associated with these credits was greatest for families with adjusted AGI between $50,000 and $100,000. At lower incomes, many families have too little income to be able to take full advantage of the tax credits. The distributional pattern for the Child Tax Credit is similar to that for the HOPE and LLC, but the average benefits are substantially greater. The average income tax reduction from the credit for families with adjusted AGI in the $50-75,000 range, for example, is $325. Since only families with dependent children can receive this credit, there are many families that do not receive any benefits from the credit, and thus many others that receive benefits substantially greater than Table 8 suggests. Our estimate of the revenue cost of the Child Credit, $21.5 billion, is substantially greater than the estimate of $15.7 billion reported in the Congressional Budget Office (2000). This may reflect differences between the distribution of dependents across families that results from our imputation procedure for dependents who are eligible for the credit, and the actual distribution of such dependents. The Joint Tax Committee (1998) estimated that at 1998 income tax rates and 1998 income levels, the Child Credit would reduce income tax revenue by $17.5 billion. Since the credit was $400 in 1998, and $500 in 1999, this estimate is much closer to our results than is the more recent CBO (2000) estimate. The last column in Table 9 shows the change in average tax liability within adjusted AGI cells that cannot be attributed to the three legislative changes that we have highlighted. There are both positive and negative entries in this "residual" column, which suggests that there are a number of other factors influencing tax liability. These include changes in the mean income of families within each AGI cell, due to differences between the rate at which tax bracket "break points" change and the rate at which various income aggregates grow. Other legislative changes can also contribute to the "residual" change in tax liability in this category. The interaction between various tax changes also contributes to this residual 19
22 entry. When one provision affects a family's tax liability, it may affect the tax change associated with other tax reform provisions. 4. Conclusions and Future Directions This paper describes the changing level of income and payroll tax burdens over the last two decades, and it presents summary information on the cross-family distribution of these tax burdens. The results suggest that legislative changes have reduced average income tax liabilities relative to what they would be if pre-1980 tax laws were still in effect, but that increases in payroll taxes have largely offset these tax reductions on average. These findings complement the results in Burman, Gale, and Weiner (1998) on reductions in marginal income tax rates over a roughly similar period, as well as Stephenson's (1998) finding that marginal payroll tax rate changes have offset marginal income tax rate changes in the post-1981 period. The payroll tax increase of the early 1980s, coupled with the expansion of the Earned Income Tax Credit in the mid-1980s and the early 1990s, has made the payroll tax a more significant tax than the income tax for a very substantial fraction of U.S. families. In 1999, families needed Adjusted Gross Income in excess of $100,000 before their expected income tax liability was greater than their expected payroll tax liability. Nearly two thirds of families in 1999 paid more in payroll taxes than they did in federal income taxes. This reflects a substantial change from two decades earlier, when this share was 42 percent. The results in this study describe income tax payments by families, and payroll tax contributions by families and their employers. A natural next step in this line of research would involve augmenting the current tax liability calculations by including corporate income taxes, estate taxes, and excise taxes at both the federal and sub-federal level. Taking such a step would require some assumptions about the incidence of these taxes, and in particular the extent to which they are ultimately borne by the families that face legal liability for them. 20
23 Another important extension of the current project would involve linking our calculations of payroll tax liability with imputations of social insurance benefits that may be associated with such tax payments. For some taxpayers, Social Security benefits are an increasing function of their earned income. Feldstein and Samwick (1992) examine this "tax benefit linkage" and they present estimates of the distribution of marginal benefit paybacks associated with the Social Security payroll tax. Earlier studies in a similar vein include Browning (1985) and Burkhauser and Turner (1985). There is no "tax benefit linkage effect" for the hospital insurance payroll tax; all Americans over the age of 65 are eligible for Medicare, regardless of their earnings histories. Including an estimate of the present discounted value of the benefits that families at different points in the income distribution receive when they pay payroll taxes would nevertheless represent a substantial, and interesting, direction for future work. Doing such analysis requires information on the earnings histories of the individuals who are in different current family income categories, as well as projections of future earnings and labor market behavior, such as retirement dates, for these workers. The results of such an analysis would necessarily be even more sensitive to assumptions about data construction and imputation than results like those in the current study. 21
24 REFERENCES Bakija, Jon and Joel Slemrod (2000). "Does Growing Inequality Reduce Tax Progressivity? Should It?" NBER Working Paper 7576, Cambridge, MA. Bradford, David F. (1995). Distributional Analysis of Tax Policy. (Washington: American Enterprise Institute). Browning, Edgar K. (1985). "The Marginal Social Security Tax on Labor," Public Finance Quarterly 13 (July), Burkhauser, Richard V. and John A. Turner (1985). "Is the Social Security Payroll Tax a Tax?," Public Finance Quarterly 13 (July), Burman, Leonard E., William G. Gale, and David Weiner (1998). "Six Tax Laws Later: How Individuals' Marginal Federal Income Tax Rates Changed Between 1980 and 1995," National Tax Journal 51 (September), Cronin, Julie-Anne (1997). "The Economic Effects and Beneficiaries of the Administration's Proposed Higher Education Tax Subsidies," National Tax Journal 50 (September), Dynarski, Susan (1999). "The Economic Effect of the HOPE Credit: Evidence from Georgia." Unpublished, John F. Kennedy School of Government, Harvard University. Ettlinger, Michael P. and John F. O'Hare (1998). "The Institute on Taxation and Economic Policy Tax Model." Washington: Citizens for Tax Justice. Feenberg, Daniel R., and Elisabeth Coutts (1993). "An Introduction to the TAXSIM Model," Journal of Policy Analysis and Management 12 (Winter), Feenberg, Daniel R., Andrew W. Mitrusi, and James M. Poterba (1997). "Distributional Effects of Adopting a National Retail Sales Tax," in J. Poterba, ed., Tax Policy and the Economy, volume 11 (Cambridge: MIT Press), Feenberg, Daniel R. and James M. Poterba (2000). "The Income and Tax Share of Very High Income Households, ," American Economic Review 90 (May), Feldstein, Martin S. (1995). "The Effects of Marginal Tax Rates on Taxable Income: A Panel Study of the 1986 Tax Reform," Journal of Political Economy 103 (June 1995), Feldstein, Martin, and Daniel R. Feenberg (1996). "The Taxation of Two-Earner Families," in M. Feldstein and J. Poterba, eds., Empirical Foundations of Household Taxation (Chicago: University of Chicago Press, Feldstein, Martin and Andrew Samwick (1992). "Social Security Rules and Marginal Tax Rates." National Tax Journal 45 (March), Gruber, Jonathan, and Emmanuel Saez (2000). "The Elasticity of Taxable Income: Evidence and Implications." NBER Working Paper 7512, Cambridge, MA. 22
25 Liebman, Jeffrey (2000). "The Impact of the Earned Income Tax Credit on Incentives and Income Distribution," in J. Poterba, ed., Tax Policy and the Economy, volume 12 (Cambridge, MIT Press), Lindsey, Lawrence (1987). "Estimating the Behavioral Responses of Taxpayers to Changes in Tax Rates, : With Implications for the Revenue-Maximizing Tax Rate," Journal of Public Economics 33 (July), McKinnon, John D. and Karen Hube (2000). "Did Stock Sales for Capital Gains Fuel Sell-Off?," Wall Street Journal (April 18), C1. Pechman, Joseph (1985). Who Paid the Taxes, ? (Washington: Brookings Institution). Poterba, James M. (2000). "Taxation, Risk-Taking, and Portfolio Behavior," in A. Auerbach and M. Feldstein, eds., Handbook of Public Economics (Amsterdam: Elsevier, forthcoming). Stephenson, E. Frank (1998). "Average Marginal Tax Rates Revisited," Journal of Monetary Economics 41, Steuerle, C. Eugene (1992). The Tax Decade (Washington: Urban Institute Press). U.S. Congress, Congressional Budget Office (1998). Estimates of Federal Tax Liabilities for Individuals and Families by Income Category and Family Type for 1995 and Washington: U.S. Congressional Budget Office. U.S. Congress, Congressional Budget Office (2000). An Economic Analysis of the Taxpayer Relief Act of Washington: U.S. Congressional Budget Office. U.S. Congress, Joint Committee on Taxation (1993). Methodology and Issues in Measuring Changes in the Distribution of Tax Burdens. Washington: U.S. Government Printing Office. U.S. Congress, Joint Committee on Taxation (1997a). Summary of Revenue Provisions of H.R ("Taxpayer Relief Act of 1997"). Committee Document JCX Washington: U.S. Government Printing Office. U.S. Congress, Joint Committee on Taxation (1997b). Distributional Effects of the Conference Agreement on the Revenue Reconciliation Provisions of H.R. 2014, The "Taxpayer Relief Act of 1997." Committee Document JCX Washington: U.S. Government Printing Office. U.S. Congress, Joint Committee on Taxation (1998). Estimates of Federal Tax Expenditures for Fiscal Years Committee Document JCS Washington: U.S. Government Printing Office. U.S. Department of Education, National Center for Education Statistics (1998). Student Financing of Undergraduate Education: NCES Washington, DC: U.S. Department of Education, Office of Educational Research and Improvement. 23
26 Table 1: Payroll Tax Rates and Taxable Earnings Limits, Year Social Security Tax Rate (OASDI) Hospital Insurance Tax Rate (HI) Social Security Taxable Maximum Hospital Insurance Taxable Maximum ,900 22, ,900 25, ,700 29, ,400 32, ,700 35, ,800 37, ,600 39, ,000 42, ,800 43, ,000 45, ,000 48, ,300 51, , , , , , , ,600 no maximum ,200 no maximum ,700 no maximum ,400 no maximum ,400 no maximum ,600 no maximum Source: Authors' tabulations from various issues of the Social Security Bulletin. Table 2: Distribution of Income and Payroll Taxes by Adjusted AGI, Family Families Mean Mean Percent of Families Adjusted AGI (millions) Personal Payroll Tax with Personal Income Percent of Families with Payroll Tax > Personal Income Tax Income Tax Tax > Payroll Tax < % 46.2% % 71.5% % 81.7% % 85.7% % 74.3% % 66.2% % 54.9% % 16.2% % 0.1% % 0.0% > % 0.0% All % 62.0% Notes: The aggregate number of families (column 1) is million. Aggregate income and payroll taxes are $839 billion and $602.9 billion, respectively. In aggregate, 23.7% of families have personal income tax liabilities in excess of their payroll taxes, 62% have payroll taxes in excess of personal income taxes, and 14.3% have equal liabilities (usually zero). 24
27 Table 3: Percent of Families with Payroll Tax in Excess of Personal Income Tax 1999 Family Adjusted AGI All Families < % 46.3% 46.4% 46.4% 46.2% % 70.8% 71.3% 71.5% 71.5% % 78.8% 81.1% 81.5% 81.7% % 58.8% 84.5% 85.3% 85.7% % 48.0% 68.9% 73.5% 74.3% % 28.8% 63.4% 65.5% 66.2% % 7.3% 41.3% 49.1% 54.9% % 1.5% 9.7% 13.4% 16.2% % 0.4% 0.1% 0.1% 0.1% % 0.3% > % 0.5% All 41.8% 47.0% 59.5% 61.1% 62.0% All Families with Positive Personal Income Tax or Payroll Tax < % 83.3% 83.4% 83.4% 83.0% % 86.6% 86.8% 87.0% 87.1% % 82.6% 84.8% 85.2% 85.3% % 59.6% 85.7% 86.4% 86.8% % 48.2% 69.1% 73.6% 74.7% % 28.9% 63.6% 65.7% 66.5% % 7.3% 41.0% 49.0% 54.9% % 1.5% 9.6% 13.4% 16.2% % 0.4% 0.1% 0.1% 0.1% % 0.3% > % 0.5% All 48.3% 54.4% 68.6% 70.5% 71.5% Source: Authors' calculations using TAXSIM and payroll tax simulation programs for the period. Families are grouped according to their 1999 Adjusted AGI. Income values in the tax laws for other years are "aged" to 1999 using changes in the Consumer Price Index. 25
28 Table 4: Average Family Payroll Tax Liabilities, Family Adjusted AGI Family Income Distribution < > All Family Income Distribution < > All Notes: All entries are reported in 1999 dollars. See text for further discussion. 26
29 Table 5: Average Family Personal Income Tax, Including EITC, Family Adjusted AGI Family Income Distribution < > All Family Income Distribution < > All Source: Authors' calculations as described in more detail in the text. 27
30 Table 6: Average Family Personal Income and Payroll Tax, Family Adjusted AGI Family Income Distribution < > All Family Income Distribution < > All Source: Authors' calculations as described in more detail in the text. 28
31 Table 7: Percent of Families with Tax Reductions, 1979 to Family Adjusted AGI 1999 Personal Income Tax < 1979 Personal Income Tax 1999 Total Tax < 1979 Total Tax All Families < % 14.8% > All All Families With Positive Income or Payroll Taxes < > All Source: Authors' calculations using TAXSIM and payroll tax simulation programs for the period. Families are grouped according to their 1999 Adjusted AGI. See text for further discussion. 29
32 Table 8: The Impact of the EITC on Mean Income and Payroll Tax Liabilities, Family Adjusted AGI Personal Income Tax, Excluding EITC < All EITC < All Payroll Tax Net of EITC < All Source: Authors' tabulations as described in the text. All calculations are based on family income distribution drawn from 1995 tax return filings and 1995 nonfilers based on Current Population Survey. 30
33 Table 9: Decomposition of Changes in Personal Income Tax Liability, Family Adjusted AGI Change in Personal Income Effect of Child Credit Effect of Capital Gains Effect of HOPE and Effect of Other Factors Tax, 1994 to 1999 Tax Change LLC < > All Source: Authors' tabulations based on 1995 SOI Public Use File and nonfilers as identified in the Current Population Survey, "aged" to The total change in personal income tax in our analysis is $55.3 billion, the total effect of Child Tax Credits is $21.5 billion, capital gains tax changes, $34 billion, HOPE and LLC credits, $3.5 billion, and "other," $3.8 billion. See text for further discussions. 31
34 Appendix: Updating the NBER TAXSIM Model In this appendix, we first describe how we identify families that do not file federal income tax returns, and add them to each year's SOI Public Use File. We then describe our algorithm for estimating payroll taxes for each family. We next explain our imputation procedures for identifying families that are likely to claim various tax credits that were enacted as part of TRA97. Finally, we summarize how we "age" tax returns filed in one year to permit analysis of tax rules and tax rates in a different year. A.1 Adding Nonfilers to the SOI Public Use File Some families have no federal personal income tax liability and do not need to file for a refund of income tax withheld, so they do not appear in the SOI Public Use File. In 1995, for example, single persons with adjusted gross income of less than $6400 ($7350 if the person were 65 years or older), and married joint filers with AGI of less than $11500 ($13000 if both taxpayers were 65 or older), were not required to file federal income tax returns. Such families may nevertheless have earnings and pay payroll taxes. To analyze the distribution of payroll tax burdens, it is essential to augment the Public Use File with information on non-filer families. For the 1995 data set, we identify nonfiler families using data that the Census Bureau includes in the Current Population Survey data files. Recent March CPS data sets include an imputation, based on the CPS respondent's income and probable income tax withholding, for whether or not the responding family is likely to have filed a tax return. The Census has access to the IRS master file, and it can therefore test the quality of its imputation using actual tax filing data. This imputation recognizes that many families with no income tax liability and no legal requirement to file a federal income tax return may file to obtain a refund of wage withholding. It relies on self-employment income in excess of $400 ($1992), interest, dividends, and other types of capital income in excess of $1,000, and wage income in excess of $1,000, to impute "filing" as a taxpayer's status. The Census imputation, reflecting the number, incomes, ages, and demographic structure of actual filers and non-filer families, is likely to be much more accurate than imputations based solely on publicly-available data sets. 32
35 The most recently available SOI Public Use File is that for the 1995 tax year. We therefore use the March 1996 Current Population Survey, which reports information that relates to the 1995 tax filing year, to identify nonfiler families for the 1995 tax year. We begin by identifying all families, whether single individuals or multi-person families, which are headed by a person over the age of 18 and which are identified as nonfilers in the CPS file. We then add these families to the Public Use File, using each family's March CPS Supplemental Final Weight as the analogue to the tax model sampling weight. This procedure yields 17.9 million nonfiler families in We use information reported in the CPS to construct core variables from the Public Use File, such as wages and salaries, interest and dividend income, and the family's number of dependents. We then construct each nonfiler family's adjusted AGI. Table A-1 shows the distribution of nonfiler families across adjusted AGI categories in It also shows the percentage of families in each adjusted AGI class that does not file federal income tax returns. Our results suggest that roughly half of those with positive incomes of less than $10,000 are nonfilers. The fraction is lower, roughly twenty-five percent, among those who have negative incomes, because negative income is often associated with activities that require filing tax returns or that produce tax benefits. Feenberg, Mitrusi, and Poterba (1997) report similar findings for 1992 nonfiler families. We also construct a non-filer augmented data file for Since the CPS does not include a non-filer imputation in 1979, we construct our own estimate of the set of families that might not file tax returns using information on wage, interest, and dividend income. We assume that any family with less than $1000 of wage income (measured in $1992, for consistency with the Census Bureau imputation that underlies the 1995 nonfiler imputation) and with less than $500 ($1992) in combined interest and dividend income did not file a tax return. A.2 Payroll Tax Imputation: Dividing Labor Income Between Members of Married Couple The payroll tax applies at a flat rate on earned income up to a threshold level, and there are no deductions or special definitions of income categories as there are in the income tax. The payroll tax is levied on both employees and their employers. We follow many previous studies, including Pechman (1985), in assuming that the employer share of the payroll tax is ultimately born by the employee in the 33
36 form of lower wages. We therefore use the combined employer and employee tax rate as "the" payroll tax rate throughout our analysis. This also accounts for our inclusion of employer-paid payroll taxes in our measure of family adjusted AGI. The data contained in the SOI Public Use file do not provide enough information for us to calculate payroll tax liability for all married couples. On the income tax returns of married joint filers, the wage and salary income of both spouses is aggregated. A couple with earnings of $100,000 would pay more in payroll taxes if the earnings were equally divided between the husband and wife than if the one spouse was the only earner. (If a couple's combined wage income is below the maximum amount of taxable earnings for the Social Security payroll tax, we would not need to know the earnings division, since all earnings would be subject to the payroll tax.) In general, however, to estimate payroll taxes we must estimate the division of labor income between members of each pair of married joint filers. To estimate this earnings division, we construct a "synthetic match" between married couples in the SOI Public Use File and couples in the Federal Reserve Board's Survey of Consumer Finances. One could also use the publicly-available data from the Current Population Survey (CPS), as in Feldstein and Feenberg (1996) and Feenberg, Mitrusi, and Poterba (1997), to divide family earnings. However, the CPS data on earnings are top-coded, which makes it impossible to allocate earnings for some high-income families. In 1994, the CPS variable for total wage income was topcoded for one spouse in 3.7 percent of married couples, and for both spouses in 0.12 percent of couples. Combining CPS data with the Public Use File thus would undercut one of the Public Use File's most important strengths of the SOI data, namely its detailed information on high-income families. The Federal Reserve Board's Survey of Consumer Finances (SCF), like the Public Use File, oversamples high-income families and thereby provides a reasonable sample for allocating the earnings of high-earning couples. The difficulties with the SCF are that it is only conducted every three years and that it is only available since However, the distribution of earnings between members of married couples is relatively stable across years. We therefore rely on the various SCF data sets, interpolated where necessary, to divide wage income for married couples. 34
37 Table A-2 presents information on the division of labor earnings based on the 1995 Survey of Consumer Finances. The table shows, for the $1995 AGI category (not the adjusted AGI category) indicated in each row, the ratio of the average earnings of the lower-earning spouse in each couple to the couple's average total earnings. Total earnings include both W-2 and Schedule C income. The table shows a clear pattern in the share of earnings that is due to the lower-earning spouse. This share rises at low values of family AGI. At roughly $40,000 of AGI, the average earnings share of the lower-earning spouse enters a relatively narrow range, from 20 to 25 percent, and it remains in this range until family AGI reaches roughly $130,000. At family AGI levels above this range, the average earnings share of the lower-earning spouse declines, and it reaches relatively low levels at very high AGI ranges. This distributional pattern seems plausible, since two earner couples are likely to reach moderate to high income levels by combining wages, while secondary earners in couples with one very high earner are not likely to seek work. Based on distributional tables that are not shown, the share of couples in which the second earner accounts for between 25 and 50 percent of the total earnings peaks at family income between $50,000 and $115,000. The share of married couples with a zero-earning lower income spouse is U-shaped, with relatively high values at both low and high AGI levels. We were fortunate to be able to compare the SCF tabulations with similar tabulations based on the U.S. Treasury's income tax masterfile. This data file, which is not available to researchers outside the Treasury, merges W-2 filings with individual income tax returns (1040s). Table A-2 shows the earnings division based on the Treasury masterfile as well as the SCF, and it demonstrates that the patterns in the SCF and the Treasury masterfile are similar. This supports our use of the SCF to allocate family labor earnings for earlier years. There are, nevertheless, some differences between the SCF and the Treasury data. There are more low-income families in the Treasury masterfile than in the SCF. Fortunately, this discrepancy only appears in an income range over which the division of wage earnings between two members of a couple does not affect the couple's total payroll tax liability. Figures 1, 2, and 3 present more detailed information on the pattern of earnings divisions in the 1995 SCF. The first figure shows the fraction of married couples in which the lower-earning spouse 35
38 earns zero, the second the fraction with the lower-earner between 1 and 25 percent of the total earnings, and the third the fraction with the lower earner between 25 and 50 percent of total earnings. In each figure we show these earnings distributions for different income categories, and for families with "low," "middle," and "high" levels of capital income. "Low" capital income families report zero capital income, "middle" capital income families report capital income between 0 and 33 percent of the families total income, and "high" capital income indicates more than 33 percent of family income comes from capital. Conditioning on the share of family income from capital income is important, because the pattern of earnings division differs across capital income groups. We use the information in Figures 1 through 3 to apportion the wage and salary income of 1995 joint filers to the two members of the married couple. We allocate 1995 labor earnings using three probabilities: that the lower earner reports zero earnings, that the lower earner reports between 1 and 25 percent of total earnings, and that the lower earner reports between 25 and 50 percent of total earnings. We also assume that a uniform distribution of earnings splits within the 1-25 and percent intervals. We follow a similar procedure using the 1983, 1986, 1989, 1992, and 1995 Surveys of Consumer Finances. For years between these surveys, we interpolate the information from survey years to develop estimates of individual earnings within married couples. A.3 Imputations Relating to the 1997 Taxpayer Relief Act To study the distribution of the benefits of the Child Tax Credit and of the HOPE and LLC, we need to estimate which families are eligible for each of these credits. The information in the 1995 SOI Public Use File does not permit us to make such estimates, although data in Public Use Files beginning with 1998 will include the necessary information. The Joint Committee on Taxation (1997a, 1997b) presents revenue estimates and distributional analysis that embody information available as of the time when the legislation was enacted. With respect to the Child Tax Credit, we assume that each dependent reported on a tax return has a probability of.763 of being eligible for the credit. This probability corresponds to the number of children under the age of 17 divided by the total number of dependents claimed on tax returns. Table A-3 36
39 presents information on the distribution of under-17 dependents across 1999 adjusted AGI categories. The table shows that 51.5 percent of the under-17 dependents are in families with adjusted AGI of less than $40,000. Only 10.5 percent of these dependents live in families with adjusted AGI of more than $100,000. These are families that are likely to be affected by the Child Tax Credit phase-out provisions. Our procedure for imputing potential eligibility for the HOPE credit and for the Lifetime Learning Credit involves several steps. First, we use the March 1995 Current Population Survey to impute ages of all family members in the nonfiler-augmented SOI Public Use File. For tax filers who claim dependents, we know the number of dependents reported on the taxpayer's tax return, as well as the taxpayer's income. We randomly match each tax filer in the Public Use File to a family in the CPS with the same number of dependents and in the same income class. (We use broad income categories: < $25,000, 25-50,000, 50-75,000, ,000, and > $100,000.) We assign each family a number of dependents aged 17 or less, a number of dependents aged 18-24, and a number of dependents who are over the age of 24. We follow a similar procedure, using age and the number of persons in the CPS family, to impute the total number of individuals between the ages of 18-24, 25-29, 30-34, and > 35 for each family. This imputation yields a data file based on both tax returns (filers) and CPS records (nonfilers) with information on the age structure of each family. Next, we use data on age-specific rates of college attendance in 1995 (drawn from the U.S. Department of Education (1997) for those over 23, and from the March CPS for those under 24) to impute "college attendance status" for each person over the age of 17. Many persons over the age of 24 attend college. For the age group, for example, the 1995 college enrollment rate was 11.2 percent. This drops to 5.7 percent for the age group, and 2.1 percent for those over the age of 35. The U.S. Department of Education (1997) reports that in 1995, there were 14.3 million students enrolled in colleges and other institutions of higher education. By expanding the population in various age groups to 1999 levels, but assuming that the age-specific college enrollment rates remain at 1995 levels, we estimate that there would be 14.6 million students at these institutions. 37
40 Third, to determine whether someone who is attending college is eligible for the HOPE or the LLC, we assume that any year-old who is in school is at an institution of higher learning that would qualify for the LLC or HOPE Credit. Since HOPE is more generous than LLC, we assume that anyone who is eligible for both credits will claim the HOPE Credit. We further assume that individuals aged 18, 19, 20, and 21 who are in college have a 50 percent chance of being eligible for the HOPE Credit. This is a crude assumption designed to approximate the fraction of college students at each of these ages who are in their first or second year of post-secondary education. We assume that college students who are not eligible for the HOPE Credit receive the LLC instead. Finally, we need to address the amount of the HOPE credit and the LLC. The U.S. Department of Education, National Center for Education Statistics (1998) reports that average tuition and fees net of grants for undergraduates attending public two- and four-year colleges in was $1641 for students who were dependents, and $562 for students who were independent. This suggests that distinguishing between dependents and independents is potentially important for assessing the amount of HOPE and LLC tax benefits. For those attending private colleges, the average cost net of grants was $7259 for dependent students, and $3473 for independent students. These average values are net of Pell grants and other federal and state or local government grants, and they are also net of financial aid provided by the post-secondary school. Amongst those attending post-secondary institutions, 76 percent of dependent students, and 80 percent of independent students, were at public colleges and universities, while 24 percent and 20 percent, respectively, were at private institutions. We therefore assume that any dependent student who is eligible for the HOPE Credit or the LLC has a probability of.76 of being enrolled at a public institution, and.24 of being at a private institution. For independent students, we use probabilities of.80 and.20 for public and private institutions, respectively. We assume that anyone who is eligible for the HOPE Credit and who attends a private institution claims the maximum amount of this credit ($1500), while anyone at a public institution claims $1321 if he or she is a dependent student, and $562 if he or she is independent. (Future work might refine this analysis to recognize that the probability of attending a public versus a private institution varies with 38
41 family income level.) For the Lifetime Learning Credit, we assume that students claim 20 percent of the mean net tuition for their imputed institution type (public or private) and dependency status. While any individual public college student will claim less than the maximum LLC, since the LLC is claimed on a family basis, in rare cases a family with five students who were imputed to public college enrollment could nevertheless reach the LLC maximum. Table A-4 shows our estimates of the number of families eligible to claim the HOPE or the Lifetime Learning Credit in We stratify these families by adjusted AGI. The table shows the number of dependent students as well as the number of independent students (persons over the age of 23, or year olds living independently) at institutions of higher education. Approximately eighty percent of dependents who attend college are in families with adjusted AGI of less than $100,000, while 95 percent of non-dependents attending college are in families with incomes below this threshold. The last column of Table A-4 shows our estimate of the number of HOPE and LLC claimants whose taxes are reduced by the availability of these credits. Only a fraction of those who are eligible for the credit can claim it. For example, we estimate that there are 2.28 million college enrollees in families with adjusted AGI of between $10,000 and $20,000. However, only 1.27 million (56 percent) of these students benefit from the HOPE and LLC. The others are in families with no federal income tax liability before they claim the HOPE or LLC. The fraction of potentially eligible families that receives an actual tax reduction rises with income. Ninety-two percent of the college enrollees in families with adjusted AGI between $40,000 and $50,000, for example, experience some reduction in family tax liability as a result of these credits. We have received preliminary data from the Internal Revenue Service on the number of families that claimed either HOPE of Lifetime Learning Credits in 1998, the first year when these credits were available. These data suggest that our imputations overstate the total number of tax returns that claim education credits, although the aggregate amount of tax reduction due to these credits is close to our estimate. In 1999, we estimate that 8.4 million families should claim HOPE or LLC, but IRS data suggest that only 4.8 million tax returns claimed one of these credits in Our estimate of the reduction in 39
42 1999 tax revenue that resulted from these credits is $3.53 billion, while the IRS estimate for 1998 is $3.50 billion. Further analysis of the differences between our imputations and actual claims requires data on individual tax returns for 1998 or 1999; these data will not be available for several years. A.4 "Aging" Data From the 1995 Public Use File to 1999 Much of our analysis focuses on tax burdens in To construct a family income distribution for 1999, we "age" the nonfiler-augmented SOI Public Use File for Our approach follows that in Lindsey (1987). First, we expand the total number of families in the 1995 filer and non-filer universe based on the expected increase in tax returns from 1995 to Second, to extrapolate income components and other dollar values from 1995 to 1999, we divide AGI into three components: realized capital gains, wages, and other items. We project non-gain AGI growth from 1995 to 1999 using the growth of wages and other personal income in the national income accounts. We project realized capital gains, which have been extremely volatile in recent years, using actual realizations for 1996 and 1997 to "scale up" 1995 realizations. We project realizations for 1998 and 1999 using the fitted values of a regression equation that relates the level of aggregate realizations over the period to the average value of the Standard and Poor's 500 Index for the year. This simple equation yields a coefficient of (0.027) on the stock market variable, and it generates a projected increase in realizations of 26 percent between 1997 and 1998, and 17.5 percent between 1998 and McKinnon and Hube (2000) report a taxable capital gain increase of at least 14 percent between 1998 and "Aging" algorithms such as this one track variation in the aggregate amounts of different types of income, but they do not capture changes in the distribution of various types of income across families in different income classes. While the distribution of AGI across different income strata was relatively stable in the early 1990s, as Feenberg and Poterba (2000) report, there is some evidence in Bakija and Slemrod (2000) that income reported on tax returns became more concentrated in tax years 1996 and This raises the possibility that the foregoing algorithm for "aging" the set of filers and non-filers from 1995 to 1999 may perform poorly over this period. This issue can only be resolved with data from the 1996 through 1999 SOI Public Use Files that will not be available for several years. 40
43 Table A-1: Distribution of Non-filers, by AGI Category, AGI Category (000s) Number of Nonfiler Families (million) Total Number of Families (Filer + Nonfiler) Percent of Families Not Filing < % > All Categories Source: Authors' tabulations using the 1995 Current Population Survey and the 1995 Statistics of Income datafile. 41
44 Table A-2: Distribution of Earnings of Married Joint Filers, Filers Under Age 65,1995 Family AGI Average Earnings of Lower-Earning Spouse/Average Earnings of Couple Category (000s) 1995 Treasury W2/1040 File 1995 Survey of Consumer Finances < > Source: Tabulations from the Treasury Masterfile and 1995 Survey of Consumer Finances. Entries can be negative if one member of a couple reports negative self-employment (Schedule C) income. 42
45 Table A-3: Distribution of Child Tax Credit Claims and Taxable Capital Gains by Adjusted AGI Categories 1999 Adjusted Number of Returns Children Under 17 Children Under 17 in Families with Tax Reduction from Child Tax Credit AGI Number Percentage Number Percentage Category < % % % % % % % % % % % % % % % % % % % % > % % All % % Source: Authors' tabulations using data from 1995 Treasury Individual Tax Model and 1995 Current Population Survey, "aged" to The entry for long term capital gains includes positive gains for those families with positive marginal tax rates on such gains. Table A-4: Eligibility for HOPE and Lifetime Learning Credit, by AGI Category, Adjusted Number of Dependent Number of Independent Number of HOPE AGI Category Students Attending College Students Attending College and LLC Claimants < > All Source: Authors' calculations using 1995 Current Population Survey and 1995 Statistics of Income data, "aged" to
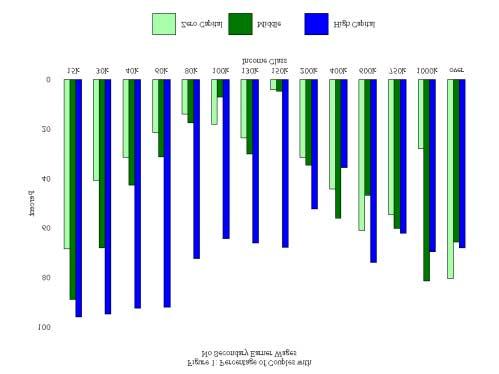
46 44
The Distribution of Federal Taxes, Jeffrey Rohaly
 www.taxpolicycenter.org The Distribution of Federal Taxes, 2008 11 Jeffrey Rohaly Overall, the federal tax system is highly progressive. On average, households with higher incomes pay taxes that are a
NBER WORKING PAPER SERIES CAPPING INDIVIDUAL TAX EXPENDITURE BENEFITS. Martin Feldstein Daniel Feenberg Maya MacGuineas
 NBER WORKING PAPER SERIES CAPPING INDIVIDUAL TAX EXPENDITURE BENEFITS Martin Feldstein Daniel Feenberg Maya MacGuineas Working Paper 16921 http://www.nber.org/papers/w16921 NATIONAL BUREAU OF ECONOMIC
CBO MEMORANDUM ESTIMATES OF FEDERAL TAX LIABILITIES FOR INDIVIDUALS AND FAMILIES BY INCOME CATEGORY AND FAMILY TYPE FOR 1995 AND 1999.
 CBO MEMORANDUM ESTIMATES OF FEDERAL TAX LIABILITIES FOR INDIVIDUALS AND FAMILIES BY INCOME CATEGORY AND FAMILY TYPE FOR 1995 AND 1999 May 1998 PESTHBÖTIÖK 8TATCMEMT A Appfoyadl far prabkei r.tea» K> CONGRESSIONAL
PWBM WORKING PAPER SERIES MATCHING IRS STATISTICS OF INCOME TAX FILER RETURNS WITH PWBM SIMULATOR MICRO-DATA OUTPUT.
 PWBM WORKING PAPER SERIES MATCHING IRS STATISTICS OF INCOME TAX FILER RETURNS WITH PWBM SIMULATOR MICRO-DATA OUTPUT Jagadeesh Gokhale Director of Special Projects, PWBM jgokhale@wharton.upenn.edu Working
Obamacare Tax Subsidies: Bigger Deficit, Fewer Taxpayers, Damaged Economy
 No. 2554 May 19, 2011 Obamacare Tax Subsidies: Bigger Deficit, Fewer Taxpayers, Damaged Economy Paul L. Winfree Abstract: The number of Americans who pay federal income taxes has been shrinking every year,
INTRODUCTION: ECONOMIC ANALYSIS OF TAX EXPENDITURES
 National Tax Journal, June 2011, 64 (2, Part 2), 451 458 Introduction INTRODUCTION: ECONOMIC ANALYSIS OF TAX EXPENDITURES James M. Poterba Many economists and policy analysts argue that broadening the
Historical Effective Tax Rates, Preliminary Edition
 Historical Effective Tax Rates, 1979- Preliminary Edition The Congress of the United States Congressional Budget Office NOTES Numbers in the text and tables may not add up to totals because of rounding.
The unprecedented surge in tax receipts beginning in fiscal
 Forecasting Federal Individual Income Tax Receipts Challenges and Uncertainties in Forecasting Federal Individual Income Tax Receipts Abstract - Forecasting individual income receipts has been greatly
NBER WORKING PAPER SERIES EXCHANGE TRADED FUNDS: A NEW INVESTMENT OPTION FOR TAXABLE INVESTORS. James M. Poterba John B. Shoven
 NBER WORKING PAPER SERIES EXCHANGE TRADED FUNDS: A NEW INVESTMENT OPTION FOR TAXABLE INVESTORS James M. Poterba John B. Shoven Working Paper 8781 http://www.nber.org/papers/w8781 NATIONAL BUREAU OF ECONOMIC
Six Tax Laws Later How Individuals' Marginal Federal Income Tax Rates Changed Between 1980 and 1995 Leonard E. Burman, William G. Gale, David Weiner
 Six Tax Laws Later How Individuals' Marginal Federal Income Tax Rates Changed Between 1980 and 1995 Leonard E. Burman, William G. Gale, David Weiner Reprinted with permission of the National Tax Journal.
Senator Kerry s Tax Proposals. Leonard E. Burman and Jeffrey Rohaly 1 Revised July 23, 2004
 Senator Kerry s Tax Proposals Leonard E. Burman and Jeffrey Rohaly 1 Revised July 23, 2004 This note provides a very preliminary summary and distributional analysis of Senator Kerry s tax proposals. Some
The Effect of Tax Reform on Owner and Renter Taxes
 The Effect of Tax Reform on Owner and Renter Taxes Patric H. Hendershott Professor Emeritus: University of Aberdeen and The Ohio State University phh3939@gmail.com David C. Ling McGurn Professor of Real
NBER WORKING PAPER SERIES THE GROWTH IN SOCIAL SECURITY BENEFITS AMONG THE RETIREMENT AGE POPULATION FROM INCREASES IN THE CAP ON COVERED EARNINGS
 NBER WORKING PAPER SERIES THE GROWTH IN SOCIAL SECURITY BENEFITS AMONG THE RETIREMENT AGE POPULATION FROM INCREASES IN THE CAP ON COVERED EARNINGS Alan L. Gustman Thomas Steinmeier Nahid Tabatabai Working
PRELIMINARY ANALYSIS OF THE FAMILY FAIRNESS AND OPPORTUNITY TAX REFORM ACT
 PRELIMINARY ANALYSIS OF THE FAMILY FAIRNESS AND OPPORTUNITY TAX REFORM ACT Len Burman, Elaine Maag, Georgia Ivsin, and Jeff Rohaly 1 Urban-Brookings Tax Policy Center March 4, 2014 On October 30, 2013,
NBER WORKING PAPER SERIES TAX EVASION AND CAPITAL GAINS TAXATION. James M. Poterba. Working Paper No. 2119
 NBER WORKING PAPER SERIES TAX EVASION AND CAPITAL GAINS TAXATION James M. Poterba Working Paper No. 2119 NATIONAL BUREAU OF ECONOMIC RESEARCH 1050 Massachusetts Avenue Cambridge, MA 02138 January 1987
Volume Title: Tax Policy and the Economy, Volume 7. Volume Author/Editor: James Poterba, editor. Volume URL:
 This PDF is a selection from an out-of-print volume from the National Bureau of Economic Research Volume Title: Tax Policy and the Economy, Volume 7 Volume Author/Editor: James Poterba, editor Volume Publisher:
I S S U E B R I E F PUBLIC POLICY INSTITUTE PPI PRESIDENT BUSH S TAX PLAN: IMPACTS ON AGE AND INCOME GROUPS
 PPI PUBLIC POLICY INSTITUTE PRESIDENT BUSH S TAX PLAN: IMPACTS ON AGE AND INCOME GROUPS I S S U E B R I E F Introduction President George W. Bush fulfilled a 2000 campaign promise by signing the $1.35
Income Inequality, Mobility and Turnover at the Top in the U.S., Gerald Auten Geoffrey Gee And Nicholas Turner
 Income Inequality, Mobility and Turnover at the Top in the U.S., 1987 2010 Gerald Auten Geoffrey Gee And Nicholas Turner Cross-sectional Census data, survey data or income tax returns (Saez 2003) generally
center for retirement research
 SAVING FOR RETIREMENT: TAXES MATTER By James M. Poterba * Introduction To encourage individuals to save for retirement, federal tax policy provides various tax advantages for investments in self-directed
Notes and Definitions Numbers in the text, tables, and figures may not add up to totals because of rounding. Dollar amounts are generally rounded to t
 CONGRESS OF THE UNITED STATES CONGRESSIONAL BUDGET OFFICE The Distribution of Household Income and Federal Taxes, 2013 Percent 70 60 50 Shares of Before-Tax Income and Federal Taxes, by Before-Tax Income
RECENT DEVELOPMENTS IN THE MARRIAGE TAX: A COMMENT AND DECOMPOSITION A. J. CATALDO, II
 RECENT DEVELOPMENTS IN THE MARRIAGE TAX RECENT DEVELOPMENTS IN THE MARRIAGE TAX: A COMMENT AND DECOMPOSITION A. J. CATALDO, II * Abstract - This study uses the 1989 Internal Revenue Service Statistics
ICI RESEARCH PERSPECTIVE
 ICI RESEARCH PERSPECTIVE 1401 H STREET, NW, SUITE 1200 WASHINGTON, DC 20005 202-326-5800 WWW.ICI.ORG JULY 2017 VOL. 23, NO. 5 WHAT S INSIDE 2 Introduction 4 Which Workers Would Be Expected to Participate
The Tax Reform Act of 1986: Comment on the 25th Anniversary
 The Tax Reform Act of 1986: Comment on the 25th Anniversary The Harvard community has made this article openly available. Please share how this access benefits you. Your story matters Citation Feldstein,
Revenue and Incentive Effects of Basis Step-Up at Death: Lessons from the 2010 Voluntary Estate Tax Regime
 Revenue and Incentive Effects of Basis Step-Up at Death: Lessons from the 2010 Voluntary Estate Tax Regime The MIT Faculty has made this article openly available. Please share how this access benefits
continue to average 0.2 percent of GDP from 2018 through 2028, CBO projects.
 74 The Budget and Economic Outlook: 2018 to 2028 April 2018 continue to average 0.2 percent of GDP from 2018 through 2028, CBO projects. Tax Many exclusions, deductions, preferential rates, and credits
The Changing Composition of Tax Incentives
 The Changing Composition of Tax Incentives 1980-99 Eric Toder The nonpartisan Urban Institute publishes studies, reports, and books on timely topics worthy of public consideration. The views expressed
Extension of Saving and Investment Incentives
 Extension of Saving and Investment Incentives Testimony Submitted to Subcommittee on Taxation and IRS Oversight of the Committee on Finance United States Senate June 30, 2005 Eric J. Toder The Urban Institute
o. "n August 5, the U.S. Senate cleared
 economig COMMeNTORY Federal Reserve Bank of Cleveland October 15, 1993 The Budget Reconciliation Act of 1993: A Summary Report by David Altig and Jagadeesh Gokhale o. "n August 5, the U.S. Senate cleared
The Urban-Brookings Tax Policy Center Microsimulation Model: Documentation and Methodology for Version 0304
 The Urban-Brookings Tax Policy Center Microsimulation Model: Documentation and Methodology for Version 0304 Jeffrey Rohaly Adam Carasso Mohammed Adeel Saleem January 10, 2005 Jeffrey Rohaly is a research
WINNERS AND LOSERS AFTER PAYING FOR THE TAX CUTS AND JOBS ACT
 WINNERS AND LOSERS AFTER PAYING FOR THE TAX CUTS AND JOBS ACT William Gale, Surachai Khitatrakun, and Aaron Krupkin December 8, 2017 ABSTRACT Tax cuts often look like free lunches for taxpayers, but they
Tax Policy Issues and Options
 Tax Policy Issues and Options THE URBAN INSTITUTE No. 1, June 2001 Designing Tax Cuts to Benefit Low- Families Frank J. Sammartino The most important feature of tax relief, if it is to benefit lowincome
Choosing Between an Estate Tax and a Basis Carryover Regime: Evidence from 2010
 Choosing Between an Estate Tax and a Basis Carryover Regime: Evidence from 2010 The MIT Faculty has made this article openly available. Please share how this access benefits you. Your story matters. Citation
Many studies have documented the long term trend of. Income Mobility in the United States: New Evidence from Income Tax Data. Forum on Income Mobility
 Forum on Income Mobility Income Mobility in the United States: New Evidence from Income Tax Data Abstract - While many studies have documented the long term trend of increasing income inequality in the
In the United States, most tax incentives for saving are. The Taxation of Retirement Saving: Choosing Between Front Loaded and Back Loaded Options
 The Taxation of Retirement Saving The Taxation of Retirement Saving: Choosing Between Front Loaded and Back Loaded Options Abstract - We examine retirement savers choices between front and back loaded
Income Taxes and Tax Rates for Sample Families, 2006 Greg Leiserson. December 2006
 Income Taxes and Tax Rates for Sample Families, 2006 Greg Leiserson December 2006 This article examines how much income tax families pay in different situations, as well as the effective marginal tax rates
Over the last 40 years, the U.S. federal tax system has undergone three
 Journal of Economic Perspectives Volume 21, Number 1 Winter 2006 Pages 000 000 How Progressive is the U.S. Federal Tax System? A Historical and International Perspective Thomas Piketty and Emmanuel Saez
Redistribution and Tax Expenditures: The Earned Income Tax Credit
 Redistribution and Tax Expenditures: The Earned Income Tax Credit Nada Eissa, Georgetown University Hilary Hoynes, University of California, Davis Tax Expenditures Project Conference March 2008 1 Overview
How Do the Presidential Candidates Tax Plans Affect Taxpayers Marginal Tax Rates?
 FISCAL October 2008 No. 150 FACT How Do the Presidential Candidates Tax Plans Affect Taxpayers Marginal Tax Rates? By Robert Carroll Summary The Presidential candidates have proposed comprehensive tax
Income Tax Provisions Affecting Owner-Occupied Housing: Revenue Costs and Incentive Effects. James Poterba MIT and NBER
 Income Tax Provisions Affecting Owner-Occupied Housing: Revenue Costs and Incentive Effects James Poterba MIT and NBER Todd Sinai Wharton School, University of Pennsylvania and NBER July 2008 ABSTRACT
Individual Income Tax Rates and Other Key Elements of the Individual Income Tax: 1988 To 2013
 Individual Income Tax Rates and Other Key Elements of the Individual Income Tax: 1988 To 2013 Gary Guenther Analyst in Public Finance February 1, 2013 CRS Report for Congress Prepared for Members and Committees
INCOME MOBILITY IN THE U.S. FROM 1996 TO 2005 REPORT OF THE
 INCOME MOBILITY IN THE U.S. FROM 1996 TO 2005 REPORT OF THE DEPARTMENT OF THE TREASURY NOVEMBER 13, 2007 SUMMARY This study examines income mobility of individuals over the past decade (1996 through 2005)
AUGUST 2012 An Update to the Budget and Economic Outlook: Fiscal Years 2012 to 2022 Provided as a convenience, this screen-friendly version is identic
 AUGUST 2012 An Update to the Budget and Economic Outlook: Fiscal Years 2012 to 2022 Provided as a convenience, this screen-friendly version is identical in content to the principal, printer-friendly version
Prefunding Medicare. The Harvard community has made this article openly available. Please share how this access benefits you. Your story matters
 Prefunding Medicare The Harvard community has made this article openly available. Please share how this access benefits you. Your story matters Citation Feldstein, Martin. 1999. Prefunding Medicare. American
TAX POLICY CENTER BRIEFING BOOK. Background. Q. What are tax expenditures and how are they structured?
 What are tax expenditures and how are they structured? TAX EXPENDITURES 1/5 Q. What are tax expenditures and how are they structured? A. Tax expenditures are special provisions of the tax code such as
THE DESIGN OF THE INDIVIDUAL ALTERNATIVE
 00 TH ANNUAL CONFERENCE ON TAXATION CHARITABLE CONTRIBUTIONS UNDER THE ALTERNATIVE MINIMUM TAX* Shih-Ying Wu, National Tsing Hua University INTRODUCTION THE DESIGN OF THE INDIVIDUAL ALTERNATIVE minimum
Summary Preparing for financial security in retirement continues to be a concern of working Americans and policymakers. Although most Americans partic
 Ownership of Individual Retirement Accounts (IRAs) and Policy Options for Congress John J. Topoleski Analyst in Income Security January 7, 2011 Congressional Research Service CRS Report for Congress Prepared
Tax Reform and Charitable Giving
 University of Nebraska - Lincoln DigitalCommons@University of Nebraska - Lincoln Economics Department Faculty Publications Economics Department 28 Reform and Charitable Giving Seth H. Giertz University
The Child and Dependent Care Credit: Impact of Selected Policy Options
 The Child and Dependent Care Credit: Impact of Selected Policy Options Margot L. Crandall-Hollick Specialist in Public Finance Gene Falk Specialist in Social Policy December 5, 2017 Congressional Research
Tax Code Connections: How Changes to Federal Policy Affect State Revenue Technical appendix
 A methodology from Feb 2016 Tax Code Connections: How Changes to Federal Policy Affect State Revenue Technical appendix Overview of the tax model The tax model used in this analysis calculates both federal
Options to Limit the Benefit of Tax Expenditures for High-Income Households
 Options to Limit the Benefit of Tax Expenditures for High-Income Households Daniel Baneman, Jim Nunns, Jeffrey Rohaly, Eric Toder, Roberton Williams Urban-Brookings Tax Policy Center August 2, 2011 ABSTRACT
The Elasticity of Taxable Income During the 1990s: A Sensitivity Analysis
 University of Nebraska - Lincoln DigitalCommons@University of Nebraska - Lincoln Economics Department Faculty Publications Economics Department 2006 The Elasticity of Taxable During the 1990s: A Sensitivity
Social Security and Medicare Lifetime Benefits and Taxes
 E X E C U T I V E O F F I C E R E S E A R C H Social Security and Lifetime Benefits and Taxes 2018 Update C. Eugene Steuerle and Caleb Quakenbush October 2018 Since 2003, we and our colleagues have released
Summary of the Latest Federal Income Tax Data, 2017 Update
 FISCAL FACT No. 570 Jan. 2018 Summary of the Latest Federal Income Tax Data, 2017 Update Erica York Analyst The Internal Revenue Service has recently released new data on individual income taxes for tax
Regressing Towards Proportionality: Personal Income Tax Reform in New Brunswick
 Regressing Towards Proportionality: Personal Income Tax Reform in New Brunswick by Joe Ruggeri and Jean-Philippe Bourgeois March 21 Regressing Towards Proportionality: Personal Income Tax Reform in New
An Analysis of the 2004 House Tax Cuts. Leonard E. Burman 1 The Urban Institute and The Tax Policy Center. June 2004
 An Analysis of the 2004 House Tax Cuts Leonard E. Burman 1 The Urban Institute and The Tax Policy Center June 2004 1 I am grateful to Joel Friedman, Bill Gale, Bob Greenstein, Jeff Rohaly, and Isaac Shapiro
Summary of Latest Federal Income Tax Data
 December 18, 2013 No. 408 Fiscal Fact Summary of Latest Federal Income Tax Data By Kyle Pomerleau Introduction The Internal Revenue Service has released new data on individual income taxes, reporting on
How Progressive is the U.S. Federal Tax System? A Historical and International Perspective
 Revised paper July 2006 How Progressive is the U.S. Federal Tax System? A Historical and International Perspective Thomas Piketty and Emmanuel Saez Abstract (NBER version only): This paper provides estimates
The Shrinking Tax Preference for Pension Savings: An Analysis of Income Tax Changes,
 March 29, 2010 The Shrinking Tax Preference for Pension Savings: An Analysis of Income Tax Changes, 1985-2007 by Gary Burtless THE BROOKINGS INSTITUTION Washington, DC and Eric Toder URBAN INSTITUTE Washington,
GEORGIA STATE UNIVERSITY ANDREW YOUNG SCHOOL OF POLICY STUDIES FISCAL RESEARCH CENTER May 14, 1999
 GEORGIA STATE UNIVERSITY ANDREW YOUNG SCHOOL OF POLICY STUDIES FISCAL RESEARCH CENTER May 14, 1999 SUBJECT: Addressing Noncompliance in the Earned Income Tax Credit Analysis Prepared by Dagney Faulk I.
Notes Unless otherwise indicated, all years are federal fiscal years, which run from October 1 to September 30 and are designated by the calendar year
 CONGRESS OF THE UNITED STATES CONGRESSIONAL BUDGET OFFICE Budgetary and Economic Effects of Repealing the Affordable Care Act Billions of Dollars, by Fiscal Year 150 125 100 Without Macroeconomic Feedback
TAX-PREFERRED ASSETS AND DEBT, AND THE TAX REFORM ACT OF 1986: SOME IMPLICATIONS FOR FUNDAMENTAL TAX REFORM ERIC M. ENGEN * & WILLIAM G.
 TAX-PREFERRED ASSETS AND DEBT, AND THE TAX REFORM ACT OF 1986: SOME IMPLICATIONS FOR FUNDAMENTAL TAX REFORM ERIC M. ENGEN * & WILLIAM G. GALE ** Abstract - This paper focuses on two aspects of the tax
Income Mobility: The Recent American Experience
 International Studies Program Working Paper 06-20 July 2006 Income Mobility: The Recent American Experience Robert Carroll David Joulfaian Mark Rider International Studies Program Working Paper 06-20
2009 Economic Stimulus Act
 2009 Economic Stimulus Act On February 17, President Obama signed into law the American Recovery and Reinvestment Act of 2009 (the 2009 Economic Stimulus Act). This new legislation was passed to aid our
OVERALL FEDERAL TAX BURDEN ON MOST FAMILIES AT LOWEST LEVELS SINCE AT LEAST Income Taxes for Median Family of Four at Lowest Level Since 1957
 820 First Street, NE, Suite 510, Washington, DC 20002 Tel: 202-408-1080 Fax: 202-408-1056 center@cbpp.org http://www.cbpp.org Revised April 10, 200 OVERALL FEDERAL TAX BURDEN ON MOST FAMILIES AT LOWEST
WHAT DROVE THE DECLINE IN TAXPAYING? THE ROLES OF POLICY AND POPULATION
 National Tax Journal, September 2017, 70 (3), 585 620 https://doi.org/10.17310/ntj.2017.3.03 WHAT DROVE THE DECLINE IN TAXPAYING? THE ROLES OF POLICY AND POPULATION Bradley T. Heim, Ithai Z. Lurie, and
Volume Title: Tax Policy and the Economy, Volume 10. Volume Author/Editor: James M. Poterba, editor. Volume URL:
 This PDF is a selection from an out-of-print volume from the National Bureau of Economic Research Volume Title: Tax Policy and the Economy, Volume 10 Volume Author/Editor: James M. Poterba, editor Volume
Brackets (seven) - Taxable Income Single Filers. Between $9,525 and $38,700. Between $2,550 and $9,150. Between $157,500 and $200,000
 - Taxable Income Single Filers. Between $9,525 and $38,700. Between $2,550 and $9,150. Between $157,500 and $200,000") Individual Taxes (Which Would Expire After 2025) Brackets (seven) - Taxable Income Single Filers Up to $9,525 Between $9,525 and $38,700 Between $38,700 and $82,500 Between $200,000 and $500,000 Above
Individual Taxes (Which Would Expire After 2025) Brackets (seven) - Taxable Income Single Filers Up to $9,525 Between $9,525 and $38,700 Between $38,700 and $82,500 Between $200,000 and $500,000 Above
The Beacon Hill Institute
 The Beacon Hill Institute The Economic Effects of the Tax Cuts and Jobs Act THE BEACON HILL INSTITUTE NOVEMBER 2017 Table of Contents Executive Summary... 2 Introduction... 3 The Tax Cuts and Jobs Act...
The Budget and Economic Outlook: 2018 to 2028
 CONGRESS OF THE UNITED STATES CONGRESSIONAL BUDGET OFFICE The Budget and Economic Outlook: 2018 to 2028 Percentage of GDP 30 25 20 Outlays Actual Current-Law Projection Over the next decade, the gap between
Federal Taxation of Earnings versus Investment Income in 2004
 Federal Taxation of Earnings versus Investment in 2004 Institute on Taxation & Economic Policy May 2004 1311 L Street, NW, Washington, DC! 202-737-4315! www.itepnet.org Federal Taxation of Earnings versus
D A T A D I G E S T PUBLIC POLICY INSTITUTE PPI. Extending Preferences for Dividends and Capital Gains: Who Gains the Most?
 PPI PUBLIC POLICY INSTITUTE Extending Preferences for Dividends and Capital Gains: Who Gains the Most? D A T A D I G E S T Introduction In 2003, the president proposed legislation to exclude all dividend
VERY PRELIMINARY - DO NOT QUOTE OR DISTRIBUTE
 0 VERY PRELIMINARY - DO NOT QUOTE OR DISTRIBUTE Do Required Minimum Distributions Constrain Household Behavior? The Effect of the 2009 Holiday on Retirement Savings Plan Distributions Jeffrey Brown University
Summary of the Latest Federal Income Tax Data, 2018 Update
 FISCAL FACT No. 622 Nov. 2018 Summary of the Latest Federal Income Tax Data, 2018 Update Robert Bellafiore Analyst The Internal Revenue Service (IRS) has recently released new data on individual income
What the New Tax Laws Mean to You
 What the New Tax Laws Mean to You The American Taxpayer Relief Act of 2012 and other 2013 tax provisions January 2013 White Paper AN OVERVIEW OF THE AMERICAN TAXPAYER RELIEF ACT OF 2012 AND OTHER 2013
H.R American Health Care Act of 2017
 CONGRESSIONAL BUDGET OFFICE COST ESTIMATE May 24, 2017 H.R. 1628 American Health Care Act of 2017 As passed by the House of Representatives on May 4, 2017 SUMMARY The Congressional Budget Office and the
Federal Tax Treatment of Health Insurance Expenditures by the Self-Employed: Current Law and Issues for Congress Summary Current federal tax law allow
 Order Code RL33311 Federal Tax Treatment of Health Insurance Expenditures by the Self-Employed: Current Law and Issues for Congress Updated February 22, 2008 Gary Guenther Analyst in Public Finance Government
EstimatingFederalIncomeTaxBurdens. (PSID)FamiliesUsingtheNationalBureau of EconomicResearchTAXSIMModel
FamiliesUsingtheNationalBureau of EconomicResearchTAXSIMModel") ISSN1084-1695 Aging Studies Program Paper No. 12 EstimatingFederalIncomeTaxBurdens forpanelstudyofincomedynamics (PSID)FamiliesUsingtheNationalBureau of EconomicResearchTAXSIMModel Barbara A. Butrica and
ISSN1084-1695 Aging Studies Program Paper No. 12 EstimatingFederalIncomeTaxBurdens forpanelstudyofincomedynamics (PSID)FamiliesUsingtheNationalBureau of EconomicResearchTAXSIMModel Barbara A. Butrica and
Striking it Richer: The Evolution of Top Incomes in the United States (Updated with 2017 preliminary estimates)
") Striking it Richer: The Evolution of Top Incomes in the United States (Updated with 2017 preliminary estimates) Emmanuel Saez, UC Berkeley October 13, 2018 What s new for recent years? 2016-2017: Robust
Striking it Richer: The Evolution of Top Incomes in the United States (Updated with 2017 preliminary estimates) Emmanuel Saez, UC Berkeley October 13, 2018 What s new for recent years? 2016-2017: Robust
Distributional Impacts of the Tax Cuts and Jobs Act
 Distributional Impacts of the Tax Cuts and Jobs Act Aparna Mathur, AEI and Cody Kallen, UW-Madison National Tax Association Meetings November 17, 2018 Impact on Households The TCJA includes important reforms
Health-Related Revenue Provisions in the Patient Protection and Affordable Care Act (ACA)
") Health-Related Revenue Provisions in the Patient Protection and Affordable Care Act (ACA) Janemarie Mulvey Specialist in Health Care Financing January 18, 2012 CRS Report for Congress Prepared for Members
Health-Related Revenue Provisions in the Patient Protection and Affordable Care Act (ACA) Janemarie Mulvey Specialist in Health Care Financing January 18, 2012 CRS Report for Congress Prepared for Members
PERSONAL INCOME TAXES IN THAILAND THE UNITED STATES. 1. The Tax Base: Basic Rules for Calculating Taxable Income and Why Much of Income Is Untaxed
 19/11/2015 C h a p t e r 14 PERSONAL INCOME TAXES IN THAILAND THE UNITED STATES Public Finance, 10 th Edition David N. Hyman Adapted by Chairat Aemkulwat for Public Economics 2952331 Outline: Chapter 14
The Future of Social Security
 Statement of Douglas Holtz-Eakin Director The Future of Social Security before the Special Committee on Aging United States Senate February 3, 2005 This statement is embargoed until 2 p.m. (EST) on Thursday,
WOULD RAISING IRA CONTRIBUTION LIMITS BOLSTER RETIREMENT SECURITY FOR LOWER AND MIDDLE-INCOME FAMILIES? by Peter Orszag and Jonathan Orszag 1
 820 First Street, NE, Suite 510, Washington, DC 20002 Tel: 202-408-1080 Fax: 202-408-1056 center@cbpp.org http://www.cbpp.org April 2, 2001 WOULD RAISING IRA CONTRIBUTION LIMITS BOLSTER RETIREMENT SECURITY
2018 Tax Planning & Reference Guide
 2018 Tax Planning & Reference Guide The 2018 Tax Planning & Reference Guide is designed to be a reference only and is not intended to provide tax advice. Please consult your professional tax advisor prior
Tax Changes for 2016: A Checklist
 Tax Changes for 2016: A Checklist Welcome, 2016! As the New Year rolls around, it's always a sure bet that there will be changes to current tax law and 2016 is no different. From health savings accounts
Economic Impact Report
 Economic Impact Report Idaho Tax Reform Proposal by the Idaho Association of Commerce and Industry Prepared By: Dr. Geoffrey Black Professor, Department of Economics Boise State University Dr. Donald Holley
Trends in Tax Expenditures, Allison Rogers and Eric Toder Urban-Brookings Tax Policy Center September 16, 2011
 Trends in Tax Expenditures, 1985-2016 Allison Rogers and Eric Toder Urban-Brookings Tax Policy Center September 16, 2011 The landmark Tax Reform Act of 1986 greatly changed the cost of tax expenditures.
Notes Unless otherwise indicated, the years referred to in describing budget numbers are fiscal years, which run from October 1 to September 30 and ar
 Budgetary and Economic Outcomes Under Paths for Federal Revenues and Noninterest Spending Specified by Chairman Price, March 2016 March 2016 CONGRESS OF THE UNITED STATES Notes Unless otherwise indicated,
Tax Transfer Policy and Labor Market Outcomes
 Final Version Tax Transfer Policy and Labor Market Outcomes Nada Eissa Georgetown University and NBER The Car Barn, #418 Prospect St. Washington DC, 20007 Phone 202 687 0626 Fax 202 687 5544 Email: noe@georgetown.edu
THE INDIVIDUAL ALTERNATIVE MINIMUM TAX: HISTORICAL DATA
 THE INDIVIDUAL ALTERNATIVE MINIMUM TAX: HISTORICAL DATA AND PROJECTIONS, UPDATED OCTOBER 2009 Katherine Lim and Jeffrey Rohaly October 2009 Urban-Brookings Tax Policy Center The Urban Institute 2100 M
Health Insurance Coverage and Employee Contributions
 NBER NATIONAL BUREAU OF ECONOMIC RESEARCH BULLETIN ON AGING AND HEALTH Issue No. 1, FALL 2002 Health Insurance Coverage and Employee Contributions How to Increase 401(K) Saving The Changing Character and
Middle Class Tax Relief Act of 2012
 Middle Class Tax Relief Act of 2012 Two major bills enacting tax cuts for individuals expire at the end of 2010: the Economic Growth and Tax Relief Reconciliation Act of 2001 (EGTRRA); and the Jobs and
2011 Tax Guide. What You Need to Know About the New Rules
 2011 Tax Guide What You Need to Know About the New Rules Tax Guide 2011 This guide is not intended to be tax advice and should not be treated as such. Each individual s tax situation is different. You
TOP INCOMES IN THE UNITED STATES AND CANADA OVER THE TWENTIETH CENTURY
 TOP INCOMES IN THE UNITED STATES AND CANADA OVER THE TWENTIETH CENTURY Emmanuel Saez University of California, Berkeley Abstract This paper presents top income shares series for the United States and Canada
Notes and Definitions Numbers in the text, tables, and figures may not add up to totals because of rounding. Dollar amounts are generally rounded to t
 CONGRESS OF THE UNITED STATES CONGRESSIONAL BUDGET OFFICE The Distribution of Household Income and Federal Taxes, 2011 Percent 70 60 Shares of Before-Tax Income and Federal Taxes, by Before-Tax Income
THE STATISTICS OF INCOME (SOI) DIVISION OF THE
 DIVISION OF THE") 104 TH ANNUAL CONFERENCE ON TAXATION A NEW LOOK AT THE RELATIONSHIP BETWEEN REALIZED INCOME AND WEALTH Barry Johnson, Brian Raub, and Joseph Newcomb, Statistics of Income, Internal Revenue Service THE
104 TH ANNUAL CONFERENCE ON TAXATION A NEW LOOK AT THE RELATIONSHIP BETWEEN REALIZED INCOME AND WEALTH Barry Johnson, Brian Raub, and Joseph Newcomb, Statistics of Income, Internal Revenue Service THE
Federal Minimum Wage, Tax-Transfer Earnings Supplements, and Poverty
 Federal Minimum Wage, Tax-Transfer Earnings Supplements, and Poverty -name redacted- Specialist in Social Policy -name redacted- Specialist in Social Policy -name redacted- Specialist in Labor Economics
ENTITY CHOICE AND EFFECTIVE TAX RATES
 ENTITY CHOICE AND EFFECTIVE TAX RATES UPDATED NOVEMBER, 2013 Prepared by Quantria Strategies, LLC for the National Federation of Independent Business and the S Corporation Association ENTITY CHOICE AND
Child and Dependent Care Tax Benefits: How They Work and Who Receives Them
 Child and Dependent Care Tax Benefits: How They Work and Who Receives Them Margot L. Crandall-Hollick Specialist in Public Finance March 1, 2018 Congressional Research Service 7-5700 www.crs.gov R44993
The mortgage interest deduction (MID) is perhaps the best known tax benefit for
 is perhaps the best known tax benefit for") National Tax Journal, December 2011, 64 (4), 977 1000 THE DISTRIBUTIONAL AND REVENUE CONSEQUENCES OF REFORMING THE MORTGAGE INTEREST DEDUCTION Adam J. Cole, Geoffrey Gee, and Nicholas Turner The mortgage
National Tax Journal, December 2011, 64 (4), 977 1000 THE DISTRIBUTIONAL AND REVENUE CONSEQUENCES OF REFORMING THE MORTGAGE INTEREST DEDUCTION Adam J. Cole, Geoffrey Gee, and Nicholas Turner The mortgage