Local Government Finance: Fees and Charges to
|
|
|
- Cecilia Watts
- 6 years ago
- Views:
Transcription


1 SPICe Briefing Pàipear-ullachaidh SPICe Local Government Finance: Fees and Charges to Ailsa Burn-Murdoch This briefing, produced in collaboration with Audit Scotland, provides detail on the change in income from fees and charges for local government services between and November 2017 SB 17-82
2 Contents Executive Summary 4 Background 6 Local government budget trends 6 Fees and charges for services 6 Challenges in exploring fees and charges 7 Focus of this briefing 7 Methodology 8 Data used 8 Categorisation 8 Reporting variances and level of detail 9 Arms Length External Organisations (ALEOs) 10 Approach 10 The big picture 12 Sources of council funding in General Fund fees and charges income 14 Service-level analysis 15 Overview 15 Service-level approach 15 Social Work 15 Roads and Transport 17 Education 19 Environmental 21 Planning and Development 22 Culture and Leisure 24 Central, Trading and General Fund Housing 26 Case studies 27 Introduction 27 Methodology 27 Social Care 28 Changes to social care income by category 28 Changes to social care income by age 29 Education 31 Changes to Education services income by category 32 Changes to School Meals income 33 2
3 Future Work 36 Annexe 37 Aberdeen City 37 Aberdeenshire 38 Angus 38 Argyll and Bute 39 Clackmannanshire 39 Dumfries and Galloway 40 Dundee 40 East Ayrshire 41 East Dunbartonshire 41 East Lothian 42 East Renfrewshire 42 City of Edinburgh 43 Eilean Siar 43 Falkirk 44 Fife 44 Glasgow City 45 Highland 45 Inverclyde 46 Midlothian 46 Moray 47 North Ayrshire 47 North Lanarkshire 48 Orkney 48 Perth and Kinross 49 Renfrewshire 49 Scottish Borders 50 Shetland 50 South Ayrshire 51 South Lanarkshire 51 Stirling 52 West Dunbartonshire 52 West Lothian 53 Related Briefings 0 Bibliography 54 3
4 Executive Summary Evidence to the Local Government and Communities Committee and audit work carried out by Audit Scotland in recent years has highlighted that local authorities may be increasing fees and charges for services to offset budgetary pressures. SPICe gave an overview of fees and charges in Local Government Finance: Facts and Figures to , and found (using a different methodology to that used in this briefing) that between and , income for Scottish local government as a whole from fees and charges for services had increased by almost 13%, with the most significant increases in charging being in Central Services, Planning and Development Services, Education and Roads and Transport. This briefing, produced in collaboration with Audit Scotland, explores the income from fees and charges for services further. It looks at high-level trends between and for all General Fund service areas, and explores the areas of Social Care and Education in more detail. Key points include- Overall Excluding Housing Revenue Account income, local authorities received customer and client receipts of 1.26bn - around 8% of councils total income in Fees and charges for General Fund services, the focus of this briefing, made up around 40% of these customer and client receipts in ( 544.2m) i.e. around 3.5% of councils' total income. Since the income that councils have raised from fees and charges to service users has reduced from 569.7m to 544.2m (4.5%, real terms). The largest area of income from fees and charges for General Fund services comes from Social Work (44%), with Roads (12%) and Education (11%) representing the next largest areas of income. Combined, these represented around two thirds of fees and charges income in Social Work Social Work income from fees and charges has reduced by 13.2m (5.2%) in real terms from 252.2m in to 239m in From to , the proportion of the total Social Work service income coming from fees and charges fell from 30.1% to 27.3%. This is partly attributable to how councils are recognising the flow of income that arises from the health and social care integration. From to , income from charges for Older Persons and Adults with Learning Disabilities fell, by 2% and 22% respectively. Income from charges for services for Adults with Physical or Sensory Disabilities and Adults with Mental Health needs increased, with the latter increasing by 17%. Between to , whilst the total income from charges to Social Work service users fell, the reduction was much smaller for services for Older Persons 4
5 category (2%) than for the combined Adult Services (less 'Adult with other support needs'), which fell by 17%. Education Income from fees and charges for Education services increased from 54.7m in to 57.4m in (in real terms, a 5% increase). Between and the proportion of Education Services income attributed to fees and charges fell from over 30% to 27.4%. In the years to , changes to School Meal income in Primary and Secondary Education followed a similar trend to one another, before diverging slightly, then more widely between and Between and , income from charges for school meals at a Primary School level fell by 21%, compared to a 5% increase in income from charges for Secondary School meals, reflecting Scottish Government policy commitments. Other service areas Over to , the proportion of total service income derived from fees and charges income for Roads and Transport services remained relatively stable at around 38% (with the exception of where it fell to 35%). Income from fees and charges within Environmental services decreased from 57.5m in to 47.3m in (in real terms, a 17.8% reduction). Between and the proportion of Environmental services income attributed to fees and charges increased from 33.7% to 35.6%. Planning and Development services income from fees and charges increased from 20.4m in to 35.4m in (in real terms, a 73.9% increase). Between and the proportion of Planning and Development service income attributed to fees and charges increased from 13.7% to 19.5%. Income from fees and charges for Culture and Leisure services decreased by 12.1m over the period, from 42.6m in to 30.5m in (in real terms, a 28.4% decrease), however this is an area where the use of Arms Length External Organisations is predominant. Despite a reduction in the number of councils reporting income within this category, as a proportion of the total Culture and Leisure service income reported across all councils it rose from 31.6% of total income in to 32.9% in The remaining areas of General Fund services that generate income from fees and charges to service users (Central, Trading and General Fund Services) account for a relatively small proportion of all fees and charges income. For example in , combined, they made up 13% of all fees and charges income (an increase from 12.4% in ). 5
6 Background Local government budget trends The Accounts Commission, in its report Local government in Scotland: Financial overview 2015/16 2, explained that local authorities are facing increasing budgetary pressure- Significant challenges for local government finance lie ahead. Councils budgets are under increasing pressure from a long-term decline in funding, rising demand for services and increasing costs, such as pensions. There is variation in how these pressures are affecting individual councils, with some overspending their total budgets or budgets for individual services such as social care. It is important that councils have effective budgetary control arrangements in place to minimise unplanned budget variances that can affect their financial position Accounts Commission, The Local Government and Communities Committee carried out scrutiny of the Draft Budget in the Autumn of Submissions highlighted that, due to a large amount of local authority funding being effectively ring-fenced, councils were increasingly applying fees and charges for non-statutory services 3. The increased costs of service delivery, for instance through the commitment to pay the Living Wage, were said to have further compounded this issue 3. Fees and charges for services Charging for services was explored by the Accounts Commission in its report, Charging for services: are you getting it right? 4, published as part of its improvement series for councillors and officers. It reported that- Information reported by councils in their annual Scottish Government financial returns indicates that they raise over 1.3 billion a year through charges, accounting for 7.4 per cent of councils total revenue. The proportion of income from charges rose from 5.6 per cent in 2003/04 to 7.4 per cent in The implementation of the council tax freeze in 2007/08 altered the relative proportion of councils income from charges. Accounts Commission, The Accounts Commission again referenced fees and charges for services in its reports, Local government in Scotland: Financial overview 2015/16 2 and Local government in Scotland: Performance and challenges In response to reports on the growing use of fees and charges, a focus on this area was included in the SPICe briefing, Local Government: Facts and Figures to In its overview of fees and charges for services (which uses a different methodology to that used in this briefing), SPICe found that between and , income for Scottish local government as a whole from fees and charges for services had increased by 6
7 almost 13%, with the most significant increases in income being in Central Services, Planning and Development Services, Education and Roads and Transport. Challenges in exploring fees and charges Due to the format of councils accounts, income generated from fees and charges is difficult to identify, and changes to accounting practice from makes this more difficult. Income for individual services (for example Education or Social Work) is presented, but includes specific grants, fees and charges from service users, and a variety of other income sources. This is has traditionally been referred to within the Accounts Commission's overview reports as service income, fees and charges. During a briefing to the Local Government and Communities Committee in December 2016, the Deputy Chair of the Accounts Commission gave a commitment to do more detailed work in relation to local authority income arising from fees and charges 7. To fulfil this commitment, the Accounts Commission s financial overview of 2016/17, Local government in Scotland: Financial overview 2016/17 8 provides more detail than in previous overview reports, using sources other than just the accounts. Focus of this briefing The main sections of this briefing, produced by SPICe's Financial Scrutiny Unit in collaboration with Auditors at Audit Scotland, aim to further fulfil this commitment by expanding and complementing the Accounts Commission's financial overview 2016/17 report by showing some of the recent trends in local authorities charging for services. One of the reasons for looking at fees and charges in more depth is to establish the impact on different groups of service users. SPICe hope that the additional case studies within briefing will help to illustrate the current climate of fees and charges, and which social groups may be more or less affected by local authorities charging for services. This builds on work carried out by the Universities of Glasgow and Heriot Watt in collaboration with SPICe on the Social impact of the local government budget 9. An update of this work is due to be published in early-december
8 Methodology Data used Data for this briefing has been taken from the Local Financial Return (LFR) statistics collated by (and provided by) the Scottish Government. LFRs are submitted to the Scottish Government on an annual basis, and show final income and expenditure statistics relating to local government bodies that submit them, to be used to inform policy decisions. The LFRs form the basis of the Scottish Government s annual Local Government Finance Statistics publication. LFRs are submitted by all local authorities, including Regional Transport Partnerships, Bridge Authorities and Valuation Joint Boards. The figures in this briefing focus on charging within Scotland's 32 councils, as opposed to all local authorities and so, while based on the same information (the LFRs), some aggregate figures will differ from the Scottish Local Government Financial Statistics publication. LFR data in its current form stretches back until , so that is the baseline year used in this briefing to analyse the trend in councils income from fees and charges. For individual councils, however, we have limited some of the more detailed analysis to more recent years to ensure that it is as current as possible and due to limitations in the data. Following the Police and Fire Reform (Scotland) Act 2012, Police and Fire boards were abolished and the new national bodies were formally classified as Central Government. Due to the reclassification, data on Police and Fire Boards was not collected from onwards. Where applicable, the funding for police and fire services has been adjusted out of Scottish aggregate figures for and To compare the income councils are raising from charging for services over time figures have been adjusted into real terms (i.e. adjusted to take into account inflation). Categorisation The LFRs show council services in-line with CIPFA s Service Accounting Code of Practice (SerCOP). This defines what activities are recorded under each service heading. This means they contain data that is directly comparable across all councils even if each council is structured differently. If a council owns council houses (26 councils in Scotland do) it must have a separate Housing Revenue Account (HRA) which includes all income and expenditure relating to council houses. Fees and charges (and income from council house rents) related to the HRA have not been included in this briefing, which is focused on common services that councils provide to the general public as a whole (referred to as General Fund services). The following categories give examples of the what is covered within each service area and the type of income connected to each service area- Central services to the public (including council tax collection, registrars and licensing). Example of charge to a service user: fees for registering births or marriages. 8
9 Cultural and related (museums, community centres and libraries). Example: fees to enter a leisure centre. Education (schools, pupil support and special educational needs). Example: charges for school meals. Environmental (environmental health, household waste collection and recycling). Example: charges for a bulk uplifts of household items. Housing (housing improvement grants, homelessness and support services). Example: charges for carrying out necessary repairs to (non-council) housing. Planning and development (building control, planning policy and economic development).example: fees for a planning application. Roads and transport (road construction, lighting and maintenance). Example: parking charges. Social Work (care services and children and family services). Example: specific charges relating to residential care. The LFRs contain information about what income each service has raised from customer and client receipts. This is split into three types of charges- Fees and charges (for services, use of facilities, admissions and letting). Rent Income. Other Sales, fees and charges (i.e. sales of goods and services and other. income from charges to services users or rent income). Throughout this briefing we focus our analysis on income councils have raised from fees and charges to services users to show the trend in how councils are raising income from charging to access services. Reporting variances and level of detail Local Financial Returns (LFRs) are provided by councils to the Scottish Government on a self-reporting basis. They are not audited by Audit Scotland or other auditors appointed by the Accounts Commission. The Scottish Government validates the data from the LFRs, and issues guidance for filling them in 10, however given the wide range of services provided by councils and the differing management structures that councils have, there are variances in the approaches that local authorities take to categorising income and expenditure. There can also be inconsistencies in how individual councils have dealt with income over time, for example changing the classification of income following a change in the way that services are provided or to accounting practice. 9
10 Arms Length External Organisations (ALEOs) To compound this difficulty, local authorities can use Arms Length External Organisations (ALEOs) to deliver a range of services. ALEOs "can provide services more flexibly than councils, generate income and deliver savings" 5. This means that, depending on the arrangements in place, income and expenditure for those service areas delivered by the ALEO may not be recorded in the same way as it would be were those services provided directly by the council. In practice, this means that beyond the highest level of data, the data reflected in LFRs will not reflect the full picture about income and expenditure. For instance, a local authority who uses an ALEO to run all of its leisure services may present as having received no client income in that service area, even though service users are being charged to use those 'council' services. In these cases, it is not possible to see the income from charges to service users, let alone any changes to the level of income. It is difficult to get an idea of the scale of the use of ALEOs, and just how much data in LFRs may be skewed by this. However the Accounts Commission, in its report Local government in Scotland: Performance and challenges explains that- Evidence suggests that the number of council ALEOs has reduced slightly in 2016 from about 140 to 130. ALEOs provide a range of services across Scotland, with around one third providing leisure and culture services. Accounts Commission, Throughout this briefing we identify the numbers of councils reporting income from fees and charges relating to specific services to identify where the trend in reported figures may be influenced by the above issues. Generally, if income from fees and charges in a specific service within an individual council drops to zero, and remains as such, then this will indicate that the council may have set up an ALEO within that service area, and this has impacted how the council is accounting for the income generated. If income from fees and charges reduced to zero before being recorded again in the following year this is likely to be due to a change in the treatment of that income in the LFRs. Approach Within this briefing, service income from charges to service users has been compared against total income in order to explore the proportion of income which has come from charges to service users. As noted, this does not include services related to council housing. For the majority of service areas, going beyond this high-level analysis would show little in terms of reliable trend because of the number of instances where councils do not report income at the service sub-levels within LFR data (these are referred to as nil-returns in this briefing). There are two service areas, however, where data is available to a detailed enough level that we can explore it further - Education and Social Work. This is because they represent the two largest areas of local government spending, and as such the Scottish Government 10
11 collects more detailed LFR responses from councils on these areas. Although this briefing presents an analysis of the sub-categories of income in these areas, the figures (particularly within Social Work) are likely to be affected by instances where services are contracted out to private or third-sector partners. As a result of this, these should be viewed as purely illustrative case studies. No account has been taken of demographic changes which may have had an impact on demand for services. For a number of charts within the case studies, councils which did not report income in any or all years have been removed from the total figures. Charts in this briefing, in cases where not all councils reported income, have the number of councils who reported an income for that service each period under the year. Further to this, outliers have been removed from the case study analysis beyond the top level. The annexe of this briefing provides a chart for each council that shows the total income they have recorded from fees and charges from to (at prices) and which services have contributed to this. It is hoped that this will prove useful in identifying how each individual council is generating income from fees and charges to service users. 11

12 The big picture This briefing explores both the changes to income from charging for services overall, by exploring General Fund Services in the round, and the changes within individual service areas. It's important to bear in mind throughout that councils receive income from a variety of sources in order to provide services. This includes revenue and capital grants from the Scottish Government (and others), non-domestic rates, council tax income, and selfgenerated income. Customer and client receipts are generated by councils. 26 councils provide council housing. Six councils no longer own council housing having transferred housing stock to Registered Social Landlords (housing associations). All income and expenditure relating to council housing is kept within a separate Housing Revenue Account. This is because money raised, for example through right to buy sales or from rent, can only be spent on the providing, maintaining or investing in council housing. Other council services are provided through the General Fund. Councils recognise general income and service specific income. For general funding (including the majority of revenue grants from the Scottish Government), the council can decide where it spends this money. The way that grants are recorded within income can vary - general grants are recorded as a single figure in the accounts and LFRs but grants for a specific purpose are recorded within service income. Any income generated from customer and client receipts will also be shown against specific services. This service income, excluding HRA rent income, made up around 25% of council funding in Sources of council funding in General Fund service income, which included 1.3bn of customer and client receipts, made up around 25% of councils total income in Figure 1 - Sources of local government income, , Cash Note: 6 councils no longer manage housing stock due to previous stock transfers to housing associations - Dumfries & Galloway Council, Glasgow City Council and Scottish Borders Council in 2003, Eilean Siar and Argyll & Bute Council in 2006 and Inverclyde Council in
13 Excluding all HRA customer and client receipts (mainly rental income of around 1bn), customer and client receipts of 1.26bn (fees and charges from service users, rent income and other fees and charges) made up only around 8% of councils total income in (mainly government grants, non-domestic rates, council tax income). Fees and charges for General Fund services, the focus of this briefing, made up around 40% of this ( 544.2m in ) i.e. around 3.5% of councils total income. Figure 2 General Fund customer and client receipts in Note: Total customer and client receipts for the local government sector (councils, Regional Transport Partnerships, Bridge Authorities and Joint Valuation Boards) were 1.28bn in Councils share of this was 1.26bn, including fees and charges of 544.2m. Figure 2 shows that only around 40% of customer and client receipts were from fees and charges for using services. 13
14 General Fund fees and charges income Figure 3 - General Fund income from fees and charges to service users, to Figure 3 shows that, between and , the income that the 32 councils raised from fees and charges to service users reduced from 569.7m to 544.2m (4.5%, real terms). This overall trend, however, will be affected by variations in the number of councils reporting income within individual service areas. 14
15 Service-level analysis Overview Figure 4 - Fees and charges by service area, to , Real terms Figure 4 shows that, of the service areas covered in this briefing, by far the largest proportion of income comes from Social Work, with Roads and Education representing the next largest areas of fess and charges income respectively. Service-level approach The following sections look at the high-level trends over individual service areas. Where the general trends have been noted there may be some slight variations over the years, as some councils have not reported income from charges to service users consistently over the 5 year period. This is due to various factors as discussed in the methodology section. The income from fees and charges graphs within each section have the number of councils who reported an income for that service each period under the year. Because, over the longer term, the income from Central, Trading and Housing services has represented the smallest quantities, these service categories have been combined. Social Work Social Work income from fees and charges has reduced by 13.2m (5.2%) in real terms from 252.2m in to 239m in It should be noted that this includes payments between councils where a resident from one council area is receiving care, for 15
16 example is resident within a care home, in a different area. Therefore these figures do not simply represent fees that individuals are paying to access care services. Figure 5 - Social Work income from fees and charges to , Real terms All 32 councils reported income from fees and charges in all five years. Total Social Work income (service income mainly from grants, contributions from health authorities and customer and client receipts) was 874.8m in From to the proportion of this service income coming from fees and charges fell from 30.1% to 27.3%. This is partly attributable to how councils are recognising the flow of income that arises from health and social care integration (and councils receiving budgets from Integration Authorities to deliver a range of delegated services). A number of other factors may also directly influence this including, but not limited to, different demographics within each service area, and the nature of care provision within each council (specifically different thresholds for eligibility/contribution rates for care packages). There was variation between the level of customer and clients receipts each council received from fees and charges from service users in
17 Figure 6 - Social Work services income from fees and charges, as a proportion of total Social Work services income, Figure 6 shows that there was wide variation in the percentage of Social Work income coming directly from fees and charges to service users in Roads and Transport Roads and Transport services are the major area where figures for councils will differ from figures for the local government sector as a whole (as reported in the Local Government Finance Statistics). This is due to the inclusion of income and expenditure statistics relating to Regional Transport Partnerships being included within the sector figures. Fees and charges income from roads accounted for 12% of councils total fees and charges income in Once removed, income from fees and charges reduced from 71.6m in to 64m in (in real terms, a 10.6% reduction). This was accompanied by annual changes in the number of councils reporting fees and charges income within this service area. Several councils reported no fees and charges income consistently over the period, reflecting local arrangements, but information from other councils as supplied through the LFRs varied. For example- Eight councils consistently reported zero income from fees and charges across the period. 12 councils consistently reported income from fees and charges across the period. 12 councils saw variation in the information reported, including four councils who began reporting income but, by the end of the period were reporting no income from fees and charges. 17
18 Details of the which services individual councils reported fees and charges income for each year is shown in the Annexe. Figure 7 - Roads and Transport services income from fees and charges to , Real Terms Over the period the share of service income derived from fees and charges remained relatively stable at around 38% (with the exception of where it fell to 35%). 18
19 Figure 8 - Roads and Transport services income from fees and charges, as a proportion of total Roads and Transport services income, Education Education is a significant area of council spending and generates a significant proportion of fees and charges income (11% of the total in ). The sources of this income are explored in more detail within the case study later in this report. Income from fees and charges for education services increased from 54.7m in to 57.4m in (in real terms, a 5% increase). This was accompanied by annual changes in the number of councils reporting fees and charges income within this service area. Several councils reported no fees and charges income consistently over the period, reflecting local arrangements, but information from other councils as supplied through the LFRs varied. For example- Seven councils consistently reported zero income from fees and charges across the period. 19 councils consistently reported income from fees and charges across the period. Six councils reported fees and charges in some but not all years. 19
20 Figure 9 - Education services income from fees and charges to , Real terms Between and the proportion of Education service income attributed to fees and charges fell from over 30% to 27.4%. Figure 10 - Education services income from fees and charges, as a proportion of total Education services income,
21 Environmental Income from fees and charges within Environmental services decreased from 57.5m in to 47.3m in (in real terms, a 17.8% reduction). This was accompanied by annual changes in the number of councils reporting fees and charges income within this service area. Several councils reported no fees and charges income from Environmental services consistently over the period, reflecting local arrangements, but information from other councils as supplied through the LFRs varied. For example- Seven councils consistently reported zero income from fees and charges across the period. 13 councils consistently reported income from fees and charges across the period. 12 councils reported fees and charges in some but not all years. Figure 11 - Environmental services income from fees and charges to , Real terms Between and the proportion of Environmental services income attributed to fees and charges increased from 33.7% to 35.6%. 21
22 Figure 12 - Environmental services income from fees and charges, as a proportion of total Environmental services income, Planning and Development Planning and Development services income from fees and charges increased from 20.4m in to 35.4m in (in real terms, a 73.9% increase). This was accompanied by annual changes in the number of councils reporting fees and charges income within this service area. Several councils reported no fees and charges income consistently over the period, reflecting local arrangements, but information from other councils as supplied through the LFRs varied. For example- Seven councils consistently reported zero income from fees and charges across the period. 11 councils consistently reported income from fees and charges across the period. 14 councils reported fees and charges in some but not all years. 22
23 Figure 13 - Planning and Development services income from fees and charges to , Real terms Between and , the proportion of planning and development service income attributed to fees and charges increased from 13.7% to 19.5%. Figure 14 - Planning and Development services income from fees and charges, as a proportion of total Planning and Development services income,
24 Culture and Leisure Culture and Leisure services is an area of interest when analysing the income that councils raise from charges to service users due to the nature of the services provided. However, this is also one of the areas where councils have most prominently set up ALEOs, and figures will be heavily influenced by this. The impact on how this affects councils reporting income will include the services that are provided by the ALEO (leisure, culture or both), the structure of the ALEO, and it's relationship to the council and the accounting treatment related to this. Income from fees and charges for Culture and Leisure services decreased by 12.1m over the period, from 42.6m in to 30.5m in (in real terms, a 28.4% decrease). Several councils reported no fees and charges income consistently over the period, reflecting local arrangements, but information from other councils as supplied through the LFRs varied. For example- Four councils did not report any leisure fees and charges income from to , which may indicate services are supplied by a leisure ALEO and recorded within council accounts as a transfer between the two bodies rather than as income derived from service users. 18 councils reported income from fees and charges every year in the period suggesting that all fees income from a leisure ALEO is recorded or that there are services the council supplies directly (i.e. not transferred to an ALEO). 10 councils did not consistently report income in every year suggesting that they will either be recording this income within different categories or, where income has not been recorded in , new arrangements may have been introduced. 24
25 Figure 15 - Culture and Leisure services income from fees and charges to , Real terms Despite a reduction in the number of councils reporting income within this category, as a proportion of the total Culture and Leisure service income reported across all councils it rose from 31.6% of total income in to 32.9% in Figure 16 - Culture and Leisure services income from fees and charges, as a proportion of total Culture and Leisure services income,
26 Central, Trading and General Fund Housing The remaining areas of General Fund services that generate income from fees and charges to service users account for a relatively small proportion of all fees and charges income. For example in , combined, they made up 13% of all fees and charges income (an increase from 12.4% in ). Combined, however, they represent a large number of services provided by councils directly to the public, including for example statutory repairs to privately owned buildings. Figure 17 Income from fees and charges for Central, Trading and General Fund Housing services to , Real terms 26
27 Case studies Introduction As explained in the methodology section of this briefing, the data on Education and Social Work services is detailed enough to allow for some further analysis at a sub-category level. It is still the case, however, that reporting differences and the use of third or private sector social care providers will have an effect on this data - it cannot be said to reflect the true impact on service users. Education and Social Work are the two biggest areas of local government spending, and the areas which have the most service users. In recent years, funding for these two service areas has been protected within the Scottish Government's funding for local authorities to some extent, through commitments to, for instance, maintain pupil:teacher ratios and fund the living wage for social care practitioners. CoSLA, in its submission to the Local Government and Communities Committee on prebudget scrutiny , explains that 58% of the local government budget is now ringfenced, meaning that any cuts of local government budgets must come from the remaining 42%. It surmises that an 8% cut in local government spending would effectively result in a 20% cut on unprotected core services, before the pressures of inflation and demand are taken into account. CoSLA noted the increased use of fees and charges, but argued that- Local authorities can t price citizens out of services that deliver social inclusion, health and well-being, early intervention and prevention, when setting charges. For example, when setting charges for access to leisure and cultural facilities. CoSLA, Methodology Data for local authorities who did not report any service income in any year (for instance because ALEOs were providing services) has been removed, so the number of local authorities with data in each category is noted in brackets on charts where relevant. It is possible that ALEOs, or private or third-sector partners, are used to deliver some, but not all, services in some areas - data has not been adjusted to remove these instances. Local authorities which present more than a 100% change (unless otherwise stated) between and have been removed. It's important to note that income has not been explored on a per-capita basis, nor has the population make-up of individual local authorities been taken into account. It is possible that demographic changes, such as increasing and declining populations, and ageing populations, may have had an impact on income, but an analysis at this level has not been included in this briefing. 27
28 Social Care The joint SPICe briefing with the Universities of Glasgow and Heriot Watt, The social impact of the local government budget 9, explores, with the use of a social impact tool, the spending and saving choices made by local authorities in the context of the impact on different social groups. SPICe have chosen to include detail on this classification approach in this briefing in the interest of linking to this work. The social impact tool classifies council services into six categories on a scale between Pro-Rich and Very Pro-Poor. Pro-Rich implies the service is used disproportionately more by more affluent households but does not mean that it is only used by more affluent households. Further information on the classification and its development can be found in the joint briefing 9. Social work services in the context of the social impact tool classification, range from "Pro- Poor" to "Very Pro-Poor", which suggests that the impact of charges within this service area may fall on those that can least afford it. Changes to social care income by category Figure 18 - Income from charges for Social Care services by category, to , % change, Real terms 28
29 Figure 18 shows the changes to the total income from charges to service users, by service category. Because only nine local authorities consistently reported income from Children and Family services and Other Adult services, these categories have not been included. It's important to note that it's not possible to see from this data whether increased income results from increased charges, or from increased service use through, for instance, demographic changes or greater demand for services. The trends suggest that, whilst income from charges in Social Care services overall has only risen by 4%, income from charges for services for Adults with Physical or Sensory Disabilities and Adults with Mental Health Needs has increased at a higher rate. Income from charges for the Older Persons and Adults with Learning Disabilities service categories show a reduction in income, with falls of 2% and 22% respectively. By far the greatest increase in income from fees and charges has been for Adults with Mental Health Needs, at 17%, though it should be noted that this reflects data from only 17 local authorities as the instances of nil-returns and outliers in this areas is high. Changes to social care income by age Due to the inconsistencies in data, another way to view this is to combine all adult services (with the exception of 'Adults with Other Needs') into a single category. Figures for Adult Services in the bracket represent the combined figures used in Figure 18, with nilreturns and outliers removed. 29
 than for all Adult Services (less 'Other'), which fell by 17%.")
30 Figure 19 - Income from charges for Social Care services by age, to , % change, Real terms This shows that between to , income from charges to service users fell all round. There was, however, a much smaller fall in the Older Persons category (2%) than for all Adult Services (less 'Other'), which fell by 17%. In both cases, decreases in income could be down to changes in service provision and/or demand arising from demographic changes. We can break the overall income level down further to look at the income from charges made by different local authorities. 30
31 Figure 20 - Individual councils' income from Social Care by age, to , % change, Real terms Looking at individual councils, once councils with nil-returns and outliers (greater than a 60% change) are removed, it's possible to compare the income from charges to service users for 16 local authorities. This presents a mixed picture, though it can be said that most local authorities have seen changes to income in one specific area or the other. Education Education is the largest area of local government spending 2, and the third largest area in terms of the amount of income generated by fees and charges for services. The Scottish Government's policies relating to early learning hours, maintaining pupil:teacher ratios and free school meals mean that a large portion of local government spending is pre-allocated to Education services. Teachers pay is agreed at a national level by the Scottish Negotiating Committee for Teachers (of which local government representatives form a part), which further constrains spending decisions at a local level The social impact tool used in the briefing The social impact of the local government budget 9 classifies Pre-primary Education as being "Neutral", Secondary Education as "Neutral-Poor", and both Primary and Special Education as being "Pro- Poor". In its Draft Budget , the Scottish Government committed to free school meals for all P1 to P3 children worth around 330 for each of around 170,000 children 12. Updating this in its Draft Budget , the Scottish Government set out that, in the context of delivering its Pupil Equity Fund, as of

32 Schools will be allocated around 1,200 for each pupil from P1-S3 known to be eligible for free school meals. Scottish Government, The Pupil Equity Fund is intended for schools to use to address the socio-economic gap in attainment. It largely benefits pupils that happen to qualify for free school meals on low income grounds, however the focus is not on school meals themselves. Funding for the Pupil Equity Fund is included in the local government settlement, however, money is allocated to individual schools to be utilised at the discretion of headteachers in addition to the resources already available to them 13. Changes to Education services income by category Figure 21 - Income from charges for Education Services to , % change, Real terms Figure 21 shows that, once nil-returns and outliers are removed, total income from charges for Education Services reduced by 19% between and Income from charges within all categories fell, with the greatest reduction being in Special Education at 53%. Of the 17 local authorities included in these figures, only five saw increased income from charges. The smallest reduction in income was in charges from Primary Education services, at 12%. As discussed in the methodology section, the reasons for changes could vary. It should be noted that these figures demonstrate a reduction in income, not a reduction in actual charges - it is possible that income in this area as a whole has reduced because the offerings of Education Services which local authorities charge for, such as extra-curricular activities and excursions, are reducing. 32

33 Changes to School Meals income Local Government Finance: Fees and Charges to , SB Figure 22 - Income from School Meals, to , % change, Real terms Figure 22 shows the change in the comparative income from charges for School Meals within Primary and Secondary Education from to Nil-returns and outliers greater than a 50% change have been removed. As might be expected in the context of policy, income from charges at a Primary level decreased by 21% between and Data shows that this change can be attributed to a fall at the same percentage between and the point at which the Scottish Government's commitment to provide free school meals to 170,000 eligible children was introduced. In contrast, income from charges for school meals at the Secondary level increased by 5% between and
34 Figure 23 - Income from School Meals, by year, % change, Real terms Figure 23 shows that, in the years to , changes to School Meal income in Primary and Secondary Education followed a similar trend, before diverging slightly, then more widely between and This supports the suggestion that recent policy changes have had a marked impact on income. As with Social Care, the trend can be broken down to a local authority level. 34
35 Figure 24 - Individual councils' income from School Meals, % change, Real terms Looking at individual councils, once councils with nil-returns and outliers (greater than a 50% change) are removed, it's possible to compare the income from charges for School Meals for 30 local authorities. Figure 24 shows that the real terms income from School Meals received by local authorities for Primary Schools has relatively consistently fallen, though it has increased in three council areas. By contrast, 20 out of 30 local authorities saw an increase in income from Secondary School Meals. This suggests that policy commitments relating to free school meals at the Primary level may have lead to some local authorities charging more for Secondary School meals, however it's important to note that this analysis does not take into account any demographic changes which may have caused changes to demand levels. 35
36 Future Work Local financial Return figures for are due to be published in February 2018, which may offer an opportunity to update this work. Further analysis of the trends within the case study areas of Social Care and Education services may help to gain a better understanding of the impact of central government policy on these key areas of spending, for instance the expansion of free school meal provision. The Accounts Commission will publish their next wider local government overview (rather than their financial overview) in April This will provide an opportunity for initial analysis of councils income from fees and charges in The Accounts Commission also expects to publish an audit of the use of ALEOs in early-2018, which may help to build a clearer picture of where fees and charges may be impacted by the presence of ALEOs. SPICe intend to update its "Local Government: facts and figures" series in the first half of 2018, which is likely to provide an update in this area of interest. SPICe and Audit Scotland intend to continue working collaboratively in this area, analyzing the LFR data when it becomes available and will look to work with colleagues in the Scottish Government to look in more detail at the variations of reported fees and charges income within individual councils to inform any future work in this area. 36
37 Annexe The following charts detail, for each council, the total income they have recorded from fees and charges from to (at prices) and which services have contributed to this. Note that the vertical axis scale varies between the different charts. SPICe are able to provide figures and source data for these charts on request. Aberdeen City 37
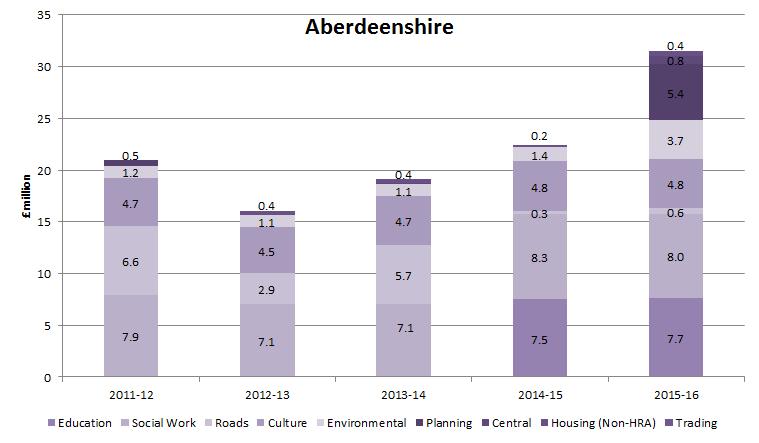
38 Aberdeenshire Angus 38

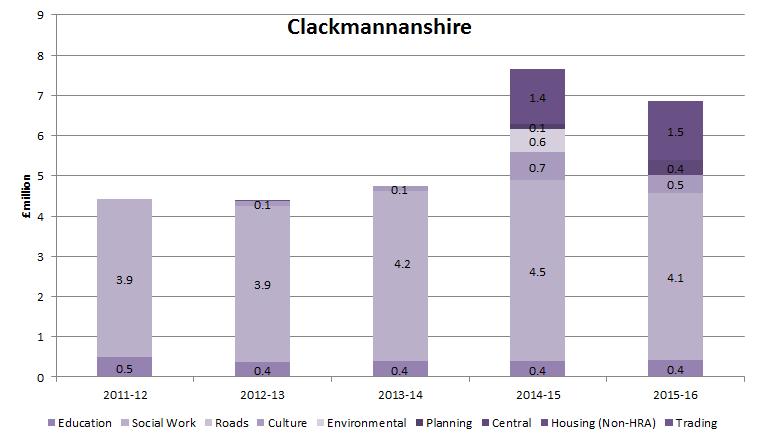
39 Argyll and Bute Clackmannanshire 39

40 Dumfries and Galloway Dundee 40

41 East Ayrshire East Dunbartonshire 41

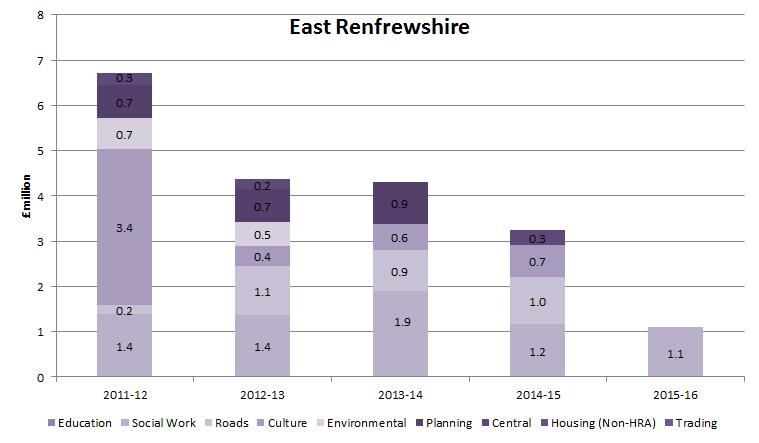
42 East Lothian East Renfrewshire 42

43 City of Edinburgh Eilean Siar 43

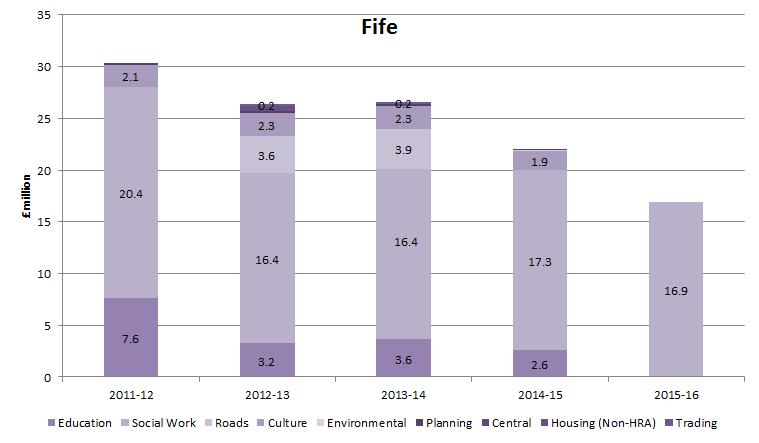
44 Falkirk Fife 44


45 Glasgow City Highland 45

46 Inverclyde Midlothian 46

47 Moray North Ayrshire 47

48 North Lanarkshire Orkney 48

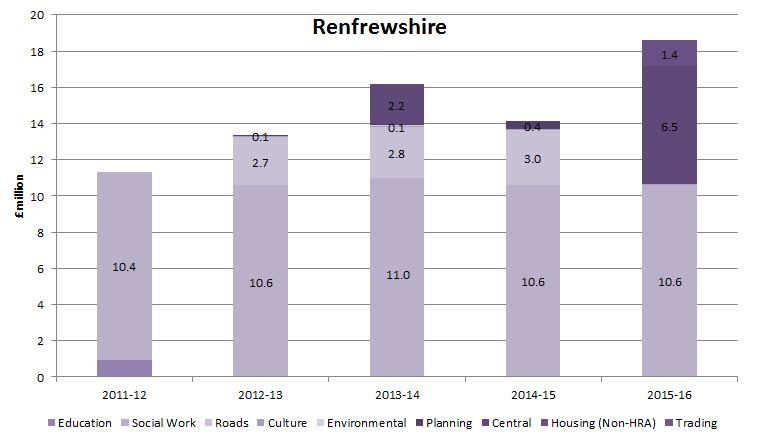
49 Perth and Kinross Renfrewshire 49

50 Scottish Borders Shetland 50

51 South Ayrshire South Lanarkshire 51

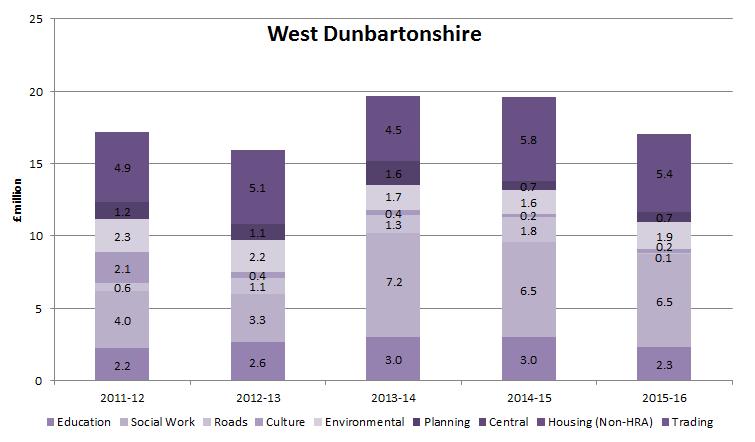
52 Stirling West Dunbartonshire 52

53 West Lothian 53
54 Bibliography 1 Burn-Murdoch, A. (2017, June 21). Local Government Finance: Facts and Figures to Retrieved from Report/2017/6/21/Local-Government-Finance--facts-and-figures to [accessed 20 November 2017] Accounts Commission. (2016, November 29). Local government in Scotland: Financial overview 2015/16. Retrieved from [accessed 13 June 2017] Scottish Parliament Local Government and Communities Committee. (2017, January 27). Report on the Scottish Government s Draft Budget Retrieved from [accessed 15 June 2017] Accounts Commission. (2013). Charging for services: are you getting it right?. Retrieved from nr_131031_hcw_charging_services.pdf [accessed 20 November 2017] Accounts Commission. (2017, March 7). Local government in Scotland: Performance and challenges Retrieved from [accessed 13 June 2017] Burn-Murdoch, A. (2017, June 21). Local Government Finance: Facts and Figures to Retrieved from Report/2017/6/21/Local-Government-Finance--facts-and-figures to [accessed 20 November 2017] Scottish Parliament Local Government and communities Committee. (2017, December). Official Report 14 December Retrieved from parliamentarybusiness/report.aspx?r=10697 [accessed 23 November 2017] Accounts Commission. (2017, November 28). Local government in Scotland: Financial overview 2016/17. Retrieved from [accessed 28 November 2017] Gannon, M., Campbell, A., Bailey, N., Hastings, A., Bramley, G., & Aiton, A. (2016, October 31). The social impact of the local government budget. Retrieved from SB_16-84_The_social_impact_of_the_ _local_government_budget.pdf [accessed 23 November 2017] Scottish Government. (2017, September 12). Local Financial Returns Guidance. Retrieved from ReturnLFR/LFR16-17Guidance [accessed 20 November 2017] CoSLA. (2017, November). Submission to the Local Government and Communities Committee: Fair Funding for Essential Services. Retrieved from S5_Local_Gov/Inquiries/ _Budget_COSLA.pdf [accessed 23 November 2017] 54
55 12 13 Scottish Government. (2014, November 3). Scottish Budget Draft Budget Retrieved from [accessed 23 November 2017] Scottish Government. (2016). Scottish Government Draft Budget Retrieved from [accessed 27 June 2017] 55
 Briefings are compiled for the benefit of the Members of the Parliament and their personal staff.")
56 Related Briefings SB 16/84 - The social impact of the local government budget SB 16/103 - Scottish Government Draft Budget SB 17/44 - Local Government Finance: Facts and Figures to Scottish Parliament Information Centre (SPICe) Briefings are compiled for the benefit of the Members of the Parliament and their personal staff. Authors are available to discuss the contents of these papers with MSPs and their staff who should contact Ailsa Burn-Murdoch on telephone number or ailsa.burn-murdoch@parliament.scot. Members of the public or external organisations may comment on this briefing by ing us at SPICe@parliament.scot. However, researchers are unable to enter into personal discussion in relation to SPICe Briefing Papers. If you have any general questions about the work of the Parliament you can the Parliament s Public Information Service at sp.info@parliament.scot. Every effort is made to ensure that the information contained in SPICe briefings is correct at the time of publication. Readers should be aware however that briefings are not necessarily updated or otherwise amended to reflect subsequent changes.
Local Government Finance: Draft Budget and provisional allocations to local authorities
 SPICe Briefing Pàipear-ullachaidh SPICe Local Government Finance: Draft Budget 2018-19 and provisional allocations to local authorities Ailsa Burn-Murdoch, Allan Campbell and Andrew Aiton This briefing
Local Government Finance: Facts and Figures, to
 SPICe Briefing Pàipear-ullachaidh SPICe Local Government Finance: Facts and Figures, 2010-11 to 2017-18 Ailsa Burn-Murdoch This briefing provides a range of factual information and analysis on local government
Local Government Finance: Budget and provisional allocations to local authorities
 SPICe Briefing Pàipear-ullachaidh SPICe Local Government Finance: Budget 2019-20 and provisional allocations to local authorities Ailsa Burn-Murdoch, Allan Campbell, Andrew Aiton and Kayleigh Finnigan
The social impact of the local government budget
 SPICe Briefing Pàipear-ullachaidh SPICe The social impact of the 2017-18 local government budget Maria Gannon, Ailsa Burn-Murdoch, Andrew Aiton, Nick Bailey, Glen Bramley, Allan Campbell, Kayleigh Finnigan,
Earnings in Scotland: 2017
 SPICe Briefing Pàipear-ullachaidh SPICe Earnings in Scotland: 2017 Andrew Aiton The Office for National Statistics released the Annual Survey of Hours and Earnings (ASHE) 2017 provisional results on 26
Scotland's Economic Performance. Tanya Wilson, University of Stirling
 Scotland's Economic Performance Summary: Tanya Wilson, University of Stirling This submission compares key labour market trends for Scotland and the UK over the past decade. Aggregate unemployment rates
FINANCE AND CONSTITUTION COMMITTEE AGENDA. 4th Meeting, 2019 (Session 5) Wednesday 6 February 2019
 Wednesday 6 February 2019") FCC/S5/19/4/A FINANCE AND CONSTITUTION COMMITTEE AGENDA 4th Meeting, 2019 (Session 5) Wednesday 6 February 2019 The Committee will meet at 10.00 am in the David Livingstone Room (CR6). 1. Budget (Scotland)
FCC/S5/19/4/A FINANCE AND CONSTITUTION COMMITTEE AGENDA 4th Meeting, 2019 (Session 5) Wednesday 6 February 2019 The Committee will meet at 10.00 am in the David Livingstone Room (CR6). 1. Budget (Scotland)
Self-directed Support, Scotland,
 Data under Development Self-directed Support, Scotland, 2015-16 Self-directed Support was introduced in Scotland on 1 st April 2014 following the Social Care (Self-directed Support) (Scotland) Act 2013.
Council Tax Debt and Data Sharing
 Council Tax Debt and Data Sharing 2 Council Tax Debt and Data Sharing Introduction The Improvement service (IS) 1, Step Change Debt Charity Scotland 2 and Citizens Advice Scotland 3 individually collect
Self-directed Support, Scotland,
 Data under Development Self-directed Support, Scotland, 2014-15 Executive Summary This Data under Development Statistics Release presents the latest client and expenditure figures for Self-directed Support
The impact of welfare reform on people in Scotland. Jamie MacDougall Head of Housing Support and Homelessness Scottish Government
 The impact of welfare reform on people in Scotland Jamie MacDougall Head of Housing Support and Homelessness Scottish Government Housing Benefit Changes Social Rented Sector Bedroom Tax Introduction of
Local Government finance: the Funding Formula and local taxation income
 SPICe Briefing Pàipear-ullachaidh SPICe Local Government finance: the Funding Formula and local taxation income Anouk Berthier, Ailsa Burn-Murdoch, Andrew Aiton and Kayleigh Finnigan This briefing provides
The Defence industry in Scotland. A report for GMB Scotland
 1 The Defence industry in Scotland A report for GMB Scotland July 2016 The place of useful learning The University of Strathclyde is a charitable body, registered in Scotland, number SC015263 Summary An
Briefing Allocating Discretionary Housing Payments (DHPs) in Scotland
 in Scotland") Briefing Allocating Discretionary Housing Payments (DHPs) in Scotland From the Shelter Scotland policy library (Reissued) November 2013. All rights reserved. This document is only for your personal, non-commercial
Briefing Allocating Discretionary Housing Payments (DHPs) in Scotland From the Shelter Scotland policy library (Reissued) November 2013. All rights reserved. This document is only for your personal, non-commercial
People Councils Economy
 People Councils Economy the An assessment of the impact of proposed changes to the UK Benefits System on people, councils and the economy in Scotland. September 2010 The Scottish Local Government Forum
Overview of the labour market
 Overview of the labour market Inevitably current interest in the Scottish labour market continues to focus on the trends in both employment and unemployment figures, a theme developed in other sections
Briefing on. Local Government Budgets
 LEGAL Briefing on Briefing number 197 February 2009 UPDATED WITH ACTUAL ALLOCATIONS Local Government Budgets Local Government Budgets Introduction The Scottish Government budget will be resolved quickly.
Overview of the Scottish labour market
 Overview of the Scottish labour market Comparable figures on the labour market 1 between Scotland and the United Kingdom in the second quarter of 2008 are summarised in Table 1. Labour Force Survey (LFS)
Modern Apprenticeship Statistics
 Modern Apprenticeship Statistics Up to the end of quarter 2, 2018/19 Published on 13 th November 2018 Version Published Amendment 1 13/11//2018 Original Publication Contents 1. Introduction... 3 2. Notes
Modern Apprenticeship Statistics
 Modern Apprenticeship Statistics Up to the end of quarter 1, 2018/19 Published on 14 th August 2018 Version Published Amendment 1 14/08/2018 Original Publication 1.1 29/08/2018 Amendment to footnote 2
Strathprints Institutional Repository
 Strathprints Institutional Repository Lockyer, Cliff (2012) Overview of the labour market [June 2012]. Commentary, 36 (1). pp. 43-49. ISSN 2046-5378 Fraser of Allander Economic Strathprints is designed
Home Energy Programmes Summary Report 2009/2013
 Home Energy Programmes Summary Report 2009/2013 1. Introduction to the Programmes The Scottish Government's Home Energy Programmes comprised the following four programmes which operated over the period
Strathprints Institutional Repository
 Strathprints Institutional Repository Allan, Grant (2008) Overview of the Scottish labour market [June 2008]. Economic Commentary, 32 (1). pp. 39-45. ISSN 2046-5378 Fraser of Allander Strathprints is designed
Targeting Anti-Social Behaviour
 Targeting Anti-Social Behaviour The Use of Anti-Social Behaviour Orders in Scotland Funded by The Scottish Executive SCOTTISH EXECUTIVE THE CHARTERED INSTITUTE OF HOUSING IN SCOTLAND The Chartered Institute
(2008) 2008]. 32 (2) ISSN
![(2008) 2008]. 32 (2) ISSN](/thumbs/79/79059428.jpg "(2008) 2008]. 32 (2) ISSN") Allan, Grant (2008) Overview of the Scottish labour market [November 2008]. Fraser of Allander Economic Commentary, 32 (2). pp. 34-40. ISSN 2046-5378, This version is available at https://strathprints.strath.ac.uk/46896/
Allan, Grant (2008) Overview of the Scottish labour market [November 2008]. Fraser of Allander Economic Commentary, 32 (2). pp. 34-40. ISSN 2046-5378, This version is available at https://strathprints.strath.ac.uk/46896/
Universal Credit January 2018
 Free Lone Parent Helpline 0808 801 0323 helpline@opfs.org.uk Universal Credit January 2018 This factsheet contains information on universal credit which was introduced in October 2013 to replace six of
Universal Credit April 2018
 Free Lone Parent Helpline 0808 801 0323 helpline@opfs.org.uk Universal Credit April 2018 This factsheet is for single parents who may be about to claim universal credit, are already getting it or who have
V1.0. Mental Health Officers Report 2017 A National Statistics Publication for Scotland
 Mental Health Officers Report 2017 A National Statistics Publication for Scotland Published 31 August 2018 Contents Executive summary... 4 1 Introduction... 5 1.1 2017 report... 5 2 MHO workforce overview...
Monitoring poverty and social exclusion in Scotland (2002)
") Monitoring poverty and social exclusion in Scotland (22) Using the latest available data, a report by the New Policy Institute contains an independent selection of indicators, maps and commentary that
Monitoring poverty and social exclusion in Scotland (22) Using the latest available data, a report by the New Policy Institute contains an independent selection of indicators, maps and commentary that
Employability Fund Statistics
 Employability Fund Statistics Starts up to the end of quarter 3 2017/18 (April 2017 December 2017) Outcomes and Outputs for a cohort of leavers (from April 2016 to March 2017) Published on 13 th February
Scotland Excel. Report by Director Scotland Excel. 25 March March 2019 (with the option of extension for up to two years up to 24 March 2021)
") Scotland Excel To: Executive Sub Committee On: 10 February 2016 Report by Director Scotland Excel Tender: Fostering and Continuing Care Services Schedule: 10/15 Period: 25 March 2017-24 March 2019 (with
Scotland Excel To: Executive Sub Committee On: 10 February 2016 Report by Director Scotland Excel Tender: Fostering and Continuing Care Services Schedule: 10/15 Period: 25 March 2017-24 March 2019 (with
Homelessness in Scotland 2014
 Homelessness in Scotland 2014 Getting behind the statistics January 2015 www.shelterscotland.org 2014 Shelter Scotland. All rights reserved. This document is only for your personal, non-commercial use.
Employability Fund Statistics
 Employability Fund Statistics Starts up to the end of quarter 1 2017/18 (April 2017 June 2017) Outcomes and Outputs for a cohort of leavers (from October 2015 to September 2016) Published on 1 st August
SCOTTISH HOMEOWNERS ARE BETTER OFF FOR MORTGAGE AFFORDABILITY
 NOT FOR BROADCAST OR PUBLICATION BEFORE 00.01 HRS FRIDAY 03 FEBRUARY 2017 SCOTTISH HOMEOWNERS ARE BETTER OFF FOR MORTGAGE AFFORDABILITY The Bank of Scotland Affordability Review tracks mortgage affordability
NOT FOR BROADCAST OR PUBLICATION UNTIL 00:01 HRS SATURDAY 27 TH AUGUST 2011 SCOTLAND HAS THE UK'S MOST AFFORDABLE HOUSING
 PRESS RELEASE The Bank of Scotland Affordability Review tracks housing affordability for all homebuyers in 382 local authority districts (including 31 Scottish local authorities) across the UK. The affordability
East Lothian Council budget
 East Lothian Council budget Every year the council agrees Council Tax charges and allocations of funding to council service areas for the 12 months ahead. Funding for council services is mainly provided
Employability Fund Statistics
 Employability Fund Statistics Starts up to the end of quarter 2 2017/18 (April 2017 September 2017) Outcomes and Outputs for a cohort of leavers (from January 2016 to December 2016) Published on 7 th November
Regional Skills Assessment Highlands and Islands Insight Report
 Regional Skills Assessment Highlands and Islands Insight Report 2 Contents 1 Introduction 3 The importance of skills planning in Scotland 4 Regional Skills Assessments and Skills Planning 5 National Skills
Contents. Audit Scotland. Acknowledgements. The Accounts Commission
 Contents Executive summary 1 Introduction 4 Overall progress 6 Reducing crime-related risks 12 to schools - a management challenge Conclusions and 22 recommendations Appendix 1 24 The Accounts Commission
Public sector employment in Scotland
 Public sector employment in Scotland Industrial action over proposals to change pension and related conditions continued in the public sector and widened with industrial action planned by the BMA. In 2008
A report for the CIH in Scotland by: newhaven. research. The Future for Social Renting in Scotland. Discussion Paper. Published with support from:
 A report for the CIH in Scotland by: newhaven research The Future for Social Renting in Scotland Discussion Paper Published with support from: The Chartered Institute of Housing in Scotland The Chartered
(Press Release 26th May 2016) Analysis of Inequality in the Scottish Labour Market, 2015
 Analysis of Inequality in the Scottish Labour Market, 2015") (Press Release 26th May 2016) Analysis of Inequality in the Scottish Labour Market, 2015 The Scottish Government this week published disaggregated labour market statistics for Scotland up to 2015, based
(Press Release 26th May 2016) Analysis of Inequality in the Scottish Labour Market, 2015 The Scottish Government this week published disaggregated labour market statistics for Scotland up to 2015, based
Social Security Experience Panels: About Your Benefits and You - Quantitative
 Research Findings 6/2017 Social Security Experience Panels: About Your Benefits and You - Quantitative Research Findings The Scottish Government will become responsible for some of the benefits currently
Social Focus on Urban Rural Scotland. A Scottish Executive National Statistics Publication SCOTTISH EXECUTIVE
 Social Focus on Urban Rural Scotland 2003 A Scottish Executive National Statistics Publication SCOTTISH EXECUTIVE Social Focus on Urban Rural Scotland 2003 A Scottish Executive National Statistics Publication
The Scottish Fire and Rescue Service EMBARGOED UNTIL HOURS THURSDAY 21 MAY 2015
 The Scottish Fire and Rescue Service EMBARGOED UNTIL 00.01 HOURS THURSDAY 21 MAY 2015 Prepared by Audit Scotland May 2015 Auditor General for Scotland The Auditor General s role is to: appoint auditors
Scotland. in the red. A research report prepared by StepChange Debt Charity
 Scotland in the red A research report prepared by StepChange Debt Charity Contents Introduction & key findings 1. Home nation debts 1.1 Debt by volume 2. The debt problem in Scotland 2.1 Average incomes
Regional Skills Assessment Stirling and Clackmannanshire City Region Deal Insight Report
 Regional Skills Assessment Stirling and Clackmannanshire City Region Deal Insight Report 2 Contents 1 Introduction 3 The importance of skills planning in Scotland 4 Regional Skills Assessments and Skills
Scotland s Councillors
 Scotland s Councillors 2017-2022 2 Scotland s Councillors 2017-2022 Contents Executive Summary 4 Key Findings 4 1. Introduction 7 1.1 Context 7 1.2 Response Rate 7 1.3 Political Affiliation 8 1.4 Council
Scotland's Population
 Scotland's Population The Registrar General's Annual Review of Demographic Trends 2017 163rd Edition Crown copyright and database right 2018. Ordnance Survey (OS Licence number 100020542). Annual Report
Carstairs Scores for Scottish Postcode Sectors, Datazones & Output Areas from the 2011 Census
 Carstairs Scores for Scottish Postcode Sectors, Datazones & Output Areas from the 2011 Census Denise Brown, Mirjam Allik, Ruth Dundas, Alastair H Leyland October 2014 www.glasgow.ac.uk/sphsu Executive
Scottish Government Draft 2010/11 Budget Proposals. Response to the call for evidence from the Health and Sport Committee
 Scottish Government Draft 2010/11 Budget Proposals Response to the call for evidence from the Health and Sport Committee The UNISON Scotland submission to the Scottish Parliament s Health and Sport Committee
DELEGATED POWERS AND LAW REFORM COMMITTEE
 DELEGATED POWERS AND LAW REFORM COMMITTEE This document contains the responses received to the letter dated 28 June 2018 seeking information from local authorities in regard to Council Tax and Business
Welfare Reform Committee. The Bedroom Tax in Scotland
 . Welfare Reform Committee 5 th Report, 2013 (Session 4) The Bedroom Tax in Scotland Published by the Scottish Parliament on 19 October 2013 SP Paper 409 Session 4 (2013) Parliamentary copyright. Scottish
Consultation by the Welfare Reform Committee
 Welfare Funds (Scotland) Bill Consultation by the Welfare Reform Committee 1. Are you in favour of the Bill and its provisions? Do you think the Bill fully achieves the Scottish Government s aim of providing
Home Energy Schemes ENERGY ASSISTANCE PACKAGE & HOME INSULATION SCHEME End year report. abcdefghijklmnopqrstu
 Home Energy Schemes 2009-10 ENERGY ASSISTANCE PACKAGE & HOME INSULATION SCHEME End year report abcdefghijklmnopqrstu ii Crown copyright 2010 Report compiled by: Fuel Poverty and Sustainable Housing Teams
No Deal Brexit Economic Implications for Scotland. Office of the Chief Economic Adviser, Scottish Government
 No Deal Brexit Economic Implications for Scotland Office of the Chief Economic Adviser, Scottish Government February 2019 Executive Summary This paper provides an illustration of the potential impact that
Notice of Meeting and Agenda Scotland Excel Joint Committee
 Notice of Meeting and Agenda Scotland Excel Joint Committee Date Time Venue Friday, 17 June 2016 10:45 City Chambers, Glasgow City Council, 80 George Square, Glasgow, G2 1DU KENNETH GRAHAM Head of Corporate
AFFORDABILITY: EXPENDITURE DRIVERS. No Control. Largely Fixed Commitments. Policy Commitments. Partial Control
 AFFORDABILITY This aspect of financial scrutiny centres on the requirement to balance the budget which means that expenditure should be no greater than revenues. The majority of Scottish Government revenue
Fair Funding for Essential Services
 Fair Funding for Essential Services We all need local government #essentialservices Local Government is Essential Local government is democratically elected and provides a breadth of essential services
A Guide to the UK Prosperity Index
 1 A Guide to the UK Prosperity Index The UK Prosperity Index is a comprehensive measure of prosperity across UK local authority areas. Prosperity broadly defined as wealth and wellbeing is a multi-dimensional
FINANCE COMMITTEE DEMOGRAPHIC CHANGE AND AGEING POPULATION SUBMISSION BY AUDIT SCOTLAND
 FINANCE COMMITTEE DEMOGRAPHIC CHANGE AND AGEING POPULATION SUBMISSION BY AUDIT SCOTLAND Introduction 1. Audit Scotland carries out the external audit of the majority of public sector bodies in Scotland.
INTRODUCTION. Economic Value of the Independent Museum Sector: Toolkit
 INTRODUCTION This toolkit provides AIM members with a straightforward approach to help museums in estimating the impact they might have on their local economy. The Toolkit was produced in 2010, and revised
CITY OF EDINBURGH COUNCIL KEY FACTS and FIGURES
 CITY OF EDINBURGH COUNCIL KEY FACTS and FIGURES 2 0 1 4-2 0 1 5 C O N T E N T S Page Introduction 2 2014-2015 Revenue Budget The Funding of the City Council Services 3 Summary of Charges to be Levied 4
Financial Monitoring Report for the 8 month period to 30 November 2007
 NHS GREATER GLASGOW AND CLYDE Board 22 January 2008 Paper No. 08/9 Director of Finance Financial Monitoring Report for the 8 month period to 30 November 2007 Introduction The attached report shows that
National Benchmarking Overview Report
 Children s Services Adult Social Care Culture and Leisure Local Government Benchmarking Framework Environmental Services National Benchmarking Overview Report 217-18 Corporate Services Housing Economic
MONITORING POVERTY AND SOCIAL EXCLUSION IN SCOTLAND 2015
 MONITORING POVERTY AND SOCIAL EXCLUSION IN SCOTLAND 2015 This study is the seventh in a series of reports monitoring poverty and social exclusion in Scotland since 2002. The analysis combines evidence
CHANGING GEOGRAPHY OF DEPRIVATION: DISCUSSION PAPER
 CHANGING GEOGRAPHY OF DEPRIVATION: DISCUSSION PAPER Discussion Paper 1. INTRODUCTION 1.1. This paper provides background information to one of a set of three seminars to be held in November and December
Scottish Living Wage Implications for Delegated Adult Social Work Budgets 2018/19. (Paper presented by Geoff Mark) For Approval
 For Approval") Integration Joint Board 5 th April 2018 This Report relates to Item 8 on the Agenda Scottish Living Wage Implications for Delegated Adult Social Work Budgets 2018/19 (Paper presented by Geoff Mark) For
Integration Joint Board 5 th April 2018 This Report relates to Item 8 on the Agenda Scottish Living Wage Implications for Delegated Adult Social Work Budgets 2018/19 (Paper presented by Geoff Mark) For
To provide SFC s accounts direction for Scotland s colleges. Principals / Finance Directors / Board Secretaries of Scotland s colleges
 Accounts direction for Scotland s colleges 2017-18 Issue date: Reference: Summary: FAO: Further information: 13 July 2018 SFC/GD/13/2018 To provide SFC s 2017-18 accounts direction for Scotland s colleges
Enviroment. Flood disadvantage in Scotland: mapping the potential losses in well-being
 Enviroment Flood disadvantage in Scotland: mapping the potential losses in well-being FLOOD DISADVANTAGE IN SCOTLAND: MAPPING THE POTENTIAL FOR LOSSES IN WELL-BEING Sarah Lindley and John O Neill University
Mid Year Business Update. November 2016
 Mid Year Business Update November 2016 Executive Summary 2015/16 was another year of significant growth, diversification and continued strong financial performance. Two new partner organisations, both
Accounts Advisory Committee
 Local Authority Scotland Accounts Advisory Committee Annual Report 2009/2010 Introduction In my final year as Chair of LASAAC it is my pleasure to introduce the 2009/10 LASAAC annual report. Throughout
Quarter Quarter Quarter Additional information / Action taken Non-Residential services commissioned and provided for
 Financial Monitoring 2017/18 General Fund Revenue Material s Appendix 2 Education, Communities and Economy Children s Services Reason for Additional information / Action taken Non-Residential services
Corporate Policy and Strategy Committee
 Minutes Corporate Policy and Strategy Committee 10.00 am, Tuesday, 16 April 2013 Present Councillors Burns (Convener), Cardownie (Vice-Convener), Burgess, Chapman, Child, Nick Cook, Godzik, Ricky Henderson,
Dundee City Poverty Profile
 Dundee City Poverty Profile Draft Copy Produced by: Tony Jenkins Senior Planning Officer (Information & Research) Information & Research Team Chief Executive Department Dundee City Council email: anthony.jenkins@dundeecity.gov.uk
DECEMBER 2006 INFORMING CHANGE. Monitoring poverty and social exclusion in Scotland 2006
 DECEMBER 2006 findings INFORMING CHANGE Monitoring poverty and social exclusion in Scotland 2006 The New Policy Institute has produced its 2006 edition of indicators of poverty and social exclusion in
SPICe Briefing European Union Funding in Scotland
 The Scottish Parliament and Scottish Parliament Infor mation C entre l ogos. SPICe Briefing European Union Funding in Scotland 2014-2020 Iain McIver and Simon Wakefield 7 November 2016 16/89 This briefing,
eresearch: the open access repository of the research output of Queen Margaret University, Edinburgh
 eresearch: the open access repository of the research output of Queen Margaret University, Edinburgh This is a publisher-formatted version of document published as: Kerley, Richard (2010) Cutting public
JESSICA Scotland Selection of Regeneration Urban Development Fund KB/VP 946
 JESSICA Scotland Selection of Regeneration Urban Development Fund KB/VP 946 Summary of Questions and s from JESSICA information event Thursday 16 December 2010 Further questions asked in writing by 10
CARE AND REPAIR FORUM SCOTLAND MINUTES OF BOARD MEETING HELD ON FRIDAY 2 DECEMBER 2011 AT ETCV, 16 ST. MARY S STREET, EDINBURGH, EH1 1SU
 CARE AND REPAIR FORUM SCOTLAND MINUTES OF BOARD MEETING HELD ON FRIDAY 2 DECEMBER 2011 AT ETCV, 16 ST. MARY S STREET, EDINBURGH, EH1 1SU Present: David Belfall, Chair Richard Grant, Vice Chair Gerry Power,
Creation of a Pan Scotland Local Authority Business Loan Fund Progress Update
 Cabinet Tuesday 22 November 2016 Item No 6.1 Creation of a Pan Scotland Local Authority Business Loan Fund Progress Update Report by Ian Johnson, Head of Communities and Economy 1 Purpose of Report 1.1
APPENDIX I: Corporate Risk Register
 APPENDIX I: Corporate Register The following risk register represents those risks in place at the time of reporting at Quarter 1, the mitigation strategies in place for each risk and the proposed treatment
Poverty and Income Inequality in Scotland: 2013/14 A National Statistics publication for Scotland
 Poverty and Income Inequality in Scotland: 2013/14 A National Statistics publication for Scotland EQUALITY, POVERTY AND SOCIAL SECURITY This publication presents annual estimates of the percentage and
CARE AND REPAIR FORUM SCOTLAND MINUTES OF BOARD MEETING HELD ON FRIDAY 1 JULY 2011 AT FESTIVAL THEATRE, 13 NICHOLSON STREET, EDINBURGH
 CARE AND REPAIR FORUM SCOTLAND MINUTES OF BOARD MEETING HELD ON FRIDAY 1 JULY 2011 AT FESTIVAL THEATRE, 13 NICHOLSON STREET, EDINBURGH Present: David Belfall, Chair Cllr Karen Clark, COSLA Gerry Power,
Supporting evidence for the North of Scotland Regional Clinical Strategy 1
 Supporting evidence for the North of Scotland Regional Clinical Strategy 1 North of Scotland demographics 1. Introduction This document describes the demographics of the North of Scotland and has been
Scottish Governments Spending Review 2012/15 and Draft budget 2012/13
 Briefing 11/61 November 2011 Scottish Governments Spending Review 2012/15 and Draft budget 2012/13 To: cc All Chief Executives, Main Contacts and Email Contacts (Scotland) All Chief Executives, Main Contacts
Previous Allowances Scheme
 Previous Allowances Scheme Part A - General Rules in relation to the Scheme Rule 1 - Interpretation Rule 2 - Verifiable Expenditure Rule 3 - The Allowances Code Rule 4 - Publication Rule 5 - Enforcement
Housing) Duncan Sharkey (Corporate Director Place) Michael Kelleher (Service Director Housing and Regeneration) Tel:
 Duncan Sharkey (Corporate Director Place) Michael Kelleher (Service Director Housing and Regeneration) Tel:") Wards Affected: All Wards ADDITIONAL ITEM CABINET 3 OCTOBER 2017 PROPOSED HOUSING AND REGENERATION RESTRUCTURE Responsible Cabinet Member: Report Sponsor: Author and contact: Councillor Long (Cabinet Member
Wards Affected: All Wards ADDITIONAL ITEM CABINET 3 OCTOBER 2017 PROPOSED HOUSING AND REGENERATION RESTRUCTURE Responsible Cabinet Member: Report Sponsor: Author and contact: Councillor Long (Cabinet Member
Light at the end of the fiscal tunnel? Scotland s public spending pressures
 Light at the end of the fiscal tunnel? Scotland s public spending pressures Light at the end of the fiscal tunnel? Foreword In our accompanying report, Light at the end of the fiscal tunnel?, we highlighted
Report on the Findings of the Information Commissioner s Office Annual Track Individuals. Final Report
 Report on the Findings of the Information Commissioner s Office Annual Track 2009 Individuals Final Report December 2009 Contents Page Foreword...3 1.0. Introduction...4 2.0 Research Aims and Objectives...4
The gender pay gap: facts and figures 2017
 SPICe Briefing Pàipear-ullachaidh SPICe The gender pay gap: facts and figures 2017 Andrew Aiton This briefing looks at the latest figures from the Annual Survey of Hours and Earnings (ASHE) from the Office
Board Meeting Paper No. 06/76 Tuesday 19 December 2006 FINANCE REPORT TO 30 SEPTEMBER 2006
 NHS GREATER GLASGOW AND CLYDE Board Meeting Paper No. 06/76 Tuesday 19 December 2006 DIRECTOR OF FINANCE FINANCE REPORT TO 30 SEPTEMBER 2006 Recommendation: The NHS Board is asked to note the Finance Monitoring
Communities and Local Government Committee. Reforming Local Authority Needs Assessment. Paper 1 Simplifying the Needs Assessment Formula
 LG FUTURES Communities and Local Government Committee Reforming Local Authority Needs Assessment Paper 1 Simplifying the Needs Assessment Formula October 2017 FINANCE WITH VISION LG Futures Ltd., Marlowe
YOUNG PEOPLE IN THE HIGHLANDS AND ISLANDS
 www.hie.co.uk YOUNG PEOPLE IN THE HIGHLANDS AND ISLANDS Socio-economic profile May 2014 YOUNG PEOPLE IN THE HIGHLANDS AND ISLANDS INTRODUCTION This report provides a socio-economic profile of young people
Reimbursement of Members Expenses Scheme
 Reimbursement of Members Expenses Scheme QUICK LINKS 1. General Rules 2. Accommodation 3. Staff Costs 4. Office Costs 5. Cost of Travel 6. Disability 7. Additional Expenses 8. Winding Up 9. Definitions
Delivering affordable housing in troubled times
 Delivering affordable housing in troubled times Scotland national report February 2011 Kenneth Gibb and Chris Leishman An assessment of alternative ways to fund new affordable housing in Scotland at a
(Appendix 6 provides a summary of the IJB s reserves at 30 th November 2017)
") To: Renfrewshire Integration Joint Board On: 26 January 2018 Report by: Chief Finance Officer Heading: Financial Report 1 April to 30 November 2017 1. Purpose 1.1 The purpose of this report is to advise
To: Renfrewshire Integration Joint Board On: 26 January 2018 Report by: Chief Finance Officer Heading: Financial Report 1 April to 30 November 2017 1. Purpose 1.1 The purpose of this report is to advise
Appendix 5. Capital Strategy. 1. Strategic Context
 Capital Strategy 1. Strategic Context Barnet Council is ambitious about the impact that capital investment plans will have on the borough over the next 10 to 20 years. This capital strategy sets out how
Dundee City Poverty Profile
 Dundee City Poverty Profile 2013 Produced by: Tony Jenkins Senior Planning Officer (Information & Research) Information & Research Team Chief Executive Department Dundee City Council email: anthony.jenkins@dundeecity.gov.uk
Land and Buildings Transaction Tax (Relief from Additional Amount) (Scotland) Bill
 (Scotland) Bill") SPICe Briefing Pàipear-ullachaidh SPICe Land and Buildings Transaction Tax (Relief from Additional Amount) (Scotland) Bill Ross Burnside The Land and Buildings Transaction Tax (Relief from Additional Amount)
SPICe Briefing Pàipear-ullachaidh SPICe Land and Buildings Transaction Tax (Relief from Additional Amount) (Scotland) Bill Ross Burnside The Land and Buildings Transaction Tax (Relief from Additional Amount)