The gender pay gap: facts and figures 2017
|
|
|
- Charla Lambert
- 5 years ago
- Views:
Transcription


 from the Office for")

1 SPICe Briefing Pàipear-ullachaidh SPICe The gender pay gap: facts and figures 2017 Andrew Aiton This briefing looks at the latest figures from the Annual Survey of Hours and Earnings (ASHE) from the Office for National Statistics. It provides a range of data looking at the gender pay gap. 7 March 2018 SB 18-19
2 Contents Executive Summary 3 Comparing pay by gender 4 How is the gender pay gap calculated? 5 How does women's pay compare to men's pay? 6 What is the pay gap for full-time pay? 6 What is the pay gap for all employees? 8 What is the pay gap for part-time pay? 10 How does women's part-time pay compare to men's full-time pay? 12 What does the mean pay gap look like? 13 How has the gender pay gap changed over time? 14 What is the pay gap by occupation? 15 What is the pay gap by industry? 18 What is the pay gap for the public and private sectors? 23 What is the pay gap by age? 24 How do the latest figures affect the National Indicator on the gender pay gap? 26 Bibliography 27 2
3 Executive Summary This briefing looks at the latest figures from the Annual Survey of Hours and Earnings (ASHE) 1 from the Office for National Statistics. It provides a range of data looking at the gender pay gap. Last June the Economy, Fair Work and Jobs committee published No Small Change: The Economic Potential of Closing the Gender Pay Gap. One of the main areas of discussion was around the use of statistics. This briefing takes into consideration some of the report's points, specifically the Committee's decision to use overall, full-time and part-time pay as more representative of the gender pay gap then full-time pay. This year's data show that: The gender pay gap for full-time workers in 2017, the main indicator for the gender pay gap used by the Scottish Government, was at 6.6%. This was a 0.3% point increase from The pay gap for all employees, full-time and part-time, was 16.1%. The pay gap for part-time employees was -5.1%, meaning women have higher parttime pay. The pay gap for all and full-time employees has seen little change since The "Skilled trade" occupations have the highest gender pay gap at 33.4% for all employees. "Managers, directors and senior officials" occupations have the highest median income for men, while for women it is "professional occupations" for all employees. The pay gap for all employees increases from 7.9% for the year old age group to 22.5% for the year old age group. The "Finance and Insurance" industry has the highest gender pay gap at 31.3% for all employees. 3

4 Comparing pay by gender Overall, women can expect to earn significantly less than men over their entire careers 2. This section looks at the key issues when comparing women's pay with men's. The gender pay gap is made up of a complex set of factors. The main issues to consider when comparing pay by gender are set out below in figure 1. Figure 1: Factors affecting the gender pay gap 4

5 How is the gender pay gap calculated? Figure 2: How the gender pay gap is calculated Men's and women's earnings are compared by looking at the difference between their earnings as a percentage of men's earnings, as set out in figure 2. This is known as the gender pay gap. To calculate the pay gap, the ONS uses median hourly pay excluding overtime, as it controls for men being more likely to work overtime. Using hourly pay also means it does not matter whether the individual is working full-time and part-time. Figure 3: Comparing mean and median ASHE provides both the mean and median values for earnings. The median is generally used to calculate the gender pay gap. The mean, or average, is calculated by adding together all the values within a data set and dividing the total by the number of values. This means that the mean result is susceptible to influence from outliers. The median is the middle value of a set of data and is therefore more representative of the typical value within a data set. Figure 3 compares the median and mean for a data set with a small number of outliers. Unless otherwise stated the median estimates have been used rather than mean. 5
6 How does women's pay compare to men's pay? Comparing pay for men and women is complex as there is no single measure which adequately represents the complex issues underlying differences between men's and women's pay. This section looks at the pay gap for: Full-time employees. All employees. Part-time employees. Women working part-time and men working full-time. The mean gender pay gap. What is the pay gap for full-time pay? The main indicator for the gender pay gap, used by the Scottish Government, is to compare hourly pay excluding overtime for full-time workers. Using full-time pay controls for the fact women are more likely to work part-time. 6
7 Full-time pay is highest in London for both men and women Figure 4: Full-time pay by gender for each nation and region of the UK Annual Survey of Hours and Earnings: 2017 provisional Median full-time pay for women in Scotland is higher than in the UK as a whole and is third highest of the nations and regions of the UK. By contrast, men's full-time pay is below the UK figure but is the highest outside London and the South East. Northern Ireland is the only area where women have a higher median pay than men, for full-time work. 7

8 The full-time gender pay gap in Scotland is below the UK overall Figure 5: Median full-time gender pay gap by nation and region of the UK Annual Survey of Hours and Earnings: 2017 provisional The full-time pay gap in Scotland is 6.6%, which is lower than the UK figure of 9.1%. Scotland has the third lowest gender pay gap for full-time employees of the Nations and Regions of the UK. What is the pay gap for all employees? The overall pay gap includes full and part-time workers. The larger pay gap for all employees shows the effect of the higher proportion of women who work part-time. 8
9 Overall pay is highest in London for both men and women Figure 6: Median pay for all employees gender pay gap by nation and region of the UK Annual Survey of Hours and Earnings: 2017 provisional Median pay for women in Scotland is higher than in the UK as a whole and is third highest of the nations and regions of the UK. By contrast men's pay is below the UK figure but is the highest outside London and the South East. 9

10 The gender pay gap for all employees in Scotland is below the UK overall Figure 7: Median gender pay gap for all employees by nation and region of the UK Annual Survey of Hours and Earnings: 2017 provisional The gender pay gap in Scotland in 2017 for all employees was 16.1%, which is lower than the UK figure of 18.4%. Scotland has the fourth lowest gender pay gap for all employees of the Nations and Regions of the UK. What is the pay gap for part-time pay? Women are more likely to be in part time employment than men, with 41% of women working part-time compared with 11% of men. Women account for 78% of Scottish parttime employment 10
11 Women in Scotland have the 3rd highest part-time pay of the nations and regions of the UK Figure 8: Median part-time gender pay gap by nation and region of the UK Annual Survey of Hours and Earnings: 2017 provisional Median part-time pay for both men and women in Scotland is above the UK average. Both men and women have the third highest part-time pay across the nations and regions of the UK. 11

12 The pay gap for part-time employees in Scotland is around the same as the UK overall Figure 9: Median part-time gender pay gap by nation and region of the UK Annual Survey of Hours and Earnings: 2017 provisional The part-time gender pay gap in Scotland is -5.3%, meaning women have a higher median pay than men for part-time work. The UK is at -5.1%. How does women's part-time pay compare to men's full-time pay? As women are more likely to work part-time and make up the majority of people in parttime employment, Close the gap suggests that it is relevant to compare women's part-time earnings to men's full-time earnings. The pay gap for women working part-time and men who work full-time is higher in the UK than in Scotland, 36.4% in the UK compared with 33.8% in Scotland. Table 1: Women's part-time earning compared to men's full-time earnings 2017 Men's full-time hourly pay ( ) Women's part-time hourly pay ( ) pay gap Scotland % UK % Annual Survey of Hours and Earnings: 2017 provisional 12

13 What does the mean pay gap look like? The pay gap based on median pay represents the pay difference for the typical workers' income. Those at the higher end of the pay distribution tend to be men, using mean pay for the pay gap shows the effect of this on the difference of men's and woman's pay. Table 2: Mean gender pay gaps for Scotland and the UK All Employees Full-time Part-time Men's full-time and women's part-time Scotland 15.2% 11.1% 3.8% 31.7% UK 17.4% 14.1% 5.2% 33.0% Annual Survey of Hours and Earnings: 2017 provisional The gender pay gap: facts and figures , SB Figure 10: Comparison of the Median and Mean gender pay gaps in Scotland Annual Survey of Hours and Earnings: 2017 provisional Figure 10 shows that when comparing the mean and median pay gaps there is little difference between the figures for all employees and the comparison of full-time men to part-time women. Differences can be seen in the comparison of the full-time and part-time mean and median pay gaps: The larger gap for mean full-time pay can be explained by the larger number of men who work full-time and in higher paid roles. The mean pay gap for part-time pay is 3.8% despite the median pay gap showing woman having higher pay by 5.3%. One potential reason for this is that although women make up the majority of part-time workers, men are more likely to work in more senior, higher paid roles. Therefore a small number of high earning men who work part-time can have a large impact on the mean pay gap. 13
14 How has the gender pay gap changed over time? The Scottish Government advises that it is best to look at the change in the gender pay gap over time because of uncertainties with the statistical significance of annual changes 3. The gender pay gap for all employees and full-time employees has remained unchanged since 2011 Figure 11: gender pay gap for all and full-time employees in Scotland to 2017 Scottish Government Since 1997 the gender pay gap for all employees has fallen by 12 percentage points, and by 10 percentage points for full-time employees. However since 2011 there has been little or no change in the gender pay gap for both full-time and all employees. It should be noted that yellow lines represent discontinuities in 2004, 2006 and 2011 ASHE estimates due to changes in the way the data was captured. 14
 from the ONS shows that women dominate the \"Administration & secretarial\", \"Caring, leisure & other service\" and \"Sales &")
15 What is the pay gap by occupation? When looking at the gender pay gap by occupation it is important to understand the gender breakdown of different occupation groups. The latest data from the Annual Population Survey (Jul 2016-Jun 2017) from the ONS shows that women dominate the "Administration & secretarial", "Caring, leisure & other service" and "Sales & customers services" occupations, which tend to be lower skilled and lower paid. However it is worth pointing out that there is a slightly higher proportion of women working in the professional occupations in Scotland. Figure 12: gender breakdown of major occupation groups in Scotland - Jul 2016-Jun 2017 Annual Population Survey via nomis When looking at pay for all employees by occupation, it shows that median pay for men is higher than for women in all occupations. While the "Managers, directors and senior officials" occupations have the highest pay for men, it is the "professional" occupations where women have the highest median income. 15
16 For men, "Managers, directors and senior officials" is the highest paid occupation group, for women "professional occupations" is the highest paid occupation group Figure 13: pay by occupation and gender in Scotland ASHE: Table 3 - Region by Occupation (2 digit SOC) In Scotland in 2017 "Skilled trades" had the largest gender pay gap for all employees at 33.4%. "Caring, leisure & other service" had the smallest gender pay gap at 4.9%. 16

17 "Skilled trades" has the highest gender pay gap in Scotland Figure 14: Median gender pay gap by occupation ASHE: Table 3 - Region by Occupation (2 digit SOC) 17
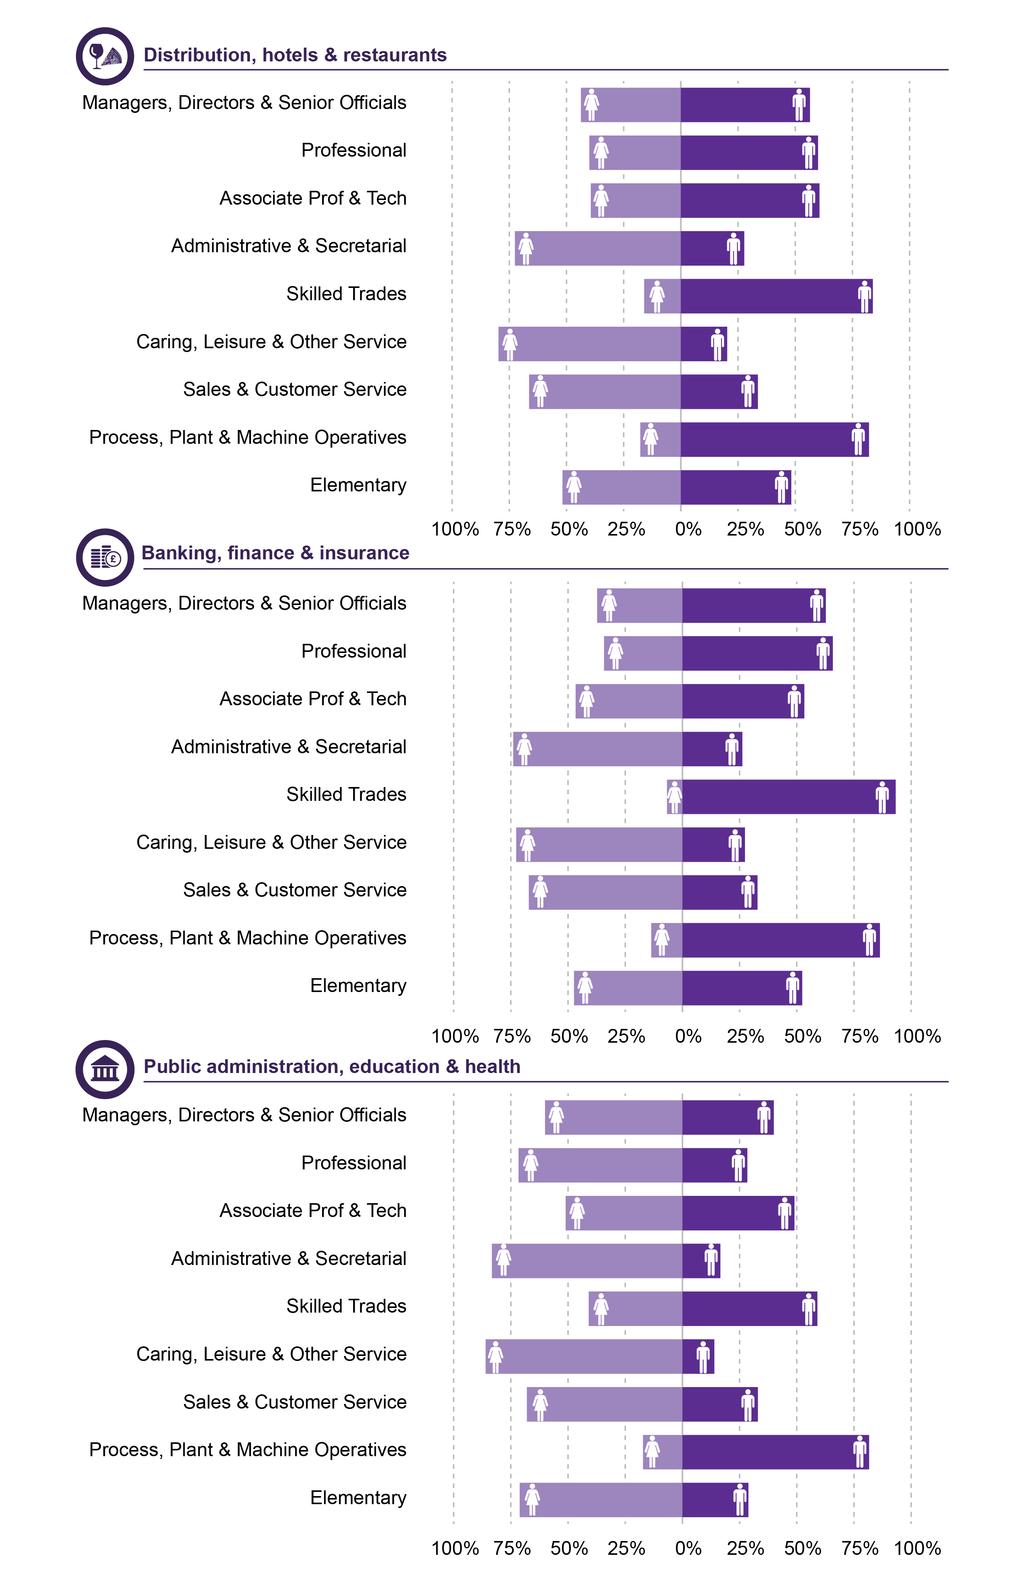
18 What is the pay gap by industry? When looking at the gender pay gap by industry it is important to understand the gender breakdown of the occupations within the industries. Figure 15 shows the gender breakdown of the occupations within the broad industries: "Distribution, hotels & restaurants", "Banking, finance & insurance" and "Public admin education & health". When comparing these industries to the overall Scotland figure it shows that are are some significant deviations, for example: In "Public admin, education & health" there is a higher proportion of women who are in the "Managers, directors & senior officials" occupation group than men. There is also a significantly higher proportion of women working in "skilled trades" and "elementary" occupations than the Scottish average. in both the "Distribution, hotels & restaurants" and "Banking finance & insurance" industries, there is a higher proportion of men in "professional" occupations than women, which is the opposite to the Scottish average. 18
19 Figure 15: gender breakdown of major occupation groups by selected industries in Scotland - Jul 2016-Jun
20 20
21 Annual Population Survey via nomis When looking at pay for all employees by industry, it shows that median pay for men is higher than for women in all industries. "Mining and quarrying" has the highest pay for both men and women while "accommodation and food services" have the lowest pay for both. Figure 16: pay by industry and gender in Scotland ASHE: Table 5 - Region by Industry (2 digit SIC) The industry in Scotland with the highest gender pay gap for all employees in 2017 was "Finance and insurance activities". "Mining and quarrying" had the lowest gap but is the highest paid industry. "Accommodation and food" services had the second lowest gender pay gap, but is the lowest paid industry for both genders, with each having median pay below the real living wage at the time of the survey. 21
 22")
22 Figure 17: Median gender pay gap by industry ASHE: Table 5 - Region by Industry (2 digit SIC) 22
23 What is the pay gap for the public and private sectors? Comparing public and private sector pay is a complex issue, due to the different jobs and characteristics of the people within each sector 4. One of the key points to consider when comparing pay by gender between the public and private sectors is occupational differences. The public sector has a higher proportion of high skilled jobs than the private sector 5. Another issue to consider is that the public sector has a higher proportion of people working in large organisations (those with at least 500 employees) which tend to pay higher wages. Workers in the public sector have a higher median income than the private sector. While men are more likely to be working in the higher paid professional jobs in the private sector, for example Science, Technology, Engineering and Maths (STEM) occupations, women are more likely to be found in the low paid jobs, such as cleaning and catering. However, there is a higher proportion of women working in professional jobs in the public sector such as nursing and teaching. Table 3: pay by gender and pay gap for all employees in the public and private sectors in Scotland Men Women pay gap Scotland % Public sector % Private sector % Non-profit body or mutual association % ASHE: Table 25 - Region by Public and Private Sector 23

24 What is the pay gap by age? When looking at the gender pay gap by age the main point to consider is the motherhood pay penalty 6. This refers to the period where women tend to either take time out of work or switch to part-time employment due to care commitments, for children and/or elderly relatives. This results in a fall in women's full-time earnings. A report from the ONS suggests that full-time earnings for women stops growing by age 45 while men's stops at age 48. By the time women's wages have stopped growing they have increased by 50% from the age 16, while men's will have grown by 66% by the time their wages stop growing 7. This section compares hourly pay excluding overtime as women are more likely to work part-time. This is especially true when breaking down pay by ages. Figure 18 shows the breakdown of those working part-time and full-time by age and gender. The 22 to 29 age group has the highest proportion of women working full-time. Between the 22 to 29 and 30 to 39 age groups there is a large increase in the proportion of woman working part-time. The age group has the highest proportion of men working part-time, this is likely because they will be in higher or further education. For women, the 60+ age group has the highest proportion of individuals working parttime. At all age groups women are more likely to work part-time than men Figure 18: Proportion of people in full-time and part-time employment by gender and age in Scotland 2015 SPICe analysis of the Annual Population Survey When looking at the pay for all employees by age, the year old age group is the only group where women earn more. 24

25 Table 4: pay by gender and age in Scotland Women Scotland Age Age Age Age Age Apart from the year old age group, the age group has the lowest gender pay gap at 7.9%. The pay gap then increases to 22.5% for year olds and sees little change for year olds. This is most likely because women are more likely to take on caring responsibilities, for children or elderly relatives. The pay gap increases significantly for those aged over 40 Figure 19: Median gender pay gap by age in Scotland Men Annual Survey of Hours and Earnings (ASHE) WGOR by age from 1999 to 2017 provisional 25
26 How do the latest figures affect the National Indicator on the gender pay gap? Scotland Performs is the Scottish Government's tool for reporting on how the country is performing. It does this by measuring performance against a number of Performance Targets and National Indicators. One of the Indicators in Scotland Performs is: Reduce the pay gap The Government specifies that a decrease of 1.5 percentage points or more suggests that the position is improving an increase of 1.5 percentage points or more suggests the position is worsening. As there was an increase of 0.3 percentage points between 2016 and 2017 this indicator is maintaining performance. This indicator focuses on full-time pay. However, in the their report on the gender pay gap No Small Change: The Economic Potential of Closing the Gender Pay Gap the Economy, Fair Work and Jobs committee recommended: That the Scottish Government changes the way it measures and reports the gender pay gap in its National Performance Framework (NPF), to take into account part-time workers in Scotland. The Government responded to the recommendation as follows The measure chosen matches the headline measure used by the Scottish Government, and the measure used by the Office for National Statistics for the UK and so allows comparison and provides consistency. However, additional information will be provided on Scotland Performs to show the position for part-time workers The Scottish Government now publish data on the pay gap for all employees alongside the data on the full-time pay gap. 26
27 Bibliography 1 Office for National Statistics. (2017, October 26). Annual Survey of Hours and Earnings: 2017 provisional and 2016 revised results. Retrieved from employmentandlabourmarket/peopleinwork/earningsandworkinghours/bulletins/ annualsurveyofhoursandearnings/2017provisionaland2016revisedresults [accessed January 2018] Fawcett Society. (n.d.) What is the Gender Pay Gap?. Retrieved from [accessed 15 February 2018] Scottish Government. (2016, June). New Perspectives on the Gender Pay Gap: Trends and Drivers. Retrieved from [accessed 20 January 2018] Office for National Statistics. (2014, November 19). Public and Private Sector Earnings - November Retrieved from / [accessed 8 February 2018] Office for National Statistics. (2014, November 19). Public and Private Sector Earnings - November Retrieved from / [accessed 01 November 2017] Trades Union Congress. (2016, March). The Motherhood Pay Penalty. Retrieved from [accessed 15 February 2018] Office for National Statistics. (17, January 2018). Understanding the gender pay gap in the UK. Retrieved from earningsandworkinghours/articles/understandingthegenderpaygapintheuk/ #modelling-the-factors-that-affect-pay [accessed 15 February 2018] 27

28 Scottish Parliament Information Centre (SPICe) Briefings are compiled for the benefit of the Members of the Parliament and their personal staff. Authors are available to discuss the contents of these papers with MSPs and their staff who should contact Andrew Aiton on telephone number or Members of the public or external organisations may comment on this briefing by ing us at However, researchers are unable to enter into personal discussion in relation to SPICe Briefing Papers. If you have any general questions about the work of the Parliament you can the Parliament s Public Information Service at sp.info@parliament.scot. Every effort is made to ensure that the information contained in SPICe briefings is correct at the time of publication. Readers should be aware however that briefings are not necessarily updated or otherwise amended to reflect subsequent changes.
Earnings in Scotland: 2017
 SPICe Briefing Pàipear-ullachaidh SPICe Earnings in Scotland: 2017 Andrew Aiton The Office for National Statistics released the Annual Survey of Hours and Earnings (ASHE) 2017 provisional results on 26
How is the Scottish Economy performing? 1st Quarter 2017
 SPICe Briefing Pàipear-ullachaidh SPICe How is the Scottish Economy performing? 1st Quarter 2017 Anouk Berthier This briefing summarises the latest GDP release from the Scottish Government: Scotland Gross
Financial Scrutiny Unit Briefing Earnings in Scotland 2013
 The Scottish Parliament and Scottish Parliament Infor mation C entre l ogos. Financial Scrutiny Unit Briefing Earnings in Scotland 2013 Andrew Aiton 8 January 2014 The Office for National Statistics released
How is the Scottish economy performing?2nd Quarter 2017
 SPICe Briefing Pàipear-ullachaidh SPICe How is the Scottish economy performing?2nd Quarter 2017 Anouk Berthier This briefing summarises the latest GDP release from the Scottish Government: Scotland Gross
Scotland's Exports
 SPICe Briefing Pàipear-ullachaidh SPICe Scotland's Exports - 2016 Andrew Aiton This briefing analyses the Export Statistics Scotland 2016 release from the Scottish Government, providing a breakdown of
Edinburgh Bakers' Widows' Fund Bill
 SPICe Briefing Pàipear-ullachaidh SPICe Edinburgh Bakers' Widows' Fund Bill Abigail Bremner The Edinburgh Bakers' Widows' Fund Bill is a private bill, promoted by the trustees of the Fund. It would dissolve
Scottish Parliament Gender Pay Gap Report
 2017 Scottish Parliament Gender Pay Gap Report Published in Scotland by the Scottish Parliamentary Corporate Body. For information on the Scottish Parliament contact Public Information on: Telephone: 0131
Patterns of Pay: results of the Annual Survey of Hours and Earnings
 Patterns of Pay: results of the Annual Survey of Hours and Earnings 1997-2007 By Hywel Daniels, Employment, Earnings and Innovation Division, Office for National Statistics Key points In April 2007 median
Women s pay and employment update: a public/private sector comparison
 Women s pay and employment update: a public/private sector comparison Report for Women s Conference 01 Women s pay and employment update: a public/private sector comparison Women s employment has been
UK Autumn Budget impact on Scotland
 SPICe Briefing Pàipear-ullachaidh SPICe UK Autumn Budget 2017 - impact on Scotland Ross Burnside The UK Government's Autumn Budget 2017 was published on 22 November. This briefing summarises some of the
4 Scottish labour market
 4 Scottish labour market Andrew Ross, Fraser of Allander Institute This section provides an overview of key labour market data in Scotland and contrasts these with both UK performance and changes over
Land and Buildings Transaction Tax (Relief from Additional Amount) (Scotland) Bill
 (Scotland) Bill") SPICe Briefing Pàipear-ullachaidh SPICe Land and Buildings Transaction Tax (Relief from Additional Amount) (Scotland) Bill Ross Burnside The Land and Buildings Transaction Tax (Relief from Additional Amount)
SPICe Briefing Pàipear-ullachaidh SPICe Land and Buildings Transaction Tax (Relief from Additional Amount) (Scotland) Bill Ross Burnside The Land and Buildings Transaction Tax (Relief from Additional Amount)
Great Britain (Numbers) All People 564,600 5,860,700 64,169,400 Males 279,200 2,904,300 31,661,600 Females 285,400 2,956,400 32,507,800
 All People 564,600 5,860,700 64,169,400 Males 279,200 2,904,300 31,661,600 Females 285,400 2,956,400 32,507,800") Labour Market Profile - The profile brings together data from several sources. Details about these and related terminology are given in the definitions section. Resident Population Total population (2017)
Labour Market Profile - The profile brings together data from several sources. Details about these and related terminology are given in the definitions section. Resident Population Total population (2017)
West Midlands (Met County) (Numbers)
 (Numbers)") Labour Market Profile - The profile brings together data from several sources. Details about these and related terminology are given in the definitions section. Resident Population Total population (2017)
Labour Market Profile - The profile brings together data from several sources. Details about these and related terminology are given in the definitions section. Resident Population Total population (2017)
York, North Yorkshire And East Riding (Numbers)
") Labour Market Profile - The profile brings together data from several sources. Details about these and related terminology are given in the definitions section. Resident Population Total population (2017)
Labour Market Profile - The profile brings together data from several sources. Details about these and related terminology are given in the definitions section. Resident Population Total population (2017)
Local Government Finance: Draft Budget and provisional allocations to local authorities
 SPICe Briefing Pàipear-ullachaidh SPICe Local Government Finance: Draft Budget 2018-19 and provisional allocations to local authorities Ailsa Burn-Murdoch, Allan Campbell and Andrew Aiton This briefing
Local Government Finance: Budget and provisional allocations to local authorities
 SPICe Briefing Pàipear-ullachaidh SPICe Local Government Finance: Budget 2019-20 and provisional allocations to local authorities Ailsa Burn-Murdoch, Allan Campbell, Andrew Aiton and Kayleigh Finnigan
Great Britain (Numbers) All People 836,300 8,947,900 63,258,400 Males 405,700 4,404,400 31,165,300 Females 430,500 4,543,500 32,093,100
 All People 836,300 8,947,900 63,258,400 Males 405,700 4,404,400 31,165,300 Females 430,500 4,543,500 32,093,100") Labour Market Profile - The profile brings together data from several sources. Details about these and related terminology are given in the definitions section. Resident Population Total population (2015)
Labour Market Profile - The profile brings together data from several sources. Details about these and related terminology are given in the definitions section. Resident Population Total population (2015)
Great Britain (Numbers) All People 138,500 6,168,400 64,169,400 Males 69,400 3,040,300 31,661,600 Females 69,000 3,128,100 32,507,800
 All People 138,500 6,168,400 64,169,400 Males 69,400 3,040,300 31,661,600 Females 69,000 3,128,100 32,507,800") Labour Market Profile - The profile brings together data from several sources. Details about these and related terminology are given in the definitions section. Resident Population Total population (2017)
Labour Market Profile - The profile brings together data from several sources. Details about these and related terminology are given in the definitions section. Resident Population Total population (2017)
4 Scottish labour market
 4 Scottish labour market Andrew Ross, Fraser of Allander Institute This section provides an overview of key labour market data in Scotland and contrasts these with both UK performance and changes over
Great Britain (Numbers) All People 497,900 7,219,600 63,785,900 Males 245,600 3,560,900 31,462,500 Females 252,300 3,658,700 32,323,500
 All People 497,900 7,219,600 63,785,900 Males 245,600 3,560,900 31,462,500 Females 252,300 3,658,700 32,323,500") Labour Market Profile - The profile brings together data from several sources. Details about these and related terminology are given in the definitions section. Resident Population Total population (2016)
Labour Market Profile - The profile brings together data from several sources. Details about these and related terminology are given in the definitions section. Resident Population Total population (2016)
Great Britain (Numbers) All People 623,100 5,516,000 63,785,900 Males 305,300 2,711,600 31,462,500 Females 317,900 2,804,400 32,323,500
 All People 623,100 5,516,000 63,785,900 Males 305,300 2,711,600 31,462,500 Females 317,900 2,804,400 32,323,500") Labour Market Profile - Gloucestershire The profile brings together data from several sources. Details about these and related terminology are given in the definitions section. Resident Population Total
Labour Market Profile - Gloucestershire The profile brings together data from several sources. Details about these and related terminology are given in the definitions section. Resident Population Total
Coventry And Warwickshire (Numbers) All People 909,700 5,800,700 63,785,900 Males 453,500 2,872,600 31,462,500 Females 456,200 2,928,100 32,323,500
 All People 909,700 5,800,700 63,785,900 Males 453,500 2,872,600 31,462,500 Females 456,200 2,928,100 32,323,500") Labour Market Profile - The profile brings together data from several sources. Details about these and related terminology are given in the definitions section. Resident Population Total population (2016)
Labour Market Profile - The profile brings together data from several sources. Details about these and related terminology are given in the definitions section. Resident Population Total population (2016)
Nottingham And Nottingham And. All People 2,178,000 4,724,400 63,785,900 Males 1,077,300 2,335,000 31,462,500 Females 1,100,700 2,389,400 32,323,500
 Labour Market Profile - Derbyshire, Nottingham And Nottinghamshire The profile brings together data from several sources. Details about these and related terminology are given in the definitions section.
Great Britain (Numbers) All People 186,600 6,130,500 63,785,900 Males 92,600 3,021,700 31,462,500 Females 94,000 3,108,900 32,323,500
 All People 186,600 6,130,500 63,785,900 Males 92,600 3,021,700 31,462,500 Females 94,000 3,108,900 32,323,500") Labour Market Profile - The profile brings together data from several sources. Details about these and related terminology are given in the definitions section. Resident Population Total population (2016)
Labour Market Profile - The profile brings together data from several sources. Details about these and related terminology are given in the definitions section. Resident Population Total population (2016)
Great Britain (Numbers) All People 267,500 9,080,800 64,169,400 Males 132,500 4,474,400 31,661,600 Females 135,000 4,606,400 32,507,800
 All People 267,500 9,080,800 64,169,400 Males 132,500 4,474,400 31,661,600 Females 135,000 4,606,400 32,507,800") Labour Market Profile - The profile brings together data from several sources. Details about these and related terminology are given in the definitions section. Resident Population Total population (2017)
Labour Market Profile - The profile brings together data from several sources. Details about these and related terminology are given in the definitions section. Resident Population Total population (2017)
Great Britain (Numbers) All People 325,300 4,724,400 63,785,900 Males 164,500 2,335,000 31,462,500 Females 160,800 2,389,400 32,323,500
 All People 325,300 4,724,400 63,785,900 Males 164,500 2,335,000 31,462,500 Females 160,800 2,389,400 32,323,500") Labour Market Profile - The profile brings together data from several sources. Details about these and related terminology are given in the definitions section. Resident Population Total population (2016)
Labour Market Profile - The profile brings together data from several sources. Details about these and related terminology are given in the definitions section. Resident Population Total population (2016)
Great Britain (Numbers) All People 49,600 5,559,300 64,169,400 Males 24,000 2,734,200 31,661,600 Females 25,700 2,825,100 32,507,800
 All People 49,600 5,559,300 64,169,400 Males 24,000 2,734,200 31,661,600 Females 25,700 2,825,100 32,507,800") Labour Market Profile - The profile brings together data from several sources. Details about these and related terminology are given in the definitions section. Resident Population Total population (2017)
Labour Market Profile - The profile brings together data from several sources. Details about these and related terminology are given in the definitions section. Resident Population Total population (2017)
Great Britain (Numbers) All People 140,700 9,026,300 63,785,900 Males 68,100 4,447,200 31,462,500 Females 72,600 4,579,100 32,323,500
 All People 140,700 9,026,300 63,785,900 Males 68,100 4,447,200 31,462,500 Females 72,600 4,579,100 32,323,500") Labour Market Profile - The profile brings together data from several sources. Details about these and related terminology are given in the definitions section. Resident Population Total population (2016)
Labour Market Profile - The profile brings together data from several sources. Details about these and related terminology are given in the definitions section. Resident Population Total population (2016)
All People 280,000 6,168,400 64,169,400 Males 138,200 3,040,300 31,661,600 Females 141,800 3,128,100 32,507,800. Central Bedfordshire (Numbers)
") Labour Market Profile - The profile brings together data from several sources. Details about these and related terminology are given in the definitions section. Resident Population Total population (2017)
Labour Market Profile - The profile brings together data from several sources. Details about these and related terminology are given in the definitions section. Resident Population Total population (2017)
Great Britain (Numbers) All People 7,700 8,825,000 64,169,400 Males 4,200 4,398,800 31,661,600 Females 3,500 4,426,200 32,507,800
 All People 7,700 8,825,000 64,169,400 Males 4,200 4,398,800 31,661,600 Females 3,500 4,426,200 32,507,800") Labour Market Profile - The profile brings together data from several sources. Details about these and related terminology are given in the definitions section. Resident Population Total population (2017)
Labour Market Profile - The profile brings together data from several sources. Details about these and related terminology are given in the definitions section. Resident Population Total population (2017)
Great Britain (Numbers) All People 348,000 8,825,000 64,169,400 Males 184,000 4,398,800 31,661,600 Females 164,000 4,426,200 32,507,800
 All People 348,000 8,825,000 64,169,400 Males 184,000 4,398,800 31,661,600 Females 164,000 4,426,200 32,507,800") Labour Market Profile - The profile brings together data from several sources. Details about these and related terminology are given in the definitions section. Resident Population Total population (2017)
Labour Market Profile - The profile brings together data from several sources. Details about these and related terminology are given in the definitions section. Resident Population Total population (2017)
All People 175,800 5,860,700 64,169,400 Males 87,400 2,904,300 31,661,600 Females 88,400 2,956,400 32,507,800. Telford And Wrekin (Numbers)
") Labour Market Profile - The profile brings together data from several sources. Details about these and related terminology are given in the definitions section. Resident Population Total population (2017)
Labour Market Profile - The profile brings together data from several sources. Details about these and related terminology are given in the definitions section. Resident Population Total population (2017)
Brighton And Hove (Numbers) All People 288,200 9,080,800 64,169,400 Males 144,800 4,474,400 31,661,600 Females 143,400 4,606,400 32,507,800
 All People 288,200 9,080,800 64,169,400 Males 144,800 4,474,400 31,661,600 Females 143,400 4,606,400 32,507,800") Labour Market Profile - The profile brings together data from several sources. Details about these and related terminology are given in the definitions section. Resident Population Total population (2017)
Labour Market Profile - The profile brings together data from several sources. Details about these and related terminology are given in the definitions section. Resident Population Total population (2017)
Hammersmith And Fulham (Numbers) All People 183,000 8,825,000 64,169,400 Males 90,400 4,398,800 31,661,600 Females 92,600 4,426,200 32,507,800
 All People 183,000 8,825,000 64,169,400 Males 90,400 4,398,800 31,661,600 Females 92,600 4,426,200 32,507,800") Labour Market Profile - The profile brings together data from several sources. Details about these and related terminology are given in the definitions section. Resident Population Total population (2017)
Labour Market Profile - The profile brings together data from several sources. Details about these and related terminology are given in the definitions section. Resident Population Total population (2017)
All People 23,100 5,424,800 64,169,400 Males 11,700 2,640,300 31,661,600 Females 11,300 2,784,500 32,507,800. Shetland Islands (Numbers)
") Labour Market Profile - The profile brings together data from several sources. Details about these and related terminology are given in the definitions section. Resident Population Total population (2017)
Labour Market Profile - The profile brings together data from several sources. Details about these and related terminology are given in the definitions section. Resident Population Total population (2017)
West Yorkshire (Met County) (Numbers)
 (Numbers)") Labour Market Profile - The profile brings together data from several sources. Details about these and related terminology are given in the definitions section. Resident Population Total population (2017)
Labour Market Profile - The profile brings together data from several sources. Details about these and related terminology are given in the definitions section. Resident Population Total population (2017)
Great Britain (Numbers) All People 1,180,900 6,168,400 64,169,400 Males 578,500 3,040,300 31,661,600 Females 602,500 3,128,100 32,507,800
 All People 1,180,900 6,168,400 64,169,400 Males 578,500 3,040,300 31,661,600 Females 602,500 3,128,100 32,507,800") Labour Market Profile - The profile brings together data from several sources. Details about these and related terminology are given in the definitions section. Resident Population Total population (2017)
Labour Market Profile - The profile brings together data from several sources. Details about these and related terminology are given in the definitions section. Resident Population Total population (2017)
Cornwall And Isles Of Scilly (Numbers)
") Labour Market Profile - The profile brings together data from several sources. Details about these and related terminology are given in the definitions section. Resident Population Total population (2017)
Labour Market Profile - The profile brings together data from several sources. Details about these and related terminology are given in the definitions section. Resident Population Total population (2017)
Stoke-On- Trent And Staffordshire (Numbers)
") Labour Market Profile - The profile brings together data from several sources. Details about these and related terminology are given in the definitions section. Resident Population Total population (2017)
Labour Market Profile - The profile brings together data from several sources. Details about these and related terminology are given in the definitions section. Resident Population Total population (2017)
Great Britain (Numbers) All People 228,800 5,424,800 64,169,400 Males 113,900 2,640,300 31,661,600 Females 114,900 2,784,500 32,507,800
 All People 228,800 5,424,800 64,169,400 Males 113,900 2,640,300 31,661,600 Females 114,900 2,784,500 32,507,800") Labour Market Profile - The profile brings together data from several sources. Details about these and related terminology are given in the definitions section. Resident Population Total population (2017)
Labour Market Profile - The profile brings together data from several sources. Details about these and related terminology are given in the definitions section. Resident Population Total population (2017)
Great Britain (Numbers) All People 176,200 6,168,400 64,169,400 Males 87,200 3,040,300 31,661,600 Females 89,000 3,128,100 32,507,800
 All People 176,200 6,168,400 64,169,400 Males 87,200 3,040,300 31,661,600 Females 89,000 3,128,100 32,507,800") Labour Market Profile - The profile brings together data from several sources. Details about these and related terminology are given in the definitions section. Resident Population Total population (2017)
Labour Market Profile - The profile brings together data from several sources. Details about these and related terminology are given in the definitions section. Resident Population Total population (2017)
All People 437,100 5,450,100 64,169,400 Males 216,700 2,690,500 31,661,600 Females 220,500 2,759,600 32,507,800. Kirklees (Numbers)
") Labour Market Profile - The profile brings together data from several sources. Details about these and related terminology are given in the definitions section. Resident Population Total population (2017)
Labour Market Profile - The profile brings together data from several sources. Details about these and related terminology are given in the definitions section. Resident Population Total population (2017)
All People 130,700 3,125,200 64,169,400 Males 63,500 1,540,200 31,661,600 Females 67,200 1,585,000 32,507,800. Vale Of Glamorgan (Numbers)
") Labour Market Profile - The profile brings together data from several sources. Details about these and related terminology are given in the definitions section. Resident Population Total population (2017)
Labour Market Profile - The profile brings together data from several sources. Details about these and related terminology are given in the definitions section. Resident Population Total population (2017)
Great Britain (Numbers) All People 1,176,400 6,129,000 63,785,900 Males 576,100 3,021,300 31,462,500 Females 600,300 3,107,700 32,323,500
 All People 1,176,400 6,129,000 63,785,900 Males 576,100 3,021,300 31,462,500 Females 600,300 3,107,700 32,323,500") Labour Market Profile - The profile brings together data from several sources. Details about these and related terminology are given in the definitions section. Resident Population Total population (2016)
Labour Market Profile - The profile brings together data from several sources. Details about these and related terminology are given in the definitions section. Resident Population Total population (2016)
Tonbridge And Malling (Numbers) All People 128,900 9,080,800 64,169,400 Males 63,100 4,474,400 31,661,600 Females 65,800 4,606,400 32,507,800
 All People 128,900 9,080,800 64,169,400 Males 63,100 4,474,400 31,661,600 Females 65,800 4,606,400 32,507,800") Labour Market Profile - The profile brings together data from several sources. Details about these and related terminology are given in the definitions section. Resident Population Total population (2017)
Labour Market Profile - The profile brings together data from several sources. Details about these and related terminology are given in the definitions section. Resident Population Total population (2017)
Great Britain (Numbers) All People 1,201,900 7,258,600 64,169,400 Males 593,300 3,581,200 31,661,600 Females 608,600 3,677,400 32,507,800
 All People 1,201,900 7,258,600 64,169,400 Males 593,300 3,581,200 31,661,600 Females 608,600 3,677,400 32,507,800") Labour Market Profile - The profile brings together data from several sources. Details about these and related terminology are given in the definitions section. Resident Population Total population (2017)
Labour Market Profile - The profile brings together data from several sources. Details about these and related terminology are given in the definitions section. Resident Population Total population (2017)
Merseyside (Met County) (Numbers) All People 1,416,800 7,258,600 64,169,400 Males 692,300 3,581,200 31,661,600 Females 724,600 3,677,400 32,507,800
 (Numbers) All People 1,416,800 7,258,600 64,169,400 Males 692,300 3,581,200 31,661,600 Females 724,600 3,677,400 32,507,800") Labour Market Profile - The profile brings together data from several sources. Details about these and related terminology are given in the definitions section. Resident Population Total population (2017)
Labour Market Profile - The profile brings together data from several sources. Details about these and related terminology are given in the definitions section. Resident Population Total population (2017)
Great Britain (Numbers) All People 843,800 9,026,300 63,785,900 Males 410,000 4,447,200 31,462,500 Females 433,800 4,579,100 32,323,500
 All People 843,800 9,026,300 63,785,900 Males 410,000 4,447,200 31,462,500 Females 433,800 4,579,100 32,323,500") Labour Market Profile - The profile brings together data from several sources. Details about these and related terminology are given in the definitions section. Resident Population Total population (2016)
Labour Market Profile - The profile brings together data from several sources. Details about these and related terminology are given in the definitions section. Resident Population Total population (2016)
Great Britain (Numbers) All People 648,200 6,168,400 64,169,400 Males 324,200 3,040,300 31,661,600 Females 324,100 3,128,100 32,507,800
 All People 648,200 6,168,400 64,169,400 Males 324,200 3,040,300 31,661,600 Females 324,100 3,128,100 32,507,800") Labour Market Profile - Cambridgeshire The profile brings together data from several sources. Details about these and related terminology are given in the definitions section. Resident Population Total
Labour Market Profile - Cambridgeshire The profile brings together data from several sources. Details about these and related terminology are given in the definitions section. Resident Population Total
Romero Catholic Academy Gender Pay Reporting Findings
 Romero Catholic Academy Gender Pay Reporting Findings March 2018 Introduction In light of the recent Government Regulations regarding Mandatory Gender Pay Gap Reporting, Total Reward Group have been tasked
Cornwall And Isles Of Scilly (Numbers)
") Labour Market Profile - The profile brings together data from several sources. Details about these and related terminology are given in the definitions section. Resident Population Total population (2017)
Labour Market Profile - The profile brings together data from several sources. Details about these and related terminology are given in the definitions section. Resident Population Total population (2017)
Great Britain (Numbers) All People 85,100 5,810,800 63,785,900 Males 42,300 2,878,100 31,462,500 Females 42,800 2,932,600 32,323,500
 All People 85,100 5,810,800 63,785,900 Males 42,300 2,878,100 31,462,500 Females 42,800 2,932,600 32,323,500") Labour Market Profile - The profile brings together data from several sources. Details about these and related terminology are given in the definitions section. Resident Population Total population (2016)
Labour Market Profile - The profile brings together data from several sources. Details about these and related terminology are given in the definitions section. Resident Population Total population (2016)
Great Britain (Numbers) All People 127,500 5,517,000 63,785,900 Males 63,200 2,712,300 31,462,500 Females 64,400 2,804,600 32,323,500
 All People 127,500 5,517,000 63,785,900 Males 63,200 2,712,300 31,462,500 Females 64,400 2,804,600 32,323,500") Labour Market Profile - The profile brings together data from several sources. Details about these and related terminology are given in the definitions section. Resident Population Total population (2016)
Labour Market Profile - The profile brings together data from several sources. Details about these and related terminology are given in the definitions section. Resident Population Total population (2016)
All People 532,500 5,425,400 63,785,900 Males 262,500 2,678,200 31,462,500 Females 270,100 2,747,200 32,323,500. Bradford (Numbers)
") Labour Market Profile - The profile brings together data from several sources. Details about these and related terminology are given in the definitions section. Resident Population Total population (2016)
Labour Market Profile - The profile brings together data from several sources. Details about these and related terminology are given in the definitions section. Resident Population Total population (2016)
Brighton And Hove (Numbers) All People 287,200 9,030,300 63,785,900 Males 144,300 4,449,200 31,462,500 Females 142,900 4,581,100 32,323,500
 All People 287,200 9,030,300 63,785,900 Males 144,300 4,449,200 31,462,500 Females 142,900 4,581,100 32,323,500") Labour Market Profile - The profile brings together data from several sources. Details about these and related terminology are given in the definitions section. Resident Population Total population (2016)
Labour Market Profile - The profile brings together data from several sources. Details about these and related terminology are given in the definitions section. Resident Population Total population (2016)
Great Britain (Numbers) All People 283,500 7,224,000 63,785,900 Males 140,400 3,563,200 31,462,500 Females 143,100 3,660,800 32,323,500
 All People 283,500 7,224,000 63,785,900 Males 140,400 3,563,200 31,462,500 Females 143,100 3,660,800 32,323,500") Labour Market Profile - The profile brings together data from several sources. Details about these and related terminology are given in the definitions section. Resident Population Total population (2016)
Labour Market Profile - The profile brings together data from several sources. Details about these and related terminology are given in the definitions section. Resident Population Total population (2016)
Great Britain (Numbers) All People 64,000 6,168,400 64,169,400 Males 31,500 3,040,300 31,661,600 Females 32,500 3,128,100 32,507,800
 All People 64,000 6,168,400 64,169,400 Males 31,500 3,040,300 31,661,600 Females 32,500 3,128,100 32,507,800") Labour Market Profile - The profile brings together data from several sources. Details about these and related terminology are given in the definitions section. Resident Population Total population (2017)
Labour Market Profile - The profile brings together data from several sources. Details about these and related terminology are given in the definitions section. Resident Population Total population (2017)
North West Leicestershire (Numbers) All People 98,600 4,724,400 63,785,900 Males 48,900 2,335,000 31,462,500 Females 49,800 2,389,400 32,323,500
 All People 98,600 4,724,400 63,785,900 Males 48,900 2,335,000 31,462,500 Females 49,800 2,389,400 32,323,500") Labour Market Profile - The profile brings together data from several sources. Details about these and related terminology are given in the definitions section. Resident Population Total population (2016)
Labour Market Profile - The profile brings together data from several sources. Details about these and related terminology are given in the definitions section. Resident Population Total population (2016)
All People 263,400 5,450,100 64,169,400 Males 129,400 2,690,500 31,661,600 Females 134,000 2,759,600 32,507,800. Rotherham (Numbers)
") Labour Market Profile - The profile brings together data from several sources. Details about these and related terminology are given in the definitions section. Resident Population Total population (2017)
Labour Market Profile - The profile brings together data from several sources. Details about these and related terminology are given in the definitions section. Resident Population Total population (2017)
TRADE UNION MEMBERSHIP Statistical Bulletin
 TRADE UNION MEMBERSHIP 2016 Statistical Bulletin May 2017 Contents Introduction 3 Key findings 5 1. Long Term and Recent Trends 6 2. Private and Public Sectors 13 3. Personal and job characteristics 16
Stockton-On- Tees (Numbers) All People 196,500 2,644,700 64,169,400 Males 96,800 1,297,900 31,661,600 Females 99,700 1,346,800 32,507,800
 All People 196,500 2,644,700 64,169,400 Males 96,800 1,297,900 31,661,600 Females 99,700 1,346,800 32,507,800") Labour Market Profile - The profile brings together data from several sources. Details about these and related terminology are given in the definitions section. Resident Population Total population (2017)
Labour Market Profile - The profile brings together data from several sources. Details about these and related terminology are given in the definitions section. Resident Population Total population (2017)
All People 295,800 2,644,700 64,169,400 Males 149,400 1,297,900 31,661,600 Females 146,400 1,346,800 32,507,800. Newcastle Upon Tyne (Numbers)
") Labour Market Profile - The profile brings together data from several sources. Details about these and related terminology are given in the definitions section. Resident Population Total population (2017)
Labour Market Profile - The profile brings together data from several sources. Details about these and related terminology are given in the definitions section. Resident Population Total population (2017)
Great Britain (Numbers) All People 141,000 9,080,800 64,169,400 Males 68,900 4,474,400 31,661,600 Females 72,100 4,606,400 32,507,800
 All People 141,000 9,080,800 64,169,400 Males 68,900 4,474,400 31,661,600 Females 72,100 4,606,400 32,507,800") Labour Market Profile - The profile brings together data from several sources. Details about these and related terminology are given in the definitions section. Resident Population Total population (2017)
Labour Market Profile - The profile brings together data from several sources. Details about these and related terminology are given in the definitions section. Resident Population Total population (2017)
Great Britain (Numbers) All People 2,300 5,517,000 63,785,900 Males 1,200 2,712,300 31,462,500 Females 1,100 2,804,600 32,323,500
 All People 2,300 5,517,000 63,785,900 Males 1,200 2,712,300 31,462,500 Females 1,100 2,804,600 32,323,500") Labour Market Profile - The profile brings together data from several sources. Details about these and related terminology are given in the definitions section. Resident Population Total population (2016)
Labour Market Profile - The profile brings together data from several sources. Details about these and related terminology are given in the definitions section. Resident Population Total population (2016)
Great Britain (Numbers) All People 259,900 5,860,700 64,169,400 Males 128,900 2,904,300 31,661,600 Females 131,000 2,956,400 32,507,800
 All People 259,900 5,860,700 64,169,400 Males 128,900 2,904,300 31,661,600 Females 131,000 2,956,400 32,507,800") Labour Market Profile - Wolverhampton The profile brings together data from several sources. Details about these and related terminology are given in the definitions section. Resident Population Total
Labour Market Profile - Wolverhampton The profile brings together data from several sources. Details about these and related terminology are given in the definitions section. Resident Population Total
United Kingdom (Level) All People 8,825,000 66,040,200 Males 4,398,800 32,581,800 Females 4,426,200 33,458,400
 All People 8,825,000 66,040,200 Males 4,398,800 32,581,800 Females 4,426,200 33,458,400") Labour Market Profile - The profile brings together data from several sources. Details about these and related terminology are given in the definitions section. Resident Population Total population (2017)
Labour Market Profile - The profile brings together data from several sources. Details about these and related terminology are given in the definitions section. Resident Population Total population (2017)
Great Britain (Numbers) All People 2,897,300 5,860,700 64,169,400 Males 1,434,500 2,904,300 31,661,600 Females 1,462,800 2,956,400 32,507,800
 All People 2,897,300 5,860,700 64,169,400 Males 1,434,500 2,904,300 31,661,600 Females 1,462,800 2,956,400 32,507,800") Labour Market Profile - The profile brings together data from several sources. Details about these and related terminology are given in the definitions section. Map of Resident Population Total population
Labour Market Profile - The profile brings together data from several sources. Details about these and related terminology are given in the definitions section. Map of Resident Population Total population
Labour market statistics: UK regions and countries
 BRIEFING PAPER Number 7950, 7 February 2018 Labour market statistics: UK regions and countries By Andrew Powell Contents: 1. Employment 2. Unemployment 3. Types of employment 4. Average Earnings 5. Notes
Great Britain (Numbers) All People 386,100 8,787,900 63,785,900 Males 190,800 4,379,300 31,462,500 Females 195,200 4,408,600 32,323,500
 All People 386,100 8,787,900 63,785,900 Males 190,800 4,379,300 31,462,500 Females 195,200 4,408,600 32,323,500") Labour Market Profile - The profile brings together data from several sources. Details about these and related terminology are given in the definitions section. Resident Population Total population (2016)
Labour Market Profile - The profile brings together data from several sources. Details about these and related terminology are given in the definitions section. Resident Population Total population (2016)
All People 150,700 5,404,700 63,785,900 Males 74,000 2,627,500 31,462,500 Females 76,700 2,777,200 32,323,500. Perth And Kinross (Numbers)
") Labour Market Profile - The profile brings together data from several sources. Details about these and related terminology are given in the definitions section. Resident Population Total population (2016)
Labour Market Profile - The profile brings together data from several sources. Details about these and related terminology are given in the definitions section. Resident Population Total population (2016)
Great Britain (Numbers) All People 370,300 5,404,700 63,785,900 Males 179,600 2,627,500 31,462,500 Females 190,800 2,777,200 32,323,500
 All People 370,300 5,404,700 63,785,900 Males 179,600 2,627,500 31,462,500 Females 190,800 2,777,200 32,323,500") Labour Market Profile - The profile brings together data from several sources. Details about these and related terminology are given in the definitions section. Resident Population Total population (2016)
Labour Market Profile - The profile brings together data from several sources. Details about these and related terminology are given in the definitions section. Resident Population Total population (2016)
Cambridgeshire And Peterborough (Numbers)
") Labour Market Profile - The profile brings together data from several sources. Details about these and related terminology are given in the definitions section. Resident Population Total population (2016)
Labour Market Profile - The profile brings together data from several sources. Details about these and related terminology are given in the definitions section. Resident Population Total population (2016)
Draft Budget : Taxes
 SPICe Briefing Pàipear-ullachaidh SPICe Draft Budget 2018-19: Taxes Anouk Berthier and Nicola Hudson This briefing looks at the Scottish Government's tax proposals in Draft Budget 2018-19. Two other briefings
Poverty and Income Inequality in Scotland: 2013/14 A National Statistics publication for Scotland
 Poverty and Income Inequality in Scotland: 2013/14 A National Statistics publication for Scotland EQUALITY, POVERTY AND SOCIAL SECURITY This publication presents annual estimates of the percentage and
The Northern Ireland labour market is characterised by relatively. population of working age are not active in the labour market at
 INTRODUCTION The Northern Ireland labour market is characterised by relatively high levels of economic inactivity. Around 28 per cent of the population of working age are not active in the labour market
United Kingdom (Level) All People 1,870,800 66,040,200 Males 920,200 32,581,800 Females 950,600 33,458,400
 All People 1,870,800 66,040,200 Males 920,200 32,581,800 Females 950,600 33,458,400") Labour Market Profile - The profile brings together data from several sources. Details about these and related terminology are given in the definitions section. Resident Population Total population (2017)
Labour Market Profile - The profile brings together data from several sources. Details about these and related terminology are given in the definitions section. Resident Population Total population (2017)
Low pay and company size. Tom MacInnes and Peter Kenway
 Low pay and company size Tom MacInnes and Peter Kenway February 2016 Table of Contents Low pay and company size... 3 Summary... 3 Background and method... 4 Looking at differences by employee type... 6
Guide to the new Scottish budget process
 SPICe Briefing Pàipear-ullachaidh SPICe Guide to the new Scottish budget process Ross Burnside On 8 May 2018, the Scottish Parliament agreed to changes to the Written Agreement between the Finance and
Civil Service Statistics 2009: A focus on gross annual earnings
 Economic & Labour Market Review Vol 4 No 4 April 10 ARTICLE David Matthews and Andrew Taylor Civil Service Statistics 09: A focus on gross annual earnings SUMMARY This article presents a summary of annual
The changing face of public sector employment
 Economic & Labour Market Review Vol 4 No 7 July 2010 ARTICLE David Matthews The changing face of public sector employment 1999 2009 SUMMARY This article presents an analysis of public sector employment
The Fife Labour Market Annual Report 2013
 The Fife Labour Market Annual Report 2013 Contents Executive Summary & Introduction Page 3 Part One: Labour Supply Page 5 1.1 Population Page 5 1.2 Employment Page 6 1.3 Claimant Count Page 7 1.4 Claimant
Labour Market Trends
 STUC SG Biannual June 2013 Employment in is increasing and unemployment is decreasing. is outperforming the on all headline labour market measures, employment, unemployment and inactivity. Recent increases
Annual Equal Pay Audit 1 April 2013 to 31 March 2014
 Appendix 4 Annual Equal Pay Audit 1 April 2013 to 31 March 2014 A fresh approach to people, homes and communities INTRODUCTION Berneslai Homes is committed to and supports the principle of equal pay for
(Press Release 26th May 2016) Analysis of Inequality in the Scottish Labour Market, 2015
 Analysis of Inequality in the Scottish Labour Market, 2015") (Press Release 26th May 2016) Analysis of Inequality in the Scottish Labour Market, 2015 The Scottish Government this week published disaggregated labour market statistics for Scotland up to 2015, based
(Press Release 26th May 2016) Analysis of Inequality in the Scottish Labour Market, 2015 The Scottish Government this week published disaggregated labour market statistics for Scotland up to 2015, based
Workforce participation of mature aged women
 Workforce participation of mature aged women Geoff Gilfillan Senior Research Economist Productivity Commission Productivity Commission Topics Trends in labour force participation Potential labour supply
Gender Pay Gap Report
 Gender Pay Gap Report 2016-2017 Contents Contents 2 Introduction 3 Gender Profile 4 Gender Pay Gap in Hourly Pay 5 Bonus Gender Pay Gap...6 Proportion of Males and Females in each Pay Quartile..6 Actions
Civil Service Statistics 2008: a focus on gross annual earnings
 FEATURE David Matthews and Andrew Taylor Civil Service Statistics 2008: a focus on gross annual earnings SUMMARY This article presents a summary of annual Civil Service statistics for the year ending 31
ECONOMIC BACKGROUND FOR PAY CLAIMS. Introduction
 ECONOMIC BACKGROUND FOR PAY CLAIMS Introduction This document seeks to provide an outline of the latest developments in the economy which are most directly linked to pay claims. A model pay claim, available
Local Government Finance: Facts and Figures, to
 SPICe Briefing Pàipear-ullachaidh SPICe Local Government Finance: Facts and Figures, 2010-11 to 2017-18 Ailsa Burn-Murdoch This briefing provides a range of factual information and analysis on local government
Wage Progression in the UK
 Wage Progression in the UK Monica Costa Dias Robert Joyce DWP meeting, January 2017 Outline Brief overview of recent and planned research relating to earnings progression Women: wages over the lifecycle,
Exploring the rise of self-employment in the modern economy
 Exploring the rise of self-employment in the modern economy A guide to demographics and other trends in the UK s self-employed workforce in 2017 1 About IPSE IPSE is the largest association of independent
PPI PPI Briefing Note Number 92
 Briefing Note Number 92 Page 1 The Wellbeing, Health, Retirement and the Lifecourse project (WHERL) This research project investigates ageing, work and health across the lifecourse. This 3 year interdisciplinary
Research and Development Tax Credits Statistics
 Coverage: United Kingdom Theme: The Economy Research and Development Tax Credits Statistics Released: 15 August 2014 Next Release: August 2015 Frequency of release: Annual Media contact: HMRC Press Office
Pre-Budget 2018 Consultation Submission Canadian Centre for Policy Alternatives Contact: Kate McInturff, Ph.D
 Pre-Budget 2018 Consultation Submission Canadian Centre for Policy Alternatives Contact: Kate McInturff, Ph.D kate@policyalternatives.ca The Bank of Canada is predicting a slowdown in labour productivity
Total reward: pay and pension contributions in the private and public sectors
 Economic & Labour Market Review Vol 4 No 9 September 21 ARTICLE Sarah Levy, Hazel Mitchell, Guled Guled and Jessica Coleman Total reward: pay and pension contributions in the private and public sectors
Overview of the Scottish labour market
 Overview of the Scottish labour market Comparable figures on the labour market 1 between Scotland and the United Kingdom in the second quarter of 2008 are summarised in Table 1. Labour Force Survey (LFS)
GAO GENDER PAY DIFFERENCES. Progress Made, but Women Remain Overrepresented among Low-Wage Workers. Report to Congressional Requesters
 GAO United States Government Accountability Office Report to Congressional Requesters October 2011 GENDER PAY DIFFERENCES Progress Made, but Women Remain Overrepresented among Low-Wage Workers GAO-12-10