Logit Analysis. Using vttown.dta. Albert Satorra, UPF
|
|
|
- Giles Morris
- 6 years ago
- Views:
Transcription
1 Logit Analysis Using vttown.dta
2 Logit Regression
3
4
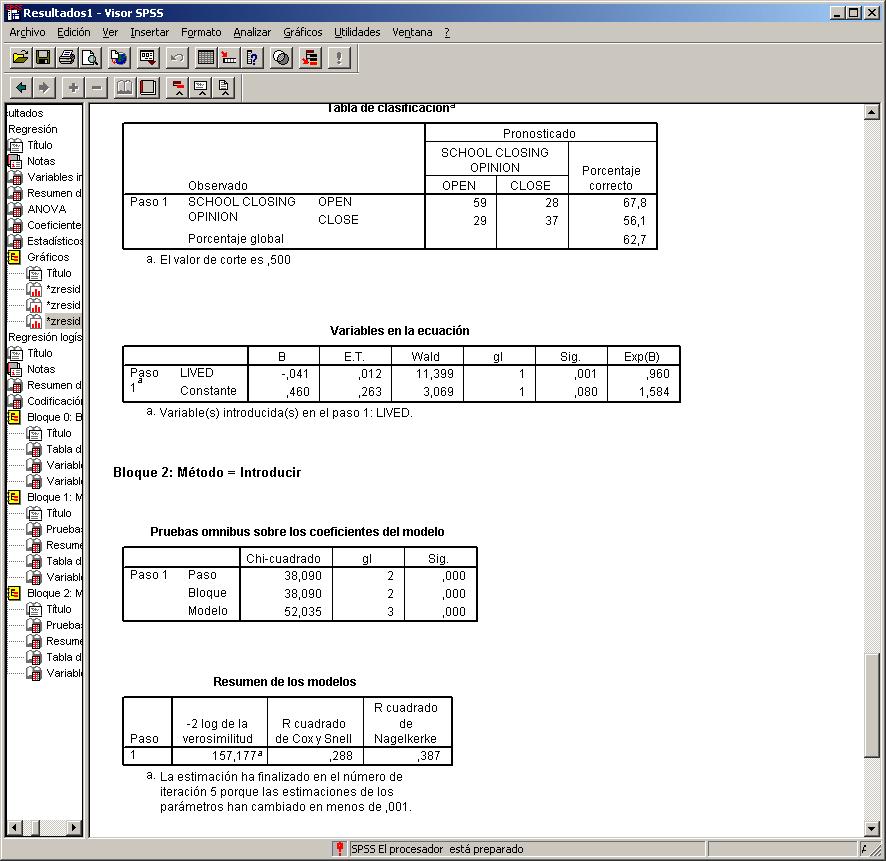
5 Odds ratio The most common way of interpreting a logit is to convert it to an odds ratio using the exp() function. One can convert back using the ln() function. An odds ratio above 1.0 refers to the odds that Y = 1 in binary logistic regression. The closer the odds ratio is to 1.0, the more the independent variable's categories (ex., male and female for gender) are independent of the dependent variable, with 1.0 representing no association. For instance: If in the logit regresion, b1 = 2.303, the corresponding odds ratio is exp(2.303) = 10, then we may say that when the independent variable increases one unit, the odds that the dependent = 1 increase by a factor of 10 (i.e., an increase of 100(10-1) per cent, 900 %) when other variables are controlled. If b1 = -1.5 then the odds of Y = 1 decrease by a factor of exp(-1.5) = 0.22, i.e. a decrease of 100(0.22-1) per cent ( -88% ). In SPSS, odds ratios appear as "Exp(B)" in the "Variables in the Equation" table.
6
7
8
 POUT(.")
9 Model Lineal de Probabilitat GET FILE='G:\Albert\Web\Metodes2005\Da des\vttown.sav'. *** Regressió lineal REGRESSION /MISSING LISTWISE /STATISTICS COEFF OUTS R ANOVA /CRITERIA=PIN(.05) POUT(.10) /NOORIGIN /DEPENDENT school /METHOD=ENTER lived /SCATTERPLOT=(*ZRESID,*ZPRED ) /RESIDUALS HIST(ZRESID) NORM(ZRESID).

10 Residus? 2,5 Gráfico de dispersión Variable dependiente: SCHOOL Regresión Residuo tipificado 2,0 1,5 1,0,5 0,0 -,5-1,0-1, Regresión Valor pronosticado tipificado
11

12
13
")
14 LOGISTIC REGRESSION VAR=school /METHOD=ENTER lived /METHOD=ENTER meetings gender /CRITERIA PIN(.05) POUT(.10) ITERATE(20) CUT(.5).
15 Logit analysis library(foreign) data=read.dta("e:/albert/courses/cursdas/as2003/data/vttown.dta") help(glm) help(family) attach(data) names(data) [1] "gender" "lived" "kids" "educ" "meetings" "contam" "school" results = glm(school ~lived + meetings, family=binomial) results Call: glm(formula = school ~ lived + meetings, family = binomial) Coefficients: (Intercept) lived meetingsyes Degrees of Freedom: 152 Total (i.e. Null); 150 Residual Null Deviance: Residual Deviance: AIC: fv=results$fitted.values re=results$residuals plot(fv, re) logit = results$linear.predictor
16 Logit analysis summary(results) Call: glm(formula = school ~ lived + meetings, family = binomial) Deviance Residuals: Min 1Q Median 3Q Max Coefficients: Estimate Std. Error z value Pr(> z ) (Intercept) lived ** meetingsyes e-08 *** --- Signif. codes: 0 `***' `**' 0.01 `*' 0.05 `.' 0.1 ` ' 1 (Dispersion parameter for binomial family taken to be 1) Null deviance: on 152 degrees of freedom Residual deviance: on 150 degrees of freedom AIC: Number of Fisher Scoring iterations: 3 Residual deviance = -2 log L The test of the significance of the model is 1-pchisq( , 2) [1] e-11 (exp( )-1)*100 [1] , i.e. 3.5% decrease on the odds when lived Albert Satorra, -> lived UPF +1
 POUT(.")
17 Logit analysis LOGISTIC REGRESSION VAR=school /METHOD=ENTER lived meetings /SAVE COOK ZRESID /CRITERIA PIN(.05) POUT(.10) ITERATE(20) CUT(.5).
18 Logit regression using R fitlogit =glm(school ~ lived, binomial) summary(fitlogit) ind=sort(lived, index.return=t)$ix plot(lived[ind],fp[ind], type ="l", col="red", xlab="years living hatvalues(fitlogit) dfbetas(fitlogit) rstudent(fitlogit) plot(hatvalues(fitlogit),rstudent(fitlogit),type="n") dfb=dfbetas(fitlogit)[2] points(hatvalues(fitlogit),rstudent(fitlogit), cex = 10*dfb/max(df abline(h =c(-1,0,1), lty=2) abline(v= =c(.015,.030), lty=2) abline(v= c(.015,.030), lty=2) identify(hatvalues(fitlogit),rstudent(fitlogit), 1:length(rstudent(
19 Making a conditional effect plot ### making a plot x=seq(1,81,1) logit0 = *x *0 logit1 = *x *1 p0=1/(1+exp(-logit0)) p1=1/(1+exp(-logit1)) library(foreign) data=read.spss("i:/pol/metodes/dades/vttown.sav") names(data) attach(data) DS=rep(0,length(SCHOOL)) DS[SCHOOL=="CLOSE"] =1 plot(lived,ds, col="blue", main="prob. en funció d'anys al poble", cex=.8,xlab="anys al poble", ylab="probabilitat") lines(x,p0,col="red", lty=1 ) lines(x,p1,col="green", lty=2 ) legend(60,.8,c("meetings is 0", "meetings is 1"), lty=c(1,2), col=c("red", "green"), cex=.8) #### abline(lm(ds ~LIVED), col="orange")
20

21 Cook vs residuo normalizado Análogo de los estadísticos de influencia de,5,4,3,2,1 0,0 -, Residuo normalizado
22 Multinomial Logit Regression plogit <- function(x) 1/(1+exp(-x)) eta <- seq(-10, 10, len=100) p1 <- plogit(eta-1) p2 <- plogit(eta+1) p3 <- plogit(eta+4.5) plot(c(-10,10), range(p1,p2,p3), type="n", axes=false, xlab="x", ylab="pr(y > j)") axis(2) box() abline(h=c(0,1), col="gray") lines(eta, p1, lwd=2) lines(eta, p2, lwd=2) lines(eta, p3, lwd=2) coords <- locator(2) arrows(coords$x[1], coords$y[1], coords$x[2], coords$y[2], code=1, length=0.125) text(coords$x[2], coords$y[2], pos=3, "Pr(y > 1)") coords <- locator(2) arrows(coords$x[1], coords$y[1], coords$x[2], coords$y[2], code=1, length=0.125) text(coords$x[2], coords$y[2], pos=3, "Pr(y > 2)") coords <- locator(2) arrows(coords$x[1], coords$y[1], coords$x[2], coords$y[2], code=1, length=0.125) text(coords$x[2], coords$y[2], pos=3, "Pr(y > 3)")
23


24 Sintaxis de SPSS Activa un fitxer de sintaxis, que es pot executar parcialment


25 Suprimir casos en el análisis Selecciona casos condición

26 ... filtrat de casos Caso suprimido
Multiple Regression and Logistic Regression II. Dajiang 525 Apr
 Multiple Regression and Logistic Regression II Dajiang Liu @PHS 525 Apr-19-2016 Materials from Last Time Multiple regression model: Include multiple predictors in the model = + + + + How to interpret the
############################ ### toxo.r ### ############################
 ############################ ### toxo.r ### ############################ toxo < read.table(file="n:\\courses\\stat8620\\fall 08\\toxo.dat",header=T) #toxo < read.table(file="c:\\documents and Settings\\dhall\\My
Logistic Regression. Logistic Regression Theory
 Logistic Regression Dr. J. Kyle Roberts Southern Methodist University Simmons School of Education and Human Development Department of Teaching and Learning Logistic Regression The linear probability model.
Ordinal Multinomial Logistic Regression. Thom M. Suhy Southern Methodist University May14th, 2013
 Ordinal Multinomial Logistic Thom M. Suhy Southern Methodist University May14th, 2013 GLM Generalized Linear Model (GLM) Framework for statistical analysis (Gelman and Hill, 2007, p. 135) Linear Continuous
Generalized Linear Models
 Generalized Linear Models Scott Creel Wednesday, September 10, 2014 This exercise extends the prior material on using the lm() function to fit an OLS regression and test hypotheses about effects on a parameter.
Introduction to General and Generalized Linear Models
 Introduction to General and Generalized Linear Models Generalized Linear Models - IIIb Henrik Madsen March 18, 2012 Henrik Madsen () Chapman & Hall March 18, 2012 1 / 32 Examples Overdispersion and Offset!
> budworm$samplogit < log((budworm$y+0.5)/(budworm$m budworm$y+0.5))
/(budworm$m budworm$y+0.5))") budworm < read.table(file="n:\\courses\\stat8620\\fall 08\\budworm.dat",header=T) #budworm < read.table(file="c:\\documents and Settings\\dhall\\My Documents\\Dan's Work Stuff\\courses\\STAT8620\\Fall
budworm < read.table(file="n:\\courses\\stat8620\\fall 08\\budworm.dat",header=T) #budworm < read.table(file="c:\\documents and Settings\\dhall\\My Documents\\Dan's Work Stuff\\courses\\STAT8620\\Fall
Chapter 8 Exercises 1. Data Analysis & Graphics Using R Solutions to Exercises (May 1, 2010)
") Chapter 8 Exercises 1 Data Analysis & Graphics Using R Solutions to Exercises (May 1, 2010) Preliminaries > library(daag) Exercise 1 The following table shows numbers of occasions when inhibition (i.e.,
Chapter 8 Exercises 1 Data Analysis & Graphics Using R Solutions to Exercises (May 1, 2010) Preliminaries > library(daag) Exercise 1 The following table shows numbers of occasions when inhibition (i.e.,
Lampiran 1 Data Efektivits BPHTB
 Lampiran 1 Data Efektivits BPHTB No Kecamatan Semester 1 Tahun 2011 Semester 2 Tahun 2011 Semester 1 Tahun 2012 Semester 2 Tahun 2012 Realisasi Potensi % Realisasi Potensi % Realisasi Potensi % Realisasi
boxcox() returns the values of α and their loglikelihoods,
 returns the values of α and their loglikelihoods,") Solutions to Selected Computer Lab Problems and Exercises in Chapter 11 of Statistics and Data Analysis for Financial Engineering, 2nd ed. by David Ruppert and David S. Matteson c 2016 David Ruppert and
Solutions to Selected Computer Lab Problems and Exercises in Chapter 11 of Statistics and Data Analysis for Financial Engineering, 2nd ed. by David Ruppert and David S. Matteson c 2016 David Ruppert and
Negative Binomial Model for Count Data Log-linear Models for Contingency Tables - Introduction
 Negative Binomial Model for Count Data Log-linear Models for Contingency Tables - Introduction Statistics 149 Spring 2006 Copyright 2006 by Mark E. Irwin Negative Binomial Family Example: Absenteeism from
Addiction - Multinomial Model
 Addiction - Multinomial Model February 8, 2012 First the addiction data are loaded and attached. > library(catdata) > data(addiction) > attach(addiction) For the multinomial logit model the function multinom
Logistic Regression with R: Example One
 Logistic Regression with R: Example One math = read.table("http://www.utstat.toronto.edu/~brunner/appliedf12/data/mathcat.data") math[1:5,] hsgpa hsengl hscalc course passed outcome 1 78.0 80 Yes Mainstrm
Stat 401XV Exam 3 Spring 2017
 Stat 40XV Exam Spring 07 I have neither given nor received unauthorized assistance on this exam. Name Signed Date Name Printed ATTENTION! Incorrect numerical answers unaccompanied by supporting reasoning
Credit Risk Modelling
 Credit Risk Modelling Tiziano Bellini Università di Bologna December 13, 2013 Tiziano Bellini (Università di Bologna) Credit Risk Modelling December 13, 2013 1 / 55 Outline Framework Credit Risk Modelling
The SAS System 11:03 Monday, November 11,
 The SAS System 11:3 Monday, November 11, 213 1 The CONTENTS Procedure Data Set Name BIO.AUTO_PREMIUMS Observations 5 Member Type DATA Variables 3 Engine V9 Indexes Created Monday, November 11, 213 11:4:19
CREDIT RISK MODELING IN R. Logistic regression: introduction
 CREDIT RISK MODELING IN R Logistic regression: introduction Final data structure > str(training_set) 'data.frame': 19394 obs. of 8 variables: $ loan_status : Factor w/ 2 levels "0","1": 1 1 1 1 1 1 1 1
Bradley-Terry Models. Stat 557 Heike Hofmann
 Bradley-Terry Models Stat 557 Heike Hofmann Outline Definition: Bradley-Terry Fitting the model Extension: Order Effects Extension: Ordinal & Nominal Response Repeated Measures Bradley-Terry Model (1952)
Generalized Multilevel Regression Example for a Binary Outcome
 Psy 510/610 Multilevel Regression, Spring 2017 1 HLM Generalized Multilevel Regression Example for a Binary Outcome Specifications for this Bernoulli HLM2 run Problem Title: no title The data source for
MCMC Package Example
 MCMC Package Example Charles J. Geyer April 4, 2005 This is an example of using the mcmc package in R. The problem comes from a take-home question on a (take-home) PhD qualifying exam (School of Statistics,
Case Study: Applying Generalized Linear Models
 Case Study: Applying Generalized Linear Models Dr. Kempthorne May 12, 2016 Contents 1 Generalized Linear Models of Semi-Quantal Biological Assay Data 2 1.1 Coal miners Pneumoconiosis Data.................
Non-linearities in Simple Regression
 Non-linearities in Simple Regression 1. Eample: Monthly Earnings and Years of Education In this tutorial, we will focus on an eample that eplores the relationship between total monthly earnings and years
Dummy Variables. 1. Example: Factors Affecting Monthly Earnings
 Dummy Variables A dummy variable or binary variable is a variable that takes on a value of 0 or 1 as an indicator that the observation has some kind of characteristic. Common examples: Sex (female): FEMALE=1
Statistics 175 Applied Statistics Generalized Linear Models Jianqing Fan
 Statistics 175 Applied Statistics Generalized Linear Models Jianqing Fan Example 1 (Kyhposis data): (The data set kyphosis consists of measurements on 81 children following corrective spinal surgery. Variable
Predicting Charitable Contributions
 Predicting Charitable Contributions By Lauren Meyer Executive Summary Charitable contributions depend on many factors from financial security to personal characteristics. This report will focus on demographic
ORDERED MULTINOMIAL LOGISTIC REGRESSION ANALYSIS. Pooja Shivraj Southern Methodist University
 ORDERED MULTINOMIAL LOGISTIC REGRESSION ANALYSIS Pooja Shivraj Southern Methodist University KINDS OF REGRESSION ANALYSES Linear Regression Logistic Regression Dichotomous dependent variable (yes/no, died/
Step 1: Load the appropriate R package. Step 2: Fit a separate mixed model for each independence claim in the basis set.
 Step 1: Load the appropriate R package. You will need two libraries: nlme and lme4. Step 2: Fit a separate mixed model for each independence claim in the basis set. For instance, in Table 2 the first basis
Lecture 21: Logit Models for Multinomial Responses Continued
 Lecture 21: Logit Models for Multinomial Responses Continued Dipankar Bandyopadhyay, Ph.D. BMTRY 711: Analysis of Categorical Data Spring 2011 Division of Biostatistics and Epidemiology Medical University
Modelling the potential human capital on the labor market using logistic regression in R
 Modelling the potential human capital on the labor market using logistic regression in R Ana-Maria Ciuhu (dobre.anamaria@hotmail.com) Institute of National Economy, Romanian Academy; National Institute
Using R to Create Synthetic Discrete Response Regression Models
 Arizona State University From the SelectedWorks of Joseph M Hilbe July 3, 2011 Using R to Create Synthetic Discrete Response Regression Models Joseph Hilbe, Arizona State University Available at: https://works.bepress.com/joseph_hilbe/3/
Let us assume that we are measuring the yield of a crop plant on 5 different plots at 4 different observation times.
 Mixed-effects models An introduction by Christoph Scherber Up to now, we have been dealing with linear models of the form where ß0 and ß1 are parameters of fixed value. Example: Let us assume that we are
STA 4504/5503 Sample questions for exam True-False questions.
 STA 4504/5503 Sample questions for exam 2 1. True-False questions. (a) For General Social Survey data on Y = political ideology (categories liberal, moderate, conservative), X 1 = gender (1 = female, 0
Didacticiel - Études de cas. In this tutorial, we show how to implement a multinomial logistic regression with TANAGRA.
 Subject In this tutorial, we show how to implement a multinomial logistic regression with TANAGRA. Logistic regression is a technique for maing predictions when the dependent variable is a dichotomy, and
Projects for Bayesian Computation with R
 Projects for Bayesian Computation with R Laura Vana & Kurt Hornik Winter Semeter 2018/2019 1 S&P Rating Data On the homepage of this course you can find a time series for Standard & Poors default data
WesVar uses repeated replication variance estimation methods exclusively and as a result does not offer the Taylor Series Linearization approach.
 CHAPTER 9 ANALYSIS EXAMPLES REPLICATION WesVar 4.3 GENERAL NOTES ABOUT ANALYSIS EXAMPLES REPLICATION These examples are intended to provide guidance on how to use the commands/procedures for analysis of
Lecture 10: Alternatives to OLS with limited dependent variables, part 1. PEA vs APE Logit/Probit
 Lecture 10: Alternatives to OLS with limited dependent variables, part 1 PEA vs APE Logit/Probit PEA vs APE PEA: partial effect at the average The effect of some x on y for a hypothetical case with sample
Determining Probability Estimates From Logistic Regression Results Vartanian: SW 541
 Determining Probability Estimates From Logistic Regression Results Vartanian: SW 541 In determining logistic regression results, you will generally be given the odds ratio in the SPSS or SAS output. However,
Review questions for Multinomial Logit/Probit, Tobit, Heckit, Quantile Regressions
 1. I estimated a multinomial logit model of employment behavior using data from the 2006 Current Population Survey. The three possible outcomes for a person are employed (outcome=1), unemployed (outcome=2)
Multinomial Logit Models - Overview Richard Williams, University of Notre Dame, https://www3.nd.edu/~rwilliam/ Last revised February 13, 2017
 Multinomial Logit Models - Overview Richard Williams, University of Notre Dame, https://www3.nd.edu/~rwilliam/ Last revised February 13, 2017 This is adapted heavily from Menard s Applied Logistic Regression
Multiple regression - a brief introduction
 Multiple regression - a brief introduction Multiple regression is an extension to regular (simple) regression. Instead of one X, we now have several. Suppose, for example, that you are trying to predict
Categorical Outcomes. Statistical Modelling in Stata: Categorical Outcomes. R by C Table: Example. Nominal Outcomes. Mark Lunt.
 Categorical Outcomes Statistical Modelling in Stata: Categorical Outcomes Mark Lunt Arthritis Research UK Epidemiology Unit University of Manchester Nominal Ordinal 28/11/2017 R by C Table: Example Categorical,
Intro to GLM Day 2: GLM and Maximum Likelihood
 Intro to GLM Day 2: GLM and Maximum Likelihood Federico Vegetti Central European University ECPR Summer School in Methods and Techniques 1 / 32 Generalized Linear Modeling 3 steps of GLM 1. Specify the
Module 9: Single-level and Multilevel Models for Ordinal Responses. Stata Practical 1
 Module 9: Single-level and Multilevel Models for Ordinal Responses Pre-requisites Modules 5, 6 and 7 Stata Practical 1 George Leckie, Tim Morris & Fiona Steele Centre for Multilevel Modelling If you find
11. Logistic modeling of proportions
 11. Logistic modeling of proportions Retrieve the data File on main menu Open worksheet C:\talks\strirling\employ.ws = Note Postcode is neighbourhood in Glasgow Cell is element of the table for each postcode
Comparing effects across nested logistic regression models
 Comparing effects across nested logistic regression models CADC Scholars Meeting March 12, 2013 Steve Gregorich SEGregorich 1 Mar 12, 2013 Example from the literature of nested model comparisons Care is
Study 2: data analysis. Example analysis using R
 Study 2: data analysis Example analysis using R Steps for data analysis Install software on your computer or locate computer with software (e.g., R, systat, SPSS) Prepare data for analysis Subjects (rows)
> attach(grocery) > boxplot(sales~discount, ylab="sales",xlab="discount")
 > boxplot(sales~discount, ylab=sales,xlab=discount)") Example of More than 2 Categories, and Analysis of Covariance Example > attach(grocery) > boxplot(sales~discount, ylab="sales",xlab="discount") Sales 160 200 240 > tapply(sales,discount,mean) 10.00% 15.00%
Example of More than 2 Categories, and Analysis of Covariance Example > attach(grocery) > boxplot(sales~discount, ylab="sales",xlab="discount") Sales 160 200 240 > tapply(sales,discount,mean) 10.00% 15.00%
proc genmod; model malform/total = alcohol / dist=bin link=identity obstats; title 'Table 2.7'; title2 'Identity Link';
 BIOS 6244 Analysis of Categorical Data Assignment 5 s 1. Consider Exercise 4.4, p. 98. (i) Write the SAS code, including the DATA step, to fit the linear probability model and the logit model to the data
GGraph. Males Only. Premium. Experience. GGraph. Gender. 1 0: R 2 Linear = : R 2 Linear = Page 1
 GGraph 9 Gender : R Linear =.43 : R Linear =.769 8 7 6 5 4 3 5 5 Males Only GGraph Page R Linear =.43 R Loess 9 8 7 6 5 4 5 5 Explore Case Processing Summary Cases Valid Missing Total N Percent N Percent
One Way ANOVA with Tukey Post hoc. Case Processing Summary
 EXAMINE VARIABLES=Score BY Group /PLOT BOXPLOT NPPLOT /COMPARE GROUP /STATISTICS DESCRIPTIVES /CINTERVAL 95 /MISSING LISTWISE /NOTOTAL. Explore Group One Way ANOVA with Tukey Post hoc Case Processing Summary
Random Effects ANOVA
 Random Effects ANOVA Grant B. Morgan Baylor University This post contains code for conducting a random effects ANOVA. Make sure the following packages are installed: foreign, lme4, lsr, lattice. library(foreign)
Logit Models for Binary Data
 Chapter 3 Logit Models for Binary Data We now turn our attention to regression models for dichotomous data, including logistic regression and probit analysis These models are appropriate when the response
Predicting the Direction of Swap Spreads
 Predicting the Direction of Swap Spreads Paul Teetor March, 2007 Abstract A model is developed for predicting the direction of 10-year swap spreads from related financial time series, such as Treasury
MCMC Package Example (Version 0.5-1)
") MCMC Package Example (Version 0.5-1) Charles J. Geyer September 16, 2005 1 The Problem This is an example of using the mcmc package in R. The problem comes from a take-home question on a (take-home) PhD
MCMC Package Example (Version 0.5-1) Charles J. Geyer September 16, 2005 1 The Problem This is an example of using the mcmc package in R. The problem comes from a take-home question on a (take-home) PhD
Lapse Modeling for the Post-Level Period
 Lapse Modeling for the Post-Level Period A Practical Application of Predictive Modeling JANUARY 2015 SPONSORED BY Committee on Finance Research PREPARED BY Richard Xu, FSA, Ph.D. Dihui Lai, Ph.D. Minyu
Class Notes: Week 6. Multinomial Outcomes
 Ronald Hek Class Notes: Week 6 1 Class Notes: Week 6 Multinomial Outomes For the next ouple of weeks or so, we will look at models where there are more than two ategories of outomes. Multinomial logisti
To be two or not be two, that is a LOGISTIC question
 MWSUG 2016 - Paper AA18 To be two or not be two, that is a LOGISTIC question Robert G. Downer, Grand Valley State University, Allendale, MI ABSTRACT A binary response is very common in logistic regression
M249 Diagnostic Quiz
 THE OPEN UNIVERSITY Faculty of Mathematics and Computing M249 Diagnostic Quiz Prepared by the Course Team [Press to begin] c 2005, 2006 The Open University Last Revision Date: May 19, 2006 Version 4.2
Girma Tefera*, Legesse Negash and Solomon Buke. Department of Statistics, College of Natural Science, Jimma University. Ethiopia.
 Vol. 5(2), pp. 15-21, July, 2014 DOI: 10.5897/IJSTER2013.0227 Article Number: C81977845738 ISSN 2141-6559 Copyright 2014 Author(s) retain the copyright of this article http://www.academicjournals.org/ijster
6 Multiple Regression
 More than one X variable. 6 Multiple Regression Why? Might be interested in more than one marginal effect Omitted Variable Bias (OVB) 6.1 and 6.2 House prices and OVB Should I build a fireplace? The following
Table 4. Probit model of union membership. Probit coefficients are presented below. Data from March 2008 Current Population Survey.
 1. Using a probit model and data from the 2008 March Current Population Survey, I estimated a probit model of the determinants of pension coverage. Three specifications were estimated. The first included
CHAPTER 4 DATA ANALYSIS Data Hypothesis
 CHAPTER 4 DATA ANALYSIS 4.1. Data Hypothesis The hypothesis for each independent variable to express our expectations about the characteristic of each independent variable and the pay back performance
1 Stat 8053, Fall 2011: GLMMs
 Stat 805, Fall 0: GLMMs The data come from a 988 fertility survey in Bangladesh. Data were collected on 94 women grouped into 60 districts. The response of interest is whether or not the woman is using
NPTEL Project. Econometric Modelling. Module 16: Qualitative Response Regression Modelling. Lecture 20: Qualitative Response Regression Modelling
 1 P age NPTEL Project Econometric Modelling Vinod Gupta School of Management Module 16: Qualitative Response Regression Modelling Lecture 20: Qualitative Response Regression Modelling Rudra P. Pradhan
An Empirical Study on Default Factors for US Sub-prime Residential Loans
 An Empirical Study on Default Factors for US Sub-prime Residential Loans Kai-Jiun Chang, Ph.D. Candidate, National Taiwan University, Taiwan ABSTRACT This research aims to identify the loan characteristics
Regression Review and Robust Regression. Slides prepared by Elizabeth Newton (MIT)
") Regression Review and Robust Regression Slides prepared by Elizabeth Newton (MIT) S-Plus Oil City Data Frame Monthly Excess Returns of Oil City Petroleum, Inc. Stocks and the Market SUMMARY: The oilcity
Regression Review and Robust Regression Slides prepared by Elizabeth Newton (MIT) S-Plus Oil City Data Frame Monthly Excess Returns of Oil City Petroleum, Inc. Stocks and the Market SUMMARY: The oilcity
Longitudinal Logistic Regression: Breastfeeding of Nepalese Children
 Longitudinal Logistic Regression: Breastfeeding of Nepalese Children Scientific Question Determine whether the breastfeeding of Nepalese children varies with child age and/or sex of child. Data: Nepal
Unit 5: Study Guide Multilevel models for macro and micro data MIMAS The University of Manchester
 Unit 5: Study Guide Multilevel models for macro and micro data MIMAS The University of Manchester 5.1 Introduction 5.2 Learning objectives 5.3 Single level models 5.4 Multilevel models 5.5 Theoretical
Financial Risk Models in R. Outline
 Financial Risk Models in R AMATH 546/ECON 589 22 May 2012 Eric Zivot Outline Factor Models for Asset Returns Estimation of Factor Models in R Factor Model Risk Analysis Factor Model Risk Analysis in R
Maximum Likelihood Estimation
 Maximum Likelihood Estimation EPSY 905: Fundamentals of Multivariate Modeling Online Lecture #6 EPSY 905: Maximum Likelihood In This Lecture The basics of maximum likelihood estimation Ø The engine that
Ordinal and categorical variables
 Ordinal and categorical variables Ben Bolker October 29, 2018 Licensed under the Creative Commons attribution-noncommercial license (http: //creativecommons.org/licenses/by-nc/3.0/). Please share & remix
*9-BES2_Logistic Regression - Social Economics & Public Policies Marcelo Neri
 Econometric Techniques and Estimated Models *9 (continues in the website) This text details the different statistical techniques used in the analysis, such as logistic regression, applied to discrete variables
Graduate School of Business, University of Chicago Business 41202, Spring Quarter 2007, Mr. Ruey S. Tsay. Midterm
 Graduate School of Business, University of Chicago Business 41202, Spring Quarter 2007, Mr. Ruey S. Tsay Midterm GSB Honor Code: I pledge my honor that I have not violated the Honor Code during this examination.
Generalized Linear Models
 Generalized Linear Models Ordinal Logistic Regression Dr. Tackett 11.27.2018 1 / 26 Announcements HW 8 due Thursday, 11/29 Lab 10 due Sunday, 12/2 Exam II, Thursday 12/6 2 / 26 Packages library(knitr)
a. Explain why the coefficients change in the observed direction when switching from OLS to Tobit estimation.
 1. Using data from IRS Form 5500 filings by U.S. pension plans, I estimated a model of contributions to pension plans as ln(1 + c i ) = α 0 + U i α 1 + PD i α 2 + e i Where the subscript i indicates the
STAT 512 sp 2018 Lec 11 R Supplement Karl Gregory 4/18/2018
 STAT 512 sp 2018 Lec 11 R Supplement Karl Gregory 4/18/2018 and s for the Gamma, Beta, and Weibull distributions Gamma distribution If X 1,..., X n is a random sample from the Gamma(α, β) distribution,
Hierarchical Generalized Linear Models. Measurement Incorporated Hierarchical Linear Models Workshop
 Hierarchical Generalized Linear Models Measurement Incorporated Hierarchical Linear Models Workshop Hierarchical Generalized Linear Models So now we are moving on to the more advanced type topics. To begin
Session 178 TS, Stats for Health Actuaries. Moderator: Ian G. Duncan, FSA, FCA, FCIA, FIA, MAAA. Presenter: Joan C. Barrett, FSA, MAAA
 Session 178 TS, Stats for Health Actuaries Moderator: Ian G. Duncan, FSA, FCA, FCIA, FIA, MAAA Presenter: Joan C. Barrett, FSA, MAAA Session 178 Statistics for Health Actuaries October 14, 2015 Presented
Maximum Likelihood Estimation Richard Williams, University of Notre Dame, https://www3.nd.edu/~rwilliam/ Last revised January 13, 2018
 Maximum Likelihood Estimation Richard Williams, University of otre Dame, https://www3.nd.edu/~rwilliam/ Last revised January 3, 208 [This handout draws very heavily from Regression Models for Categorical
Modelling Factors Affecting Probability of Loan Default: A Quantitative Analysis of the Kenyan Students' Loan
 International Journal of Statistical Distributions and Applications 2018; 4(2): 29-37 http://www.sciencepublishinggroup.com/j/ijsda doi: 10.11648/j.ijsd.20180402.11 ISSN: 2472-3487 (Print); ISSN: 2472-3509
CHAPTER 12 EXAMPLES: MONTE CARLO SIMULATION STUDIES
 Examples: Monte Carlo Simulation Studies CHAPTER 12 EXAMPLES: MONTE CARLO SIMULATION STUDIES Monte Carlo simulation studies are often used for methodological investigations of the performance of statistical
Econometric Methods for Valuation Analysis
 Econometric Methods for Valuation Analysis Margarita Genius Dept of Economics M. Genius (Univ. of Crete) Econometric Methods for Valuation Analysis Cagliari, 2017 1 / 25 Outline We will consider econometric
Market Variables and Financial Distress. Giovanni Fernandez Stetson University
 Market Variables and Financial Distress Giovanni Fernandez Stetson University In this paper, I investigate the predictive ability of market variables in correctly predicting and distinguishing going concern
Final Exam Suggested Solutions
 University of Washington Fall 003 Department of Economics Eric Zivot Economics 483 Final Exam Suggested Solutions This is a closed book and closed note exam. However, you are allowed one page of handwritten
Final Exam - section 1. Thursday, December hours, 30 minutes
 Econometrics, ECON312 San Francisco State University Michael Bar Fall 2013 Final Exam - section 1 Thursday, December 19 1 hours, 30 minutes Name: Instructions 1. This is closed book, closed notes exam.
Introduction to POL 217
 Introduction to POL 217 Brad Jones 1 1 Department of Political Science University of California, Davis January 9, 2007 Topics of Course Outline Models for Categorical Data. Topics of Course Models for
Anexos. Pruebas de estacionariedad. Null Hypothesis: TES has a unit root Exogenous: Constant Lag Length: 0 (Automatic - based on SIC, maxlag=9)
") Anexos Pruebas de estacionariedad Null Hypothesis: TES has a unit root Augmented Dickey-Fuller test statistic -1.739333 0.4042 Test critical values: 1% level -3.610453 5% level -2.938987 10% level -2.607932
Anexos Pruebas de estacionariedad Null Hypothesis: TES has a unit root Augmented Dickey-Fuller test statistic -1.739333 0.4042 Test critical values: 1% level -3.610453 5% level -2.938987 10% level -2.607932
A Comparison of Univariate Probit and Logit. Models Using Simulation
 Applied Mathematical Sciences, Vol. 12, 2018, no. 4, 185-204 HIKARI Ltd, www.m-hikari.com https://doi.org/10.12988/ams.2018.818 A Comparison of Univariate Probit and Logit Models Using Simulation Abeer
Financial Literacy in Urban India: A Case Study of Bohra Community in Mumbai
 MPRA Munich Personal RePEc Archive Financial Literacy in Urban India: A Case Study of Bohra Community in Mumbai Tirupati Basutkar Ramanand Arya D. A. V. College, Mumbai, India 8 January 2016 Online at
Panel Data. November 15, The panel is balanced if all individuals have a complete set of observations, otherwise the panel is unbalanced.
 Panel Data November 15, 2018 1 Panel data Panel data are obsevations of the same individual on different dates. time Individ 1 Individ 2 Individ 3 individuals The panel is balanced if all individuals have
Extension Analysis. Lauren Goodwin Advisor: Steve Cherry. Spring Introduction and Background Filing Basics... 2
 Extension Analysis Lauren Goodwin Advisor: Steve Cherry Spring 2015 Contents 1 Introduction and Background 2 1.1 Filing Basics............................................. 2 2 Objectives and Questions
The University of Chicago, Booth School of Business Business 41202, Spring Quarter 2013, Mr. Ruey S. Tsay. Final Exam
 The University of Chicago, Booth School of Business Business 41202, Spring Quarter 2013, Mr. Ruey S. Tsay Final Exam Booth Honor Code: I pledge my honor that I have not violated the Honor Code during this
Duration Models: Parametric Models
 Duration Models: Parametric Models Brad 1 1 Department of Political Science University of California, Davis January 28, 2011 Parametric Models Some Motivation for Parametrics Consider the hazard rate:
Regression Model Assumptions Solutions
 Regression Model Assumptions Solutions Below are the solutions to these exercises on model diagnostics using residual plots. # Exercise 1 # data("cars") head(cars) speed dist 1 4 2 2 4 10 3 7 4 4 7 22
Booth School of Business, University of Chicago Business 41202, Spring Quarter 2014, Mr. Ruey S. Tsay. Solutions to Midterm
 Booth School of Business, University of Chicago Business 41202, Spring Quarter 2014, Mr. Ruey S. Tsay Solutions to Midterm Problem A: (30 pts) Answer briefly the following questions. Each question has
MODEL SELECTION CRITERIA IN R:
 1. R 2 statistics We may use MODEL SELECTION CRITERIA IN R R 2 = SS R SS T = 1 SS Res SS T or R 2 Adj = 1 SS Res/(n p) SS T /(n 1) = 1 ( ) n 1 (1 R 2 ). n p where p is the total number of parameters. R
Logistic Regression Analysis
 Revised July 2018 Logistic Regression Analysis This set of notes shows how to use Stata to estimate a logistic regression equation. It assumes that you have set Stata up on your computer (see the Getting
Lecture Note: Analysis of Financial Time Series Spring 2017, Ruey S. Tsay
 Lecture Note: Analysis of Financial Time Series Spring 2017, Ruey S. Tsay Seasonal Time Series: TS with periodic patterns and useful in predicting quarterly earnings pricing weather-related derivatives
sociology SO5032 Quantitative Research Methods Brendan Halpin, Sociology, University of Limerick Spring 2018 SO5032 Quantitative Research Methods
 1 SO5032 Quantitative Research Methods Brendan Halpin, Sociology, University of Limerick Spring 2018 Lecture 10: Multinomial regression baseline category extension of binary What if we have multiple possible
STAT 453/653 Homework 6 Solutions
 1 STAT 453/653 Homework 6 Solutions By Virajitha Karnatapu Ajay Kumar November 4, 2015 4.3) In the first nine decades of the twentieth century in baseball s National League, the percentage of times the