Lampiran 1 Data Efektivits BPHTB
|
|
|
- Paul Melton
- 5 years ago
- Views:
Transcription
1 Lampiran 1 Data Efektivits BPHTB No Kecamatan Semester 1 Tahun 2011 Semester 2 Tahun 2011 Semester 1 Tahun 2012 Semester 2 Tahun 2012 Realisasi Potensi % Realisasi Potensi % Realisasi Potensi % Realisasi Potensi % 1 Babahrot Rp Rp ,27 Rp Rp ,16 Rp Rp ,94 Rp Rp ,56 2 Blangpidie Rp Rp ,82 Rp Rp ,07 Rp Rp ,63 Rp Rp ,42 3 Jeumpa Rp Rp ,91 Rp Rp ,60 Rp Rp ,79 Rp Rp ,71 4 Kuala Batee Rp Rp ,91 Rp Rp ,15 Rp Rp ,04 Rp Rp ,83 5 Lembah Sabil Rp Rp ,76 Rp Rp ,13 Rp Rp ,31 Rp Rp ,83 6 Manggeng Rp Rp ,36 Rp Rp ,05 Rp Rp ,12 Rp Rp ,08 7 Setia Rp Rp ,61 Rp Rp ,64 Rp Rp ,07 Rp Rp ,54 8 Susoh Rp Rp ,27 Rp Rp ,10 Rp Rp ,59 Rp Rp ,36 9 Tangan-Tangan Rp Rp ,69 Rp Rp ,99 Rp Rp ,87 Rp Rp ,87
2 Lampiran 2 Data Kontribusi BPHTb No Kecamatan Semester 1 Tahun 2011 Semester 2 Tahun 2011 Semester 1 Tahun 2012 Semester 2 Tahun 2012 Realisasi PAD % Realisasi PAD % Realisasi PAD % Realisasi PAD % 1 Babahrot Rp Rp ,73 Rp Rp ,64 Rp Rp ,78 Rp Rp ,00 2 Blangpidie Rp Rp ,43 Rp Rp ,13 Rp Rp ,73 Rp Rp ,41 3 Jeumpa Rp Rp ,78 Rp Rp ,87 Rp Rp ,03 Rp Rp ,31 4 Kuala Batee Rp Rp ,85 Rp Rp ,47 Rp Rp ,98 Rp Rp ,08 5 Lembah Sabil Rp Rp ,74 Rp Rp ,07 Rp Rp ,30 Rp Rp ,59 6 Manggeng Rp Rp ,13 Rp Rp ,87 Rp Rp ,80 Rp Rp ,76 7 Setia Rp Rp ,16 Rp Rp ,71 Rp Rp ,37 Rp Rp ,42 8 Susoh Rp Rp ,42 Rp Rp ,25 Rp Rp ,35 Rp Rp ,04 9 Tangan-Tangan Rp Rp ,10 Rp Rp ,92 Rp Rp ,75 Rp Rp ,59
3 LAMPIRAN 3 DESKRIPTIF STATISTIK DESCRIPTIVES VARIABLES=XI X2 Z Y /STATISTICS=MEAN STDDEV VARIANCE RANGE MIN MAX SEMEAN. Descriptives Notes Output Created 01-Jul :58:41 Comments Input Active Dataset DataSet0 Filter <none> Weight <none> Split File <none> N of Rows in Working 36 Missing Value Handling Definition of Missing User defined missing values are Cases Used All non-missing data are used. Syntax DESCRIPTIVES VARIABLES=XI Resources Processor Time 00:00: Elapsed Time 00:00: [DataSet0] Descriptive Statistics N Range Minimum Maximum Mean Std. Deviation Variance Statistic Statistic Statistic Statistic Statistic Std. Error Statistic Statistic XI X Z E E E6 Y E E E6 Valid N 36
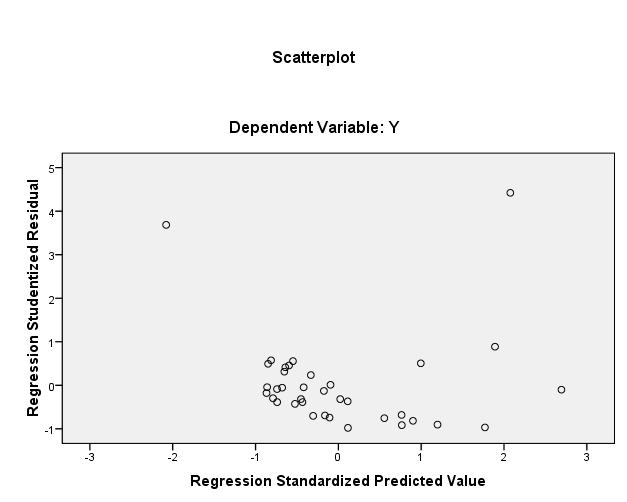
4 REGRESSION /DESCRIPTIVES MEAN STDDEV CORR SIG N /MISSING LISTWISE /STATISTICS COEFF OUTS R ANOVA COLLIN TOL /CRITERIA=PIN(.05) POUT(.10) /NOORIGIN /DEPENDENT Y /METHOD=ENTER X1 X2 /SCATTERPLOT=(*SRESID,*ZPRED) /RESIDUALS DURBIN HIST(ZRESID) NORM(ZRESID) /SAVE RESID. Regression [DataSet5] Descriptive Statistics Mean Std. Deviation N LAMPIRAN - 4 ANALISIS REGRESI BERGANDA H1 Y E X X Correlations Y X1 X2 Pearson Correlation Y X X Sig. (1-tailed) Y X X N Y X X Variables Entered/Removed b Model Variables Entered Variables Removed Method 1 X2, X1 a. Enter a. All requested variables entered. Model Summary b Model R R Square Adjusted R Square Std. Error of the Estimate Durbin-Watson a a. Predictors: (Constant), X2, X1 ANOVA b Model Sum of Squares df Mean Square F Sig. 1 Regression 2.496E E a Residual 1.614E Total 4.110E7 35 a. Predictors: (Constant), X2, X1
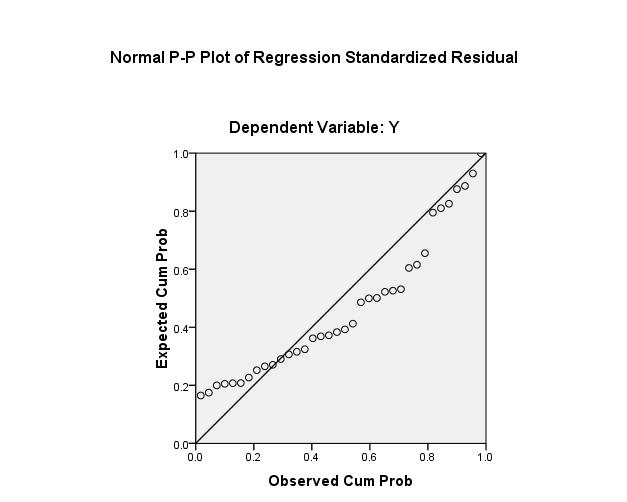
5 Model Unstandardized Coefficients Coefficients a Standardized Coefficients Collinearity Statistics B Std. Error Beta t Sig. Tolerance VIF 1 (Constant) X X2 a. Dependent Variable: Y Residuals Statistics a Minimum Maximum Mean Std. Deviation N Predicted Value E E E Std. Predicted Value Standard Error of Predicted Adjusted Predicted Value E E E Residual E E Std. Residual Stud. Residual Deleted Residual E E E Stud. Deleted Residual Mahal. Distance Cook's Distance Centered Leverage Value a. Dependent Variable: Y Charts
6
7 NPAR TESTS /K-S(NORMAL)=RES_6 /MISSING ANALYSIS. HASIL UJI NORMALITAS H1 NPar Tests [DataSet5] One-Sample Kolmogorov-Smirnov Test Unstandardized Residual N 36 Normal Parameters a Mean Std. Deviation E2 Most Extreme Differences Absolute.222 Positive.222 Negative Kolmogorov-Smirnov Z Asymp. Sig. (2-tailed).058 a. Test distribution is Normal.
8 COMPUTE AbsUiii=ABS(RES_6). EXECUTE. REGRESSION /DESCRIPTIVES MEAN STDDEV CORR SIG N /MISSING LISTWISE /STATISTICS COEFF OUTS R ANOVA COLLIN TOL /CRITERIA=PIN(.05) POUT(.10) /NOORIGIN /DEPENDENT AbsUiii /METHOD=ENTER X1 X2 /SCATTERPLOT=(*SRESID,*ZPRED) /RESIDUALS DURBIN HIST(ZRESID) NORM(ZRESID) /SAVE RESID. Regression [DataSet5] LAMPIRAN 5 HASIL UJI GLEJSER H1 Coefficients a Unstandardized Standardized Collinearity Statistics Model B Std. Error Beta t Sig. Tolerance VIF 1 (Constan X X a. Dependent Variable: AbsUiii
9 LAMPIRAN - 6 ANALISIS REGRESI BERGANDA H2 MODEL I DENGAN MRA REGRESSION /DESCRIPTIVES MEAN STDDEV CORR SIG N /MISSING LISTWISE /STATISTICS COEFF OUTS R ANOVA COLLIN TOL /CRITERIA=PIN(.05) POUT(.10) /NOORIGIN /DEPENDENT Y /METHOD=ENTER X1 X2 Z /SCATTERPLOT=(*SRESID,*ZPRED) /RESIDUALS DURBIN HIST(ZRESID) NORM(ZRESID) /SAVE RESID. Regression [DataSet5] Descriptive Statistics Mean Std. Deviation N Y E X X Z E Correlations Y X1 X2 Z Pearson Correlation Y X X Z Sig. (1-tailed) Y X X Z N Y X X Z Variables Entered/Removed b Model Variables Entered Variables Removed Method 1 Z, X2, X1 a. Enter a. All requested variables entered. Model Summary b Model R R Square Adjusted R Square Std. Error of the Estimate Durbin-Watson a a. Predictors: (Constant), Z, X2, X1
, Z, X2, X1 Coefficients a Unstandardized Standardized Collinearity Statistics Model B Std. Error Beta t Sig. Tolerance VIF 1 (Consta -359.985 452.564 -.795.432 X1 24.037 12.246.")
10 ANOVA b Model Sum of Squares df Mean Square F Sig. 1 Regression 2.783E a Residual 1.327E Total 4.110E7 35 a. Predictors: (Constant), Z, X2, X1 Coefficients a Unstandardized Standardized Collinearity Statistics Model B Std. Error Beta t Sig. Tolerance VIF 1 (Consta X X Z a. Dependent Variable: Y Residuals Statistics a Minimum Maximum Mean Std. Deviation N Predicted Value E E E Std. Predicted Value Standard Error of Predicted Adjusted Predicted Value E E E Residual E E Std. Residual Stud. Residual Deleted Residual E E E Stud. Deleted Residual Mahal. Distance Cook's Distance Centered Leverage Value a. Dependent Variable: Y Charts
11
12 HASIL UJI NORMALITAS H2 MODEL I DENGAN MRA NPAR TESTS /K-S(NORMAL)=RES_1 /MISSING ANALYSIS. NPar Tests [DataSet5] One-Sample Kolmogorov-Smirnov Test Unstandardized Residual N 36 Normal Parameters a Mean Std. Deviation E2 Most Extreme Differences Absolute.190 Positive.190 Negative Kolmogorov-Smirnov Z Asymp. Sig. (2-tailed).150 a. Test distribution is Normal.
13 LAMPIRAN - 7 HASIL UJI GLEJSER H2 MODEL I DENGAN MRA COMPUTE AbsUi=ABS(RES_1). EXECUTE. REGRESSION /DESCRIPTIVES MEAN STDDEV CORR SIG N /MISSING LISTWISE /STATISTICS COEFF OUTS R ANOVA COLLIN TOL /CRITERIA=PIN(.05) POUT(.10) /NOORIGIN /DEPENDENT AbsUi /METHOD=ENTER X1 X2 Z /SCATTERPLOT=(*SRESID,*ZPRED) /RESIDUALS DURBIN HIST(ZRESID) NORM(ZRESID) /SAVE RESID. Regression [DataSet5] Coefficients a Model 1 (Consta nt) Unstandardized Coefficients Standardized Coefficients Collinearity Statistics B Std. Error Beta t Sig. Tolerance VIF X X Z a. Dependent Variable: AbsUi
14 LAMPIRAN 8 ANALISIS REGRESI BERGANDA H2 MODEL II DENGAN MRA COMPUTE X1Z=X1 * Z. EXECUTE. COMPUTE X2Z=X2 * Z. EXECUTE. REGRESSION /DESCRIPTIVES MEAN STDDEV CORR SIG N /MISSING LISTWISE /STATISTICS COEFF OUTS R ANOVA COLLIN TOL ZPP /CRITERIA=PIN(.05) POUT(.10) /NOORIGIN /DEPENDENT Y /METHOD=ENTER X1 X2 Z X1Z X2Z /SCATTERPLOT=(*SRESID,*ZPRED) /RESIDUALS DURBIN HIST(ZRESID) NORM(ZRESID) /SAVE RESID. Regression [DataSet5] Descriptive Statistics Mean Std. Deviation N Y E X X Z E X1Z E E5 36 X2Z E Correlations Y X1 X2 Z X1Z X2Z Pearson Correlation Y X X Z X1Z X2Z Sig. (1-tailed) Y X X Z X1Z X2Z N Y X X Z X1Z X2Z
15 Variables Entered/Removed b Model Variables Entered Variables Removed Method 1 X2Z, Z, X1, X2, X1Z a. Enter a. All requested variables entered. Model Summary b Model R R Square Adjusted R Square Std. Error of the Durbin-Watson a a. Predictors: (Constant), X2Z, Z, X1, X2, X1Z ANOVA b Model Sum of Squares df Mean Square F Sig. 1 Regression 3.165E a Residual Total 4.110E7 35 a. Predictors: (Constant), X2Z, Z, X1, X2, X1Z Coefficients a Correlations Unstandardized Standardized Collinearity Statistics Partial B Std. Error Beta T Sig. Tolerance VIF (Constant) X X Z X1Z X2Z a. Dependent Variable: Y Residuals Statistics a Minimum Maximum Mean Std. Deviation N Predicted Value E E E Std. Predicted Value Standard Error of Predicted Adjusted Predicted Value E E E Residual E E Std. Residual Stud. Residual Deleted Residual E E E Stud. Deleted Residual Mahal. Distance Cook's Distance Centered Leverage Value a. Dependent Variable: Y
16 Charts
17 ANALISIS REGRESI BERGANDA H2 MODEL II DENGAN MRA LN COMPUTE LNX1=LN(X1). EXECUTE. COMPUTE LNX2=LN(X2). EXECUTE. COMPUTE LNZ=LN(Z). EXECUTE. COMPUTE LNX1Z=LN(X1Z). EXECUTE. COMPUTE LNX2Z=LN(X2Z). EXECUTE. REGRESSION /DESCRIPTIVES MEAN STDDEV CORR SIG N /MISSING LISTWISE /STATISTICS COEFF OUTS R ANOVA COLLIN TOL /CRITERIA=PIN(.05) POUT(.10) /NOORIGIN /DEPENDENT Y /METHOD=ENTER LNX1 LNX2 LNZ LNX1Z LNX2Z /SCATTERPLOT=(*SRESID,*ZPRED) /RESIDUALS DURBIN HIST(ZRESID) NORM(ZRESID) /SAVE RESID. Regression [DataSet5] Descriptive Statistics Mean Std. Deviation N Y E LNX LNX LNZ LNX1Z LNX2Z Correlations Y LNX1 LNX2 LNZ LNX1Z LNX2Z Pearson Correlation Y LNX LNX LNZ LNX1Z LNX2Z Sig. (1-tailed) Y LNX LNX LNZ LNX1Z LNX2Z N Y LNX LNX LNZ LNX1Z LNX2Z
18 Variables Entered/Removed b Model Variables Entered Variables Removed Method 1 LNX2Z, LNZ, LNX1 a. Enter a. Tolerance =,000 limits reached. Model Summary b Model R R Square Adjusted R Square Std. Error of the Estimate Durbin-Watson a a. Predictors: (Constant), LNX2Z, LNZ, LNX1 ANOVA b Model Sum of Squares df Mean Square F Sig. 1 Regression 2.950E a Residual 1.160E Total 4.110E7 35 a. Predictors: (Constant), LNX2Z, LNZ, LNX1 Model Coefficients a Unstandardized Standardized Collinearity Statistics B Std. Error Beta T Sig. Tolerance VIF 1 (Constant) LNX LNZ LNX2Z a. Dependent Variable: Y Excluded Variables b Collinearity Statistics Model Beta In t Sig. Partial Correlation Tolerance VIF Minimum 1 LNX2. a LNX1Z. a a. Predictors in the Model: (Constant), LNX2Z, LNZ, LNX1 Residuals Statistics a Minimum Maximum Mean Std. Deviation N Predicted Value E E E Std. Predicted Value Standard Error of Predicted Value Adjusted Predicted Value E E E Residual E E Std. Residual Stud. Residual Deleted Residual E E E Stud. Deleted Residual Mahal. Distance Cook's Distance Centered Leverage Value a. Dependent Variable: Y
19 Charts
20 HASIL UJI NORMALITAS H2 MODEL II DENGAN MRA NPAR TESTS /K-S(NORMAL)=RES_4 /MISSING ANALYSIS. NPar Tests [DataSet5] One-Sample Kolmogorov-Smirnov Test Unstandardized Residual N 36 Normal Parameters a Mean Std. Deviation E2 Most Extreme Differences Absolute.173 Positive.173 Negative Kolmogorov-Smirnov Z Asymp. Sig. (2-tailed).233 a. Test distribution is Normal.
21 LAMPIRAN - 9 HASIL UJI GLEJSER H2 MODEL II DENGAN MRA COMPUTE AbsUii=ABS(RES_4). EXECUTE. REGRESSION /DESCRIPTIVES MEAN STDDEV CORR SIG N /MISSING LISTWISE /STATISTICS COEFF OUTS R ANOVA COLLIN TOL /CRITERIA=PIN(.05) POUT(.10) /NOORIGIN /DEPENDENT AbsUii /METHOD=ENTER LNX1 LNX2 LNZ LNX1Z LNX2Z /SCATTERPLOT=(*SRESID,*ZPRED) /RESIDUALS DURBIN HIST(ZRESID) NORM(ZRESID) /SAVE RESID. Regression [DataSet5] Coefficients a Unstandardized Standardized Collinearity Statistics Model B Std. Error Beta T Sig. Tolerance VIF 1 (Constant) LNX LNZ LNX2Z a. Dependent Variable:
LAMPIRAN 1: OUTPUT SPSS
 LAMPIRAN : OUTPUT SPSS Statistik Deskriptif Descriptive Statistics N Minimum Maximum Mean Std. Deviation Daabs 95.0022.0902.03744.0226569 CAR 95.0789.339.43306.0463305 RORA 95 -.447.8074.052244.29802 ROA
Sales Sales
 lix Lampiran I PT. Akasha Wira International Tbk PT. Tiga Pilar Sejahtera Food Tbk PT. Cahaya Kalbar Tbk 2010 2009 2008 2007 2010 2009 2008 2007 2010 2009 2008 2007 Sales 219 134 130 132 705 533 489 484
LAMPIRAN IV PENGUJIAN HIPOTESIS
 LAMPIRAN IV PENGUJIAN HIPOTESIS 89 NORMALITAS I Explore Case Processing Summary Cases Valid Missing Total N Percent N Percent N Percent 390 00.0% 0.0% 390 00.0% Descriptives Mean 95% Confidence Interval
GGraph. Males Only. Premium. Experience. GGraph. Gender. 1 0: R 2 Linear = : R 2 Linear = Page 1
 GGraph 9 Gender : R Linear =.43 : R Linear =.769 8 7 6 5 4 3 5 5 Males Only GGraph Page R Linear =.43 R Loess 9 8 7 6 5 4 5 5 Explore Case Processing Summary Cases Valid Missing Total N Percent N Percent
OLAH DATA INSTRUMEN PENELITIAN DENGAN SPSS VERSI 16.0
 OLAH DATA INSTRUMEN PENELITIAN DENGAN SPSS VERSI 16.0 DESKRIPTIF Variabel Customer Relationship Marketing Descriptive Statistics N Minimum Maximum Sum Mean Std. Deviation Skewness Kurtosis Statistic Statistic
LAMPIRAN. TAHUN TANGGAL Return Pasar
 LAMPIRAN Lampiran 1 : Return Pasar (IHSG) TAHUN TANGGAL Return Pasar 2013 2014 Januari 0,032 Februari 0,077 Maret 0,030 April 0,019 Mei 0,007 Juni -0,049 Juli -0,043 Agustus -0,090 September 0,029 Oktober
Tabel Penentuan Sampel Penelitian
 LAMPIRAN I No Tabel Penentuan Sampel Penelitian Emiten Kriteria 1 2 3 Sampel 1. Astra Agro Lestari Tbk. 1 2. Adaro Energy Tbk. 3. Aneka Tambang (Persero) Tbk. 2 4. Astra Internasional Tbk. 3 5. Alam Sutera
Daftar Perusahaan yang Mengadopsi ESOP pada periode Tahun pengadopsian ESOP
 Lampiran 1 Daftar Perusahaan yang Mengadopsi ESOP pada periode 2004-2012 No. Daftar Emiten Tahun pengadopsian ESOP Jenis 1 ADHI 2004 Employee Stock 2 BBRI 2004 Employee Stock 3 BMRI 2004 Employee Stock
The Influence of Size, Return on Equity, and Leverage on the disclosure of the Corporate Social Responsibility (CSR) in Manufacturing Companies
 in Manufacturing Companies") International Journal of Education and Research Vol. 5 No. 8 August 2017 The Influence of Size, Return on Equity, and Leverage on the disclosure of the Corporate Social Responsibility (CSR) in Manufacturing
International Journal of Education and Research Vol. 5 No. 8 August 2017 The Influence of Size, Return on Equity, and Leverage on the disclosure of the Corporate Social Responsibility (CSR) in Manufacturing
Lampiran 1. Tabulasi Data
 Lampiran 1. Tabulasi Data Tahun PDRB PDRBt-1 PAD BH DAU INF 2001:1 372696.65 372696.65 1005.61 2684.67 26072.42 0.87 2001:4 376433.52 372696.65 1000.96 2858.50 28795.27 1.08 2001:8 387533.83 376433.52
LAMPIRAN PERHITUNGAN EVIEWS
 LAMPIRAN PERHITUNGAN EVIEWS DESCRIPTIVE PK PDRB TP TKM Mean 12.22450 10.16048 14.02443 12.63677 Median 12.41945 10.09179 14.22736 12.61400 Maximum 13.53955 12.73508 15.62581 13.16721 Minimum 10.34509 8.579417
THE EFFECT OF NPL, CAR, LDR, OER AND NIM TO BANKING RETURN ON ASSET
 International Journal of Economics, Commerce and Management United Kingdom Vol. VI, Issue 3, March 2018 http://ijecm.co.uk/ ISSN 2348 0386 THE EFFECT OF NPL, CAR, LDR, OER AND NIM TO BANKING RETURN ON
Ceria Minati Singarimbun and Ana Noveria School of Business and Management Institut Teknologi Bandung, Indonesia
 JOURNAL OF BUSINESS AND MANAGEMENT Vol. 3, No.4, 2014: 401-409 THE RELATIONSHIP AMONG OIL PRICES, GOLD PRICES, GROSS DOMESTIC PRODUCT, AND INTEREST RATE TO THE STOCK MARKET RETURN OF BASIC INDUSTRY AND
SHARE PRICE ANALYST WITH PBV, DER, AND EPS AT INITIAL PUBLIC OFFERING
 SHARE PRICE ANALYST WITH PBV, DER, AND EPS AT INITIAL PUBLIC OFFERING Kriswanto Accounting Department, Faculty of Economic and Comunication, Bina Nusantara University Jln. K.H. Syahdan No 9, Palmerah,
Valid Missing Total. N Percent N Percent N Percent , ,0% 0,0% 2 100,0% 1, ,0% 0,0% 2 100,0% 2, ,0% 0,0% 5 100,0%
 dimension1 GET FILE= validacaonestscoremédico.sav' (só com os 59 doentes) /COMPRESSED. SORT CASES BY UMcpEVA (D). EXAMINE VARIABLES=UMcpEVA BY NoRespostasSignif /PLOT BOXPLOT HISTOGRAM NPPLOT /COMPARE
One Way ANOVA with Tukey Post hoc. Case Processing Summary
 EXAMINE VARIABLES=Score BY Group /PLOT BOXPLOT NPPLOT /COMPARE GROUP /STATISTICS DESCRIPTIVES /CINTERVAL 95 /MISSING LISTWISE /NOTOTAL. Explore Group One Way ANOVA with Tukey Post hoc Case Processing Summary
Lampiran 1 Lampiran 1 Data Keuangan Bank konvensional
 Lampiran 1 Lampiran 1 Data Keuangan Bank konvensional BANK YEAR Z-Score TOTAL ASET (milyar rupiah) ROA (%) NPL (%) BI RATE (%) KURS (rupiah) BNI 1.9 5.51.9 1.9.5 919.5 11 7.71 99.5.9.17 915.7 1 7.7 333.3.9.
Dividend Policy and Stock Price to the Company Value in Pharmaceutical Company s Sub Sector Listed in Indonesia Stock Exchange
 International Journal of Law and Society 2018; 1(1): 16-23 http://www.sciencepublishinggroup.com/j/ijls doi: 10.11648/j.ijls.20180101.13 Dividend Policy and Stock Price to the Company Value in Pharmaceutical
INTERNATIONAL JOURNAL OF INNOVATIVE RESEARCH AND KNOWLEDGE
 INTERNATIONAL JOURNAL OF INNOVATIVE RESEARCH AND KNOWLEDGE ISSN-2213-1356 www.ijirk.com THE INFLUENCE OF DIVIDEND POLICY, INVESTMENT OPPORTUNITY, AND PROFITABILITY OF DEBT POLICY TOWARD INDUSTRIES IN CONSUMPTION
Lampiran I Data. PDRB (Juta Rupiah) PMA (Juta Rupiah) PMDN (Juta Rupiah) Tahun. Luas Sawit (ha)
 PMA (Juta Rupiah) PMDN (Juta Rupiah) Tahun. Luas Sawit (ha)") LAMPIRAN Lampiran I Data Tahun PDRB (Juta Rupiah) PMDN (Juta Rupiah) PMA (Juta Rupiah) Luas Sawit (ha) Angkatan Kerja (Jiwa) 1986 24698580 84581 8438 19733 1237717 1987 26991625 106279 10128 22122 1243818
LAMPIRAN Lampiran I Data Tahun PDRB (Juta Rupiah) PMDN (Juta Rupiah) PMA (Juta Rupiah) Luas Sawit (ha) Angkatan Kerja (Jiwa) 1986 24698580 84581 8438 19733 1237717 1987 26991625 106279 10128 22122 1243818
JOURNAL RESEARCH AND ANALYSIS : MANAGEMENT AND BUSINESS e-issn: dan p-issn:
 JOURNAL RESEARCH AND ANALYSIS : MANAGEMENT AND BUSINESS e-issn: 2597-6621 dan p-issn: 0000-0000 This work is licensed under a Creative Commons Attribution-NonCommercial 4.0 International License. Effect
Logit Analysis. Using vttown.dta. Albert Satorra, UPF
 Logit Analysis Using vttown.dta Logit Regression Odds ratio The most common way of interpreting a logit is to convert it to an odds ratio using the exp() function. One can convert back using the ln()
ANALYSIS OF FACTORS AFFECTING DECISION TO PROVIDE MICRO CREDITS AT DANAMON SAVINGS AND LOAN SURABAYA CLUSTER
 International Journal of Economics, Commerce and Management United Kingdom Vol. VI, Issue 9, September 2018 http://ijecm.co.uk/ ISSN 2348 0386 ANALYSIS OF FACTORS AFFECTING DECISION TO PROVIDE MICRO CREDITS
Ac. J. Acco. Eco. Res. Vol. 3, Issue 2, , 2014 ISSN:
 2014, World of Researches Publication Ac. J. Acco. Eco. Res. Vol. 3, Issue 2, 118-128, 2014 ISSN: 2333-0783 Academic Journal of Accounting and Economics Researches www.worldofresearches.com Influence of
LAMPIRAN 1. adalah 26,7 %. Jumlah energi 1 gr Lemak = 9 Kkal. Perhitungan asam lemak trans 5 % = 26,7 % X 84,425 gr X 9 Kkal/gr = 202,86
 LAMPIRAN 1 Komposisi diet hewan coba (Sumber Research Diets Inc, 21 Oktober 2011 ) Komponen pangan Jumlah gm % kcal % gm % kcal % Protein 24 20 24 20 Carbohydrate 41 35 41 35 Fat 24 45 24 45 Total 100
Advances in Environmental Biology
 AENSI Journals Advances in Environmental Biology Journal home page: http://www.aensiweb.com/aeb.html Investigating the Relationship between Profit Split Method and Stock Returns in the Pharmaceutical Industry
SAS Simple Linear Regression Example
 SAS Simple Linear Regression Example This handout gives examples of how to use SAS to generate a simple linear regression plot, check the correlation between two variables, fit a simple linear regression
A Survey of the Relationship between Earnings Management and the Cost of Capital in Companies Listed on the Tehran Stock Exchange
 AENSI Journals Advances in Environmental Biology Journal home page: http://www.aensiweb.com/aeb.html A Survey of the Relationship between Earnings Management and the Cost of Capital in Companies Listed
THE EFFECT OF GROSS DOMESTIC PRODUCT CONSTANT PRICES AND INFLATION ON VALUE ADDED TAX REVENUE IN INDONESIA
 I J A B E R, Vol. 13, No. 7 (2015): 5139-5157 THE EFFECT OF GROSS DOMESTIC PRODUCT CONSTANT PRICES AND INFLATION ON VALUE ADDED TAX REVENUE IN INDONESIA Hapsari Wulandari 1 and Kus Tri Andyarini 2 Abstract:
The study on the financial leverage effect of GD Power Corp. based on. financing structure
 5th International Conference on Education, Management, Information and Medicine (EMIM 2015) The study on the financial leverage effect of GD Power Corp. based on financing structure Xin Ling Du 1, a and
HASIL PENELITIAN BERUPA OUTPUT SPSS
 VARIABEL INDEPENDEN HASIL PENELITIAN BERUPA OUTPUT SPSS 1. RATA-RATA ASUPAN ENERGI UJI NORMALITAS DATA Rata2AsupanE 70 100.0% 0.0% 70 100.0% Descriptives Rata2AsupanE 1375.77 44.068 Lower Bound 1287.85
Copyrighted 2007 FINANCIAL VARIABLES EFFECT ON THE U.S. GROSS PRIVATE DOMESTIC INVESTMENT (GPDI)
") FINANCIAL VARIABLES EFFECT ON THE U.S. GROSS PRIVATE DOMESTIC INVESTMENT (GPDI) 1959-21 Byron E. Bell Department of Mathematics, Olive-Harvey College Chicago, Illinois, 6628, USA Abstract I studied what
FINANCIAL VARIABLES EFFECT ON THE U.S. GROSS PRIVATE DOMESTIC INVESTMENT (GPDI) 1959-21 Byron E. Bell Department of Mathematics, Olive-Harvey College Chicago, Illinois, 6628, USA Abstract I studied what
Impact of Macroeconomic Determinants on Profitability of Indian Commercial Banks
 Abstract Research Journal of Management Sciences E-ISSN 2319 1171 Impact of Macroeconomic Determinants on Profitability of Indian Commercial Banks Ketan Mulchandani 1* and N.K. Totala 2 1 Institute of
THE ANALYSIS OF THE INTEREST LEVEL, INFLATION, LIQUIDITY, EXCHANGE RATE, AND FINANCIAL WHICH INFLUENCE SHARE IN INDONESIAN STOCK EXCHANCE
 International Journal of Education and Research Vol. 3 No. 2 December 205 THE ANALYSIS OF THE INTEREST LEVEL, INFLATION, LIQUIDITY, EXCHANGE RATE, AND FINANCIAL WHICH INFLUENCE SHARE IN INDONESIAN STOCK
Lampiran 1. No. Emiten Simbol
 Lampiran 1 No. Emiten Simbol 1 PT. Bayer Indonesia Tbk. BYSB 2 PT. Dankos Laboratories Tbk. DNKS 3 PT. Kimia Farma Tbk. KAEF 4 PT. Kalbe Farma Tbk. KLBF 5 PT. Merck Indonesia Tbk. MERK 6 PT. Squibb Indonesia
INTERNATIONAL JOURNAL OF INNOVATIVE RESEARCH AND KNOWLEDGE
 Volume3 Issue4, April208 INTERNATIONAL JOURNAL OF INNOVATIVE RESEARCH AND KNOWLEDGE ISSN223356 www.ijirk.com THE INFLUENCE OF RETURN ON ASSETS, DEBT TO EQUITY RATIO AND SIZE ON INCOME SMOOTHING OF MANUFACTURES
J. Life Sci. Biomed. 4(1): 57-63, , Scienceline Publication ISSN
: 57-63, , Scienceline Publication ISSN") ORIGINAL ARTICLE Received 11 Sep. 2013 Accepted 28Nov. 2013 JLSB Journal of J. Life Sci. Biomed. 4(1): 57-63, 2014 2014, Scienceline Publication Life Science and Biomedicine ISSN 2251-9939 Relationship
ORIGINAL ARTICLE Received 11 Sep. 2013 Accepted 28Nov. 2013 JLSB Journal of J. Life Sci. Biomed. 4(1): 57-63, 2014 2014, Scienceline Publication Life Science and Biomedicine ISSN 2251-9939 Relationship
Role of Dividend of Power to Buy Shares in Companies in Indonesia Stock Exchange
 Vol. 3, No. 2, June 2017, pp. 41 47 ISSN 2393-4913, ISSN On-line 2457-5836 Role of Dividend of Power to Buy Shares in Companies in Indonesia Stock Exchange Iskandar Muda Faculty Economics and Business,
Lampiran 1. Data Penelitian
 LAMPIRAN Lampiran 1. Data Penelitian Tahun Impor PDB KURS DEVISA 1985 5.199,00 2.118.215,40 1.125,00 5.811,00 1986 5.825,00 2.242.661,60 1.641,00 5.841,00 1987 7.209,00 2.353.133,40 1.650,00 5.103,00 1988
The Effects of Financial Constraints and Export Trade on Innovation
 5th International Conference on Education, Management, Information and Medicine (EMIM 2015) The Effects of Financial Constraints and Export Trade on Innovation Performance An Empirical Study Based on Chinese
Data screening, transformations: MRC05
 Dale Berger Data screening, transformations: MRC05 This is a demonstration of data screening and transformations for a regression analysis. Our interest is in predicting current salary from education level
Effect of Budgeting on Public Sector Wage Bill Management by the Government of Kenya
 Journal of Finance and Accounting 206; 4(3): 86-0 http://www.sciencepublishinggroup.com/j/jfa doi: 0.648/j.jfa.2060403. ISSN: 2330-733 (Print); ISSN: 2330-7323 (Online) Effect of Budgeting on Public Sector
DATA VARIABEL PENELITIAN
 68 LAMPIRAN 1 DATA VARIABEL PENELITIAN TAHUN FDI SBI PDRB UNEMP. EXPORT 1983 1834,40 12,74 5915,37 821257 10649,82 1984 1507,08 13,45 6372,17 878380 12455,86 1985 2263,20 13,82 6884,81 857564 10719,35
Factors Impacting Capital Structure in Indonesian Food and Beverage Companies
 SESSION Factors Impacting Capital Structure in Indonesian Food and Beverage Companies Prof. Dr. Euphrasia Susy Suhendra (Gunadarma University, Indonesia) Abstract Capital structure is directly related
LAMPIRAN. Lampiran I
 67 LAMPIRAN Lampiran I Data Volume Impor Jagung Indonesia, Harga Impor Jagung, Produksi Jagung Nasional, Nilai Tukar Rupiah/USD, Produk Domestik Bruto (PDB) per kapita Tahun Y X1 X2 X3 X4 1995 969193.394
The Impact of Abnormal Return towards Dividend Changes with Private Information as a Moderating in Indonesia
 Proceedings of The 7th Annual International Conference (AIC) Syiah Kuala University and The 6th International Conference on Multidisciplinary Research (ICMR) in conjunction with the International Conference
THE EFFECT OF CAR, NPL, LDR, AND INFLATION ON PROFITABILITY OF STATE-OWNED BANKS IN INDONESIA
 International Journal of Economics, Commerce and Management United Kingdom ISSN 2348 0386 Vol. VII, Issue 4, April 2019 http://ijecm.co.uk/ THE EFFECT OF CAR, NPL, LDR, AND INFLATION ON PROFITABILITY OF
The effect of earnings smoothness on manufacturing company s performance
 The Indonesian Accounting Review Vol. 3, No. 2, July 2013, pages 181 192 The effect of earnings smoothness on manufacturing company s performance Riani Yandiarti 1 1 STIE Perbanas Surabaya, Nginden Semolo
LAMPIRAN-LAMPIRAN. A. Perhitungan Return On Asset
 88 LAMPIRAN-LAMPIRAN A. Perhitungan Return On Asset Tahun Perusahaan Laba Bersih Total Aset Laba/Total Aset ROA (% ) 2011 ROA_ADRO 5006470 51315458 0,09756261 9,76 ROA_AKRA 2284080 8308244 0,274917299
The SAS System 11:03 Monday, November 11,
 The SAS System 11:3 Monday, November 11, 213 1 The CONTENTS Procedure Data Set Name BIO.AUTO_PREMIUMS Observations 5 Member Type DATA Variables 3 Engine V9 Indexes Created Monday, November 11, 213 11:4:19
Impact of Fundamental, Risk and Demography on Value of the Firm
 IOSR Journal of Economics and Finance (IOSR-JEF) e-issn: 2321-5933, p-issn: 2321-5925.Volume 8, Issue 2 Ver. IV (Mar. - Apr. 2017), PP 09-16 www.iosrjournals.org Impact of Fundamental, Risk and Demography
Lampiran 1. Data Penelitian
 Lampiran 1. Data Penelitian Tahun 2008 2009 2010 Suku bunga ORI Inflasi BI Rate IHSG Bulan Deposito Rupiah % % Poin % Mei 93,00 10,38 8,25 2444,35 7,04 Jun 90,50 11,03 8,50 2349,10 7,26 Jul 90,50 11,90
DETERMINANTS OF FINANCIAL STRUCTURE OF GREEK COMPANIES
 Gargalis PANAGIOTIS Doctoral School of Economics and Business Administration Alexandru Ioan Cuza University of Iasi, Romania DETERMINANTS OF FINANCIAL STRUCTURE OF GREEK COMPANIES Empirical study Keywords
CHAPTER 4 DATA ANALYSIS Data Hypothesis
 CHAPTER 4 DATA ANALYSIS 4.1. Data Hypothesis The hypothesis for each independent variable to express our expectations about the characteristic of each independent variable and the pay back performance
What Accounts for Dividend Payment in Nigerian Banks
 International Journal of Business, Humanities and Technology Vol. 3 No. 8; December 2013 What Accounts for Dividend Payment in Nigerian Banks NYOR, Terzungwe ADEJUWON Adeyinka Adekunle Department of Accounting
Factors Affecting the Payout Policies of Companies Listed on the Jordanian Stock Exchange Market
 International Journal of Psychology and Cognitive Science 2018; 4(4): 155-167 http://www.aascit.org/journal/ijpcs ISSN: 2472-9450 (Print); ISSN: 2472-9469 (Online) Factors Affecting the Payout Policies
ANALYSIS OF RIGHT ISSUE ANNOUNCEMENT EFFECT TOWARD STOCK PRICE MOVEMENT AND STOCK TRADING VOLUME WITHIN ISSUER IN INDONESIA STOCK EXCHANGE
 Binus Business Review, 7(1), May 2016, 33-38 DOI: 10.21512/bbr.v7i1.1447 P-ISSN: 2087-1228 E-ISSN: 2476-9053 ANALYSIS OF RIGHT ISSUE ANNOUNCEMENT EFFECT TOWARD STOCK PRICE MOVEMENT AND STOCK TRADING VOLUME
EXST7015: Multiple Regression from Snedecor & Cochran (1967) RAW DATA LISTING
 RAW DATA LISTING") Multiple (Linear) Regression Introductory example Page 1 1 options ps=256 ls=132 nocenter nodate nonumber; 3 DATA ONE; 4 TITLE1 ''; 5 INPUT X1 X2 X3 Y; 6 **** LABEL Y ='Plant available phosphorus' 7 X1='Inorganic
Multiple (Linear) Regression Introductory example Page 1 1 options ps=256 ls=132 nocenter nodate nonumber; 3 DATA ONE; 4 TITLE1 ''; 5 INPUT X1 X2 X3 Y; 6 **** LABEL Y ='Plant available phosphorus' 7 X1='Inorganic
FOREIGN INVESTMENT AND EXPORT PERFORMANCE OF INDIAN TEXTILE AND CLOTHING INDUSTRY IN POST QUOTA REGIME
 Indian Journal of Economics & Business, Vol. 15, No. 2, (2016) : 385-391 FOREIGN INVESTMENT AND EXPORT PERFORMANCE OF INDIAN TEXTILE AND CLOTHING INDUSTRY IN POST QUOTA REGIME MEETA MATHUR * AND ANITA
Multiple regression analysis of performance indicators in the ceramic industry
 Available online at www.sciencedirect.com Procedia Economics and Finance 3 ( 2012 ) 509 514 Emerging Markets Queries in Finance and Business Multiple regression analysis of performance indicators in the
SUKUK FUND ISSUANCE ON SHARIA BANKING PERFORMANCE IN INDONESIA
 International Journal of Civil Engineering and Technology (IJCIET) Volume 9, Issue 9, September 2018, pp. 1531 1545, Article ID: IJCIET_09_09_149 Available online at http://www.iaeme.com/ijciet/issues.asp?jtype=ijciet&vtype=9&itype=9
DATA PENELITIAN. Pendapatan Nasional (PDB Perkapita atas Dasar Harga Berlaku) Produksi Bawang Merah Indonesia MB X1 X2 X3 X4 X5 X6
 Produksi Bawang Merah Indonesia MB X1 X2 X3 X4 X5 X6") Lampiran 1 Tahu n Volume Impor Bawang Merah Konsums i Bawang Merah Perkapit a di Indonesi a DATA PENELITIAN Pendapatan Nasional (PDB Perkapita atas Dasar Harga Berlaku) Produksi Bawang Merah Indonesia
Lampiran 1 Tahu n Volume Impor Bawang Merah Konsums i Bawang Merah Perkapit a di Indonesi a DATA PENELITIAN Pendapatan Nasional (PDB Perkapita atas Dasar Harga Berlaku) Produksi Bawang Merah Indonesia
Firm Performance And Risk In Real Estate Industry : Relationship Between Corporate Governance
 MPRA Munich Personal RePEc Archive Firm Performance And Risk In Real Estate Industry : Relationship Between Corporate Governance nur fateha badron universiti utara malaysia 18 April 2017 Online at https://mpra.ub.uni-muenchen.de/78579/
Impact of Terrorism on Foreign Direct Investment in Pakistan
 Impact of Terrorism on Foreign Direct Investment in Pakistan Mian Awais Shahbaz 1, Asifah Javed 1, Amina Dar 1, Tanzeela Sattar 1 1 UCP Business School, University of the Central Punjab, Lahore.Pakistan
Effect of Change Management Practices on the Performance of Road Construction Projects in Rwanda A Case Study of Horizon Construction Company Limited
 International Journal of Scientific and Research Publications, Volume 6, Issue 0, October 206 54 ISSN 2250-353 Effect of Change Management Practices on the Performance of Road Construction Projects in
STUDYING THE RELATIONSHIP BETWEEN COMPANY LIFE CYCLE AND COST OF EQUITY
 Kuwa Chapter of Arabian Journal of Business Management Review www.arabianjbmr.com STUDYING THE RELATIONSHIP BETWEEN COMPANY LIFE CYCLE AND COST OF EQUITY Hossein Karvan M.A. Student of Accounting, Islamic
THE KUALA LUMPUR STOCK EXCHANGE COMPOSITE INDEX (KLSE CI) AND ECONOMIC FORCES
 AND ECONOMIC FORCES") THE KUALA LUMPUR STOCK EXCHANGE COMPOSITE INDEX (KLSE CI) AND ECONOMIC FORCES Shareef Alzaid 1 ABSTRACT An economic climate is a major factor in determining the primary trend of a stock market. The stock
THE KUALA LUMPUR STOCK EXCHANGE COMPOSITE INDEX (KLSE CI) AND ECONOMIC FORCES Shareef Alzaid 1 ABSTRACT An economic climate is a major factor in determining the primary trend of a stock market. The stock
Lampiran 1 : Grafik Data HIV Asli
 Lampiran 1 : Grafik Data HIV Asli 70 60 50 Penderita 40 30 20 10 2007 2008 2009 2010 2011 Tahun HIV Mean 34.15000 Median 31.50000 Maximum 60.00000 Minimum 19.00000 Std. Dev. 10.45057 Skewness 0.584866
Factors that Affect Potential Growth of Canadian Firms
 Journal of Applied Finance & Banking, vol.1, no.4, 2011, 107-123 ISSN: 1792-6580 (print version), 1792-6599 (online) International Scientific Press, 2011 Factors that Affect Potential Growth of Canadian
THE INTERNATIONAL JOURNAL OF BUSINESS & MANAGEMENT
 THE INTERNATIONAL JOURNAL OF BUSINESS & MANAGEMENT The Effect of Dividend Policy on Stock Price Volatility: A Kenyan Perspective Zipporah N. Onsomu Student, MBA (Finance), Bachelor of Commerce, CPA (K),
The Effect of Regional Retributions to the North Sumatera Economic Growth
 International Journal of Progressive Sciences and Technologies (IJPSAT) ISSN: 2509-0119. 2017 International Journals of Sciences and High Technologies http://ijpsat.ijsht-journals.org Vol. 6 No. 1 December
Nur Fitriany Post Graduate Student of Stikubank University Semarang, Indonesia.
 EXPLORING THE FACTORS THAT IMPACT THE ACCUMULATION OF BUDGET ABSORPTION IN THE END OF THE FISCAL YEAR 2013: A CASE STUDY IN PEKALONGAN CITY OF CENTRAL JAVA INDONESIA Nur Fitriany Post Graduate Student
AGRICULTURE POTFOLIO MODEL MODEL TWO. Keywords: Decision making under uncertainty, efficient portfolio, variance analysis, MOTAD
 AGRICULTURE POTFOLIO MODEL MODEL TWO Keywords: Decision making under uncertainty, efficient portfolio, variance analysis, MOTAD DATA Net income from three crops per acre of land (Income in thousand dollar
CHAPTER 7 MULTIPLE REGRESSION
 CHAPTER 7 MULTIPLE REGRESSION ANSWERS TO PROBLEMS AND CASES 5. Y = 7.5 + 3(0) - 1.(7) = -17.88 6. a. A correlation matrix displays the correlation coefficients between every possible pair of variables
Kabupaten Langkat Suku Bunga Kredit. PDRB harga berlaku
 Lampiran 1. Data Penelitian Tahun Konsumsi Masyarakat PDRB harga berlaku Kabupaten Langkat Suku Bunga Kredit Kredit Konsumsi Tabungan Masyarkat Milyar Rp. Milyar Rp. % Milyar Rp. Milyar Rp. 1990 559,61
Stat 328, Summer 2005
 Stat 328, Summer 2005 Exam #2, 6/18/05 Name (print) UnivID I have neither given nor received any unauthorized aid in completing this exam. Signed Answer each question completely showing your work where
ABSTRACT INTRODUCTION. Rusna Oktaviyani 1 ; Agus Munandar 2
 Binus Business Review, 8(3), November 2017, 183-188 DOI: 10.21512/bbr.v8i3.3622 P-ISSN: 2087-1228 E-ISSN: 2476-9053 Effect of Solvency, Sales Growth, and Institutional Ownership on Tax Avoidance with Profitability
Test of Capital Market Efficiency Theory in the Nigerian Capital Market
 Test of Capital Market Efficiency Theory in the Nigerian Capital Market OGUNDINA, John Ayodele Department of Accounting and Finance Lagos State University, Ojo, Lagos, Nigeria. E mail:ayodelejohayo@yahoo.com:
Capital structure and its impact on firm performance: A study on Sri Lankan listed manufacturing companies
 Merit Research Journal of Business and Management Vol. 1(2) pp. 037-044, December, 2013 Available online http://www.meritresearchjournals.org/bm/index.htm Copyright 2013 Merit Research Journals Full Length
Gilang Ramadhan Fajri Lecturer at Politeknik BBC, Sukabumi
 Research. THE IMPACT OF THE FINANCIAL RATIOS AS THE MEASUREMENT UPON THE PERFORMANCE OF RETURN ON ASSETS AT THE PUBLIC BANKS IN INDONESIA (The Empiric Study upon The Gilang Ramadhan Fajri Lecturer at Politeknik
Does Ownership Concentration Influence Discretionary Earnings Quality in Emerging Market: Evidence from Nigeria
 Does Ownership Concentration Influence Discretionary Earnings Quality in Emerging Market: Evidence from Nigeria Patrick Esiemogie Idode 1 Department of Accounting, Anchor University, Lagos, Nigeria Oluoch
The Effect of Health Insurance on Death Rates
 Western Oregon University Digital Commons@WOU Academic Excellence Showcase Proceedings Student Scholarship 2016-05-26 The Effect of Health Insurance on Death Rates Khorben Boyer Western Oregon University
Impact of Unemployment and GDP on Inflation: Imperial study of Pakistan s Economy
 International Journal of Current Research in Multidisciplinary (IJCRM) ISSN: 2456-0979 Vol. 2, No. 6, (July 17), pp. 01-10 Impact of Unemployment and GDP on Inflation: Imperial study of Pakistan s Economy
Hasil Common Effect Model
 Hasil Common Effect Model Date: 05/11/18 Time: 06:20 C 21.16046 1.733410 12.20742 0.0000 IPM -25.74125 2.841429-9.059263 0.0000 FDI 9.11E-11 1.96E-11 4.654743 0.0000 X 0.044150 0.021606 2.043430 0.0425
Dita Herdiana and Arson Aliludin School of Business and Management Institut Teknologi Bandung itb.ac.id
 JOURNAL OF BUSINESS AND MANAGEMENT Vol. 3, No.2, 2014: 191-203 COMPARING DETERMINANT OF PROFITABILITY BETWEEN ISLAMIC BANKS AND CONVENTIONAL BANKS IN INDONESIA (CASE STUDY: EIGHT ISLAMIC BANKS AND EIGHT
LAMPIRAN. Tahun Bulan NPF (Milyar Rupiah)
") LAMPIRAN Lampiran 1 Data Penelitian Non Performing Financing (NPF), Capital Adequacy Ratio (CAR), Financing to Deposit Ratio (FDR), Biaya Operasional Pendapatan Operasional (BOPO), Ukuran Bank (Size) Tahun
LAMPIRAN Lampiran 1 Data Penelitian Non Performing Financing (NPF), Capital Adequacy Ratio (CAR), Financing to Deposit Ratio (FDR), Biaya Operasional Pendapatan Operasional (BOPO), Ukuran Bank (Size) Tahun
The Impact of Some Economic Factors on Imports in Jordan
 The Impact of Some Economic Factors on Imports in Jordan Adel.A.Haddaw,Mahdy. S. Othman ISRA University- Faculty of Adm. And Financial Jordan- Amman ABSTRACT The purpose of this paper is to build a multiple
Demonstrate Approval of Loans by a Bank
 1 Running head: The Data Consists of 100 Cases of Hypothetical Data to Demonstrate Approval of Loans by a Bank Name Course Subject 2 Introduction There has been witnessed an alarming trend in the number
International Journal of Humanities and Applied Social Science (IJHASS), Volume: 3 Issue: 2 Month Year: February 2018
, Volume: 3 Issue: 2 Month Year: February 2018") Influence Import, Export, Investment and Gross Domestic Product to Inflation in Indonesia and Asean Countries ABSTRACT Dr. Akhmad Sodikin, SE, MM, M.Si Faculty of Economics Krisnadwipayana University Jakarta
Influence Import, Export, Investment and Gross Domestic Product to Inflation in Indonesia and Asean Countries ABSTRACT Dr. Akhmad Sodikin, SE, MM, M.Si Faculty of Economics Krisnadwipayana University Jakarta
THE IMPACT OF CEO ORIGIN ON EARNINGS MANAGEMENT THROUGH REAL ACTIVITIES MANIPULATION. Zerlita Vania Lukito. I Putu Sugiartha S.
 1 THE IMPACT OF CEO ORIGIN ON EARNINGS MANAGEMENT THROUGH REAL ACTIVITIES MANIPULATION Zerlita Vania Lukito I Putu Sugiartha S Accounting Program Faculty of Economics Universitas Atma Jaya Yogyakarta Jl.
A Study on the Impact of CSR on Financial Performance of Companies in India
 Volume 4, Issue 2 December 20 A Study on the Impact of on Financial Performance of Companies in India Arpit Bafna BBA H Finance, Christ University. Abstract This Study investigates the impact has on the
Revista Economică 67:Supplement (2015)
") STUDY REGARDING THE ANALYSIS OF THE FINANCIAL SITUATION OF THE SOCIETIES FROM THE PHARMACEUTICAL INDUSTRY IN TERMS OF THE CORRELATION BETWEEN THE LIQUIDITY AND THE PROFITABILITY MINCULETE (PIKO) Georgiana
STUDY REGARDING THE ANALYSIS OF THE FINANCIAL SITUATION OF THE SOCIETIES FROM THE PHARMACEUTICAL INDUSTRY IN TERMS OF THE CORRELATION BETWEEN THE LIQUIDITY AND THE PROFITABILITY MINCULETE (PIKO) Georgiana
The Determinants of Cash Companies in Indonesia Muhammad Atha Umry a. Yossi Diantimala b
 DOI: 10.32602/ /jafas.2018.011 The Determinants of Cash Companies in Indonesia Muhammad Atha Umry a Holdings: Evidence from Listed Manufacturing Yossi Diantimala b a Corresponding Author, Faculty of Economics
MEMORANDUM. TO: Me FROM: Me RE: Memo containing output for SPSS practice exam #2
 MEMORADUM DATE: ovember 5, 2024 TO: Me FROM: Me RE: Memo containing output for SPSS practice exam #2 Task 3a. Below is bar graph of the number of cases for the variable beltfrnt. 40 30 20 10 0 o Seat Belt
Lecture 13: Identifying unusual observations In lecture 12, we learned how to investigate variables. Now we learn how to investigate cases.
 Lecture 13: Identifying unusual observations In lecture 12, we learned how to investigate variables. Now we learn how to investigate cases. Goal: Find unusual cases that might be mistakes, or that might
Anshika 1. Abstract. 1. Introduction
 Micro-economic factors affecting stock returns: an empirical study of S&P BSE Bankex companies Abstract Anshika 1 1 Research Scholar, PEC University of Technology, Sector 12, Chandigarh, 160012, India
2SLS HATCO SPSS, STATA and SHAZAM. Example by Eddie Oczkowski. August 2001
 2SLS HATCO SPSS, STATA and SHAZAM Example by Eddie Oczkowski August 2001 This example illustrates how to use SPSS to estimate and evaluate a 2SLS latent variable model. The bulk of the example relates
Management Science Letters
 Management Science Letters 8 (2018) 1345 1352 Contents lists available at GrowingScience Management Science Letters homepage: www.growingscience.com/msl The impact of financial liquidity and leverage on
Impact of Short Term Assets and Liabilities on Profitability of the firm (A case study of Cement Industry in Pakistan)
") Abstract: Impact of Short Term Assets and Liabilities on Profitability of the firm (A case study of Cement Industry in Pakistan) Faisal Abbas, Department of Commerce, University of Central Punjab Lahore,
Abstract: Impact of Short Term Assets and Liabilities on Profitability of the firm (A case study of Cement Industry in Pakistan) Faisal Abbas, Department of Commerce, University of Central Punjab Lahore,