Backdrop of demonetisation- CSO data(q-1-ministry) GDP Decrease % GVA Decrease-7.2-7% GVA-Mining and quarrying is estimated to shrink7.
|
|
|
- Dennis Richard
- 5 years ago
- Views:
Transcription

1


2

3 Backdrop of demonetisation- CSO data(q-1-ministry) GDP Decrease % GVA Decrease-7.2-7% GVA-Mining and quarrying is estimated to shrink7.1 to 1.8 % Electricity, gas, water supply and other utility services- collectively an indicator of broader economic activity- is slowing to 6.5 per cent from 6.6 per cent Two key engines of the economy, manufacturing and services, are losing momentum -spell trouble for the coming quarters. Normal monsoon- improvement in rainfall - agriculture, forestry and fishing sector, which is estimated to expand -1.2 to 4.1. Rabi sowing increase 6.5 per cent from last year. Union budget- next month.
4 Gross value added (GVA)- measure of the value of goods and services produced in an area, industry or sector. GVA is output minus intermediate consumption. Relationship GVA & GDP as both are measures of output. GVA + taxes on products - subsidies on products = GDP GVA- gross regional domestic product

5
 which have failed spectacularly to provide a safe, comfortable and accessible experience for walkers.")
6 To make New Delhi s - Con-naught Place a pedestrian zone from February, and keep out cars and other vehicles from its middle and inner circle roads, during a three-month -public space Urban design in India is the preserve of State governments and local bodies, (Q-2-List-Schedule-?) which have failed spectacularly to provide a safe, comfortable and accessible experience for walkers. Times Square in New York and the route along the Seine in Paris- In America, pedestrian injuries decreased after vehicles were removed from Times Square Such examples should convince the Ministry of Urban Development (Q-3) that it is moving in the right direction Expanding pavements(फ टप थ) for pedestrians and facilitating the use of bicycles is today a high-priority goal for mayors and urban governments the world over.

7
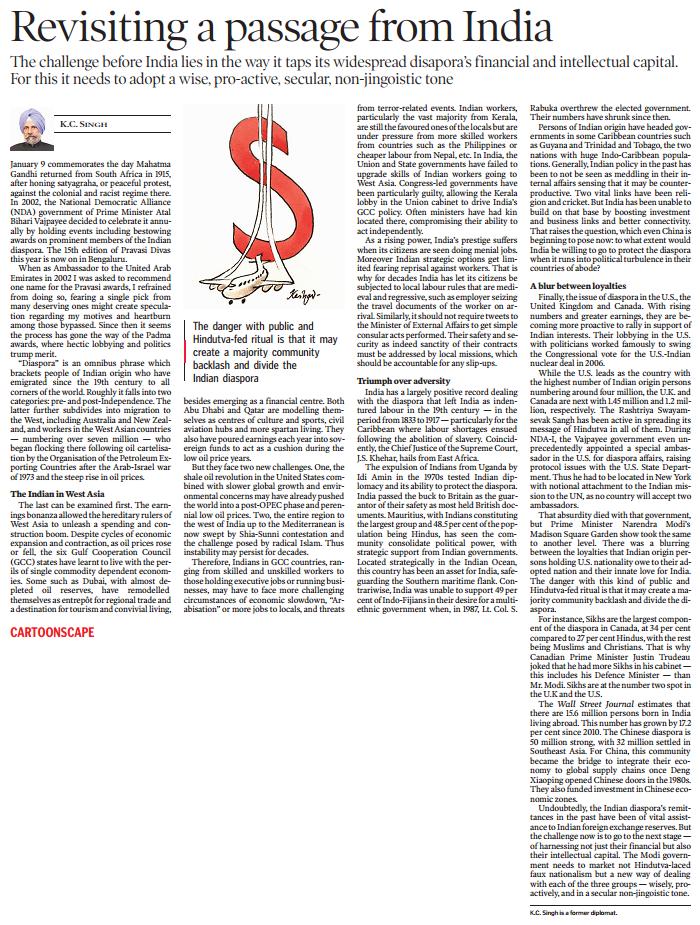
8 Mahatma Gandhi returned from South Africa in 1915 (January 9) after- satyagraha, or peaceful protest, against the colonial and racist regime there (Q-4-Ahmedabad Champaran and Kheda) In 2002-NDA- Atal Bihari Vajpayee decided to celebrate it annually Indian diaspora. The 15th edition of Pravasi Divas this year is now on in Bengaluru-2017 Diaspora -emigrated since the 19th century to all corners of the world. Roughly it falls into two categories: pre- and post-independence. The Indian in West Asia Gulf Cooperation Council (GCC) & The Organization of the Petroleum Exporting Countries(OPEC) stateshave learnt to live with- single commodity dependent economies(shale oil revolution United States) Shia-Sunni contestation and the challenge- radical Islam- Thus instability may persist for decades Skilled and unskilled workers - vast majority from Kerala Mauritius, with Indians constituting the largest group and 48.5per cent of the population being Hindus Finally, the issue of diaspora in the U.S., the United Kingdom and Canada-With rising numbers and greater earnings. Undoubtedly, the Indian diaspora s remittances in the past have been of vital assistance to Indian foreign exchange reserves. But the challenge now is to go to the next stage of harnessing not just their financial but also their intellectual capital.


9 Gulf Cooperation Council (GCC & OPEC)- (Q-5-HQ)
 is being raised to fund green projects relating to renewable energy or emission reductions etc.")
10 Bonds basically are debt instruments which help issuer to get capital while the investors receive fixed income in the form of interest. Green bonds- The issuer gets capital from the investors only if the investment (capital) is being raised to fund green projects relating to renewable energy or emission reductions etc. Green masala bond (rupee-denominated bond)- Masala bonds are bonds issued outside India but denominated in Indian Rupees. Internationalise the Indian rupee- Later in August 2015 International Financial Corporation for the first time issued green masala bonds and raised Rupees. Since the issuance of the first green bond in 2007 by two multilateral development banks (World Bank and European Investment Bank)- green bond market has grown exponentially. Yes Bank s and India s first green infrastructure bonds issued in February Yes Bank has been awarded inaugural Green Bond Pioneer Award at a ceremony held in London, United Kingdom In January 2016, the Securities and Exchange Board (SEBI) of India published its official green bond guidelines Contributing to sustainable growth The Climate Bond Initiative, in its India update, indicated that about 62 per cent of the green bond proceeds have been allocated to renewable energy projects Expectations from 2017 and beyond For developing a formal definition of green to ensure understanding across sectors Blue bond issuance (bonds used to specifically finance water infrastructure) in India-India yet to enter the market-$10 billion in world Paris accord at the COP22- promises to deliver on some of the commitments undertaken globally for green financing. With developed countries reaffirming their $100 billion goal per year by support climate action plan- Collective participation
11 Q-1)-The Central Statistical office (CSO) in the Ministry of Statistics and Programme Implementation (MoSP & I) is responsible for the compilation of National Accounts Statistics (NAS). At the State level, State Directorates of Economics and Statistics (DESs) have the responsibility of compiling there State Domestic Product and other aggregates. Q-2)-union list, state list, concurrent list -7 th (Seventh) Schedule Q-3)- Ministry of Urban Development. Ministry of Urban Development (MoUD), Government of India, is the apex body for formulation and administration of the rules and regulations and laws relating to the housing and urban development in India. The ministry is under the charge of Venkaiah Naidu.. Q-4)- Gandhiji came to India in the year 1915 but his active participation into Indian politics can be traced with the Champaran Satyagraha (1917) Kheda satyagraha (1918) and Ahmadabad Mill workers strike (1918) respectively Q-5)- GCC-HQ- Riyadh, Saudi Arabia Official languages- Arabic Membership -6 states OPEC- HQ- Vienna, Austria Official language -English Membership- -13 states Blue bond- finance water infrastructure
ECONOMIC POLICIES, GROWTH AND STRUCTURAL CHANGE OF INDIA B. A. PRAKASH
 ECONOMIC POLICIES, GROWTH AND STRUCTURAL CHANGE OF INDIA B. A. PRAKASH Chairman, Fifth State Finance Commission December 6, 2017 Objectives Examine the economic policies prior and after liberalisation
SAUDI ARABIA STATISTICAL SNAPSHOT
 SAUDI ARABIA STATISTICAL SNAPSHOT 2016 ABOUT THE SNAPSHOT The Saudi Arabia Statistical Snapshot presents the main development and economic data and key indicators under the following topics: demography,
SAUDI ARABIA STATISTICAL SNAPSHOT
 SAUDI ARABIA STATISTICAL SNAPSHOT 206 ABOUT THE SNAPSHOT The Saudi Arabia Statistical Snapshot presents the main development and economic data and key indicators under the following topics: demography,
This Press Release is embargoed against publication, telecast or circulation on internet till 5.30 pm today i.e. 6 th January 2017 PRESS NOTE
 PRESS NOTE ON FIRST ADVANCE ESTIMATES OF NATIONAL INCOME 2016-17 CENTRAL STATISTICS OFFICE MINISTRY OF STATISTICS & PROGRAMME IMPLEMENTATION GOVERNMENT OF INDIA 2 GOVERNMENT OF INDIA MINISTRY OF STATISTICS
GROSS DOMESTIC PRODUCT, SECOND QUARTER OF 2014 (PRELIMINARY DATA)
") GROSS DOMESTIC PRODUCT, SECOND QUARTER OF 2014 (PRELIMINARY DATA) In the second quarter of 2014 GDP at current prices amounts to 19 517 million BGN. In Euro terms GDP is 9 979 million Euro or 1 379 euro
GROSS DOMESTIC PRODUCT, SECOND QUARTER OF 2014 (PRELIMINARY DATA) In the second quarter of 2014 GDP at current prices amounts to 19 517 million BGN. In Euro terms GDP is 9 979 million Euro or 1 379 euro
NORTHWEST TERRITORIES
 PROVINCIAL PROFILE Northwest Territories Economy in 2013 Gross domestic product (GDP): $4.4 billion GDP per capita: $100,600 Population: 44,000 Merchandise exports and imports: 57.7% of GDP Northwest Territories
NORTHWEST TERRITORIES
 TERRITORIAL PROFILE Northwest Territories Economy in 2014 Gross domestic product (GDP): $4.7 billion GDP per capita: $107,600 Population: 44,000 Merchandise exports and imports: 61.3% of GDP Northwest
Indian Economy. GDP growth slowed down but remained above the comfortable 7% Manufacturing GVAbp
 Indian Economy Economic Growth GDP growth slowed down but remained above the comfortable 7% Domestic economy witnessed 7.1% GDP growth during the first quarter (Apr - Jun) of fiscal 2016-17 (Q1FY17) as
ANNUAL ECONOMIC REPORT AJMAN 2015
 ANNUAL ECONOMIC REPORT AJMAN C O N T E N T S Introduction Growth of the Global Economy Economic Growth in the United Arab Emirates Macro - Economic Growth in the Emirate of Ajman Gross Domestic Product
PRESS NOTE ON ESTIMATES OF GROSS DOMESTIC PRODUCT FOR THE FIRST QUARTER
 PRESS NOTE ON ESTIMATES OF GROSS DOMESTIC PRODUCT FOR THE FIRST QUARTER APRIL-JUNE (2010-2011) CENTRAL STATISTICS OFFICE MINISTRY OF STATISTICS & PROGRAMME IMPLEMENTATION GOVERNMENT OF INDIA (Revised)
GROSS DOMESTIC PRODUCT, THIRD QUARTER OF 2018 (PRELIMINARY DATA)
") GROSS DOMESTIC PRODUCT, THIRD QUARTER OF 2018 (PRELIMINARY DATA) In the third quarter of 2018 Gross Domestic Product (GDP) 1 at current prices amounts to 29 822 million BGN. In Euro terms GDP is 15 248
GROSS DOMESTIC PRODUCT, THIRD QUARTER OF 2018 (PRELIMINARY DATA) In the third quarter of 2018 Gross Domestic Product (GDP) 1 at current prices amounts to 29 822 million BGN. In Euro terms GDP is 15 248
India s New GDP Series : Everything You Need To Know
 India s New GDP Series 2011-12: Everything You Need To Know India has shifted to a new GDP series. The organisation responsible for calculating national income CSO (Central Statistical Organisation) adopted
GROSS DOMESTIC PRODUCT FOR 2011 FINAL DATA
 GROSS DOMESTIC PRODUCT FOR 2011 FINAL DATA In 2011 GDP at current prices amounts to 75 308 million Levs. GDP at 2005 constant prices increases by 1.8 % compared to the previous year. GDP, current prices
GROSS DOMESTIC PRODUCT, SECOND QUARTER OF 2017 (PRELIMINARY DATA)
") GROSS DOMESTIC PRODUCT, SECOND QUARTER OF 2017 (PRELIMINARY DATA) In the second quarter of 2017 Gross Domestic Product (GDP) 1 at current prices amounts to 24 149 million BGN. In Euro terms GDP is 12 347
GROSS DOMESTIC PRODUCT, SECOND QUARTER OF 2017 (PRELIMINARY DATA) In the second quarter of 2017 Gross Domestic Product (GDP) 1 at current prices amounts to 24 149 million BGN. In Euro terms GDP is 12 347
I. ECONOMIC ENVIRONMENT (1) MAJOR FEATURES OF THE ECONOMY
 MAJOR FEATURES OF THE ECONOMY") Oman WT/TPR/S/201 Page 1 I. ECONOMIC ENVIRONMENT (1) MAJOR FEATURES OF THE ECONOMY 1. The Sultanate of Oman borders Saudi Arabia to the west, the United Arab Emirates (UAE) to the north west, and Yemen
Oman WT/TPR/S/201 Page 1 I. ECONOMIC ENVIRONMENT (1) MAJOR FEATURES OF THE ECONOMY 1. The Sultanate of Oman borders Saudi Arabia to the west, the United Arab Emirates (UAE) to the north west, and Yemen
GOVERNMENT OF INDIA MINISTRY OF STATISTICS AND PROGRAMME IMPLEMENTATION
 GOVERNMENT OF INDIA MINISTRY OF STATISTICS AND PROGRAMME IMPLEMENTATION LOK SABHA UNSTARRED QUESTION NO. 5170 TO BE ANSWERED ON WEDNESDAY, THE 5 th APRIL, 2017 CALCULATION OF GDP GROWTH 5170. SHRI SULTAN
NEW BRUNSWICK NOTES PROVINCIAL PROFILE. Simon Richards
 PROVINCIAL PROFILE New Brunswick s Economy in 2013 Gross domestic product (GDP): $31.9 billion GDP per capita: $42,200 Population: 756,000 Merchandise exports and imports: 98.0% of GDP New Brunswick s
GROSS DOMESTIC PRODUCT, FIRST QUARTER OF 2017 (PRELIMINARY DATA)
") GROSS DOMESTIC PRODUCT, FIRST QUARTER OF 2017 (PRELIMINARY DATA) In the first quarter of 2017 GDP at current prices amounts to 20 066 million BGN. In Euro terms GDP is 10 260 million Euro or 1 445 euro
GROSS DOMESTIC PRODUCT, FIRST QUARTER OF 2017 (PRELIMINARY DATA) In the first quarter of 2017 GDP at current prices amounts to 20 066 million BGN. In Euro terms GDP is 10 260 million Euro or 1 445 euro
CANADA S MERCHANDISE TRADE WITH THE WORLD
 NOTES The Library of Parliament s Trade and Investment series provides information on Canada s trade and investment relationship with the world and with selected countries. It also describes the trade
NEWFOUNDLAND AND LABRADOR
 PROVINCIAL PROFILE Newfoundland and Labrador s Economy in 2013 Gross domestic product (GDP): $35.8 billion GDP per capita: $67,800 Population: 528,000 Merchandise exports and imports: 72.6% of GDP Newfoundland
GROSS DOMESTIC PRODUCT FOR THE FIRST QUARTER OF 2014 (PRELIMINARY DATA)
") GROSS DOMESTIC PRODUCT FOR THE FIRST QUARTER OF 2014 (PRELIMINARY DATA) In the first quarter of 2014 GDP at current prices amounts to 16 097 Million Levs. In Euro terms GDP is 8 230 Million Euro or 1 136
GROSS DOMESTIC PRODUCT FOR THE FIRST QUARTER OF 2014 (PRELIMINARY DATA) In the first quarter of 2014 GDP at current prices amounts to 16 097 Million Levs. In Euro terms GDP is 8 230 Million Euro or 1 136
VI. THE EXTERNAL ECONOMY
 VI. THE EXTERNAL ECONOMY India s external sector has continued to register robust performance during 2006-07 so far. Merchandise exports have exhibited strong growth, notwithstanding some deceleration.
GROSS DOMESTIC PRODUCT, FIRST QUARTER OF 2018 (PRELIMINARY DATA)
") GROSS DOMESTIC PRODUCT, FIRST QUARTER OF 2018 (PRELIMINARY DATA) In the first quarter of 2018 Gross Domestic Product (GDP) 1 at current prices amounts to 21 479 million BGN. In Euro terms GDP is 10 982
GROSS DOMESTIC PRODUCT, FIRST QUARTER OF 2018 (PRELIMINARY DATA) In the first quarter of 2018 Gross Domestic Product (GDP) 1 at current prices amounts to 21 479 million BGN. In Euro terms GDP is 10 982
GROSS DOMESTIC PRODUCT FOR THE THIRD QUARTER OF 2012
 GROSS DOMESTIC PRODUCT FOR THE THIRD QUARTER OF 2012 In the third quarter of 2012 GDP at current prices amounted to 21 734 Million Levs. In Euro terms GDP was 11 112 Million Euro or 1 522 Euro per person.
NEWFOUNDLAND AND LABRADOR
 PROVINCIAL PROFILE Newfoundland and Labrador s Economy in 2014 Gross domestic product (GDP): $33.5 billion GDP per capita: $63,300 Population: 529,000 Merchandise exports and imports: 72.0% of GDP Newfoundland
This Press Release is embargoed against publication, telecast or circulation on internet till 5.30 pm today i.e. 31 st January, 2018.
 This Press Release is embargoed against publication, telecast or circulation on internet till 5.30 pm today i.e. 31 st January, 2018. PRESS NOTE ON FIRST REVISED ESTIMATES OF NATIONAL INCOME, CONSUMPTION
ADDRESSING THE MACRO-ECONOMIC
 ADDRESSING THE MACRO-ECONOMIC CHALLENGES OF CLIMATE CHANGE Giovanni Ganelli, Deputy Head of Office, IMF Regional Office for Asia and the Pacific Seminar on Climate Change: Challenges and Opportunities
NOVA SCOTIA NOTES NOVA SCOTIA S PROFILE. Simon Richards
 NOVA SCOTIA S PROFILE Economic Indicators in 2015 Gross domestic product (GDP): $40.2 billion GDP per capita: $42,600 Population: 943,400 International merchandise exports and imports: 43.0% of GDP Economic
NOVA SCOTIA NOTES PROVINCIAL PROFILE. Alexandre Gauthier
 PROVINCIAL PROFILE Nova Scotia s Economy in 2014 Gross domestic product (GDP): $39.1 billion GDP per capita: $41,500 Population: 942,000 Merchandise exports and imports: 44.9% of GDP Nova Scotia s Economic
Study-IQ education, All rights reserved
 Copyright @ Study-IQ education, All rights reserved TIRELESSSOUL GauravGarg888 Q1) The File cover chosen for 2018 economic survey report was pink because A) To support human rights B) To highlight gender
EXTERNAL SECTOR: RECENT TRENDS AND CHALLENGES Bangladesh Economic Update. October 2015
 EXTERNAL SECTOR: RECENT TRENDS AND CHALLENGES Bangladesh Economic Update October 2015 Bangladesh Economic Update Volume 06, No. 09, 2015 Acknowledgement Bangladesh Economic Update is a monthly publication
 2.0 Origin of Gross Domestic Product (GDP at current prices) sector of origin Agriculture, forestry and fishing = primary sector Origin of GDP by sectors 2017 % share of total value added 3.52 3.75 3.83
PRESS INFORMATION BUREAU GOVERNMENT OF INDIA PRESS NOTE ADVANCE ESTIMATES OF NATIONAL INCOME,
 1 PRESS INFORMATION BUREAU GOVERNMENT OF INDIA PRESS NOTE ADVANCE ESTIMATES OF NATIONAL INCOME, 2012-13 Dated the 12 Magha, 1934 Saka 7 February, 2013 The Central Statistics Office (CSO), Ministry of Statistics
LIGHT SWEET CRUDE OIL. Short term Update
 24 th March 2008 Karvy Comtrade s LIGHT SWEET CRUDE OIL Short term Update Crude prices surpassed the psychological level of $100 and tested a high of $111.80 with funds interest supported by falling dollar
PRESS INFORMATION BUREAU GOVERNMENT OF INDIA PRESS NOTE ADVANCE ESTIMATES OF NATIONAL INCOME,
 PRESS INFORMATION BUREAU GOVERNMENT OF INDIA Dated the 12 Magha, 1933 Saka 7 February, 2012 PRESS NOTE ADVANCE ESTIMATES OF NATIONAL INCOME, 2011-12 The Central Statistics Office (CSO), Ministry of Statistics
GROSS DOMESTIC PRODUCT FOR THE SECOND QUARTER OF 2012
 GROSS DOMESTIC PRODUCT FOR THE SECOND QUARTER OF 2012 In the second quarter of 2012 GDP at current prices amounted to 19 007 Million Levs. In Euro terms GDP was 9 718 Million Euro or 1 330 Euro per person.
Singapore. Key Indicators for Asia and the Pacific Item
 Key Indicators for Asia and the Pacific 2012 1 POPULATION Total population a million; as of 1 July 3.52 4.03 4.27 4.59 4.84 4.99 5.08 5.18 Population density persons per square kilometer 5443 5900 6112
Viet Nam. Key Indicators for Asia and the Pacific Item
 1 POPULATION Total population million; as of 1 July 77.11 78.12 79.08 80.00 80.95 81.91 82.85 84.22 85.12 86.03 86.93 87.84 88.81 89.76 90.73 91.71 92.7* Population density persons per square kilometer
PRESS INFORMATION BUREAU GOVERNMENT OF INDIA PRESS NOTE ESTIMATES OF GROSS DOMESTIC PRODUCT FOR THE THIRD QUARTER (OCTOBER-DECEMBER) OF
 OF") 1 PRESS INFORMATION BUREAU GOVERNMENT OF INDIA PRESS NOTE Dated the 9 Phalguna, 1932 Saka 28 February, 2011 ESTIMATES OF GROSS DOMESTIC PRODUCT FOR THE THIRD QUARTER (OCTOBER-DECEMBER) OF 2010-11 The Central
1 PRESS INFORMATION BUREAU GOVERNMENT OF INDIA PRESS NOTE Dated the 9 Phalguna, 1932 Saka 28 February, 2011 ESTIMATES OF GROSS DOMESTIC PRODUCT FOR THE THIRD QUARTER (OCTOBER-DECEMBER) OF 2010-11 The Central
GROSS DOMESTIC PRODUCT FOR THE THIRD QUARTER OF 2013
 GROSS DOMESTIC PRODUCT FOR THE THIRD QUARTER OF 2013 In the third quarter of 2013 GDP at current prices amounts to 21 590 million BGN. In Euro terms GDP is 11 039 million euro or 1 519 euro per person.
Korea, Republic of. Key Indicators for Asia and the Pacific Item
 Key Indicators for Asia and the Pacific 2016 1 POPULATION Total population million; as of 1 July 47.0 47.4 47.6 47.9 48.0 48.1 48.4 48.6 48.9 49.2 49.4 49.8 50.0 50.2 50.4 50.6 Population density persons
Myanmar. Key Indicators for Asia and the Pacific Item
 Key Indicators for Asia and the Pacific 2017 1 POPULATION a Total population million; as of 1 October 46.1 46.6 47.1 47.6 48.1 48.5 48.8 49.2 49.5 49.8 50.2 50.6 51.0 51.4 52.0 52.5 52.9 Population density
PRESS NOTE ON QUARTERLY ESTIMATES OF GROSS DOMESTIC PRODUCT FOR THE THIRD QUARTER (OCTOBER-DECEMBER) OF CENTRAL STATISTICS OFFICE
 OF CENTRAL STATISTICS OFFICE") PRESS NOTE ON QUARTERLY ESTIMATES OF GROSS DOMESTIC PRODUCT FOR THE THIRD QUARTER (OCTOBER-DECEMBER) OF 2012-13 CENTRAL STATISTICS OFFICE MINISTRY OF STATISTICS AND PROGRAMME IMPLEMENTATION GOVERNMENT
PRESS NOTE ON QUARTERLY ESTIMATES OF GROSS DOMESTIC PRODUCT FOR THE THIRD QUARTER (OCTOBER-DECEMBER) OF 2012-13 CENTRAL STATISTICS OFFICE MINISTRY OF STATISTICS AND PROGRAMME IMPLEMENTATION GOVERNMENT
BRITISH COLUMBIA NOTES PROVINCIAL PROFILE. Simon Richards
 PROVINCIAL PROFILE British Columbia s Economy in 2013 Gross domestic product (GDP): $229.7 billion GDP per capita: $50,100 Population: 4.6 million Merchandise exports and imports: 37.5% of GDP British
GROSS DOMESTIC PRODUCT, THIRD QUARTER OF 2015 (PRELIMINARY DATA)
") GROSS DOMESTC PRODUCT, THRD QUARTER OF 2015 (PRELMNARY DATA) GDP at current prices is 23 490 million BGN in the third quarter of 2015. n Euro terms GDP is 12 010 million Euro or 1 671 euro per capita.
GROSS DOMESTC PRODUCT, THRD QUARTER OF 2015 (PRELMNARY DATA) GDP at current prices is 23 490 million BGN in the third quarter of 2015. n Euro terms GDP is 12 010 million Euro or 1 671 euro per capita.
BRITISH COLUMBIA NOTES BRITISH COLUMBIA S PROFILE. Simon Richards
 BRITISH COLUMBIA S PROFILE Economic Indicators in 2015 Gross domestic product (GDP): $250.0 billion GDP per capita: $53,300 Population: 4.7 million International merchandise exports and imports: 38.7%
NOVA SCOTIA NOTES PROVINCIAL PROFILE. Simon Richards
 PROVINCIAL PROFILE Nova Scotia s Economy in 2013 Gross domestic product (GDP): $39.1 billion GDP per capita: $41,500 Population: 943,000 Merchandise exports and imports: 45.3% of GDP Nova Scotia s Economic
India. Key Indicators for Asia and the Pacific Item
 1 POPULATION a Total population as of 1 October (million) 1,019 1,040 1,056 1,072 1,089 1,106 1,122 1,138 1,154 1,170 1,186 1,220 1,235 1,251 1,267 1,283 1,299 1,316 Population density (persons/km 2 )
CANADA UNITED KINGDOM
 COUNTRY PROFILE Economic Indicators Gross domestic product (GDP) at purchasing power parity (PPP): US$2.7 trillion (2015) GDP per capita at PPP: US$41,300 (2015) Population: 65.1 million (2015) Merchandise
This Press Release is embargoed against publication, telecast or circulation on internet till 5.30 pm today i.e. 31 st May 2018 PRESS NOTE
 This Press Release is embargoed against publication, telecast or circulation on internet till 5.30 pm today i.e. 31 st May 2018 PRESS NOTE ON PROVISIONAL ESTIMATES OF ANNUAL NATIONAL INCOME, 2017-18 AND
Mauritius Economy Update January 2015
 January 19, 2015 Economics Mauritius Economy Update January 2015 Overview - Mauritian economy has been witnessing a persistent moderation in growth since 2010 due to weak economic activity in Euro Zone,
OECD SHORT-TERM ECONOMIC STATISTICS WORKING PARTY (STESWP) Evolution of short-term economic statistics in large emerging non-member economies (NMEs)
 Evolution of short-term economic statistics in large emerging non-member economies (NMEs)") OECD SHORT-TERM ECONOMIC STATISTICS WORKING PARTY (STESWP) Evolution of short-term economic statistics in large emerging non-member economies (NMEs) Paper prepared by David Brackfield and Alena Brin Statistics
OECD SHORT-TERM ECONOMIC STATISTICS WORKING PARTY (STESWP) Evolution of short-term economic statistics in large emerging non-member economies (NMEs) Paper prepared by David Brackfield and Alena Brin Statistics
ECUADOR. 1. General trends
 Economic Survey of Latin America and the Caribbean 2017 1 ECUADOR 1. General trends In 2016, GDP fell by 1.5% after weak growth of 0.2% in 2015 owing to the drop in the average international oil price
REFERENCE NOTE. No. 28/RN/Ref./November /2013
 LOK SABHA SECRETARIAT PARLIAMENT LIBRARY AND REFERENCE, RESEARCH, DOCUMENTATION AND INFORMATION SERVICE (LARRDIS) MEMBERS REFERENCE SERVICE REFERENCE NOTE. No. 28/RN/Ref./November /2013 For the use of
CANADA SAUDI ARABIA SAUDI ARABIA S PROFILE NOTES. Florian Richard
 SAUDI ARABIA S PROFILE Economic Indicators Gross domestic product (GDP) at purchasing power parity (PPP): US$1.8 trillion (2016) GDP per capita at PPP: US$54,400 (2016) Population: 32.3 million (2016)
Viet Nam. Key Indicators for Asia and the Pacific Item
 Key Indicators for Asia and the Pacific 2018 1 POPULATION Total population as of 1 July (million) 77.11 78.12 79.08 80.00 80.95 81.91 82.85 84.22 85.12 86.03 86.93 87.84 88.81 89.76 90.73 91.71 92.69 93.67*
This Press Release is embargoed against publication, telecast or circulation on internet till 5.30 pm today i.e. 8th February
 . PRESS NOTE ON ADVANCE ESTIMATES OF NATIONAL INCOME 2015-16 AND QUARTERLY ESTIMATES OF GROSS DOMESTIC PRODUCT FOR THE THIRD QUARTER (Q3) OF 2015-16 CENTRAL STATISTICS OFFICE MINISTRY OF STATISTICS & PROGRAMME
Tuvalu. Key Indicators for Asia and the Pacific Item
 1 POPULATION Total population thousand; as of 1 July 9.5 9.6 9.6 9.7 10.0 10.3 10.4 11.1 11.0 11.1 11.1 10.6 10.8 10.9 11.0 11.2 11.3 Population density persons per square kilometer 372 374 373 378 389
Imports. Exports. T135 Figure 18-1 U.S. Exports and Imports as Ratios of GDP, Ratio to GDP
 T135 Figure 18-1 U.S. Exports and Imports as Ratios of GDP, 1929 1998 0.14 0.12 Imports 0.10 Ratio to GDP 0.08 0.06 Exports 0.04 0.02 0.00 1930 1940 1950 1960 1970 1980 1990 1998 T136 Table 18-1 Ratios
This Press Release is embargoed against publication, telecast or circulation on internet till 5.30 pm today i.e. 28th February
 . PRESS NOTE ON SECOND ADVANCE ESTIMATES OF NATIONAL INCOME 2017-18 AND QUARTERLY ESTIMATES OF GROSS DOMESTIC PRODUCT FOR THE THIRD QUARTER (Q3) OF 2017-18 CENTRAL STATISTICS OFFICE MINISTRY OF STATISTICS
PRESS NOTE ON ADVANCE ESTIMATES OF NATIONAL INCOME CENTRAL STATISTICS OFFICE MINISTRY OF STATISTICS & PROGRAMME IMPLEMENTATION
 PRESS NOTE ON ADVANCE ESTIMATES OF NATIONAL INCOME 2010-11 CENTRAL STATISTICS OFFICE MINISTRY OF STATISTICS & PROGRAMME IMPLEMENTATION GOVERNMENT OF INDIA PRESS INFORMATION BUREAU GOVERNMENT OF INDIA Dated
Training Course on Basic Data Analysis for Price and Foreign Trade Data
 Training Course on Basic Data Analysis for Price and Foreign Trade Data Ms. Münevver Nilgün Egemen Statistical, Economic and Social Research and Training Centre for Islamic Countries - (SESRIC) Central
COSTA RICA. 1. General trends
 Economic Survey of Latin America and the Caribbean 2016 1 COSTA RICA 1. General trends According to new official statistics, the Costa Rican economy grew by 3.7% in real terms in 2015, up from 3% in 2014,
TABLE 2: CAPITAL STRUCTURE
 Components of capital Core capital - Tier I: TABLE 2: CAPITAL STRUCTURE AS AT 31 DECEMBER 2010 Amount Eligible paid-up share capital 3,000,000 Eligible reserves 10,642 Legel reserves 29,167 Other reserves
GDP to grow at 7% in fiscal CRISIL Outlook September 2017
 GDP to grow at 7% in fiscal 2018 CRISIL Outlook September 2017 CRISIL has trimmed its fiscal 2018 growth forecast for India by 40 basis points to 7% from 7.4% earlier, after data for the first quarter
COMCEC Trade OUTLOOK 2015
 COMCEC Trade OUTLOOK 2015 Trade Working Group 6 th Meeting September 17, 2015 Ankara, Turkey OUTLINE Recent Trends in Trade Between the OIC Member States and the World Recent Trends in Intra-OIC Trade
TABLE 2: CAPITAL STRUCTURE
 Components of capital Core capital - Tier I: TABLE 2: CAPITAL STRUCTURE Amount Eligible paid-up share capital 3,000,000 Shares premium accounts - Eligible reserves (6,145) Legel reserves 29,167 Other reserves
Activity 20.1 U.S. Quarterly Real GDP ( )
") Activity 20.1 U.S. Quarterly Real GDP (1979 2013) (in billions of chained 2009 dollars) Year & Quarter Real GDP Year & Quarter Real GDP Year & Quarter Real GDP Year & Quarter Real GDP 1979 Q1 6,426.1 1988
Activity 20.1 U.S. Quarterly Real GDP (1979 2013) (in billions of chained 2009 dollars) Year & Quarter Real GDP Year & Quarter Real GDP Year & Quarter Real GDP Year & Quarter Real GDP 1979 Q1 6,426.1 1988
GOAL 6 FIRMS PARTICIPATING IN FOREIGN EXPORT TRADE
 GOAL 6 FIRMS PARTICIPATING IN FOREIGN EXPORT TRADE By 2028, New Brunswick will have at least 1,080 firms participating in foreign export trade. Status: NOT PROGRESSING Current Situation As outlined in
MONTHLY ECONOMIC REPORT MARCH 2013 HIGHLIGHTS
 Ministry of Finance Department of Economic Affairs Economic Division 4(3)/Ec. Dn. /2012 MONTHLY ECONOMIC REPORT MARCH 2013 HIGHLIGHTS The overall growth of GDP at factor cost at constant prices, as per
NOTES. Prime Minister Narendra Modi held wide-ranging talks with Crown Prince of Abu Dhabi Mohamed bin Zayed Al Nahyan on February 10, 2018
 NOTES Prime Minister Narendra Modi held wide-ranging talks with Crown Prince of Abu Dhabi Mohamed bin Zayed Al Nahyan on February 10, 2018 Palestine, United Arab Emirates and Oman UNITED ARAB EMIRATES
ZAMBIA: COUNTRY EXPERIENCE ON COMPILATION & PUBLICATION OF FOREIGN AFFLIATES TRADE IN SERVICES STATISTICS (FATS)
") ZAMBIA: COUNTRY EXPERIENCE ON COMPILATION & PUBLICATION OF FOREIGN AFFLIATES TRADE IN SERVICES STATISTICS (FATS) By Christabel & Wilson Phiri, BoZ. SADC Workshop On Trade In Services Statistics, 27 th
ZAMBIA: COUNTRY EXPERIENCE ON COMPILATION & PUBLICATION OF FOREIGN AFFLIATES TRADE IN SERVICES STATISTICS (FATS) By Christabel & Wilson Phiri, BoZ. SADC Workshop On Trade In Services Statistics, 27 th
YUKON NOTES PROVINCIAL PROFILE. Simon Richards
 PROVINCIAL PROFILE Yukon s Economy in 2013 Gross domestic product (GDP): $2.5 billion GDP per capita: $69,800 Population: 36,000 Merchandise exports and imports: 24.5% of GDP Yukon s Economic Activity
STCI Primary Dealer Ltd
 Revisions in India s GDP With MOSPI revising India s GDP estimate to 7.4% for FY15 followed by 6.9% in FY14 and 5.1% in FY13, policymakers are confronted with another conundrum with regards to growth prospects
GROSS DOMESTIC PRODUCT FOR THE SECOND QUARTER OF 2011
 GROSS DOMESTIC PRODUCT FOR THE SECOND QUARTER OF 2011 In the second quarter of 2011 GDP at current prices amounts to 18 804 million levs. In Euro terms GDP reaches to 9 614.3 million euro or 1 284.1 euro
1. Economy. Economic Aggregates. Merchandise Foreign Trade. Prices. Financial Statistics. Government Finance. Wages and Compensation
 12 Statistical Yearbook of Abu Dhabi 2016 1. Economy Economic Aggregates Merchandise Foreign Trade Prices Financial Statistics Government Finance Wages and Compensation Foreign Investment Statistical Yearbook
STCI Primary Dealer Ltd
 Macroeconomic Update: GDP Q3 FY18 Beating expectations, India s Real GDP noted a sharp rebound, coming in at 7.2% for Q3 FY18, higher than the revised estimate of 6.5% witnessed in the previous quarter.
This Press Release is embargoed against publication, telecast or circulation on internet till 5.30 pm today i.e. 31 st May 2017.
 This Press Release is embargoed against publication, telecast or circulation on internet till 5.30 pm today i.e. 31 st May 2017. PRESS NOTE ON PROVISIONAL ESTIMATES OF ANNUAL NATIONAL INCOME, 2016-17 AND
MONETARY POLICY OUTLOOK- THE FIFTH BI-MONTHLY MONETARY POLICY REVIEW OF THE CURRENT FINANCIAL YEAR DECEMBER-MARCH
 MONETARY POLICY OUTLOOK- THE FIFTH BI-MONTHLY MONETARY POLICY REVIEW OF THE CURRENT FINANCIAL YEAR DECEMBER-MARCH 2018-19 Dr. Arun Kumar Misra, Associate Professor, Finance & Accounts, VGSOM, IIT Kharagpur
Sustainable Finance Research Executive Summary. Commissioned by HSBC 2016
 Sustainable Finance Research Executive Summary Commissioned by HSBC 16 East & Partners is a leading specialist business banking market research and analysis firm. The firm s core expertise is in the provision
A. Definitions and sources of data
 Poland A. Definitions and sources of data Data on foreign direct investment (FDI) in Poland are reported by the National Bank of Poland (NBP), the Polish Agency for Foreign Investment (PAIZ) and the Central
Others b Unemployed Unemployment rate percent
 POPULATION Total population thousand; as of 1 March 213.2 223.3 230.8 238.4 240.0 244.8 250.0 255.5 261.0 266.0 270.1 276.0 280.6 285.1 289.5 293.7 299.0 304.9 * 309.6 * Population density persons per
No. 2. Key Economic Indicators. Bank Austria Economics & Market Analysis Austria
 No. 0 Key Economic Indicators Bank Austria Economics & Market Analysis Austria Key Economic Indicators Issue /0 Economic Forecasts for Austria Percentage change over previous year 00 0 0 0 GDP (real)..0
Kathmandu, Nepal, September 23-26, 2009
 Session Number: Session 8b (Parallel) Time: Friday, September 25, 14:00-15:30 Paper Prepared for the Special IARIW-SAIM Conference on Measuring the Informal Economy in Developing Countries Kathmandu, Nepal,
NATIONAL ACCOUNTS STATISTICS 2014 AN OVERVIEW
 NATIONAL ACCOUNTS STATISTICS 2014 AN OVERVIEW 1. THE PUBLICATION 1.01 The Central Statistics Office (CSO), Ministry of Statistics and Programme Implementation, regularly compiles estimates of national
CANADA SAUDI ARABIA COUNTRY PROFILE NOTES. Michaël Lambert-Racine
 COUNTRY PROFILE Economic Indicators Gross domestic product (GDP) at purchasing power parity (PPP): US$1.7 trillion (2015) GDP per capita at PPP: US$53,400 (2015) Population: 31.5 million (2015) Merchandise
Malaysia. Key Indicators for Asia and the Pacific Item
 Key Indicators for Asia and the Pacific 2017 1 POPULATION Total population million; as of 1 July 23.49 24.03 24.54 25.04 25.54 26.05 26.55 27.06 27.57 28.08 28.59 29.06 29.51 29.92 30.60 31.20 31.66 Population
YUKON NOTES YUKON S PROFILE. Simon Richards
 YUKON S PROFILE Economic Indicators in 2015 Gross domestic product (GDP): $2.7 billion GDP per capita: $72,500 Population: 37,400 International merchandise exports and imports: 29.1% of GDP Economic Activity
RBI hikes repo rate in Third Bi-monthly Monetary Policy Statement,
 RBI hikes repo rate in Third Bi-monthly Monetary Policy Statement, -19 Policy repo rate increased to 6.50 and the reverse repo rate under the LAF stands at 6.25 On the basis of an assessment of the current
Macroeconomic Overview of India: Recent Trends and Developments
 Macroeconomic Overview of India: Recent Trends and Developments Mathew Joseph Senior Consultant, ICRIER India-Taiwan Relations ICRIER-CIER Joint Feasibility Study New Delhi 17 January 2011 1 Structure
Dechert and the Law Firm of Hassan Mahassni
 Dechert and the Law Firm of Hassan Mahassni PROVIDING COMPREHENSIVE LEGAL SERVICES IN MENA, ASIA AND BEYOND MAHASSNI 900+ LAWYERS 40+ LANGUAGES 29 OFFICES 14 COUNTRIES 1 ASSOCIATION 2 Attorney advertising.
Economic Indicators -- Angola
 Economic Indicators -- Angola Gross Domestic Product, 2000 Angola Sub- Saharan Africa World GDP in million constant 1995 US dollars 6,647 362,493 34,109,900 GDP PPP (million current international dollars)
SECTOR ASSESSMENT (SUMMARY): FINANCE 1
: FINANCE 1") Country Partnership Strategy: Pakistan, 2015 2019 SECTOR ASSESSMENT (SUMMARY): FINANCE 1 1. Sector Performance, Issues and Opportunities 1. Financial sector participants. Pakistan s financial sector is
Country Partnership Strategy: Pakistan, 2015 2019 SECTOR ASSESSMENT (SUMMARY): FINANCE 1 1. Sector Performance, Issues and Opportunities 1. Financial sector participants. Pakistan s financial sector is
Update on potential introduction of VAT in GCC countries
 Update on potential introduction of VAT in GCC countries The United Arab Emirates (UAE) government s decision to eliminate long-standing fuel subsidies as from 1 August 2015 has highlighted the need for
Review of the Economy. E.1 Global trends. January 2014
 Export performance was robust during the third quarter, partly on account of the sharp depreciation in the exchange rate of the rupee and partly on account of a modest recovery in major advanced economies.
NATIONAL ACCOUNTS STATISTICS TO KINGDOM OF TONGA. May Price: T$25.00
 SDT: 35-07 KINGDOM OF TONGA NATIONAL ACCOUNTS STATISTICS 2001-02 TO 2009-10 May 2011 Statistics Department P.O. Box 149, Nuku alofa Government of Tonga Telephone: (676) 23-300 / 23-913 Email: dept@stats.gov.to
Did you know? Facts and figures about the European Union and the G20
 MEMO/11/746 Brussels, 28 October 2011 Did you know? Facts and figures about the European Union and the G20 Please also consult the online flip book with tables and graphs at: http://ec.europa.eu/commission_2010-2014/president/g20/index_en.htm
Plurinational State of Bolivia
 Economic Survey of Latin America and the Caribbean 2008-2009 153 Plurinational State of Bolivia 1. General trends In 2008, Bolivia continued to show positive results in economic activity and external and
GROSS DOMESTIC PRODUCT FOR THE THIRD QUARTER OF 2011
 GROSS DOMESTIC PRODUCT FOR THE THIRD QUARTER OF 2011 In the third quarter of 2011 GDP at current prices amounts to 21 016 million levs. In Euro terms GDP reaches to 10 745 million euro or 1 448.4 euro
PARAGUAY. 1. General trends
 Economic Survey of Latin America and the Caribbean 2018 1 PARAGUAY 1. General trends In 2017, Paraguay s GDP grew by 4.8%, surpassing both the previous year s 4.3% and the average for the region. On the