Morgan Stanley Conference 6th June 2018
|
|
|
- Barbra Wright
- 5 years ago
- Views:
Transcription

1 Morgan Stanley Conference 6th June 2018 Mudgeeraba Queensland 1


2 Delivering high quality residential aged care services to everyday Australians One of Australia s largest aged care providers 68 operational homes Care delivered to 8,000+ older Australians annually Employing over 7,000 staff 2
3 3


4 1H FY18 FINANCIAL OVERVIEW $271.7m OPERATING REVENUE Up 3.3% on 1H FY17 $45.4m EBITDA 1 Up 5.6% on 1H FY17 $20.3m NPAT Up 2.5% on 1H FY17 $51.1m OPERATIONAL CASHFLOW 2 113% EBITDA/Cash conversion $42.3m NET DEBT cents EARNINGS PER SHARE Decrease of 24.5% on 1H FY17 due to dilution impact of FY17 capital raise Extract from Estia Health Investor Presentation half-year ended 31 December

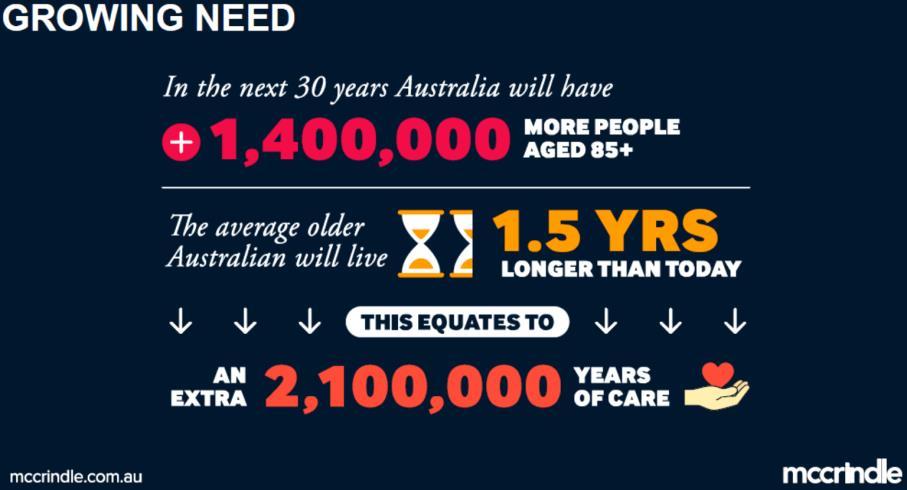
5 AGED CARE DEMAND 1. Source McCrindle, Source ABS 5
6 CARING FOR OLDER AUSTRALIANS Residential Aged Care is not a choice; it is a critical necessity for the many older Australians who become unable to live unassisted at some stage in their life. The continuum of care for older Australians Unassisted Retirement Living Home Support (CHSP) Home Care Residential Aged Care Hospitals Number of people accessing (Dept of Health 2016): 925,000 90, ,000 Increasing clinical acuity Population Aged Over 80 Expected to More than Double in the Next 20 Years Millions of People Aged 70 Years and Over, 2017 to Residential Aged Care Utilisation Increases Significantly for Persons Aged Over 80 % of Females of Each Age Using Residential Aged Care, Years Old 80+ Years Old Graph sources: ACFA Funding Report July 2017, ABS
7 RESIDENTIAL AGED CARE SECTOR OVERVIEW Regulatory environment Strongly regulated operational framework, creating high barriers to entry Increasing sector advocacy leads to stronger Government focus Multiple committees looking at quality of care in the sector Opportunities Fast growing ageing population Continued Government support - CAGR of above 5% expected over next 3 years A necessary part of the health of older persons continuum will continue to be supported Demand will be circa 76,000 additional beds over the next 10 years Consolidation opportunities Sector relatively fragmented with circa 60% of operators still operating a single home. Increased costs to operate in sector will speed consolidation Increased focus on quality will lead those less resourced to opt out Ageing stock in sector with multiple bed sizes, not suitable for future market Consumer Driven changes Increased demand for home support will see focus on quality operations at higher acuity Increased consumer expectations will see demand for single rooms and better quality Quality of care is the expectation, not able to be compromised Well governed, quality-focused operators with scale and capital have the ability to respond to regulatory change, continue to invest in their portfolios and services as well as consider potential consolidation opportunities 7

8 ESTIA S COMPETITIVE ADVANTAGES Established and experienced leadership team Strong balance sheet, low gearing Sustainable profitability driven by robust operational metrics Established, scalable centralised processes delivered through regional model of network clusters High quality portfolio Proven ability to develop and commission new homes with pipeline in hand Our people and care focus 8
9 PEOPLE: CULTURE, QUALITY & CARE IAN THORLEY Dalmeny, New South Wales 9


10 PEOPLE AND CULTURE Staff Engagement Survey September 2017 Organisational Development Leadership series building management capacity Clinical Development Underpinning our service standards Graduate Nurse Program Electronic learning platform ELMO supports mandatory training and compliance requirements Registered Nurse led acuity based staffing model Underpinning standards, supporting attraction and retention of staff 10

11 COMMITMENT TO QUALITY Legislative change Aged Care Quality and Safety Commission - January 2019 New Aged Care Quality Standards Increasing advocacy Governance Clinical risk monitored by Board Risk Committee Directly reports to the Chief Executive Officer Independent external reviews Systems and Processes Uniform Clinical Standards Quality and education functions are independent or operations Clinical Indicator benchmarking informs potential risk Group wide clinical standards and compliance All homes fully compliant with AACQA Standards Independent whistle blower hotline 11


12 CUSTOMER EXPERIENCE Increasing consumer expectations Care model supports resident independence and choice Specialised care for residents living with dementia More complex care required for those residents delaying their entry to residential care Network model provides care and accommodation options for local communities Additional Services enhance the resident experience: Technologies Lifestyle and activities The dining experience 12

13 PROPERTY GROWTH & DEVELOPMENT RITA SHERIDAN Twin Waters, Queensland 13


14 PROPERTY PORTFOLIO Key Portfolio Statistics (as at 1 June 2018) Number of homes Metro 52 Regional 16 Total number of operational homes 68 Freehold sites 61 Total operational places 6,045 Number of single rooms 4,875 6 Single rooms as percentage of total rooms 90% Average number of places per home Number of homes receiving significant refurbishment supplement
15 GROWTH STRATEGY OVERVIEW Delivering solid and sustainable growth to create value for our shareholders Enhancing services and operations Existing Homes Enhancing portfolio Portfolio Expansion Strategic Opportunities Provider of choice in our local communities Provision of first-class care Additional services for our residents Investing in our staff Capital investment to ensure portfolio remains competitive Significant Refurbishment program and accommodation supplements Brownfield and capital recycling opportunities Significant market demand Greenfield developments Operational home acquisitions Turnkey new home purchases Balance sheet strength provides capacity to expand our network of homes by acquisition of small portfolios or single facilities Expand service offering to capitalise on market trends Develop products and services that meet varying needs on the customer journey such as short term restorative and rehabilitative care 15
16 PORTFOLIO ENHANCEMENT Utilisation of land adjacent to operational homes Optimisation of the portfolio building stock through significant and strategic refurbishments 16 homes currently receiving higher accommodation supplement (1,631 beds) 15 homes approved and underway (1,301 beds) Stage 1 sustainability projects of $5m nearing completion Enhanced resident experience EBITDA uplift through supplement Room value uplift Protection of asset lifecycle Improved market appeal 16
 Kogarah March 2018 72 Beds (additional 22 beds)")
")
17 PORTFOLIO EXPANSION Completed Twin Waters September 2017 (114 New Beds) Kogarah March Beds (additional 22 beds) Underway Southport, Sunshine Cove, Blakehurst (345 New Beds) Pending Final Approvals St Ives, Wollongong (~220 New Beds)
18 PORTFOLIO EXPANSION - ACQUISITIONS Criteria will include an assessment and weighting of multiple factors: Network proximity Age of Home, future capital needs and life Quality, size and layout of home Demographics, need, competitive environment Existing resident population Barriers to implementing Estia s operational and care model RAD balance and future outlook for RAD residents Commissioning considerations staff, residents, timescales Acquisitions will be existing operational homes or turnkey new homes, and will be earnings accretive, either on stand-alone basis or as part of a capital recycling plan. 18

19 LOOKING FORWARD NORAH BARLOW Dalmeny, New South Wales 19
20 SECTOR REFORM Uncap bed supply Greater prudential requirements given amount of RADs invested in sector User pays extended to all who can afford to pay Tune Review recommendations could provide clarity for staff, residents, families and investors Introduce nationwide standards for training of care workers Register all aged care workers, including those in home support work, to remove those who should not be in the sector 20
21 LOOKING FORWARD Sector Robust future demand Future demographics are certain Necessary part of society caring for older people Will remain key to government policy No ability to replace people with technology, only to enhance productivity Regulatory change, such as tighter prudential management, providing a further barrier to entry User pays will increase Estia Leadership depth Financial resources to continue to invest in people, systems and property Steady growth able to be built upon now stabilised Solid balance sheet with good liquidity Opportunities to increase revenue through adding capacity, further significant refurbishment to our existing homes, and increased additional service offering Estia, as a well-governed, quality-focused operator with scale and capital, has the ability to respond to regulatory change, to invest in its portfolio and services, as well as grow capacity through development and acquisitions. 21
22 Appendices
23 APPENDIX A: DETAILED FINANCIAL METRICS AND TRENDS 1H FY17 $ 000 2H FY17 $ 000 1H FY18 $ 000 Government Revenue 194, , ,883 Resident Revenue 68,391 68,140 70,861 Total Operating Revenues 263, , ,744 Employee benefits expenses 168, , ,138 Non Wage Costs 51,675 46,940 48,185 EBITDA 42,962 43,538 45,421 Profit on Asset Disposals - 1, Depreciation, amortisation and impairment 8,471 10,389 13,880 Operating profit for the period 34,491 34,186 31,928 Net finance costs 5,854 3,769 3,803 Profit before income tax 28,637 30,417 28,125 Income tax expense 8,879 9,477 7,867 Profit for the period 19,758 20,940 20,258 Government Revenue POBD $192.6 $192.3 $196.0 Resident Revenue POBD $67.6 $67.8 $69.1 Total Revenue POBD $260.2 $260.1 $265.1 Staff Costs POBD $166.6 $170.1 $173.8 Non-Wage Costs POBD $51.1 $46.7 $47.0 Non-Wage Costs excl facility rentals POBD $48.5 $44.2 $44.6 EBITDA Per Occupied Bed Per Year $15,509 $15,804 $16,222 Total Staff Cost % of Revenue 64.0% 65.4% 65.6% Total Non-Wage Costs % of Revenue 19.6% 17.9% 17.7% Non-Wage Costs excl facility rentals % Revenue 18.6% 17.0% 16.8% EBITDA % of Revenue 16.3% 16.6% 16.7% Net RAD Receipts $m $38.7 $41.4 $33.6 Average RAD/Bond held $263,208 $275,037 $283,999 Average Incoming Agreed RAD $376,854 $408,768 $406,405 Average Outgoing RAD/Bond $292,334 $325,380 $332,715 Total RADs/Bonds Held $m $690.4 $730.2 $762.8 Extract from Estia Health Investor Presentations half-year ended 31 December 2017, 31 December 2017 and 2017 Annual Report,. 23
24 APPENDIX B: STATUTORY BALANCE SHEET 31 Dec Jun 17 $ 000 $ 000 Current assets Cash and cash equivalents 17,706 19,215 Trade and other receivables 9,571 10,359 Prepayments and other assets 8,182 5,353 Assets held for sale - 2,561 Income tax receivable 73 Total current assets 35,532 37,488 Non-current assets Property, plant and equipment 730, ,549 Investment properties 1,500 1,500 Goodwill 817, ,074 Other intangible assets 218, ,916 Total non-current assets 1,767,819 1,761,039 Total assets 1,803,351 1,798,527 Current liabilities Trade and other payables 35,059 28,855 Loans and borrowings Income received in advance 31, Refundable accommodation deposits and bonds 762, ,222 Other financial liabilities 1,261 1,293 Income tax payable 4,227 Provisions 40,407 38,955 Total current liabilities 870, ,840 Non-current liabilities Deferred tax liabilities 107, ,765 Loans and borrowings 60, ,250 Provisions 4,411 3,441 Other payables Total non-current liabilities 171, ,571 Total liabilities 1,042,561 1,037,411 Net assets 760, ,116 Equity Issued capital 801, ,830 Share-based payments reserve Accumulated losses (41,977) (41,387) Total equity 760, ,116 Extract from Estia Health Consolidated Interim Financial Report for the half-year ended 31 December
25 APPENDIX C: STATUTORY CASHFLOW 1H FY18 $ 000 1H FY17 $ 000 Cash flows from operating activities Receipts from residents 69,659 66,748 Receipts from government 232, ,732 Payments to suppliers and employees (220,054) (212,348) Operational cash flows before interest, income tax and RADs 82,390 86,132 Interest received Finance costs paid (3,979) (6,096) Income tax paid (13,768) (20,374) Net cash flows from operating activities before net RADs 64,768 59,981 RAD, accommodation bond and ILU entry contribution received 137, ,394 RAD, accommodation bond and ILU entry contribution refunded (103,958) (94,662) Net cash flows from operating activities 98,318 98,713 Cash flows from investing activities Payments for business combinations, net of cash acquired - (86,364) Payments for acquisition transaction costs - (6,764) Payments for intangible assets (322) (822) Proceeds from sale of property, plant and equipment - 46 Proceeds from sale of assets held for sale 4,193 - Purchase of property, plant and equipment (21,339) (24,006) Net cash flows used in investing activities (17,468) (117,910) Cash flows from financing activities Proceeds from issue of share capital 3 84,898 Payments for share issue costs - (3,090) Proceeds from repayment of MEP loans - 60 Proceeds from borrowings 20,000 76,500 Repayment of borrowings (81,514) (63,500) Dividends paid (20,848) (19,242) Net cash flows (used in)/from financing activities (82,359) 75,626 Net (decrease)/increase in cash and cash equivalents (1,509) 56,429 Cash and cash equivalents at the beginning of the period 19,215 29,810 Cash and cash equivalents at the end of the period 17,706 86,239 Extract from Estia Health Consolidated Interim Financial Report for the half-year ended 31 December
26 APPENDIX D :NET DEBT AND CASH FLOW 6 MONTHS ENDED 31 DECEMBER 2017 Net Debt Bridge ($m) (51.1) (31.3) (33.6) (20) (4.2) (40) Net Debt as at 1 July 2017 Operational Cash Flow Govt Prepayment Net RAD Flows Sale of Assets Capital Investments Tax paid Finance Costs Dividends Net Debt as at 31 Dec 2017 Net RAD Inflow ($m) Capital Investments (104.0) Balance as at 1 Jul 2017 Refunds Probate Liability Incoming RADs on Existing Beds 1.5 Incoming RADs on New Beds (0.9) Deductions from RADs / Bonds Balance as at 31 Dec 2017 $m Maintenance Capex 6.5 Significant Refurbishments 6.4 New Builds 8.8 Total Probate Liability refers to RADs and Bonds not yet refunded for departed residents, is included within the total RAD/Bond balance and increased from $76.0m at 30 June 2017 to $84.6m at 31 December Extract from Estia Health Investor Presentation half-year ended 31 December

27 APPENDIX E: INDICATIVE NEW DEVELOPMENT CASHFLOW PROFILE Based on: Beds 100 Land Cost $2,500,000 Construction, Planning, Design per bed $260,000 Residents: Concessional 35% RADs as % of Non-Concessional 60% Average RAD Price $500,000 Eventual RAD Pool $18,525,000 Occupancy 95% Optimised incremental EBITDA POB PA $25,000 Gross Investment Cost $28,500,000 Net of RADs Investment Cost $9,975,000 27
28 APPENDIX F: BOARD AND MANAGEMENT Board of Directors Executive Leadership Name Title Appointed Name Title Appointed to Position Dr Gary Weiss Norah Barlow OMNZ Paul Foster Non-Executive Director and Chairman Chief Executive Officer and Managing Director Non-Executive Director NED Feb-16 Chairman Jan-17 NED Nov-14 Acting CEO Sep-16 CEO and MD Oct-16 Feb-16 Norah Barlow Ian Thorley Chief Executive Officer and Managing Director Deputy Chief Executive Officer and Chief Operating Officer Acting CEO Sep-16 CEO and MD Oct-16 Oct-16 Steve Lemlin Chief Financial Officer Feb-17 Maryann Curry Chief Nursing Officer Dec-16 Andrew Harrison Non-Executive Director Nov-14 Mark Brandon Chief Policy and Regulatory Officer Dec-16 The Hon. Warwick L. Smith AM Non-Executive Director May-17 Mary Burke Quality Director Jan-16 Jane Murray People and Culture Director Jul-17 Helen Kurincic Non-Executive Director Jul-17 Fiona Caldwell Chief Information Officer Oct-17 Damian Hiser Chief Customer Officer Oct-17 Rita Sheridan GM, Property & Development Mar-18 Refer to Estia Health website for further detail. 28
29 DISCLAIMER Reliance on third party information This presentation may contain information that has been derived from publicly available sources that have not been independently verified. No representation or warranty is made as to the accuracy, completeness or reliability of the information. No responsibility, warranty or liability is accepted by the Company, its officers, employees, agents or contractors for any errors, misstatements in or omissions from this Presentation. Presentation is a summary only This Presentation is information in a summary form only and does not purport to be complete. It should be read in conjunction with the Company s Condensed Consolidated Interim Financial Report for the half-year ended 31 December Any information or opinions expressed in this Presentation are subject to change without notice and the Company is not under any obligation to update or keep current the information contained within this Presentation. Not investment advice This Presentation is not intended and should not be considered to be the giving of investment advice by the Company or any of its shareholders, Directors, officers, agents, employees or advisers. The information provided in this Presentation has been prepared without taking into account the recipient s investment objectives, financial circumstances or particular needs. Each party to whom this Presentation is made available must make its own independent assessment of the Company after making such investigations and taking such advice as may be deemed necessary. No offer of securities Nothing in this Presentation should be construed as either an offer to sell or a solicitation of an offer to buy or sell Company securities in any jurisdiction. Forward looking statements This Presentation may include forward-looking statements. Although the Company believes the expectations expressed in such forwardlooking statements are based on reasonable assumptions, these statements are not guarantees or predictions of future performance, and involve both known and unknown risks, uncertainties and other factors, many of which are beyond the Company s control. As a result, actual results or developments may differ materially from those expressed in the statements contained in this Presentation. Investors are cautioned that statements contained in this Presentation are not guarantees or projections of future performance and actual results or developments may differ materially from those projected in forwardlooking statements. No liability To the maximum extent permitted by law, neither the Company nor its related bodies corporate, Directors, employees or agents, nor any other person, accepts any liability, including without limitation any liability arising from fault or negligence, for any direct, indirect or consequential loss arising from the use of this Presentation or its contents or otherwise arising in connection with it. Disclosure of non-ifrs financial information Throughout this presentation, there are occasions where financial information is presented not in accordance with accounting standards. There are a number of reasons why the Company has chosen to do this including: to maintain a consistency of disclosure across reporting periods; to demonstrate key financial indicators in a comparable way to how the market assesses the performance of the Company; to demonstrate the impact that significant one-off items have had on Company performance. Where Company earnings have been distorted by significant items Management have used their discretion in highlighting these. These items are non-recurring in nature and considered to be outside the normal course of business. Unaudited numbers used throughout are labelled accordingly. 29
1H FY18 HALF YEAR RESULTS
 1H FY18 HALF YEAR RESULTS 22 February 2018 Mudgeeraba Queensland 1 CONTENTS 1. OVERVIEW & HIGHLIGHTS 2. FINANCIAL PERFORMANCE 3. GROWTH STRATEGY 4. SUMMARY AND OUTLOOK APPENDICES Artist s Impression :
FY18 FULL YEAR RESULTS 16 AUGUST Estia Mudgeeraba, Queensland
 16 AUGUST 2018 Estia Mudgeeraba, Queensland CONTENTS 1. OVERVIEW & HIGHLIGHTS 2. FINANCIAL PERFORMANCE 3. GROWTH STRATEGY 4. OPTIMISING PERFORMANCE 5. INDUSTRY LANDSCAPE & OUTLOOK 6. APPENDICES Estia Tea
For personal use only
 FINANCIAL PERFORMANCE HIGHLIGHTS DELIVERING ON FY2020 STRATEGY Estia Health (EHE) 7 December 2015 1 HIGHLIGHTS Acquisition of medium-sized group, Kennedy Health Care - 959 places 5,690 places by the end
2011 Interim Results. Keith Gordon, Managing Director & Chief Executive Officer Stephen Gobby, Chief Financial Officer
 2011 Interim Results Keith Gordon, Managing Director & Chief Executive Officer Stephen Gobby, Chief Financial Officer Emeco 2011 Interim Results Overview Financials Strategy & Outlook Questions Appendices
For personal use only
 Investor Presentation Half Year Results to 31 December 2016 24 February 2017 PETER CAUGHEY, CEO & MANAGING DIRECTOR 1 Agenda Overview Financials Business conditions, strategy and outlook 2 Overview 1H17
Ingenia Communities Group
 INGENIA COMMUNITIES GROUP Morgan s Investor Queensland Conference Conference Ingenia Communities Group 23 October 2015 October 2015 Lakeside Lara, Lara, VIC OUR BUSINESS Ingenia is a leading owner, operator
For personal use only
 Affinity Education Group Full Year 2014 Results 27 February 2015 2014 Highlights FY 2014 Earnings Growth Underlying EBITDA of $17.9m (1) and underlying NPAT of $11.4m (1) Underlying EPS of 8.1 cents (1)
For personal use only
 Affinity Education Group (ASX:AFJ) Morgans Conference 10 October 2014 Disclaimer This presentation contains general information in summary form which is current as at 10 October 2014. It presents financial
A S X A N N O U N C E M E N T
 A S X A N N O U N C E M E N T DATE: 24 February 2016 Attached is the Presentation regarding Pact s Half year Financial Results for the half year ended 31 December 2015. The Presentation will occur at 10am
Affinity Education Group. Half Year Results
 Affinity Education Group Half Year Results 29 August 2014 Disclaimer This presentation contains general information in summary form which is current as at 29 August 2014. It presents financial information
Interim Results Presentation
 Interim Results Presentation Half Year 31 December 2015 Released 15 February 2016 Scott McMillan, Managing Director Lee Schofield, Chief Executive Officer Matt Dyer, Chief Financial Officer Key Messages
Interim FY 2015 results 6 months ended 31 December February 2015
 Interim FY 2015 results 31 December 2014 18 February 2015 Highlights Solid trading result for 1H FY2015; change in accounting policy for acquisition of healthcare practices First half result highlights
2018 HALF YEAR RESULTS
 2018 HALF YEAR RESULTS INVESTOR PRESENTATION 27 AUGUST 2018 DISCLAIMER The material in this presentation has been prepared by G8 Education Limited (G8) and is general background information about G8 s
Results Presentation Half-year ended 31 December 2013
 Results Presentation Half-year ended 31 December 2013 17 February 2014 OVERVIEW Business Snapshot 8 years of growing annuity income streams Annuity Income Founded in 2003 Develop and manage land lease
For personal use only
 NATIONAL STORAGE REIT JP MORGAN AUSTRALIAN REIT FORUM ASIA MARCH 2017 IMPORTANT NOTE & DISCLAIMER This presentation has been prepared by National Storage REIT ( NSR ) comprising National and may involve
FY16 Financial Results Investor Presentation. August 2016
 FY16 Financial Results Investor Presentation August 2016 FY16 Results Summary Improvement on FY15 across all key earnings metrics EPS growth and improved shareholder returns Revenue EBITDA PBT EPS Dividend
Ramsay Health Care Christopher Rex, Managing Director. Australia and New Zealand 7th Annual Investment Conference London 9 March, 2010
 Ramsay Health Care Christopher Rex, Managing Director Australia and New Zealand 7th Annual Investment Conference London 9 March, 2010 DISCLAIMER This Presentation has been prepared by Ramsay Health Care
For personal use only
 AGENDA 10-20 Bond Street: Chillers with variable speed drives BSA RESULTS AND OVERVIEW FINANCIAL REVIEW BUSINESS UNIT REVIEW SUMMARY 2 BSA RESULTS Fiona Stanley Hospital: Central Energy Services Plant
For personal use only
 FY16 FULL YEAR RESULTS REVIEW Agenda GROUP RESULTS OVERVIEW BUSINESS UNIT REVIEW OUTLOOK Eastlands Shopping Centre BSA completed the mechanical services upgrade and extension to one 29/08/2016 BSA Limited
FY 2018 results presentation
 FY 2018 results presentation EMERGING FINANCIAL SERVICES COMPANY STRONGLY LEVERAGED TO SUPERANNUATION SECTOR, DELIVERS RECORD GROWTH OneVue Holdings Limited (OVH) 27 August 2018 1 HIGHLIGHTS Market leading
FINANCIAL RESULTS PRESENTATION H1FY18
 Virtus Health (ASX:VRT) FINANCIAL RESULTS PRESENTATION H1FY18 Tuesday 20 th February, 2018 9.15am AEDT DISCLAIMER The material in this presentation has been prepared by Virtus Health Limited ABN 80 129
1H 19 Investor Presentation February 2019
 1H 19 Investor Presentation February 2019 1 About Raiz Raiz (formerly Acorns) is a mobile first micro-investing platform via mobile phone or web app, which allows customers to invest in a portfolio of
For personal use only. Investor Update. January
 1 Investor Update January 2019 www.aspermont.com The leading media services provider to the global resources industry 2 Aspermont is ASX listed with offices in Australia, UK, Brazil, North America and
Goldman Sachs Ninth Annual Mid-Cap Conference
 Presented by Simon Owen, CEO 17 APRIL 2018 INGENIA COMMUNITIES GROUP Goldman Sachs Ninth Annual Mid-Cap Conference Contents Business overview 3 1H18 results highlights 7 Capital management 8 Future growth
For personal use only
 2015 Full Year Results Presentation MATRIX COMPOSITES AND ENGINEERING 19 August 2015 Agenda Overview Financial results Operational review Strategy & outlook 2 Overview Financial Revenue: $144.1 million
2018 Full Year Results Presentation
 2018 Full Year Results Presentation MATRIX COMPOSITES & ENGINEERING Aaron Begley Chief Executive Officer Brendan Cocks Chief Financial Officer 23 August 2018 Disclaimer Reliance on third party information
Half Year Results Presentation March 2011 Tony Caruso CEO & Managing Director Chris Kneipp Financial Controller
 Mastermyne Group Limited FY2011 Half Year Results Presentation March 2011 Tony Caruso CEO & Managing Director Chris Kneipp Financial Controller Disclaimer The following disclaimer applies to this presentation
FY12 Results 22 May 2012
 FY12 Results 22 May 2012 DISCLAIMER --- Important Notice This presentation has been prepared by Thorn Group Limited (Thorn). This presentation is not a financial product or investment advice or recommendation,
FY Alliance Aviation Services Limited Results Presentation. August 2018
 FY 2018 Alliance Aviation Services Limited Results Presentation August 2018 Key Messages Alliance Aviation Services Limited announces a full year result which includes: $ 26.1m A strong financial performance
Class Limited. FY17 Results Presentation. Kevin Bungard, CEO 15 August 2017
 Class Limited FY17 Results Presentation Kevin Bungard, CEO 15 August 2017 Important information This presentation is provided for information purposes only. The information in this presentation is in a
COVENTRY GROUP LTD AGM CHAIRMAN S AND CEO S ADDRESSES 22 NOVEMBER 2017
 COVENTRY GROUP LTD AGM CHAIRMAN S AND CEO S ADDRESSES 22 NOVEMBER 2017 Good morning ladies and gentlemen and welcome to the 81st Annual General Meeting of Coventry Group Ltd. My name is Neil Cathie and
Interim Results Presentation. For the six months ended 31 December 2018
 Interim Results Presentation For the six months ended 31 December 2018 1 STEEL & TUBE IS One of New Zealand s leading providers of steel solutions, and a proud New Zealand company, with over 65 years of
OVERVIEW. Operating cash flow $447.8 million, EBITDA conversion 92.8% Total revenue 1 $7,394 million, down 0.5%
 OVERVIEW Total revenue 1 $7,394 million, down 0.5% Earnings Before Interest and Tax (EBIT) $276.9 million, down 10.6%. Down 1.5% adjusting for $13 million Capital Metro bid costs and $15 million reduction
For personal use only
 Appendix 4D Results for announcement to the market (ACN 104 113 760) This half-year report is provided to the Australian Securities Exchange (ASX) under ASX listing Rule 4.2A.3. Current reporting period:
FY15 RESULTS 27 AUGUST 2015 PETER CAUGHEY, CEO & MANAGING DIRECTOR
 FY15 RESULTS 27 AUGUST 2015 PETER CAUGHEY, CEO & MANAGING DIRECTOR 1 FY15 Overview Refreshed governance structure Executive Chair retired and role split into Non-Executive Chair and CEO New Non-Executive
FUA. For personal use only INVESTOR PRESENTATION. $5b $4b. $3b 7 months $2b 11 months $1b 27 months $100m June 12
 FUA INVESTOR PRESENTATION UBS - Emerging Companies Conference Series: Fintechs 30 May 2017 $5b $4b May 17 5 months 7 months $3b 7 months $2b 11 months $1b 27 months $100m June 12 2 Overview 4 7 13 19 20
For personal use only
 A S X A N N O U N C E M E N T DATE: 24 August 2016 FY2016 RESULTS PRESENTATION Attached is the Presentation regarding Pact s Financial Results for the year ended 30 June 2016. The Presentation will occur
2018 Half Year Results Presentation
 2018 Half Year Results Presentation MATRIX COMPOSITES & ENGINEERING Aaron Begley Chief Executive Officer Brendan Cocks Chief Financial Officer 22 February 2018 Disclaimer Reliance on third party information
For personal use only
 FY15 FULL YEAR RESULTS REVIEW Progressing to plan Agenda GROUP RESULTS OVERVIEW BUSINESS UNIT REVIEW OUTLOOK 150 Collins Street, Westpac Building. Mechanical work was completed by Allstaff Airconditioning
FINANCIAL RESULTS PRESENTATION FY2018
 Virtus Health (ASX:VRT) FINANCIAL RESULTS PRESENTATION FY2018 Tuesday 21 August, 2018 AEST DISCLAIMER The material in this presentation has been prepared by Virtus Health Limited ABN 80 129 643 492 ( Virtus
2017 half year results investor presentation
 2017 half year results investor presentation 27 February 2017 contents section presenting slide CEO presentation Julian Ogrin 3 broadband 10 CFO presentation Leanne Wolski 14 summary Julian Ogrin 21 appendix
FY2014 Full year results
 FY2014 Full year results Peter Watson CEO I Managing Director Ian Poole Chief Financial Officer 28 August 2014 FY2014 year in review Resources capital expenditure conditions subdued Strong underlying result
2017 FULL YEAR RESULTS
 2017 FULL YEAR RESULTS ESTABLISHING LEADING POSITIONS IN NEW GROWTH SECTORS Malcolm Bundey Managing Director and CEO Richard Betts Chief Financial Officer 16 August 2017 Pact Group Holdings Ltd ABN: 55
For personal use only
 2016 Full Year Results Presentation MATRIX COMPOSITES & ENGINEERING Aaron Begley Chief Executive Officer Peter Tazewell Chief Financial Officer 24 August 2016 Agenda Overview Financial results Strategy
rhipe Limited (ASX code RHP) FY16 Full Year Results Presentation & FY 2017 Outlook
 FY16 Full Year Results Presentation & FY 2017 Outlook") rhipe Limited (ASX code RHP) FY16 Full Year Results Presentation & FY 2017 Outlook Dominic O Hanlon, CEO & Managing Director Mike Hill, Executive Chairman 1 This presentation has been prepared by rhipe
rhipe Limited (ASX code RHP) FY16 Full Year Results Presentation & FY 2017 Outlook Dominic O Hanlon, CEO & Managing Director Mike Hill, Executive Chairman 1 This presentation has been prepared by rhipe
FINANCIAL & OPERATIONAL RESULTS
 FINANCIAL & OPERATIONAL RESULTS HALF YEAR ENDED 31 DECEMBER 2018 26 February 2019 DISCLAIMER This presentation contains forward-looking statements. Forward-looking statements often include words such as
ASX: DDR FY16 Results Presentation. March 2017
 ASX: DDR FY16 Results Presentation March 2017 Corporate Headlines Capital Structure Share Price (24 Mar 2017) $2.17 Fully paid ordinary shares 160.0m Options 0.0m Market Capitalisation $347.2m Shareholders
2009 FULL YEAR FINANCIAL RESULTS
 OZ MINERALS 2009 FULL YEAR FINANCIAL RESULTS TERRY BURGESS MANAGING DIRECTOR & CEO ANDREW COLES CHIEF FINANCIAL OFFICER 25 February 2010 WWW.OZMINERALS.COM OZ MINERALS NOVEMBER 2009 PAGE 1 IMPORTANT NOTICE
For personal use only
 GENERATION HEALTHCARE REIT (ASX CODE: GHC) 2013 QUEENSLAND CONFERENCE 9 OCTOBER 2013 generationreit.com.au AGENDA Who/what is Generation Healthcare The Healthcare Sector A Snap shot Why Healthcare property
AUB GROUP LTD FULL YEAR RESULTS
 AUB GROUP LTD FULL YEAR RESULTS FOR THE PERIOD ENDED 30 JUNE 207 (FY7) 28 TH AUGUST 207 Page - AUB Group Ltd FY7 Results NOTICE SUMMARY INFORMATION This document has been prepared by AUB Group Limited
AUB GROUP LTD HALF YEAR RESULTS
 AUB GROUP LTD HALF YEAR RESULTS FOR THE PERIOD ENDED 31 DECEMBER 2017 (1H18) 26 FEBRUARY 2018 Page 1 - AUB Group Ltd 1H18 Results NOTICE SUMMARY INFORMATION This document has been prepared by AUB Group
For personal use only
 Ruralco 2012 Full Year Results Briefing 20 November 2012 1 Presentation Outline Performance Overview Activity Performance Capital Management Strategy Update Summary & Outlook 2 Key Outcomes Performance
Financial Year 1H19 Results
 Financial Year 1H19 Results Investor presentation 20 November 2018 1 Agenda 1. 1H19 Summary 2. 1H19 Financial results 3. FY19 Outlook 4. Q&A 5. Appendix 2 1H19 Summary Skander Malcolm Chief Executive Officer
OneVue Holdings Limited (OVH)
") OneVue Holdings Limited (OVH) H1 FY 2018 results presentation 26 February 2018 1 HIGHLIGHTS 2 FINANCIALS 3 OUTLOOK 4 APPENDICES Page 2 1 HIGHLIGHTS . BENEFITTING FROM SECTORAL GROWTH AND STRUCTURAL DISRUPTION
OneVue Holdings Limited (OVH) H1 FY 2018 results presentation 26 February 2018 1 HIGHLIGHTS 2 FINANCIALS 3 OUTLOOK 4 APPENDICES Page 2 1 HIGHLIGHTS . BENEFITTING FROM SECTORAL GROWTH AND STRUCTURAL DISRUPTION
FY18 Results Presentation Bravura Solutions Limited. 28 August 2018
 FY18 Results Presentation Bravura Solutions Limited 28 August 2018 Important notice and disclaimer The information contained in this document (including this notice) and discussed at this presentation
FY 2015 Results Presentation. 19 January 2016
 FY 2015 Results Presentation 19 January 2016 Disclaimer THIS PRESENTATION IS NOT AN OFFER OR SOLICITATION OF AN OFFER TO BUY OR SELL SECURITIES IN THE UNITED STATES OF AMERICA OR IN ANY OTHER JURISDICTION.
Vita Group (VTG)! Results Presentation!
! Results Presentation!") Vita Group (VTG) Results Presentation First half FY14 Group highlights Sustained trend of strong profit, dividend growth Underlying EBITDA 1 +18%, underlying NPAT 2 +56%, dividend +66% Areas of strategic
Vita Group (VTG) Results Presentation First half FY14 Group highlights Sustained trend of strong profit, dividend growth Underlying EBITDA 1 +18%, underlying NPAT 2 +56%, dividend +66% Areas of strategic
Half Year FY 2015 Results Presentation FEBRUARY 2015
 Half Year FY 2015 Results Presentation FEBRUARY 2015 25/02/2015 v1.3 HALF YEAR FY 2015 FINANCIAL RESULTS Revenue of $13.5m, up 65% over the prior corresponding period. EBITDA of $1.6m, up 282% over the
Integrated Dental Holdings. Q4 FY2018 and year-end results - investor presentation 27 June 2018
 Integrated Dental Holdings Q4 FY2018 and year-end results - investor presentation 27 June 2018 DISCLAIMER THIS PRESENTATION IS NOT AN OFFER OR SOLICITATION OF AN OFFER TO BUY OR SELL SECURITIES IN THE
HELLABY HOLDINGS CREATING SHAREHOLDER VALUE. Alan Clarke, Managing Director Edison Investor Presentation, June 2016
 HELLABY HOLDINGS CREATING SHAREHOLDER VALUE Alan Clarke, Managing Director Edison Investor Presentation, June 2016 Our Evolution: From Listed Private Equity HELLABY UNTIL NOW 1980s: Meat Company that became
McCarthy & Stone plc Half year results to 29 February 2016 Strong growth delivers increased profits. Liberty House, Raynes Park, Assisted Living
 McCarthy & Stone plc Half year results to 29 February 2016 Strong growth delivers increased profits Liberty House, Raynes Park, Assisted Living Disclaimer THIS DOCUMENT IS BEING MADE AVAILABLE TO THE RECIPIENT
16.1c c c
 1 2016 Interim Result Highlights Successful delivery, ahead of PDS 2 Exceeded revised earnings guidance Six months to 31 Dec 15 Solid capital management 7.97c 7.65c $2.15 28.3% Earnings per unit Distribution
BABCOCK & BROWN COMMUNITIES (BBC) CHAIRMAN S ADDRESS
 CHAIRMAN S ADDRESS") ASX Release 16 November 2007 BABCOCK & BROWN COMMUNITIES (BBC) CHAIRMAN S ADDRESS Please see attached the Chairman s address and presentation being made today at the Annual General Meeting of Babcock &
ASX Release 16 November 2007 BABCOCK & BROWN COMMUNITIES (BBC) CHAIRMAN S ADDRESS Please see attached the Chairman s address and presentation being made today at the Annual General Meeting of Babcock &
FY18 1 ST HALF RESULTS
 26 FEBRUARY 2018 FY18 1 ST HALF RESULTS Chief Executive Officer : Chief Financial Officer : John Croll James Orlando isentia.com AGENDA Overview of H1 FY18 Results Strategic Focus H1 FY18 Financial Performance
Half Year Result 2016
 Half Year Result 2016 MATRIX COMPOSITES & ENGINEERING Aaron Begley Chief Executive Officer Peter Tazewell Chief Financial Officer 24 February 2016 Agenda Overview Financial results Performance, strategies
1. Half Year Results November Investor Briefing 2018 Half Year Results 8 November 2018
 1. Half Year Results November 2018 Investor Briefing 2018 Half Year Results 8 November 2018 Contents FY19 first half highlights Retail overview Generation and wholesale market overview Overview of financial
VIRTUS HEALTH (ASX: VRT) FINANCIAL RESULTS PRESENTATION FY2017
 FINANCIAL RESULTS PRESENTATION FY2017") VIRTUS HEALTH (ASX: VRT) FINANCIAL RESULTS PRESENTATION FY2017 Tuesday 22 nd August, 2017 AEST DISCLAIMER The material in this presentation has been prepared by Virtus Health Limited ABN 80 129 643 492
VIRTUS HEALTH (ASX: VRT) FINANCIAL RESULTS PRESENTATION FY2017 Tuesday 22 nd August, 2017 AEST DISCLAIMER The material in this presentation has been prepared by Virtus Health Limited ABN 80 129 643 492
NATIONAL STORAGE REIT (NSR) 2018 ANNUAL GENERAL MEETING ADDRESSES
 2018 ANNUAL GENERAL MEETING ADDRESSES") P 1800 683 290 A Level 23, 71 Eagle Street, Brisbane QLD 4000 P GPO Box 3239 QLD 4001 E invest@nationalstorage.com.au nationalstorage.com.au 14 November 2018 ASX Market Announcements Office ASX Limited
P 1800 683 290 A Level 23, 71 Eagle Street, Brisbane QLD 4000 P GPO Box 3239 QLD 4001 E invest@nationalstorage.com.au nationalstorage.com.au 14 November 2018 ASX Market Announcements Office ASX Limited
Class Limited. FY18 Results Presentation. Kevin Bungard, CEO 21 August 2018
 Class Limited FY18 Results Presentation Kevin Bungard, CEO 21 August 2018 Important information This presentation is provided for information purposes only. The information in this presentation is in a
For personal use only
 HUGHES DRILLING LIMITED ABN 12 124 279 750 APPENDIX 4D FINANCIAL REPORT HALF YEAR ENDED 31 DECEMBER 2014 Contents Results for Announcement to the Market 3 Page Directors Report 4 Auditors declaration of
Transpacific FY15 Half Year Results Presentation
 Transpacific FY15 Half Year Results Presentation Robert Boucher CEO Brendan Gill CFO 20 February 2015 - Disclaimer Forward looking statements - This presentation contains certain forward-looking statements,
For personal use only
 ACN 072 507 147 ASX & MEDIA RELEASE 25 May 2017 THORN FY17 KEY NUMBERS UP, ISSUES BEING ADDRESSED Consumer leasing and business finance company, Thorn Group Limited (ASX: TGA), has lifted revenue, EBIT
QANTM. Half Year Results Presentation. Leon Allen, Managing Director and CEO Martin Cleaver, Chief Financial Officer. Six months to 31 December 2017
 Half Year Results Presentation Six months to 31 December 2017 QANTM 22 FEBRUARY 2018 Leon Allen, Managing Director and CEO Martin Cleaver, Chief Financial Officer Disclaimer This presentation has been
For personal use only
 DWS Limited 2017 Half Year Results Presentation Contents Introduction Danny Wallis (CEO) / Stuart Whipp (CFO) Results Highlights Half Year Results Summary Review Capital Management Operations Update Summary
Presented by Simon Owen 20 September Ingenia Lifestyle South West Rocks INGENIA COMMUNITIES GROUP ASX CEO SESSIONS
 Presented by Simon Owen 20 September 2016 Ingenia Lifestyle South West Rocks INGENIA COMMUNITIES GROUP ASX CEO SESSIONS Page 2 Business Overview Creating Australia s best lifestyle communities Over 5,000
FY2018 Half Year Results Presentation 1 March 2018
 FY2018 Half Year Results Presentation Brands AMA Group Overview Vehicle Panel Repair Vehicle Protection Products & Accessories Automotive Electrical & Cable Accessories Automotive Component Remanufacturing
LIFE STARTS HERE. FY18 Full Year Results Presentation. 27 August 2018
 LIFE STARTS HERE FY18 Full Year Results Presentation 27 August 2018 Disclaimer The presentation has been prepared by Monash IVF Group Limited (ACN 169 302 309) ( MVF ) (including its subsidiaries, affiliates
BOARD OF DIRECTORS. James Flude Chief Financial Officer. Peter Cheung Executive Chairman. Steve Crossley Chief Executive Officer
 ANNUAL GENERAL MEETING YEAR ENDED 30 APRIL 2016 SEPTEMBER 2016 BOARD OF DIRECTORS Peter Cheung Executive Chairman Steve Crossley Chief Executive Officer James Flude Chief Financial Officer Joanne Lake
Sigma Pharmaceuticals Limited
 Investor Relations Contact: Gary Woodford Corporate Affairs Manager Gary.Woodford@signet.com.au Phone: 03 9215 9632 Mobile: 0417 399 204 Mark Hooper CEO and Managing Director Gary Woodford Corporate Affairs
Monash IVF Group. FY16 Results Presentation 26 August 2016
 Monash IVF Group FY16 Results Presentation 26 August 2016 Disclaimer The presentation has been prepared by Monash IVF Group Limited (ACN 169 302 309) ( MVF ) (including its subsidiaries, affiliates and
FY2015 Annual Results August Brett McKeon - CEO David Bailey - CFO
 FY2015 Annual Results August 27 2015 Brett McKeon - CEO David Bailey - CFO FY2015 Financial Results Highlights Delivery on FY15 Prospectus forecasts Pro forma NPAT $19.3 million up 8.4% against IPO forecast
Chief Executive Officer : John Croll Chief Financial Officer : James Orlando
 23 AUGUST 2017 FY17 RESULTS Chief Executive Officer : John Croll Chief Financial Officer : James Orlando isentia.com AGENDA Overview of FY17 Results Strategic Focus FY17 Financial Performance Q&A John
Investor & Analyst Presentation Ful YearResults 30 June2016 For personal use only 25th August 2016 Rebekah O Flaherty - CEO I Jonathan Kenny - CFO
 Investor & Analyst Presentation Full YearResults 30 June2016 25th August 2016 Rebekah O Flaherty - CEO I Jonathan Kenny - CFO Agenda 1 Overview 2 Strategic Priorities 3 FY16 Financial Results 4 FY17 Outlook
Engenco Limited Investor Presentation FY17. Presented by: Vince De Santis (Chairman) Kevin Pallas (Managing Director & CEO)
 Kevin Pallas (Managing Director & CEO)") Engenco Limited Investor Presentation Presented by: Vince De Santis (Chairman) Kevin Pallas (Managing Director & CEO) Company $8,269,000 Highlights Total profit for the period Revenue (from continuing
Engenco Limited Investor Presentation Presented by: Vince De Santis (Chairman) Kevin Pallas (Managing Director & CEO) Company $8,269,000 Highlights Total profit for the period Revenue (from continuing
QANTM. Full Year Results Presentation. Leon Allen, Managing Director and CEO Martin Cleaver, Chief Financial Officer. 12 months to 30 June 2017
 Full Year Results Presentation 12 months to 30 June 2017 QANTM 30 AUGUST 2017 Leon Allen, Managing Director and CEO Martin Cleaver, Chief Financial Officer Disclaimer This presentation has been prepared
Westpac Banking Corporation
 Westpac Banking Corporation David Morgan Chief Executive Officer March 2007 Westpac Banking Corporation at a glance Australia s first bank est. 1817 Top 50 bank globally 1 Consistent earnings growth Strong
For personal use only 1H 2016 RESULTS 6 M O N T H S E N D E D 3 1 D E C E M B E R
 1H 2016 RESULTS 6 M O N T H S E N D E D 3 1 D E C E M B E R 2 0 1 5 17 FEBRUARY 2016 OVERVIEW 1H 2016 Underlying result in line with expectations Reported results strong supported by one-offs Strengthened
FY2016 H1 Results Presentation. September 2016
 FY2016 H1 Results Presentation September 2016 Corporate Headlines Capital Structure Share Price (1 Sep 2016) $1.97 Fully paid ordinary shares 159.4m Options 0.0m Shareholders Founder -David Dicker 60.6m
OneVue Holdings Limited (OVH)
") OneVue Holdings Limited (OVH) FY 2017 results presentation 28 August 2017 Regulators, fund managers and investors are calling for greater transparency of platform costs and revenue drivers Platform differentiation
OneVue Holdings Limited (OVH) FY 2017 results presentation 28 August 2017 Regulators, fund managers and investors are calling for greater transparency of platform costs and revenue drivers Platform differentiation
FY18 Results Presentation. August 2018
 FY18 Results Presentation August 2018 1 Disclaimer 2 Summary information This presentation contains summary information about Managed Accounts Holdings Limited (Company) (ASX: MGP) and its activities as
OneVue Holdings Limited (OVH)
") OneVue Holdings Limited (OVH) Morgan Stanley Emerging Companies Conference Thursday 7 June 2018 A FINTECH COMPANY THAT PARTNERS TO DISRUPT ALONG THE SUPERANNUATION VALUE CHAIN Market leading businesses,
OneVue Holdings Limited (OVH) Morgan Stanley Emerging Companies Conference Thursday 7 June 2018 A FINTECH COMPANY THAT PARTNERS TO DISRUPT ALONG THE SUPERANNUATION VALUE CHAIN Market leading businesses,
INVESTOR PRESENTATION
 HEALTHCARE LIMITED (ASX: ZNT) INVESTOR PRESENTATION NEXTT HOME CARE TRANSACTION 3 JULY 2017 Important Notice and Disclaimer The information contained in this presentation has been prepared by Zenitas Healthcare
Boom Logistics Limited ASX:BOL
 Brenden Mitchell Managing Director and Chief Executive Officer Tim Rogers Chief Financial Officer Tony Spassopoulos Chief Operating Officer Boom Logistics Limited ASX:BOL August 2018 Disclaimer This presentation
PINEWOOD GROUP PRESENTATION OF FY 2017/18 RESULTS
 PINEWOOD GROUP PRESENTATION OF FY 2017/18 RESULTS Important notice This presentation has been prepared by Pinewood Finco plc (the Issuer) and Pinewood Group Limited (the Company and, collectively with
For personal use only
 INGENIA COMMUNITIES GROUP 2018 Annual General Meeting 13 NOVEMBER 2018 Meeting outline 2 Chairman s welcome NON-EXECUTIVE DIRECTORS CHAIRMAN Jim Hazel DEPUTY CHAIRMAN Rob Morrison DIRECTOR Amanda Heyworth
2017 AGM Presentation Amendment
 ASX Announcement 2017 AGM Presentation Amendment MELBOURNE, Australia, 8 November 2017 Aconex Limited (ASX: ACX), provider of the #1 global platform connecting teams on construction and engineering projects,
For personal use only
 Mantra Group H1FY2015 Results Presentation 26 February 2015 Important notice and disclaimer Important notice and disclaimer This document is a presentation of general background information about the activities
For personal use only
 ABN: 78 009 074 588 ASX Announcement Zenitas Healthcare Limited (ASX: ZNT) 31 May 2018 INVESTOR PRESENTATION WILSONS RAPID INSIGHTS CONFERENCE Zenitas Healthcare Limited (ASX:ZNT) ( Zenitas or the Company
For personal use only
 Preliminary Final Report Appendix 4E Results for announcement to the market Pulse Health Limited (ACN 104 113 760) This Preliminary Final Report is provided to the Australian Securities Exchange (ASX)
CY2017 RESULTS PRESENTATION 19 FEBRUARY 2018
 CY2017 RESULTS PRESENTATION 19 FEBRUARY 2018 HIGHLIGHTS REVENUE GROWING FASTER THAN MARKET WITH MARGIN EXPANSION REVENUE UNDERLYING 1 NPATA 2 13.1% 13.1% 22.5% 22.5% Revenue $380.3m 13.1% NPAT 2 $33.1m