Half Year FY 2015 Results Presentation FEBRUARY 2015
|
|
|
- Juliet Boone
- 5 years ago
- Views:
Transcription

1 Half Year FY 2015 Results Presentation FEBRUARY /02/2015 v1.3

2 HALF YEAR FY 2015 FINANCIAL RESULTS Revenue of $13.5m, up 65% over the prior corresponding period. EBITDA of $1.6m, up 282% over the prior period. Net profit after tax of $0.84m compared to $0.07m in the prior period. Fully franked interim dividend declared of 0.6 cents per share, up 20% on prior period. The company remains on track to deliver on its previous guidance of $3.5m-$4m EBITDA for FY 2015, which will represent strong growth over the previous financial year. For personal use only Record Half Year for Paragon Care 2 12
3 HALF YEAR FY 2015 FINANCIAL RESULTS Key Financial Data Revenue Reported Profit & Loss $13.5m $m unless stated HY141 HY151 1 Total Revenue % $9.2m $8.2m Other Income Total EBITDA % FY12 1H 2013 FY13 1H 2014 FY141 1H FY Proforma D&A (0.1) (0.2) 29% EBIT % EBITDA Interest (0.2) (0.3) 46% $1.6m PBT % Tax (0.01) (0.3) $1.0m NPAT Reported % $0.4m EPS (cents) % FY12 FY152 1H 2013 FY13 1H 2014 FY141 1H Proforma
m in the prior corresponding period.")
4 HALF YEAR FY 2015 FINANCIAL RESULTS Balance Sheet and Cash Flow The current banking facilities has provided Paragon Care with a significant opportunity to develop and grow its business both organically and via further acquisitions. First half FY 2015 operating cashflow of positive $2.1m compared to an operating cash outflow of $(0.6)m in the prior corresponding period. A strong focus on working capital management, in particular better matching of supplier payments with customer collections on an individual contract basis. Balance Sheet HY14 $m HY15 $m Cash Receivables Inventories Other Total Current Assets PP&E Intangibles/Other Total Non-Current Total Assets Payables Borrowings Provisions/Other Total Current Liabilities Borrowings/Other Total Non-Current Total Liabilities Net Assets Cash Flow HY14 $m HY15 $m Operating Activities (0.6) 2.1 Investing Activities (0.006) (6.45) Financing Activities Cash at Beginning of Period Cash at End of Period Net Increase/(Decrease)

5 FY 2015 GUIDANCE $m FY14 (Actual) FY15 (Forecast) 1H-FY15 (Actual) 2H-FY15 (Forecast) Revenue $19.4m $30m - $33m $13.5m $16.5m m EBITDA $1.8m $3.5m - $4m $1.6m $1.9m - 2.4m The first six months of trading have tracked well and in line with company expectations A number of key revenue opportunities have been secured for delivery for the second half of FY15 Scanmedics has had an immediate impact to the Group with strategies currently being implemented to leverage the product platform Paragon offers the sector Final stages of integrating all businesses on our SAP Business-One platform The company continues to review and assess complimentary acquisition opportunities to further enhance the product offering to its customers and deliver on its strategic plan

6 FUTURE STRATEGY Deliver organic growth as each acquisition is integrated into the platform Maximise the opportunity available through industry consolidation Achieve a critical mass of $100m in revenue Maintain conservative balance sheet metrics whereby net debt to EBITDA remains less than 2x Continue to develop and grow company manufactured products Capitalise on the extensive pipeline of greenfield and brownfield developments across the Health and Aged Care sector over the next decade and beyond 6 12
7 EXECUTIVE SUMMARY Our Offer Premium provider of durable medical equipment to the acute, aged care and primary care market Recent expansion into consumables, ultrasound, newborn care, temperature management and aesthetics. Paragon Care Shares on Issue 67.4m Experienced Board of Directors Shares % Shane Tanner (Non-Exec Chairman) 0.50m 0.70% Mark Simari (Managing Director) 1.65m 2.40% Brett Cheong (Executive Director) 2.63m 3.90% Michael Newton (Non-Exec Director) 0.20m 0.30% Total 4.95m 7.36% Share 24 Feb c 12 month Range c Market Cap $31.68m Unique Offerings PGC has acquired and integrated 8 businesses into 1 platform from June 2009 to November 2014 Has a broad suite of premium products forming a one stop shop for clients Only non-global provider of a full suite of medical equipment, products, consumables and devices Net Debt EV $5.7m $37.38m Strong Demand Dynamics Underlying business is driven by increasing demand in the acute and aged care sector Market size is estimated at ~$600m pa for capital equipment and in excess of $10b for consumables and medical products Ageing population Investment by governments and private providers 7 12
 For personal use only SHARE PRICE & KEY EVENTS Positioned for Growth Key Events $3m Capital raising to reduce bank")
 0.15 1,500 0.1 1,000 0.")
8 0.5 5, ,500 4, ,500 Share Price (Cents) For personal use only SHARE PRICE & KEY EVENTS Positioned for Growth Key Events $3m Capital raising to reduce bank debt $6.7m Capital raising to fund Acquisition Acquisition Acquisition Volume Close Acquisitions Jan 2009 Jun $350,000 Debt for Equity Swap 3,000 2,500 2,000 Traded Volumne ('000) , , Jun 2013 Jul 2013 Aug 2013 Sep 2013 Oct 2013 Nov 2013 Dec 2013 Jan 2014 Feb 2014 Mar 2014 Apr 2014 May 2014 Jun 2014 Jul 2014 Aug 2014 Sep 2014 Oct 2014 Nov 2014 Dec 2014 Jan
9 BUSINESS MODEL 9 12


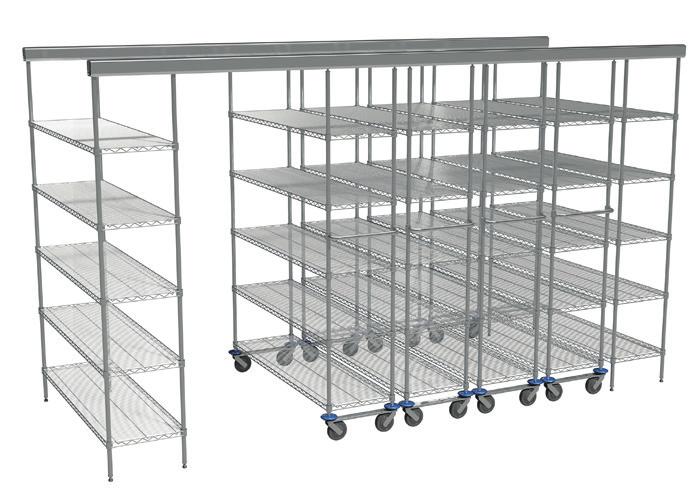


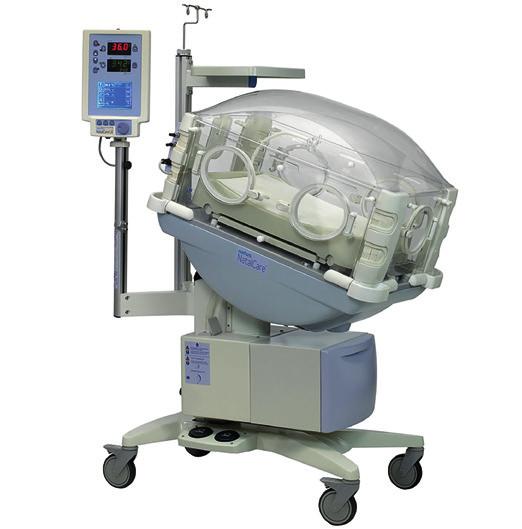
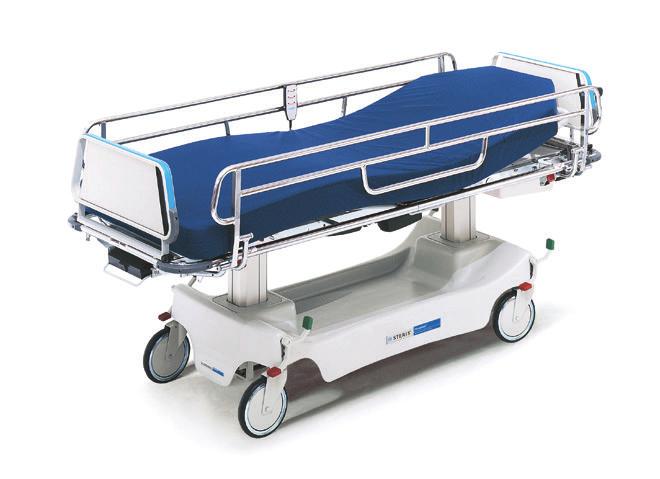
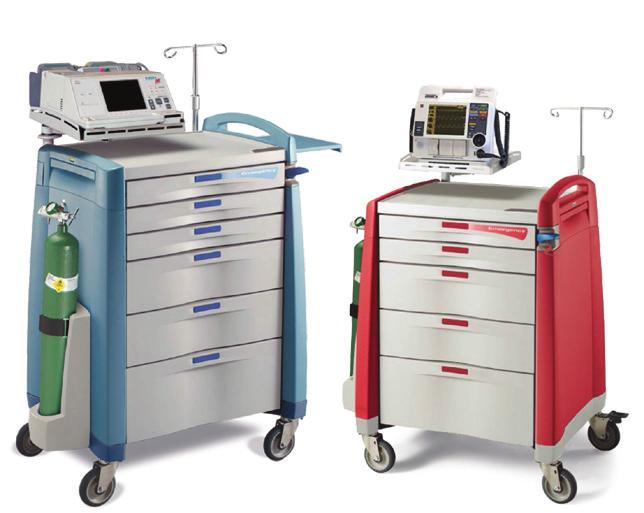
10 PRODUCT OFFERING For personal use only Product range only matched by global players Paragon Care s Suite of Products 10 12

11 IN SUMMARY Paragon Care has: Exposure to high growth health and aged care markets Large distribution platform in place which provides gateway to the health and aged care sector Diverse product portfolio offers a comprehensive full service offering Highly fragmented industry with consolidation opportunities Long standing relationships with suppliers and customers Growing earnings and dividend profile Well positioned to fund short term growth opportunities 11 12

12 Thank you for your time Disclaimer Some of the statements in this presentation constitute forward-looking statements that do not directly or exclusively relate to historical facts. These forward-looking statements reflect Paragon Care Limited s current intentions, plans, expectations, assumptions and beliefs about future events and are subject to risks, uncertainties and other factors, many of which are outside Paragon Care Limited s control. Important factors that could cause actual results to differ materially from the expectations expressed or implied in the forward-looking statements include known and unknown risks. Because actual results could differ materially from Paragon Care Limited s current intentions, plans, expectations, assumptions and beliefs about the future, you are urged to view all forward-looking statements contained in this presentation with caution. This management presentation may not be copied or otherwise reproduced
Appendix 4D PARAGON CARE LIMITED. Reporting Period: Financial Half Year ended 31 Dec 2014
 Appendix 4D Name of Entity: PARAGON CARE LIMITED Reporting Period: Financial Half Year ended 31 Dec 2014 Previous corresponding Period: Financial Half Year ended 31 Dec 2013 Results for Announcement to
1H17 Results Presentation 9 February ASX ticker: PGC
 1H17 Results Presentation 9 February 2017 ASX ticker: PGC Highlights Record revenue and earnings growth with positive outlook for full year FY17 Revenue (1H16: $38.4m) $55.0m 43% Gross profit (1H16: $14.8m)
Financial & Business Highlights For the Year Ended June 30, 2017
 Financial & Business Highlights For the Year Ended June, 17 17 16 15 14 13 12 Profit and Loss Account Operating Revenue 858 590 648 415 172 174 Investment gains net 5 162 909 825 322 516 Other 262 146
Spheria Australian Smaller Companies Fund
 29-Jun-18 $ 2.7686 $ 2.7603 $ 2.7520 28-Jun-18 $ 2.7764 $ 2.7681 $ 2.7598 27-Jun-18 $ 2.7804 $ 2.7721 $ 2.7638 26-Jun-18 $ 2.7857 $ 2.7774 $ 2.7690 25-Jun-18 $ 2.7931 $ 2.7848 $ 2.7764 22-Jun-18 $ 2.7771
XML Publisher Balance Sheet Vision Operations (USA) Feb-02
 Feb-02") Page:1 Apr-01 May-01 Jun-01 Jul-01 ASSETS Current Assets Cash and Short Term Investments 15,862,304 51,998,607 9,198,226 Accounts Receivable - Net of Allowance 2,560,786
Page:1 Apr-01 May-01 Jun-01 Jul-01 ASSETS Current Assets Cash and Short Term Investments 15,862,304 51,998,607 9,198,226 Accounts Receivable - Net of Allowance 2,560,786
Appendix 3Y. Change of Director s Interest Notice
 Appendix 3Y Rule 3.19A.2 Information or documents not available now must be given to ASX as soon as available. Information and documents given to ASX become ASX s property and may be made public. Introduced
Financial Data Report CIEL LTD (THE GROUP) for the period ending 31.Dec.2017
 for the period ending 31.Dec.2017") Financial Data Report CIEL LTD (THE GROUP) for the period ending 31.Dec.2017 Equity Statistics Particulars Units 29-Dec-17 Current Market Price MUR 7.14 52 week H/L* MUR 7.94 / 6.26 Market Capitalisation
Financial Data Report CIEL LTD (THE GROUP) for the period ending 31.Dec.2017 Equity Statistics Particulars Units 29-Dec-17 Current Market Price MUR 7.14 52 week H/L* MUR 7.94 / 6.26 Market Capitalisation
Financial Data Report LOTTOTECH LIMITED. for the period ending 30.Jun.2017
 Financial Data Report LOTTOTECH LIMITED for the period ending 30.Jun.2017 Equity Statistics Particulars Units 31-Jul-17 Current Market Price MUR 5.90 52 week H/L* MUR 6.50 / 4.02 Market Capitalisation
Financial Data Report LOTTOTECH LIMITED. for the period ending 30.Jun.2018
 Financial Data Report LOTTOTECH LIMITED for the period ending 30.Jun.2018 Equity Statistics Particulars Units 29-Jun-18 Current Market Price MUR 9.72 52 week H/L* MUR 9.88 / 5.66 Market Capitalisation
QUESTION 2. QUESTION 3 Which one of the following is most indicative of a flexible short-term financial policy?
 QUESTION 1 Compute the cash cycle based on the following information: Average Collection Period = 47 Accounts Payable Period = 40 Average Age of Inventory = 55 QUESTION 2 Jan 41,700 July 39,182 Feb 18,921
Financial Data Report SUN LIMITED (THE GROUP) for the period ending 31.Mar.2017
 for the period ending 31.Mar.2017") Financial Data Report SUN LIMITED (THE GROUP) for the period ending 31.Mar.2017 Equity Statistics Particulars Units 31-Mar-17 Current Market Price MUR 40.00 52 week H/L* MUR 40.00 / 32.80 Market Capitalisation
Financial Data Report SUN LIMITED (THE GROUP) for the period ending 31.Mar.2017 Equity Statistics Particulars Units 31-Mar-17 Current Market Price MUR 40.00 52 week H/L* MUR 40.00 / 32.80 Market Capitalisation
Financial Data Report LOTTOTECH LIMITED. for the period ending 31.Dec.2017
 Financial Data Report LOTTOTECH LIMITED for the period ending 31.Dec.2017 Equity Statistics Particulars Units 29-Dec-17 Current Market Price MUR 7.30 52 week H/L* MUR 9.12 / 5.28 Market Capitalisation
Big Walnut Local School District
 Big Walnut Local School District Monthly Financial Report for the month ended September 30, 2013 Prepared By: Felicia Drummey Treasurer BIG WALNUT LOCAL SCHOOL DISTRICT SUMMARY OF YEAR TO DATE FINANCIAL
DATATEC GROUP UNAUDITED INTERIM RESULTS FOR THE 6 MONTHS ENDED 31 AUGUST 2016
 Technology Distribution Integration & Managed Services Consulting & Research UNAUDITED INTERIM RESULTS FOR THE 6 MONTHS ENDED 31 AUGUST 2016 AGENDA Results summary, market conditions & operational strategy
Financial Data Report CIEL LTD (THE GROUP) for the period ending 31.Dec.2016
 for the period ending 31.Dec.2016") Financial Data Report CIEL LTD (THE GROUP) for the period ending 31.Dec.2016 Equity Statistics Particulars Units 30-Dec-16 Current Market Price MUR 6.30 52 week H/L* MUR 6.60 / 5.86 Market Capitalisation
Financial Data Report CIEL LTD (THE GROUP) for the period ending 31.Dec.2016 Equity Statistics Particulars Units 30-Dec-16 Current Market Price MUR 6.30 52 week H/L* MUR 6.60 / 5.86 Market Capitalisation
Financial Data Report Cim Financial Services Limited (THE GROUP) for the period ending 31.Dec.2017
 for the period ending 31.Dec.2017") Financial Data Report Cim Financial Services Limited (THE GROUP) for the period ending 31.Dec.2017 Equity Statistics Particulars Units 29-Dec-17 Current Market Price MUR 10.05 52 week H/L* MUR 10.50 /
Financial Data Report Cim Financial Services Limited (THE GROUP) for the period ending 31.Dec.2017 Equity Statistics Particulars Units 29-Dec-17 Current Market Price MUR 10.05 52 week H/L* MUR 10.50 /
FY16 Results Presentation
 FY16 Results Presentation 2 August 2016 Thomas Beregi, CEO Michael Eadie, CFO Competitive leadership in the credit impaired consumer segment FY16 Results Presentation 2 delivers 20% growth in 2016 FY16
Financial Data Report ROGERS AND COMPANY LIMITED (THE GROUP) for the period ending 31.Dec.2017
 for the period ending 31.Dec.2017") Financial Data Report ROGERS AND COMPANY LIMITED (THE GROUP) for the period ending 31.Dec.2017 Equity Statistics Particulars Units 29-Dec-17 Current Market Price MUR 31.30 52 week H/L* MUR 33.00 / 27.00
Financial Data Report ROGERS AND COMPANY LIMITED (THE GROUP) for the period ending 31.Dec.2017 Equity Statistics Particulars Units 29-Dec-17 Current Market Price MUR 31.30 52 week H/L* MUR 33.00 / 27.00
Financial Data Report IBL Limited (THE GROUP) for the period ending 31.Mar.2017
 for the period ending 31.Mar.2017") Financial Data Report IBL Limited (THE GROUP) for the period ending 31.Mar.2017 Equity Statistics Particulars Units 31-Mar-17 Current Market Price MUR 39.65 52 week H/L* MUR 125.00 / 27.20 Market Capitalisation
Financial Data Report IBL Limited (THE GROUP) for the period ending 31.Mar.2017 Equity Statistics Particulars Units 31-Mar-17 Current Market Price MUR 39.65 52 week H/L* MUR 125.00 / 27.20 Market Capitalisation
[Insert Subheading] Click to edit Master text styles. Shop Direct Limited. Q1 FY18 Results. Three months ended 30 September 2017.
![[Insert Subheading] Click to edit Master text styles. Shop Direct Limited. Q1 FY18 Results. Three months ended 30 September 2017.](/thumbs/75/71763350.jpg "[Insert Subheading] Click to edit Master text styles. Shop Direct Limited. Q1 FY18 Results. Three months ended 30 September 2017.") [Insert Subheading] Click to edit Master text styles Shop Direct Limited Q1 FY18 Results Three months ended 30 September 2017 7 December 2017 1 Disclaimer This presentation (the Presentation ) has been
[Insert Subheading] Click to edit Master text styles Shop Direct Limited Q1 FY18 Results Three months ended 30 September 2017 7 December 2017 1 Disclaimer This presentation (the Presentation ) has been
For personal use only
 (ASX: CGR) FY 16 Investor Presentation Daniel Riley CEO August 2016 Executive Summary FY 16 Highlights Finance Division EBITDA up 440% to $5.4m Loan Book up 325% to $69.9m Y/E 30 Jun ($m) FY 15 A FY 16
Financial Data Report CAUDAN DEVELOPMENT LIMITED (THE GROUP) for the period ending 31.Mar.2016
 for the period ending 31.Mar.2016") Financial Data Report (THE GROUP) for the period ending 31.Mar.2016 INVESTMENTS Equity Statistics Particulars Units 31-Mar-16 Current Market Price MUR 1.22 52 week H/L* MUR 1.40 / 1.17 Market Capitalisation
Financial Data Report (THE GROUP) for the period ending 31.Mar.2016 INVESTMENTS Equity Statistics Particulars Units 31-Mar-16 Current Market Price MUR 1.22 52 week H/L* MUR 1.40 / 1.17 Market Capitalisation
Inabox Group Limited (ASX:IAB)
") Inabox Group Limited (ASX:IAB) AGM Presentation November 2016 A leading hosted IT and communications solution provider to Corporates, SME s and consumer brands across Australia. We invest in our people,
Inabox Group Limited (ASX:IAB) AGM Presentation November 2016 A leading hosted IT and communications solution provider to Corporates, SME s and consumer brands across Australia. We invest in our people,
TERMS OF REFERENCE FOR THE INVESTMENT COMMITTEE
 I. PURPOSE The purpose of the Investment Committee (the Committee ) is to recommend to the Board the investment policy, including the asset mix policy and the appropriate benchmark for both ICBC and any
Financial Data Report LUX ISLAND RESORTS LIMITED (THE GROUP) for the period ending 30.Jun.2015
 for the period ending 30.Jun.2015") Financial Data Report LUX ISLAND RESORTS LIMITED (THE GROUP) for the period ending 30.Jun.2015 Equity Statistics Particulars Units 15-Sep-15 Current Market Price MUR 62.50 52 week H/L* MUR 63.50 / 51.00
Financial Data Report LUX ISLAND RESORTS LIMITED (THE GROUP) for the period ending 30.Jun.2015 Equity Statistics Particulars Units 15-Sep-15 Current Market Price MUR 62.50 52 week H/L* MUR 63.50 / 51.00
Klöckner & Co SE. Annual General Meeting Düsseldorf, May 16, 2018 Gisbert Rühl CEO
 Klöckner & Co SE Annual General Meeting 2018 Düsseldorf, May 16, 2018 Gisbert Rühl CEO 1 Disclaimer This presentation contains forward-looking statements which reflect the current views of the management
Financial Data Report ROGERS AND COMPANY LIMITED (THE GROUP) for the period ending 31.Dec.2015
 for the period ending 31.Dec.2015") Financial Data Report (THE GROUP) for the period ending 31.Dec.2015 INVESTMENT Equity Statistics Particulars Units 31-Mar-16 Current Market Price MUR 27.75 52 week H/L* MUR 32.50 / 26.90 Market Capitalisation
Financial Data Report (THE GROUP) for the period ending 31.Dec.2015 INVESTMENT Equity Statistics Particulars Units 31-Mar-16 Current Market Price MUR 27.75 52 week H/L* MUR 32.50 / 26.90 Market Capitalisation
For personal use only
 Affinity Education Group (ASX:AFJ) Morgans Conference 10 October 2014 Disclaimer This presentation contains general information in summary form which is current as at 10 October 2014. It presents financial
Intelsat JPM HY Conference February 27, Launch of Intelsat 37e September 29, 2017
 1 Intelsat JPM HY Conference February 27, 2018 Launch of Intelsat 37e September 29, 2017 2 Intelsat Full Year 2017: In-line Performance $2,500 2016/2017 Revenue and AEBITDA (in millions) $2,188 $2,149
Financial Industry Solutions. Second Quarter Financial Results AUGUST 9, 2018
 Financial Industry Solutions Second Quarter Financial Results AUGUST 9, Disclaimer Certain information in this presentation is forward-looking and related to anticipated financial performance, events and
The Property Franchise Group. Half Year Results September 2016
 The Property Franchise Group Half Year Results September 2016 Agenda 2 Overview Ian Wilson, Chief Executive Officer Financial performance David Raggett, Chief Financial Officer Operational performance
Fourth Quarter 2016 Performance Summary
 Fourth Quarter 2016 Performance Summary Operational and Financial Highlights - 2016 Net profit rises by +2.5% to Euros 545.5 million Recurring sales (excluding Raw Materials and Others) rise by +4.5% (+4.6%
Paragon Care Limited. Well equipped August Recommendation: BUY. Realisation of critical mass can foster organic growth opportunities
 This is an extract of our full report. Please refer to our full report before making any investment decisions. Paragon Care Limited Well equipped Recommendation: BUY Realisation of critical mass can foster
Affinity Education Group. Half Year Results
 Affinity Education Group Half Year Results 29 August 2014 Disclaimer This presentation contains general information in summary form which is current as at 29 August 2014. It presents financial information
TD Securities 2011 Calgary Unconventional Energy Conference July 7, Dawn Farrell Chief Operating Officer
 TD Securities 2011 Calgary Unconventional Energy Conference July 7, 2011 Dawn Farrell Chief Operating Officer 1 Forward looking statements This presentation may contain forward looking statements, including
2018 HALF YEAR RESULTS
 2018 HALF YEAR RESULTS INVESTOR PRESENTATION 27 AUGUST 2018 DISCLAIMER The material in this presentation has been prepared by G8 Education Limited (G8) and is general background information about G8 s
PRESS RELEASE. Securities issued by Hungarian residents and breakdown by holding sectors. January 2019
 7 March 2019 PRESS RELEASE Securities issued by Hungarian residents and breakdown by holding sectors January 2019 According to securities statistics, the amount outstanding of equity securities and debt
16-Jan Jul Oct Apr Sep Feb Dec Aug Nov May-09
 16-Mar-09 16-Apr-09 16-May-09 16-Jun-09 16-Jul-09 16-Aug-09 16-Sep-09 16-Oct-09 16-Nov-09 16-Dec-09 16-Jan-10 16-Feb-10 200 180 160 140 120 100 80 60 40 20 0 PJ 2014 2015 2016 2017 2018 2019 BG 90 60
2011 Interim Results. Keith Gordon, Managing Director & Chief Executive Officer Stephen Gobby, Chief Financial Officer
 2011 Interim Results Keith Gordon, Managing Director & Chief Executive Officer Stephen Gobby, Chief Financial Officer Emeco 2011 Interim Results Overview Financials Strategy & Outlook Questions Appendices
Review of Registered Charites Compliance Rates with Annual Reporting Requirements 2016
 Review of Registered Charites Compliance Rates with Annual Reporting Requirements 2016 October 2017 The Charities Regulator, in accordance with the provisions of section 14 of the Charities Act 2009, carried
Constructing a Cash Flow Forecast
 Constructing a Cash Flow Forecast Method and Worked Example A cash flow forecast shows the estimates of the timing and amounts of cash inflows and outflows over a period of time. The sections of a cash
Goldman Sachs Ninth Annual Mid-Cap Conference
 Presented by Simon Owen, CEO 17 APRIL 2018 INGENIA COMMUNITIES GROUP Goldman Sachs Ninth Annual Mid-Cap Conference Contents Business overview 3 1H18 results highlights 7 Capital management 8 Future growth
PHOENIX ENERGY MARKETING CONSULTANTS INC. HISTORICAL NATURAL GAS & CRUDE OIL PRICES UPDATED TO July, 2018
 Jan-01 $12.9112 $10.4754 $9.7870 $1.5032 $29.2595 $275.39 $43.78 $159.32 $25.33 Feb-01 $10.4670 $7.8378 $6.9397 $1.5218 $29.6447 $279.78 $44.48 $165.68 $26.34 Mar-01 $7.6303 $7.3271 $5.0903 $1.5585 $27.2714
FY2015 Annual Results August Brett McKeon - CEO David Bailey - CFO
 FY2015 Annual Results August 27 2015 Brett McKeon - CEO David Bailey - CFO FY2015 Financial Results Highlights Delivery on FY15 Prospectus forecasts Pro forma NPAT $19.3 million up 8.4% against IPO forecast
Executive Summary. July 17, 2015
 Executive Summary July 17, 2015 The Revenue Estimating Conference adopted interest rates for use in the state budgeting process. The adopted interest rates take into consideration current benchmark rates
FY 2018 results presentation
 FY 2018 results presentation EMERGING FINANCIAL SERVICES COMPANY STRONGLY LEVERAGED TO SUPERANNUATION SECTOR, DELIVERS RECORD GROWTH OneVue Holdings Limited (OVH) 27 August 2018 1 HIGHLIGHTS Market leading
Paragon Care (PGC) Big Boxes, Big Opportunity. Capitalising on the burgeoning healthcare sector. Price leadership through quality
 Big Boxes, Big Opportunity. Capitalising on the burgeoning healthcare sector. Price leadership through quality") 26 September 2014 Analyst John Hester 612 8224 2871 Authorisation TS Lim 612 8224 2810 Paragon Care (PGC) Big Boxes, Big Opportunity Recommendation Buy (Initiation) Price $0.33 Target (12 months) $0.38
26 September 2014 Analyst John Hester 612 8224 2871 Authorisation TS Lim 612 8224 2810 Paragon Care (PGC) Big Boxes, Big Opportunity Recommendation Buy (Initiation) Price $0.33 Target (12 months) $0.38
Responsible investment in growth
 Responsible investment in growth Issued: 1 March 2016 Legal notice This presentation has been prepared to inform investors and prospective investors in the secondary markets about the Group and does not
HIPIOWA - IOWA COMPREHENSIVE HEALTH ASSOCIATION Unaudited Balance Sheet As of July 31
 Unaudited Balance Sheet As of July 31 Total Enrollment: 407 Assets: Cash $ 9,541,661 $ 1,237,950 Invested Cash 781,689 8,630,624 Premiums Receivable 16,445 299,134 Prepaid 32,930 34,403 Assessments Receivable
LOAN MARKET DATA AND ANALYTICS BY THOMSON REUTERS LPC
 LOAN MARKET DATA AND ANALYTICS BY THOMSON REUTERS LPC GLOBAL LOAN MARKET DATA AND ANALYTICS BY THOMSON REUTERS LPC Secondary Market Bid Levels: Europe Slide 2 European CLO New Issue Volume Monthly Slide
HIPIOWA - IOWA COMPREHENSIVE HEALTH ASSOCIATION Unaudited Balance Sheet As of January 31
 Unaudited Balance Sheet As of January 31 Total Enrollment: 371 Assets: Cash $ 1,408,868 $ 1,375,117 Invested Cash 4,664,286 4,136,167 Premiums Receivable 94,152 91,261 Prepaid 32,270 33,421 Assessments
DMX Capital Partners Limited August 2017 Shareholder Update
 DMX Capital Partners August 2017 Shareholder Update An investment company managed by: DMX Asset Management ACN 169 381 908 AFSL 459 120 Level 4, 92 Pitt Street, Sydney, NSW 2000 PO Box 916, Milsons Point,
PRESS RELEASE. Securities issued by Hungarian residents and breakdown by holding sectors. October 2018
 PRESS RELEASE 10 December 2018 Securities issued by Hungarian residents and breakdown by holding sectors October 2018 According to securities statistics, the amount outstanding of equity securities and
Financial Data Report CIEL LTD (THE GROUP) for the period ending 30.Jun.2015
 for the period ending 30.Jun.2015") Financial Data Report CIEL LTD (THE GROUP) for the period ending 30.Jun.2015 Equity Statistics Particulars Units 15-Sep-15 Current Market Price MUR 6.76 52 week H/L* MUR 7.80 / 6.70 Market Capitalisation
Financial Data Report CIEL LTD (THE GROUP) for the period ending 30.Jun.2015 Equity Statistics Particulars Units 15-Sep-15 Current Market Price MUR 6.76 52 week H/L* MUR 7.80 / 6.70 Market Capitalisation
Key IRS Interest Rates After PPA
 Key IRS Rates - After PPA - thru 2011 Page 1 of 10 Key IRS Interest Rates After PPA (updated upon release of figures in IRS Notice usually by the end of the first full business week of the month) Below
A S X S P O T L I G H T
 A S X S P O T L I G H T B L U E S K Y A L T E R N A T I V E I N V E S T M E N T S L I M I T E D M A Y 2 0 1 4 Private Equity Private Real Estate Hedge Funds Real Assets blueskyfunds.com.au Page 1 DISCLAIMER
Performance Report October 2018
 Structured Investments Indicative Report October 2018 This report illustrates the indicative performance of all Structured Investment Strategies from inception to 31 October 2018 Matured Investment Strategies
PRESS RELEASE. Securities issued by Hungarian residents and breakdown by holding sectors. October 2017
 11 December 2017 PRESS RELEASE Securities issued by Hungarian residents and breakdown by holding sectors October 2017 According to securities statistics, the amount outstanding of equity securities and
Big Walnut Local School District
 Big Walnut Local School District Monthly Financial Report for the month ended September 30, 2012 Prepared By: Felicia Drummey Treasurer BIG WALNUT LOCAL SCHOOL DISTRICT SUMMARY OF YEAR-TO-DATE FINANCIAL
Performance Highlights
 Performance Highlights Prepared for Sample Hotel Period Jun 2017 Created on 9th August 2017 Executive Summary OBSERVATIONS Comparing Jun 2017 with the same month last year Jun 2016. REVENUE Total Revenue
Trading Update. Building communities, building lives. ROSS TAYLOR Chief Executive Officer. BEVAN MCKENZIE Chief Financial Officer.
 Building communities, building lives. Trading Update ROSS TAYLOR Chief Executive Officer BEVAN MCKENZIE Chief Financial Officer 14 February 2018 Fletcher Building Trading Update Presentation Feb 2018 Agenda
Economic Activity Index ( GDB-EAI ) For the month of May 2013 G O V E R N M E N T D E V E L O P M E N T B A N K F O R P U E R T O R I C O
 For the month of May 2013 G O V E R N M E N T D E V E L O P M E N T B A N K F O R P U E R T O R I C O") Economic Activity Index ( GDB-EAI ) For the month of May 2013 General Commentary May 2013 GDB-EAI for the month of May registered a 3.4% year-over-year ( YOY ) reduction May 2013 EAI was 126.7, a 3.4%
Economic Activity Index ( GDB-EAI ) For the month of May 2013 General Commentary May 2013 GDB-EAI for the month of May registered a 3.4% year-over-year ( YOY ) reduction May 2013 EAI was 126.7, a 3.4%
Financial Data Report VIVO ENERGY MAURITIUS LIMITED. for the period ending 30.Sep.2015
 Financial Data Report for the period ending 30.Sep.2015 INDUSTRY Equity Statistics Particulars Units 15-Sep-15 Current Market Price MUR 116.50 52 week H/L* MUR 140.00 / 116.50 Market Capitalisation MUR
Availability, Reliability, Ease. 11 September 2018
 Availability, Reliability, Ease 11 September 2018 LEGAL NOTICE This presentation has been prepared to inform investors and prospective investors in the secondary markets about the Group and does not constitute
For personal use only
 2018 Annual General Meeting of Helloworld Travel Limited 15 November 2018 1 Disclaimer The information contained in these materials or discussed at the presentation is not intended to be an offer for subscription,
Firm valuation (2) Class 7 Financial Management,
 Class 7 Financial Management,") Firm valuation (2) Class 7 Financial Management, 15.414 Today Firm valuation x Free cashflows x Profitability, financial ratios, and terminal value Reading x Brealey and Myers, Chapter 12.4 12.6 x Wilson
Firm valuation (2) Class 7 Financial Management, 15.414 Today Firm valuation x Free cashflows x Profitability, financial ratios, and terminal value Reading x Brealey and Myers, Chapter 12.4 12.6 x Wilson
For personal use only
 G8 Education Year End Overview 2013 G8 Education Limited (ASX:GEM) 17 February 2014 Corporate Snapshot Capital Structure Directors & Senior Management Fully Paid Ordinary Shares (current) 301.7 million
For personal use only
 Market Office Announcement ASX Limited Date: 9 November 2018 THINK CHILDCARE LIMITED ( TNK ) ACQUIRES 5 CHILDCARE CENTRES AND REDUCES YEAR ON YEAR OCCUPANCY GAP TO 0.5% TNK has contracted to acquire five
RAJESH EXPORTS LIMITED GLOBAL PRESENCE IN GOLD AND GOLD PRODUCTS. Earnings Presentation - FY16
 RAJESH EXPORTS LIMITED GLOBAL PRESENCE IN GOLD AND GOLD PRODUCTS Earnings Presentation - FY16 HIGHLIGHT FOR THE QUARTER Posted record REVENUE, EBITDA and PAT for the year 2015-16. Consolidated position
WESTWOOD LUTHERAN CHURCH Summary Financial Statement YEAR TO DATE - February 28, Over(Under) Budget WECC Fund Actual Budget
 Budget WECC Fund Actual Budget") WESTWOOD LUTHERAN CHURCH Summary Financial Statement YEAR TO DATE - February 28, 2018 General Fund Actual A B C D E F WECC Fund Actual Revenue Revenue - Faith Giving 1 $ 213 $ 234 $ (22) - Tuition $ 226
WESTWOOD LUTHERAN CHURCH Summary Financial Statement YEAR TO DATE - February 28, 2018 General Fund Actual A B C D E F WECC Fund Actual Revenue Revenue - Faith Giving 1 $ 213 $ 234 $ (22) - Tuition $ 226
2009 FULL YEAR FINANCIAL RESULTS
 OZ MINERALS 2009 FULL YEAR FINANCIAL RESULTS TERRY BURGESS MANAGING DIRECTOR & CEO ANDREW COLES CHIEF FINANCIAL OFFICER 25 February 2010 WWW.OZMINERALS.COM OZ MINERALS NOVEMBER 2009 PAGE 1 IMPORTANT NOTICE
FY09 Consolidated Results
 FY09 Consolidated Results Flavio Cattaneo - Chief Executive Officer Fabio Todeschini - Chief Financial Officer MARCH 19 TH, 2010 Investor Relations 1 Agenda HIGHLIGHTS 3 FY09 RESULTS 5 CLOSING REMARKS
ANNOUNCEMENT OF PRELIMINARY RESULTS
 The leading high service distributor to engineers worldwide ANNOUNCEMENT OF PRELIMINARY RESULTS YEAR ENDED 31 MARCH 2009 29 May 2009 Agenda Overview and current trading Ian Mason Financial performance
7 March Senior Executive, Financial Market Infrastructure. Level 5, 100 Market Street SYDNEY NSW 2000 SYDNEY NSW 2000
 7 March 2016 Australian Securities and Investments Commission ASX Market Announcements Office Mr Oliver Harvey ASX Limited Senior Executive, Financial Market Infrastructure 20 Bridge Street Level 5, 100
OneVue Holdings Limited (OVH)
") OneVue Holdings Limited (OVH) Morgan Stanley Emerging Companies Conference Thursday 7 June 2018 A FINTECH COMPANY THAT PARTNERS TO DISRUPT ALONG THE SUPERANNUATION VALUE CHAIN Market leading businesses,
OneVue Holdings Limited (OVH) Morgan Stanley Emerging Companies Conference Thursday 7 June 2018 A FINTECH COMPANY THAT PARTNERS TO DISRUPT ALONG THE SUPERANNUATION VALUE CHAIN Market leading businesses,
For personal use only
 Full Year 2017 Results Presentation February 2018 A leading player in the global online classifieds industry FY2017 was another year of strong profitable growth for Mitula Revenue +20% A$33.6m Visits 807m
Looking to the medium term
 Looking to the medium term Issued: 4 September 2013 Legal notice This presentation has been prepared to inform investors and prospective investors in the secondary markets about the Group and does not
Half-Year 2016 Results Presentation
 Half-Year 2016 Results Presentation ASX Limited Elmer Funke Kupper Peter Hiom 11 February 2016 Disclaimer The material contained in this document is a presentation of general information about the ASX
Isle Of Wight half year business confidence report
 half year business confidence report half year report contents new company registrations closed companies (dissolved) net company growth uk company share director age director gender naming trends sic
CPA Australia Plan Your Own Enterprise Competition
 Financial Plan Your financial plan should include: 1. A list of Start-Up Costs and how these will be paid for (eg from savings, bank loan or family loan) 2. A Breakeven Analysis, which includes: a list
Division of Bond Finance Interest Rate Calculations. Revenue Estimating Conference Interest Rates Used for Appropriations, including PECO Bond Rates
 Division of Bond Finance Interest Rate Calculations Revenue Estimating Conference Interest Rates Used for Appropriations, including PECO Bond Rates November 16, 2018 Division of Bond Finance Calculation
For personal use only
 Investor Presentation 11 th August 2016 Half Year CY2016 Results Important Information and Disclaimer This presentation is for personal use only. It contains general information in summary form which is
Cost Estimation of a Manufacturing Company
 Cost Estimation of a Manufacturing Company Name: Business: Date: Economics of One Unit: Manufacturing Company (Only complete if you are making a product, such as a bracelet or beauty product) Economics
Key IRS Interest Rates After PPA
 Key IRS Interest After PPA (updated upon release of figures in IRS Notice usually by the end of the first full business week of the month) Below are Tables I, II, and III showing official interest rates
Algo Trading System RTM
 Year Return 2016 15,17% 2015 29,57% 2014 18,57% 2013 15,64% 2012 13,97% 2011 55,41% 2010 50,98% 2009 48,29% Algo Trading System RTM 89000 79000 69000 59000 49000 39000 29000 19000 9000 2-Jan-09 2-Jan-10
Amber Enterprises India Ltd
 3QFY2019 Result Update Consumer Durable February 16, 2019 Amber Enterprises India Ltd Performance Update (` cr) 3QFY19 3QFY18 % yoy 2QFY19 % qoq Revenue 388.8 338.4 14.9 226.3 71.8 EBITDA 22.1 24.1 (8.2)
OVERVIEW 1H17 RESULTS
 CLICK 1H 2017 TO EDIT RESULTS MASTER TITLE 6 MONTHS ENDED 31 STYLE DECEMBER 2016 OVERVIEW 2 FINANCIAL SUMMARY Group Underlying Reported 1H 2017 1H 2016 1H 2017 1H 2016 Revenue 808.7 794.3 808.7 814.1 EBIT
Investors and Analysts Presentation: 9M 2010 Financial Results
 Investors and Analysts Presentation: 9M 2010 Financial Results Moscow, 30 November 2010 Disclaimer This presentation contains "forward-looking statements" which include all statements other than statements
Consumer Price Index (Base year 2014) Consumer Price Index
 Consumer Price Index") Consumer Price Index December 2017 (Base year 2014) Consumer Price Index 1 Release Date: January 2018 Detailed by: Expenditure groups Household welfare levels Household type Regions Briefing This publication
Consumer Price Index December 2017 (Base year 2014) Consumer Price Index 1 Release Date: January 2018 Detailed by: Expenditure groups Household welfare levels Household type Regions Briefing This publication
TGC-1 9M 2016 IFRS Results. November 21, 2016 Saint Petersburg
 TGC-1 9M 2016 IFRS Results November 21, 2016 Saint Petersburg Disclaimer The information contained herein has been prepared using information available to Public Joint Stock Company Territorial generating
Results 2Q18. August 2, 2018
 Results August 2, 2018 Highlights Indicators Var. x 2Q17 Operating Income (R$ MM) 42.8 +92.7% Operating Margin 1.8% +0.8 p.p. Net operating revenues: R$2.4 billion (+9.0% vs. 2Q17) ASK (BN) 10.7 +2.2%
Consumer Price Index (Base year 2014) Consumer Price Index
 Consumer Price Index") Consumer Price Index December 2016 (Base year 2014) Consumer Price Index 1 Release Date: January 2017 Detailed by: Expenditure groups Household welfare levels Household type Regions Briefing This publication
Consumer Price Index December 2016 (Base year 2014) Consumer Price Index 1 Release Date: January 2017 Detailed by: Expenditure groups Household welfare levels Household type Regions Briefing This publication
Ingenia Communities Group
 INGENIA COMMUNITIES GROUP Morgan s Investor Queensland Conference Conference Ingenia Communities Group 23 October 2015 October 2015 Lakeside Lara, Lara, VIC OUR BUSINESS Ingenia is a leading owner, operator
Suncorp Metway Ltd. John Mulcahy, Chief Executive Officer. UBS Global Financial Services Conference. 12 May 2008
 Suncorp Metway Ltd John Mulcahy, Chief Executive Officer UBS Global Financial Services Conference 12 May 2008 Agenda Overview of Suncorp Key numbers Key challenges Summary Suncorp at a glance Group total
For personal use only
 APPENDIX 4E Cash Converters International Limited ABN: 39 069 141 546 Financial year ended 30 June 2015 RESULTS FOR ANNOUNCEMENT TO THE MARKET 30 June 2015 30 June 2014 Revenues from operations Up 13.0%
Financial Data Report SBM HOLDINGS LIMITED (THE GROUP) for the period ending 31.Dec.2016
 for the period ending 31.Dec.2016") Financial Data Report SBM HOLDINGS LIMITED (THE GROUP) for the period ending 31.Dec.2016 Equity Statistics Particulars Units 30-Dec-16 Current Market Price MUR 6.64 52 week H/L* MUR 7.00 /.63 Market Capitalisation
Financial Data Report SBM HOLDINGS LIMITED (THE GROUP) for the period ending 31.Dec.2016 Equity Statistics Particulars Units 30-Dec-16 Current Market Price MUR 6.64 52 week H/L* MUR 7.00 /.63 Market Capitalisation
OneVue Holdings Limited (OVH)
") OneVue Holdings Limited (OVH) FY 2017 results presentation 28 August 2017 Regulators, fund managers and investors are calling for greater transparency of platform costs and revenue drivers Platform differentiation
OneVue Holdings Limited (OVH) FY 2017 results presentation 28 August 2017 Regulators, fund managers and investors are calling for greater transparency of platform costs and revenue drivers Platform differentiation
Factor Leave Accruals. Accruing Vacation and Sick Leave
 Factor Leave Accruals Accruing Vacation and Sick Leave Factor Leave Accruals As part of the transition of non-exempt employees to biweekly pay, the UC Office of the President also requires standardization
Business Update. USPP Conference Miami. Luis Damasceno Group CFO Michael Williams Group Finance Director & Treasurer January 2019
 Business Update USPP Conference Miami Luis Damasceno Group CFO Michael Williams Group Finance Director & Treasurer 23-25 January 2019 www.alsglobal.com IMPORTANT NOTICE AND DISCLAIMER This presentation
Fiscal Year 2018 Project 1 Annual Budget
 Fiscal Year 2018 Project 1 Annual Budget Table of Contents Table Page Summary 3 Summary of Costs Table 1 4 Treasury Related Expenses Table 2 5 Summary of Full Time Equivalent Table 3 6 Positions Cost-to-Cash